1. Introduction
In activities involving human interactions, various valuable sounds exist that serve as the primary source for perceiving changes in the surrounding environment and as important channels for facilitating communication. The accurate and effective utilization of sound information can generate significant value for human society. Sound event detection (SED) is an essential form of sound information utilization that aims to detect specific event categories from complex sound signals and locate the temporal boundaries of each event [
1]. It is a crucial component in the field of auditory perception. SED detects ongoing events in the surrounding environment through sound, thereby enabling timely actions to improve people’s quality of life and safeguard their safety and property. It has been widely applied in various aspects of human life and production, such as healthcare monitoring [
2], smart homes [
3,
4], and audio surveillance [
5,
6]. These applications contribute to improving quality of life and enhancing security.
However, SED is susceptible to background noise interference, and there is often a possibility of multiple sound events occurring simultaneously, making it challenging to manually annotate the time boundaries for such tasks. As a result, the creation of suitable SED datasets and the design of high-performance detection systems have been receiving increasing attention from researchers.
To overcome the challenges faced by SED systems and improve the current state-of-the-art techniques, Queen Mary University of London initiated the Detection and Classification of Acoustic Scenes and Events (DCASE) challenge in 2013 [
7]. The DCASE challenge provides researchers with a platform for sharing datasets and evaluating their detection systems. It aims to facilitate the exchange of ideas, foster innovation, and address problems in the field, thereby greatly advancing the progress of SED research.
In this article, the DCASE 2019 Challenge Task 4 dataset is used as the development set [
8], and a perturbed residual neural network (P-ResNet) is designed based on ResNet34 [
9], which is then combined with a recurrent neural network (RNN) to form the backbone network of the SED system. The pre-trained parameters of ResNet34 on the ImageNet image classification database are used as the starting point for training P-ResNet. Within ResNet34, multiple frequency-domain sub-sampling, Dropout, and Drop Block [
10] structures are designed. The frequency-domain sub-sampling enables RNN to receive temporal sequences of audio. The Dropout and Drop Block structures are designed to add perturbation factors to semi-supervised training, thus improving the ability of the mean teacher model to handle a large amount of unbalanced and unlabeled data. To further improve the model’s performance, the window length of the median filter bank is calculated using the synthesized strong annotation information from the development set, and the output is smoothed using the median filter to make the results more accurate.
The rest of this paper is organized as follows:
Section 2 analyzes literature interviews in the SED domain.
Section 3 presents the architecture of the proposed SED system.
Section 4 explains the detection network training process.
Section 5 explains the database and presents the experimental results. Finally,
Section 6 concludes the paper.
2. Literature Review
Since 2010, deep learning has undergone development. In fields such as speech recognition and text processing, deep learning methods have proven to be more effective in handling data with complex structures and high nonlinearity compared to probabilistic statistical models [
11,
12]. This outcome has demonstrated the ability of deep learning to better address many complex problems and has sparked widespread interest among SED researchers [
13]. Convolutional neural networks (CNNs) have shown an excellent performance in SED tasks [
14]. They possess good translational invariance and can effectively learn local features from feature maps. CNNs exhibit robustness to frequency shifts caused by sound source movement, enabling them to detect both single and overlapping events. RNNs can capture the temporal relationships between audio signals, compensating for the temporal information deficiency in CNN [
15,
16]. Convolutional recurrent neural networks (CRNNs) combine the strengths of CNNs and RNNs to achieve impressive results in SED tasks [
17].
Currently, with the tremendous improvement in computing power and data resources, deep learning-based methods have become the mainstream approach to SED tasks. For instance, the multi-scale feature fusing networks (MFFNs) [
18] method replaces point sampling in dilated convolutions with region sampling; this mixed dilated convolution can better capture the neighboring information of audio and, combined with feature fusion, achieves the SED task. Zhao et al. [
19] utilize a CRNN as the detection network for SED systems and employ a differentiable soft median filter. They find that the systems automatically learn weights with varying smoothness through a linear selection layer to achieve adaptive smoothing. Kiyokawa et al. [
20] introduce a self-mask module based on residual networks to generate sound event candidate regions that constrain the temporal boundaries, thereby providing a new perspective for the SED task. In [
21], an asymmetric focal loss is used to control the focal factors of active and non-active frames separately, offering an effective method with which to address the issue of data imbalance in the SED task.
The Transformer-based architecture provides parallel computing capabilities and is more efficient in temporal modeling compared to traditional sequential models such as RNNs [
22]. In [
23], log-mel spectrogram information is extracted using a CNN and is stacked into feature vectors as inputs to the Transformer; the token vectors of the Transformer are used to predict weak labels, while the feature vectors are used to predict strong labels. Kim et al. [
24] adopt an architecture with Transformer encoders to combine the outputs of different-level encoders and obtain multi-scale features. Their experimental results demonstrate significant improvements in the recognition performance of the SED system.
Utilizing data beyond the labeled dataset can also be beneficial for the SED task. For example, pre-training the model with a large-scale image database can provide better initial parameters. Unlabeled audio data can also be used as training data for semi-supervised learning of the SED detection network, which improves the performance of the SED system. Currently, common semi-supervised learning methods for SED include mean teacher [
25], interpolation consistency training [
26], and co-training [
27].
In summary, in the field of SED, due to the complexity of polyphonic sound structures and varying event durations, designing specific loss functions or applying post-processing techniques to predicted probabilities is a way to improve system recognition rates. Although researchers have successfully applied CRNN models in SED with significant results, they have not ceased exploring other models. For example, techniques such as residual connections and layer normalization have shown greater efficiency in handling long-term dependencies and memory issues. In the future, we can expect to see more applications and improvements of models like Transformers and RNNs in the SED domain.
3. Sound Event Detection System
3.1. Pre-Processing
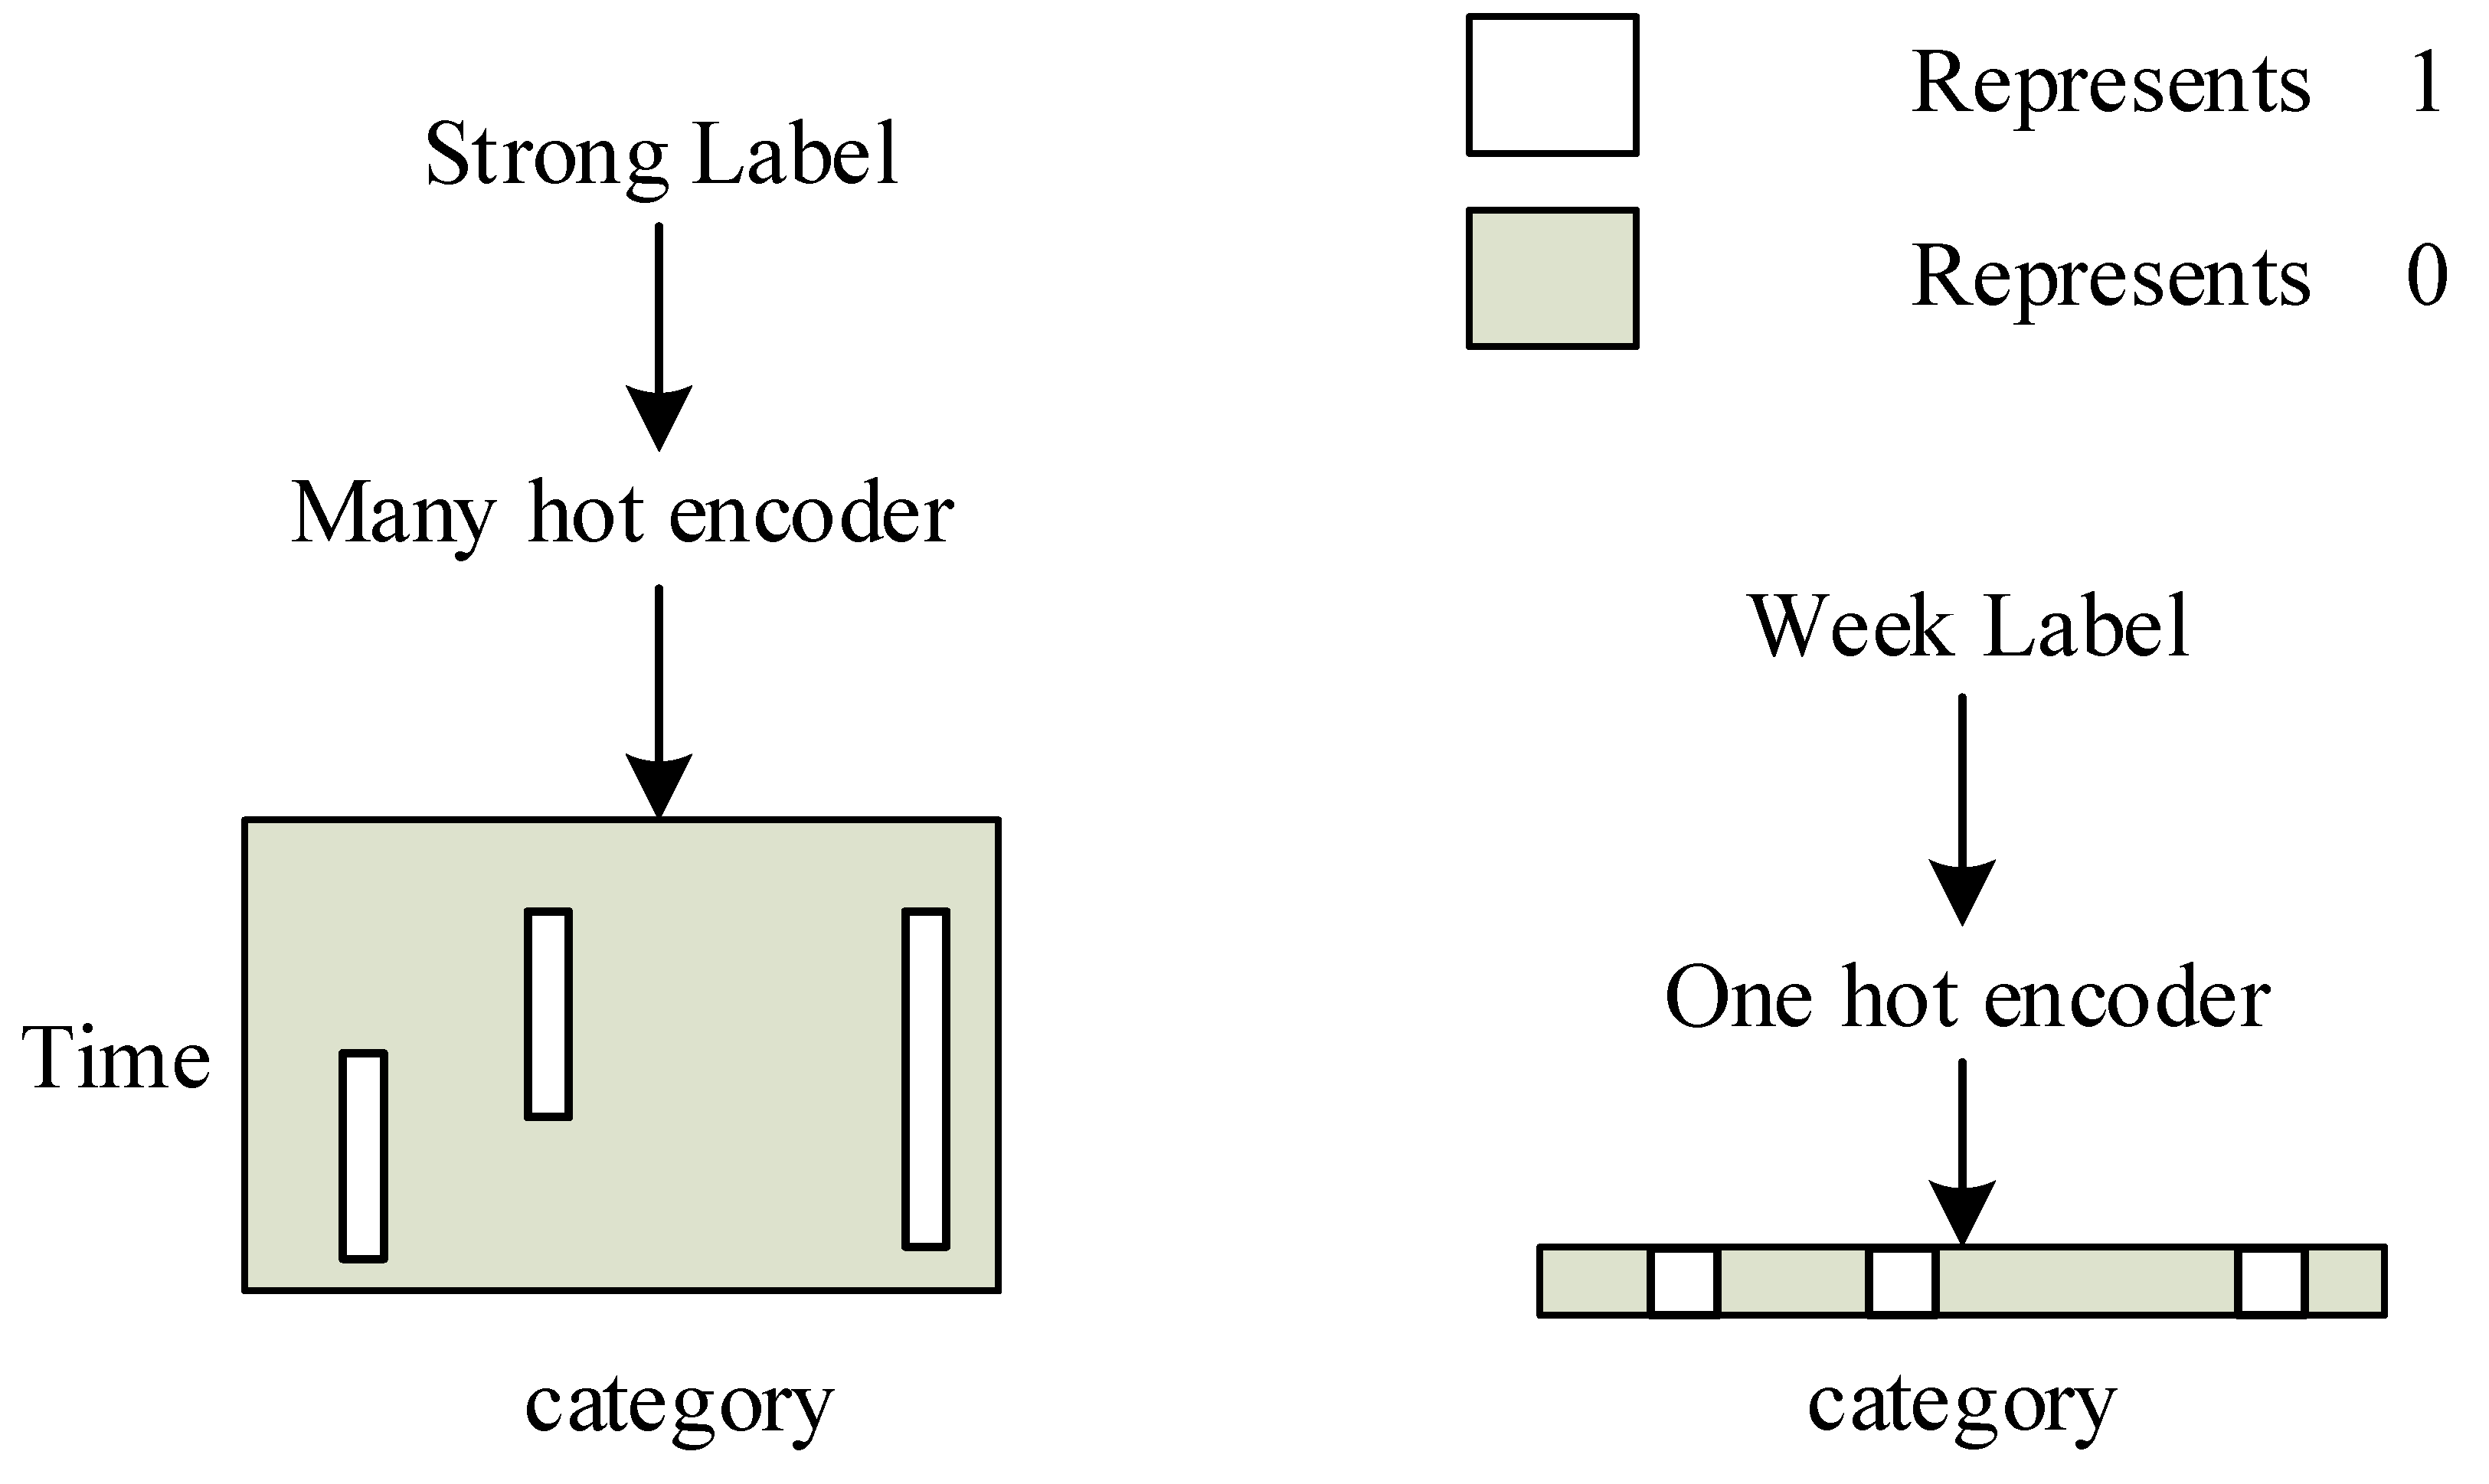
In the SED in the domestic environment task, the training set is divided into three parts. The strong label data contain both event category and occurrence time information, providing rich annotation information. The weak label data, on the other hand, only include event category information, providing coarse-grained category labels. The unlabeled data do not have category labels or timestamp information, thus requiring the utilization of semi-supervised learning or other techniques to make use of it.
During the training and testing phases, the information from strong and weak labels is encoded to represent the presence or absence of events (1 indicating existence, 0 indicating non-existence). The encoding principles for both types are illustrated in
Figure 1.
For strong labels, the encoding is based on the length of the time boundaries for each event and the correspondence between event categories and positions in a matrix, and the time encoding length is rounded up, with the vertical axis representing time and the horizontal axis representing categories. For weak labels, encoding is performed using one-hot encoding, resulting in a vector representation.
3.2. Perturbed Residual Recurrent Neural Network
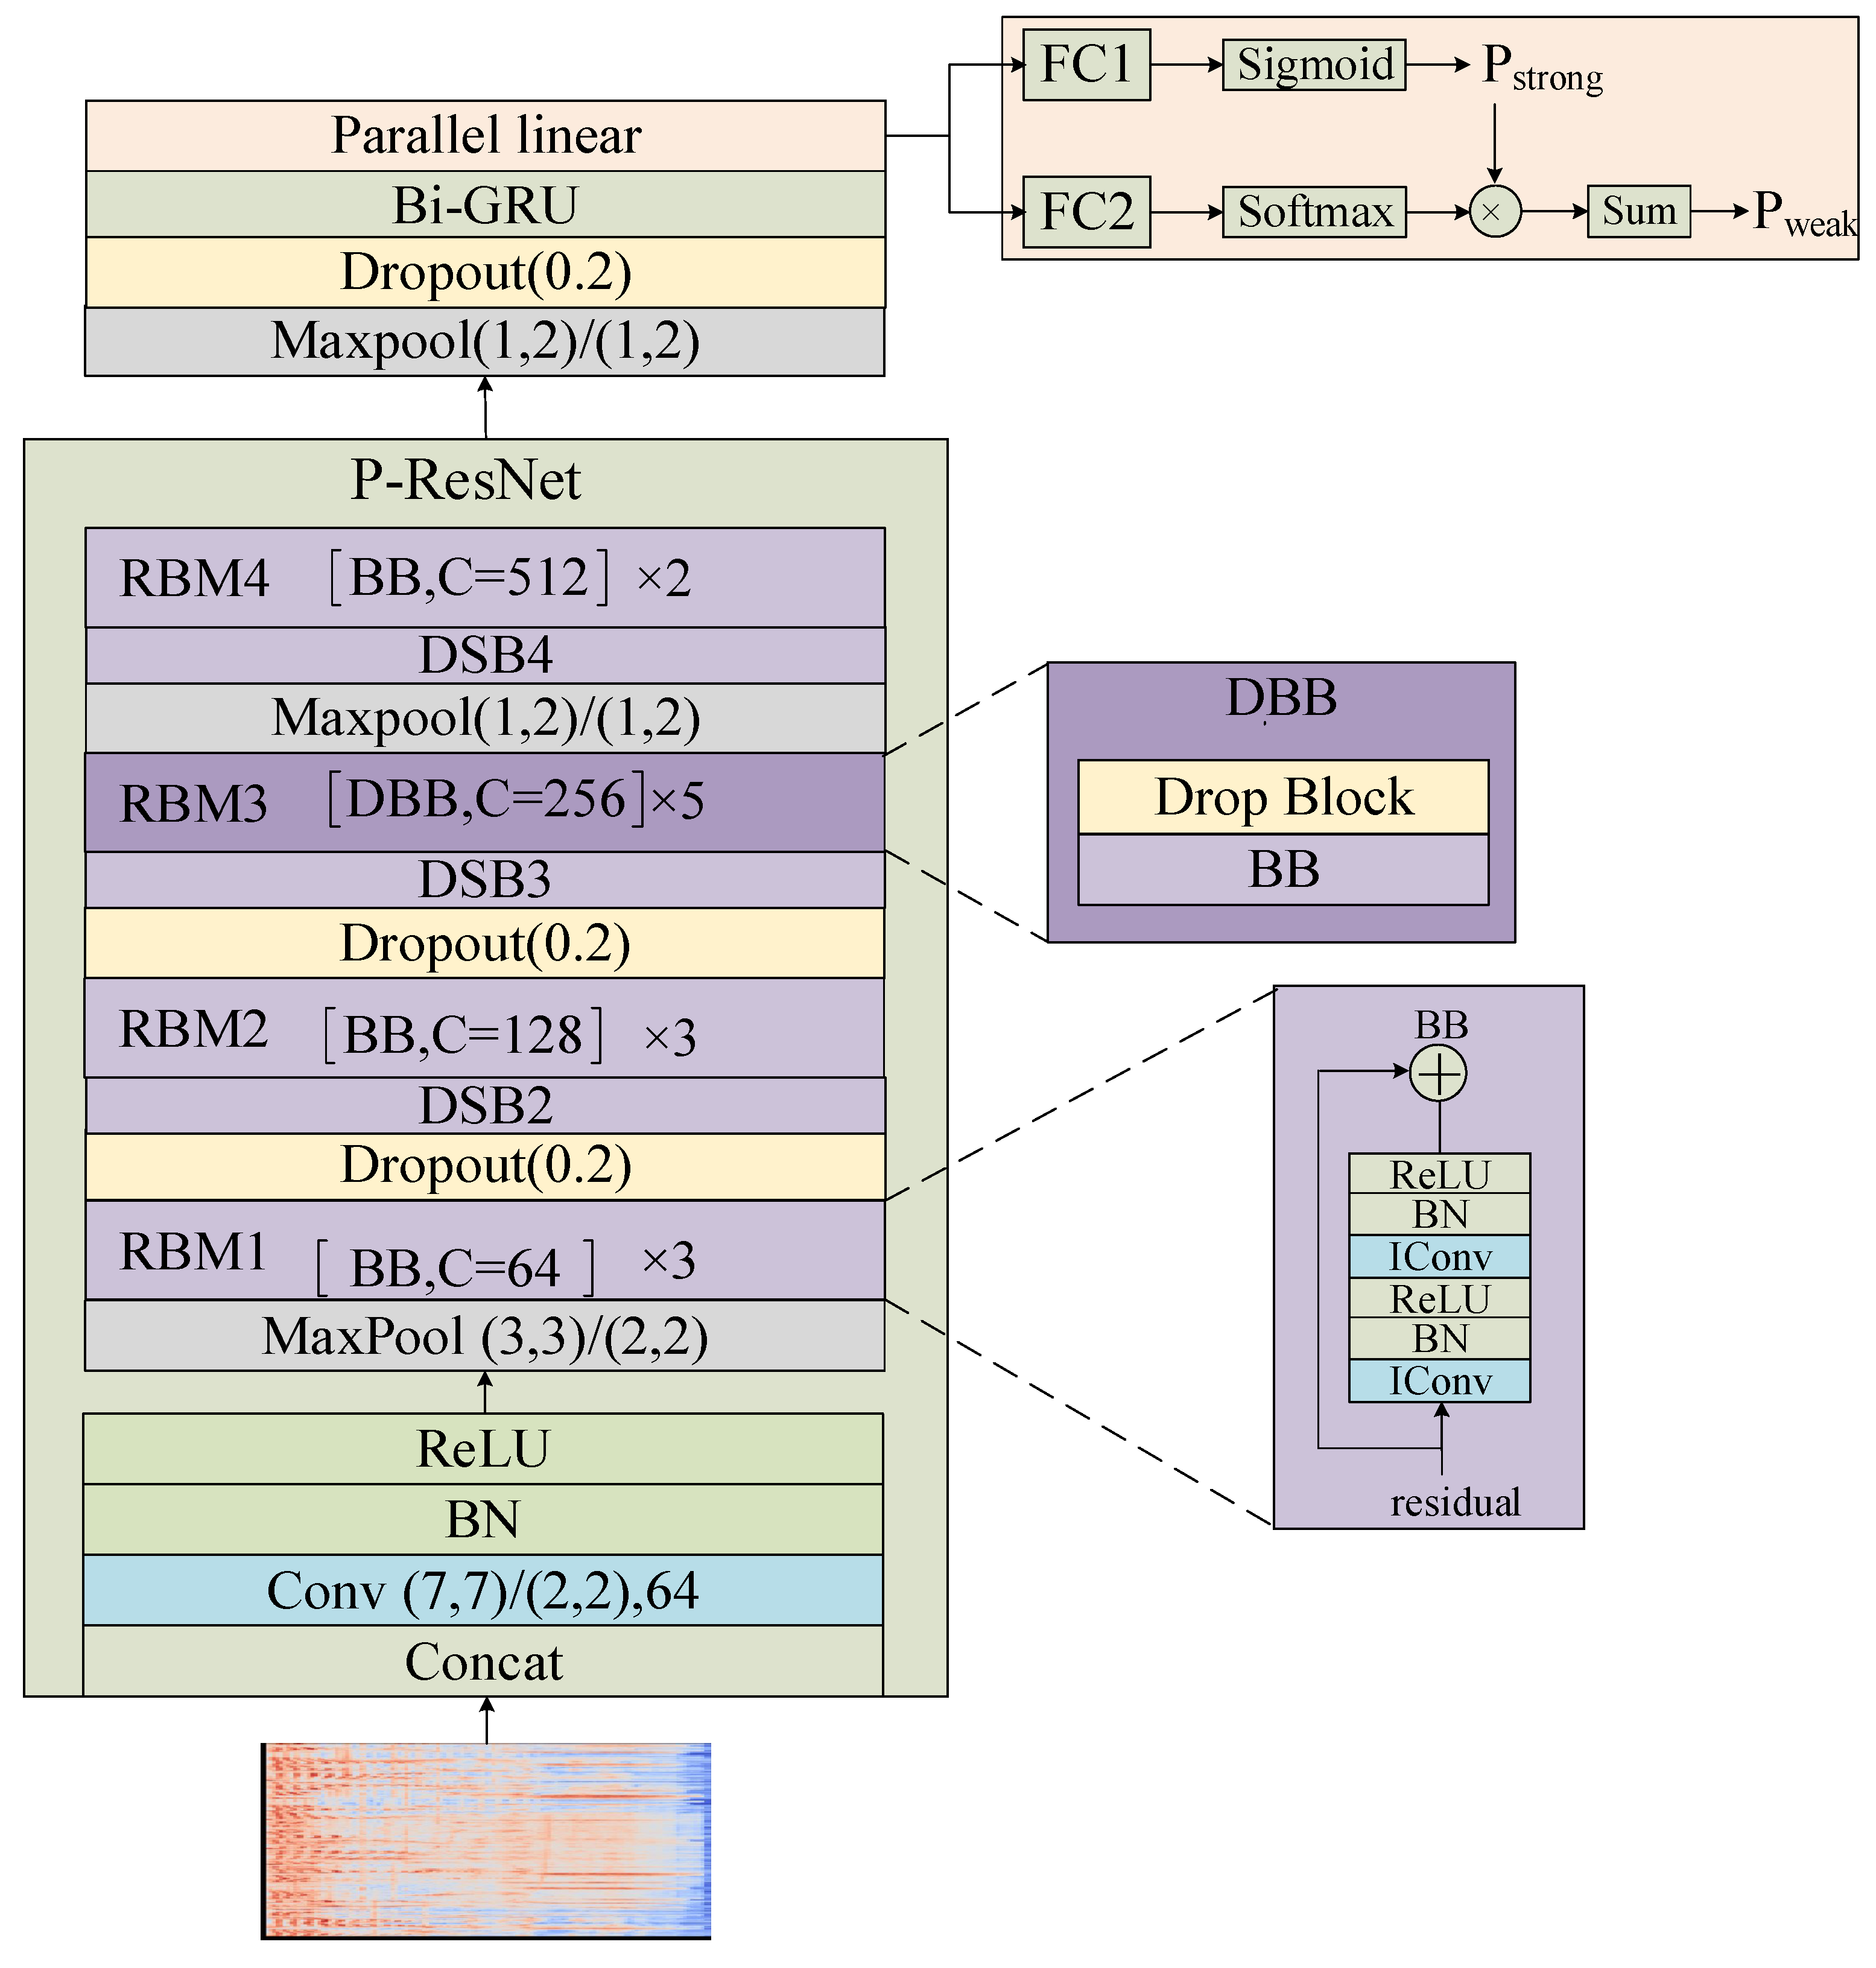
The detection network, established in this paper—namely, P-RRNN—is depicted in
Figure 2. To leverage the ResNet34 model, which was originally trained for image classification tasks, in SED tasks, we propose an optimized structure named P-ResNet. This structure retains the overall framework of the original model while modifying specific layers for enhanced performance. The P-ResNet model makes the following two improvements over the ResNet34 model:
The introduction of MaxPool layer structures into the network architecture facilitates frequency-domain downsampling of sound features. This adjustment not only curtails the complexity of the detection network, but also satisfies the input requirements of RNN for time series processing.
The addition of multiple Dropout and Drop block layers ensures that, even under identical conditions, the output of two similar detection networks will vary during the training process. This variation aids in enhancing the performance of the mean teacher model.
The input of ResNet34 is a 3-channel picture; therefore, P-ResNet takes the log-mel spectrogram of the audio as input and performs three consecutive channel-wise stacking, increasing the channel dimensions from 1 to 3. The stacked spectrogram is then processed through a convolution layer (Conv) for initial feature extraction, where the parameters of Conv represent the kernel size, stride, and output channels. Afterward, batch normalization (BN) and the ReLU activation function are applied, and the output is used as input for the ResNet.
The residual block module (RBM) and downsample block (DSB) are the core components of the ResNet, and they both employ residual connections. The Maxpool layer is used for downsampling in the frequency domain, with parameters indicating the kernel size and stride. The Dropout layer randomly drops values of some points in the feature map, with the dropout probability as a parameter. The RBM structure is used to increase the depth of the model. In the diagram, “C” represents the output channels of identical convolution (IConv) [
28]—which is the most frequently used convolutional layer in the P-RRNN model—the IConv’s channels can be chosen, and the convolutional kernel size is
with a stride of
and padding of
.
The basic block (BB) is a residual connection structure composed of two sets of identical IConv, BN, and ReLU activation functions. It serves as the fundamental building block of the RBM, RBM1, RBM2, and RBM4, which are composed of 3, 3, and 2 cascaded BBs, respectively. RBM3 is different from the other RBMs, as its basic structure is the drop basic block (DBB), which includes an additional Drop Block layer. In RBM3, the Drop Block layer randomly selects blocks and sets them to 0 with a probability of 0.2.
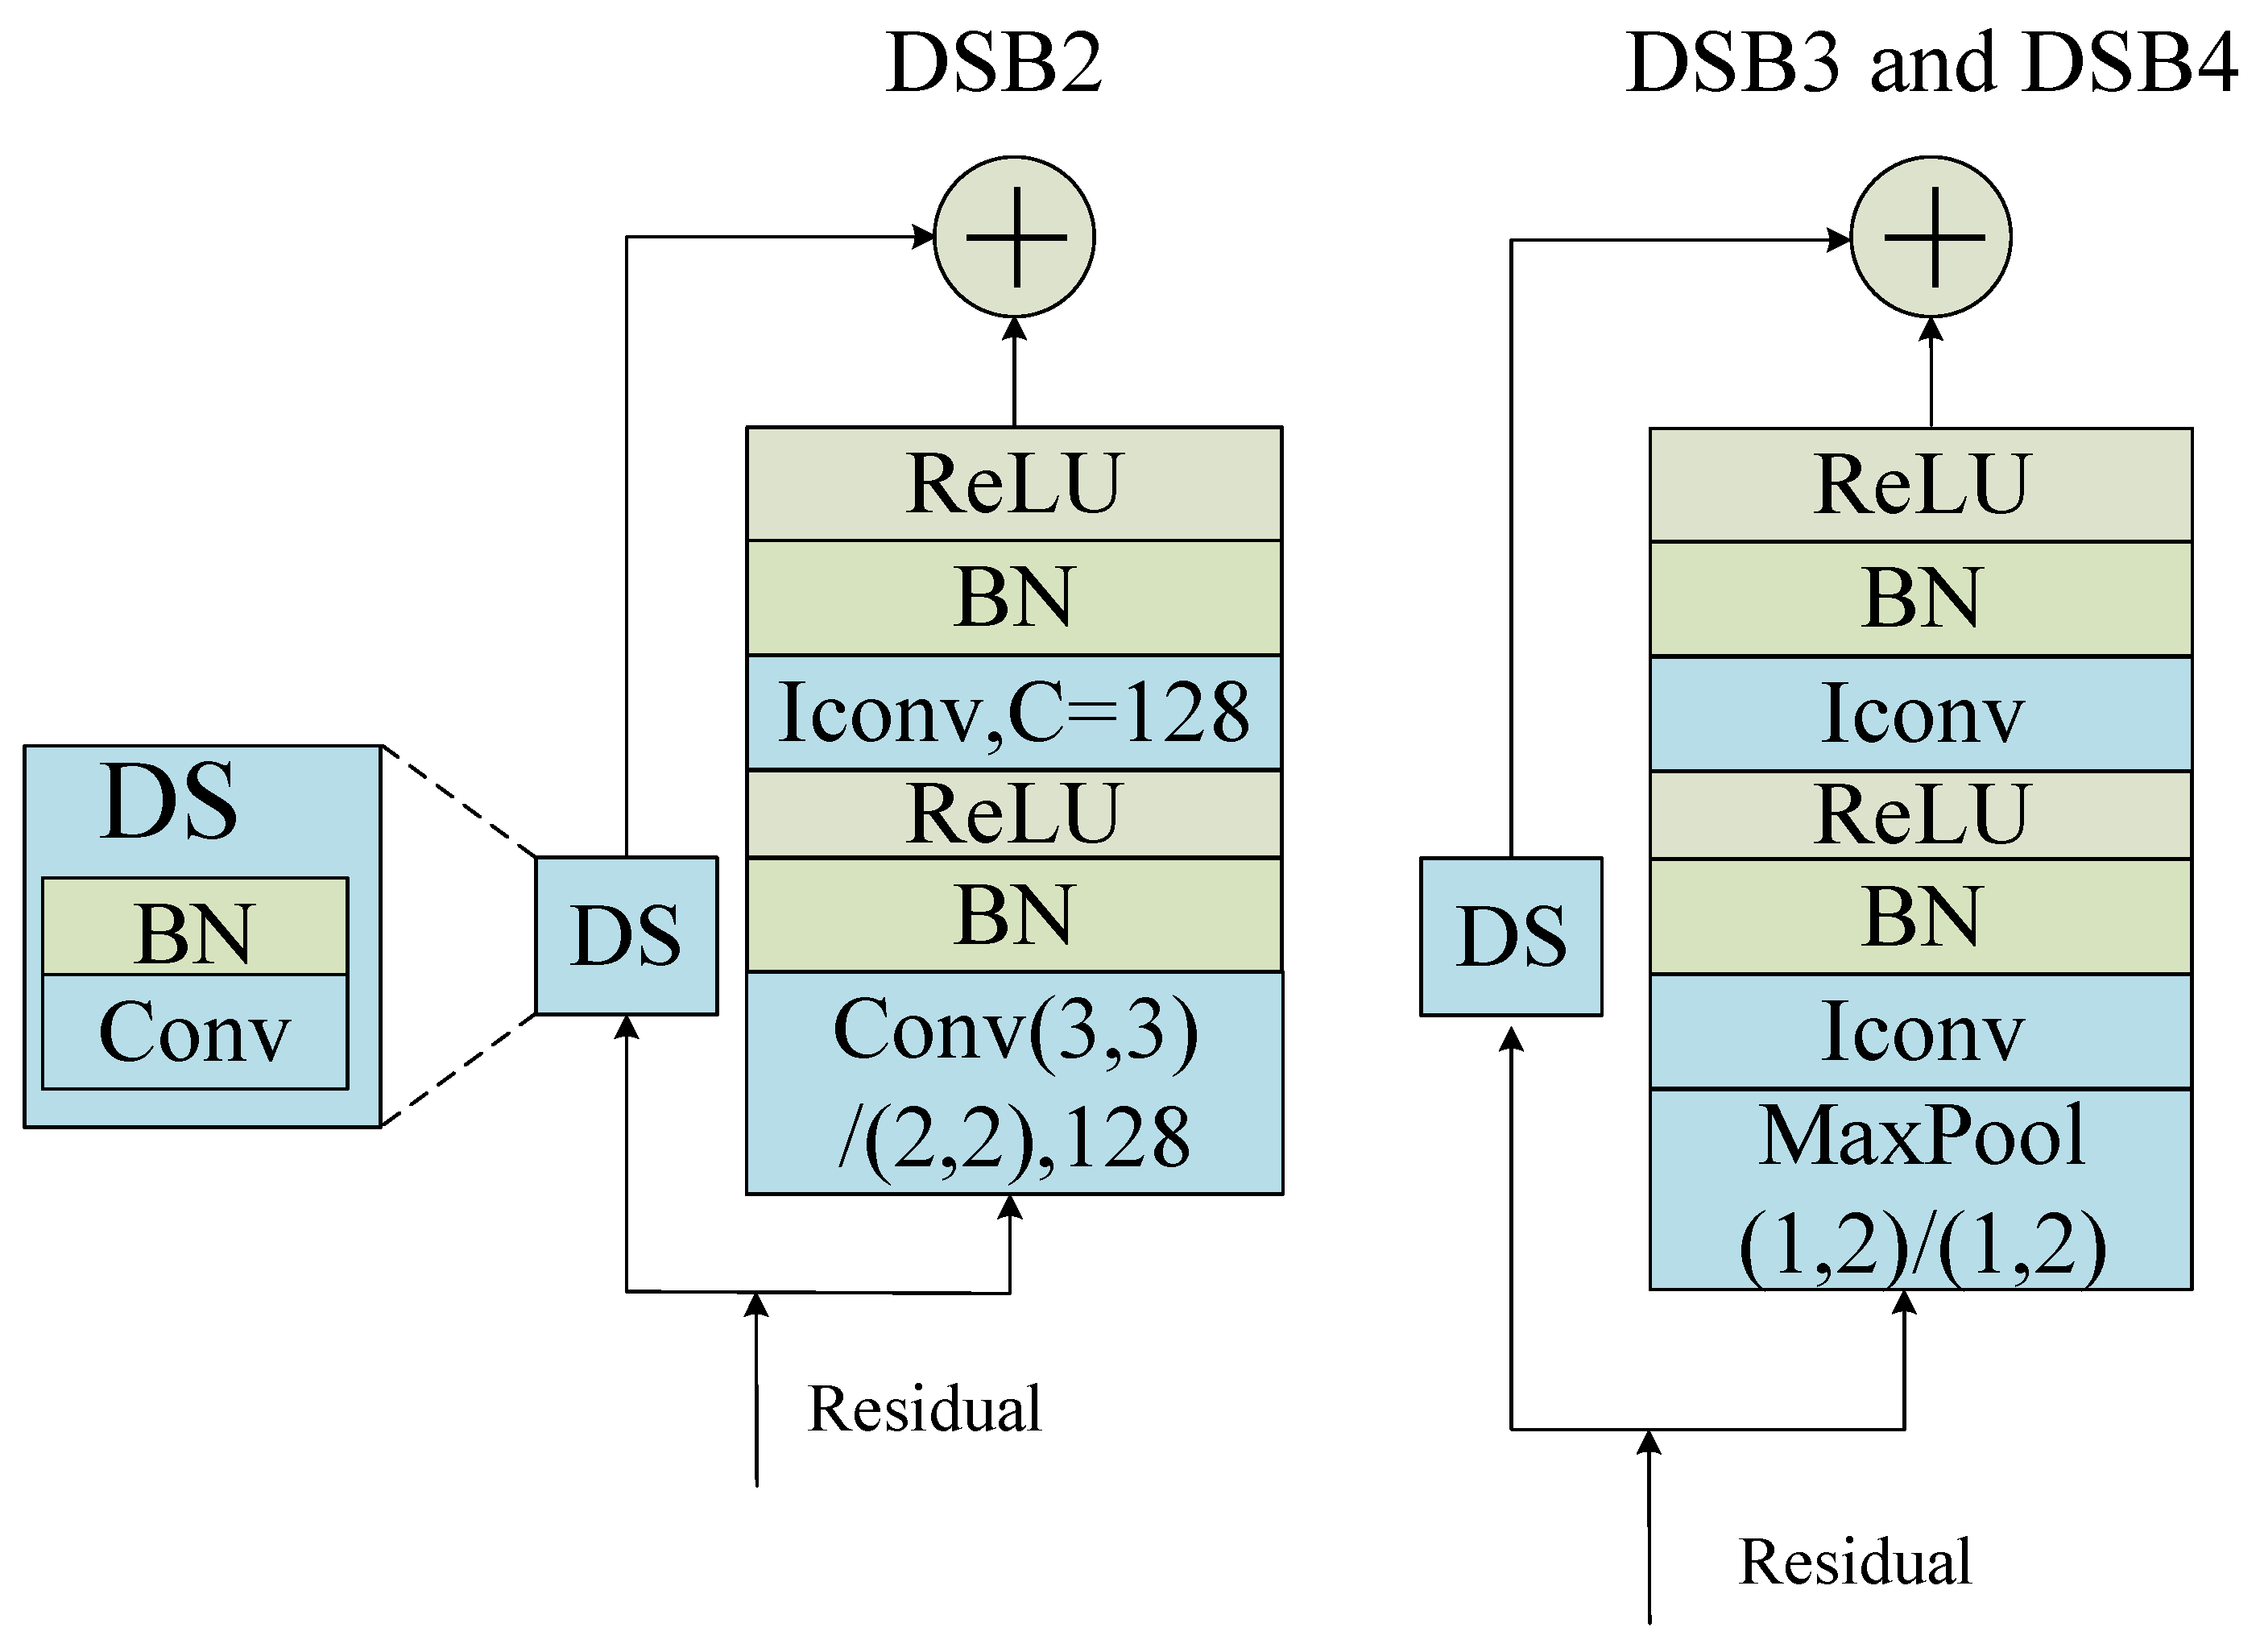
Since the RBM structure uses the same IConv for residual connections, it cannot increase the number of channels or perform downsampling on the feature maps; therefore, a structure similar to BB called DSB is used (
Figure 3). The downsample (DS) structure consists of a convolutional layer and a BN layer. It adjusts the shape of the input to match the output dimension through the convolutional layer, enabling residual connections.
In the original ResNet34 model, the DSB structures were designed to downsample both time and frequency domains equally, as demonstrated in DSB2. However, given the unique characteristics of audio signals, we have enhanced DSB3 and DSB4 by incorporating MaxPool layers that only downsample frequency domains, thereby preserving the time resolution. This modification retains more temporal information from the original audio, making the model more suitable for subsequent RNN processing. The application of global downsampling followed by frequency downsampling in the two DSB structures enables a balance between computational efficiency and representation capability. DSB2 increases the 64 channels of the residual to 128 channels through the first convolutional layer and performs downsampling using a convolutional kernel with a stride of 2. DSB3 and DSB4 have the same structure; DSB3 increases the output channels to 256, while DSB4 increases the output channels to 512.
The Bidirectional Gated Recurrent Unit (BI-GRU) extracts temporal correlations from the output of P-ResNet and serves as the input to the parallel linear layers. The strong labels and weak labels of the same audio are correlated, and we capture this correlation through the parallel linear layers. Specifically, within the parallel linear layers, FC1 and FC2 are linear layers with the same dimensions, and FC1 and the Sigmoid function are cascaded to produce a 2D matrix with temporal boundaries. The weak predictions are computed using an independent linear layer structure and are multiplied element-wise with the strong predictions, ensuring independence and consistency between the weak and strong predictions. Finally, the weak predictions are summed along the time axis to obtain the weak prediction vector; this parallel linear layer structure considers both strong and weak labels simultaneously and effectively learns their relationship, thereby improving prediction accuracy.
3.3. Post-Processing
The post-processing of the weak prediction vector and strong prediction matrix from the detection network requires additional steps. First, a threshold of 0.5 is applied to both the weak and strong prediction probabilities to binarize them. The binarized weak prediction vector is then decoded using one-hot encoding to obtain the weak labels.
To improve the accuracy and stability of the strong prediction results, this paper introduces a median filter with prior information to smooth the strong prediction matrix. The window length of the median filter is determined based on the statistics provided in
Table 1, which presents the information about each class of events in the synthetic audio of the DCASE 2019 Task 4 development set with strong annotations.
The “Total number” column represents the total number of each sound class, and the “Thres” column indicates the threshold used to select the window length. The threshold is determined based on the occurrence of events in each time segment. If the number of events exceeding a specific time segment accounts for more than 85% of the total events, then that time segment is selected as the threshold. The choice of the 85% threshold was derived from empirical observations and iterative testing. We aimed to identify a threshold that would allow us to detect the majority of sound events without being overly sensitive to brief, incidental sounds. Preliminary tests indicated that lower thresholds tended to incorporate too many short, incidental sounds, whereas higher thresholds neglected some of the longer, more significant sounds. We tested a variety of threshold values and determined that 85% provided an optimal balance between sensitivity and specificity, capturing most of the meaningful sound events while disregarding most of the incidental ones. The “NGT” column represents the number of events exceeding the threshold.
The window length calculation also depends on the length of the label encoding, as shown in Equation (
1):
where
denotes rounding up,
represents the length of time encoding, and
represents the audio duration.
4. Sound Event Detection System Training Process
In the SED task, it is challenging to obtain large-scale frame-level labels, and the performance of SED systems is often subpar in real-world scenarios. The mean teacher model is an efficient method for utilizing unlabeled data. However, in comparison to individual data augmentation, introducing perturbations at the model level can elevate the complexity and diversity of the detection network, which promotes consistency regularization [
29]. Therefore, to make the most of unlabeled data and enhance model performance, we propose a P-RRNN with model perturbation to augment the mean teacher model for the SED task in this study.
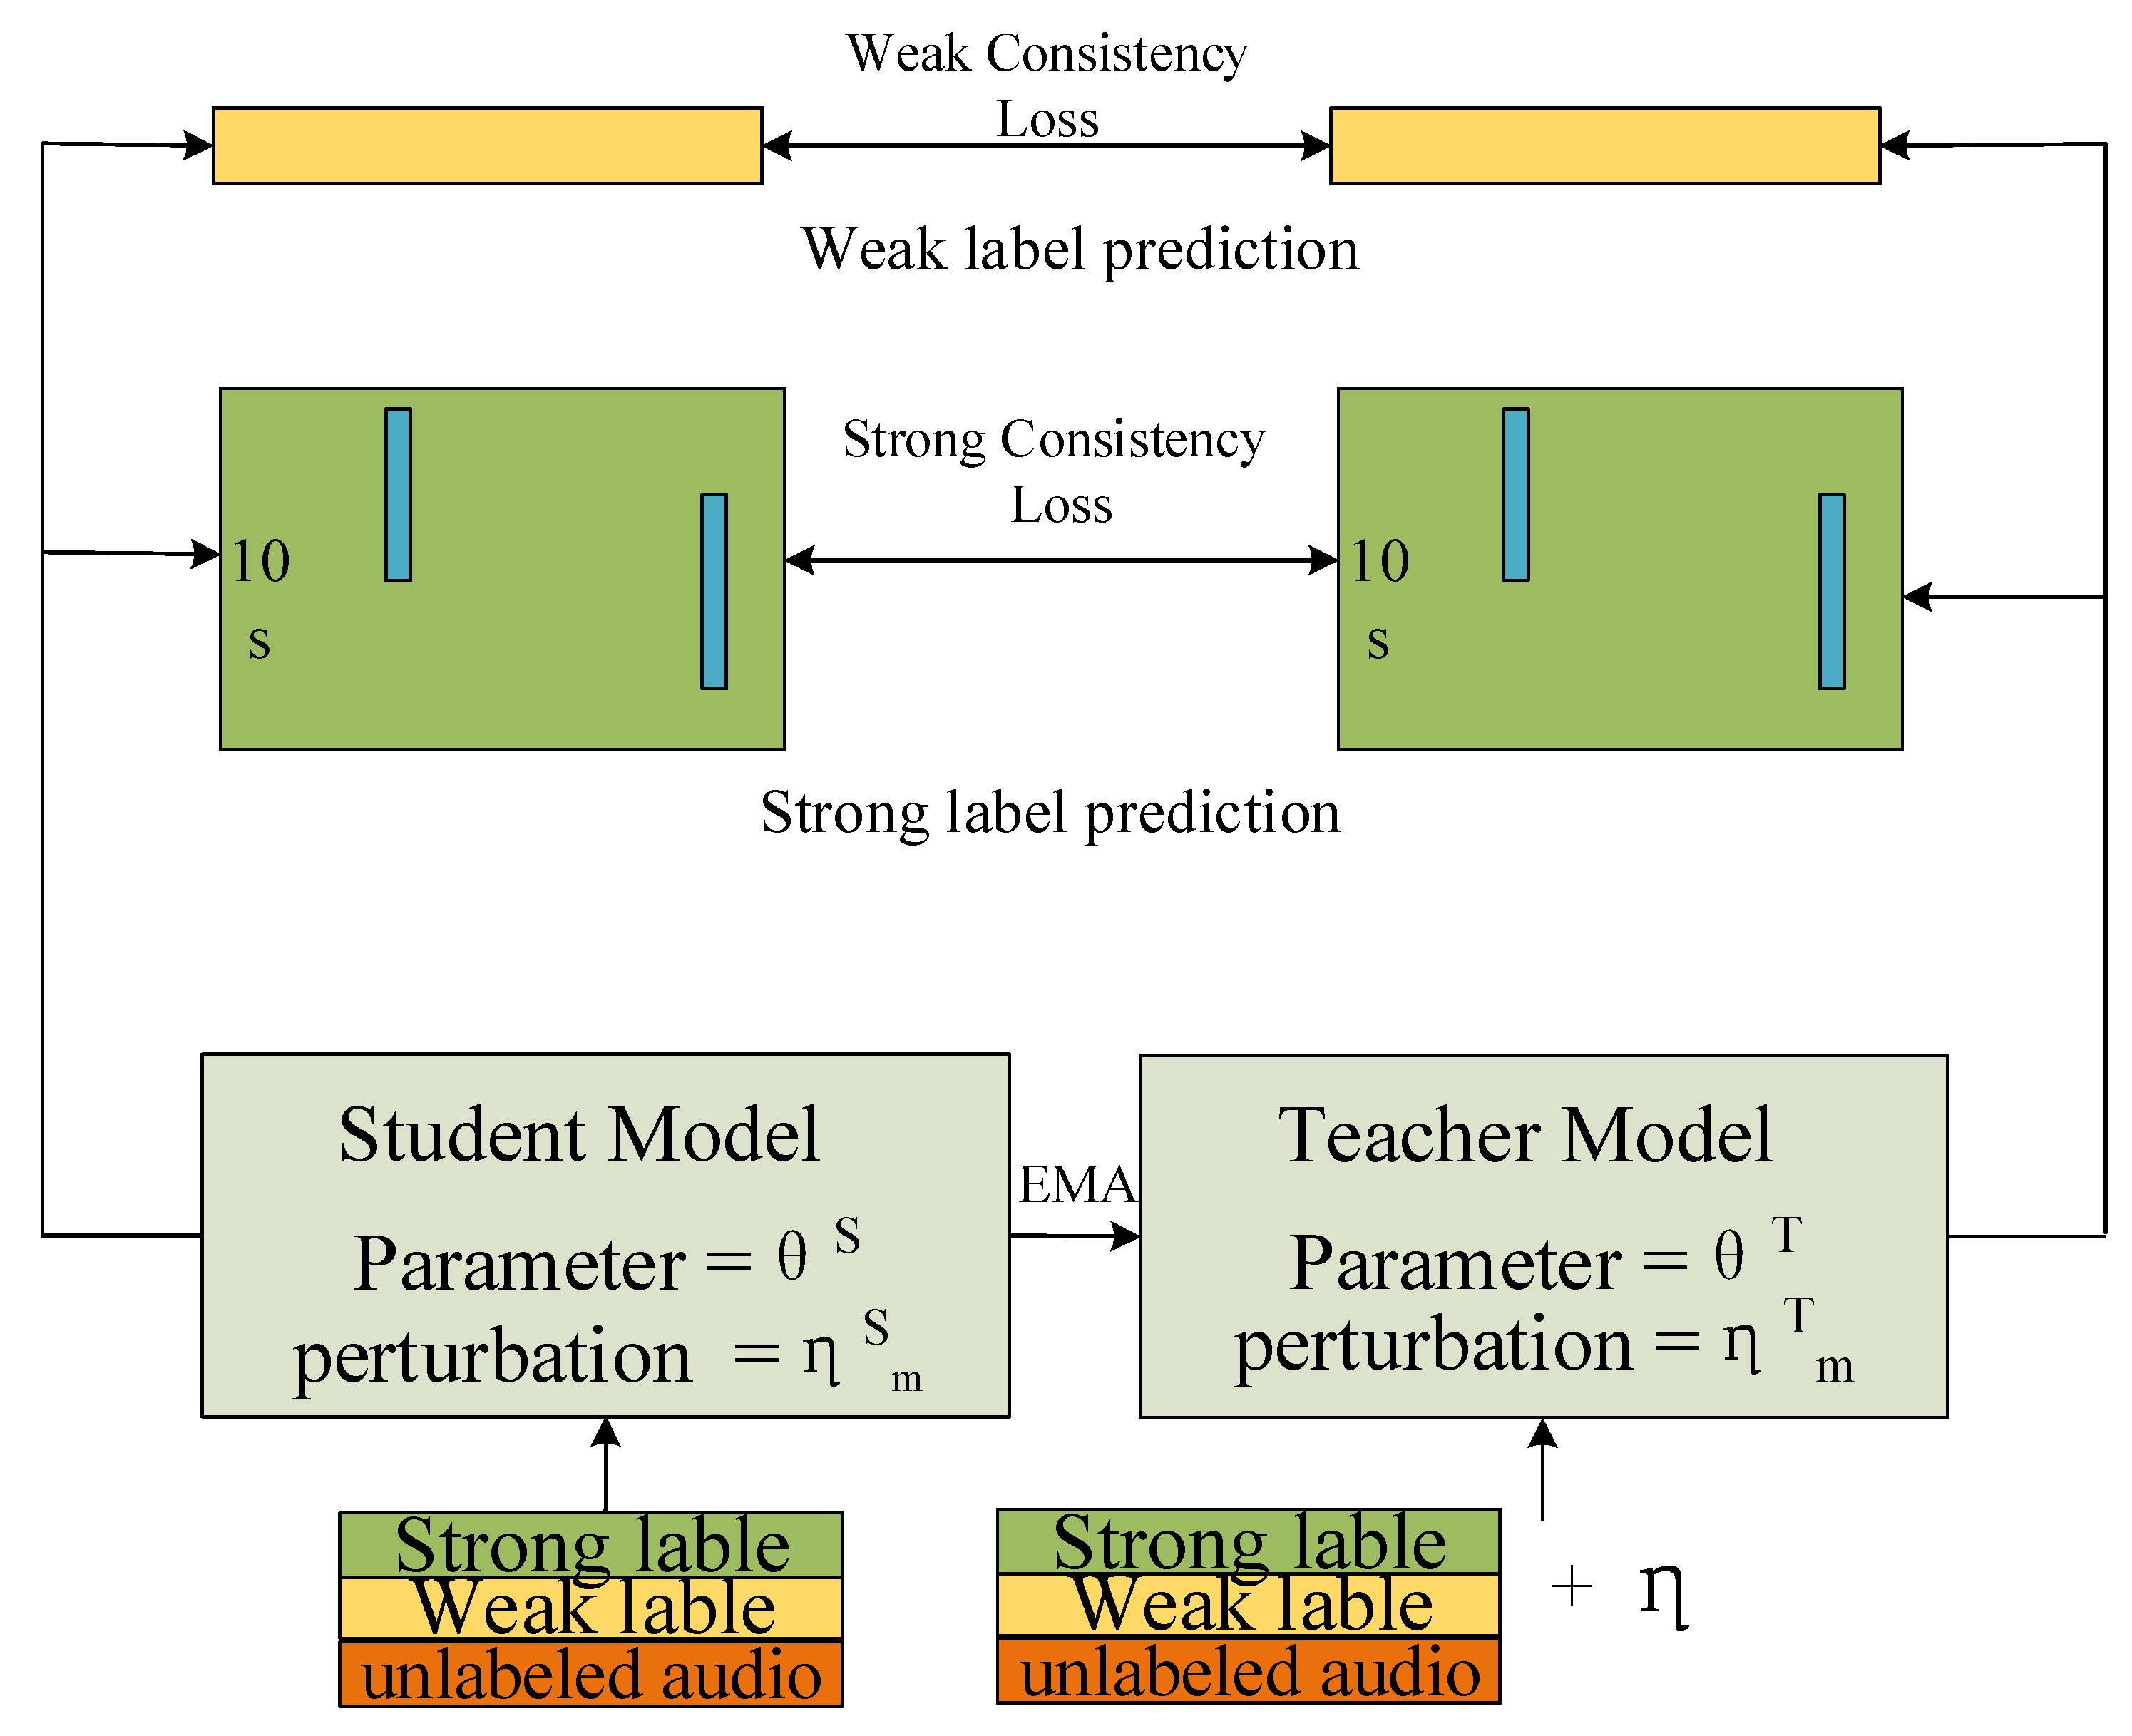
Specifically, the improved mean teacher model consists of a student model and a teacher model, forming a semi-supervised learning approach (
Figure 4). The training data consist of three parts: unlabeled data, weak labels, and strong labels. The teacher and student models both have the same P-RRNN structure but different model parameters, denoted as
and
, respectively.
The teacher model does not participate in backpropagation, and its parameters are updated as the exponential moving average (EMA) of the student model parameters, as shown in Equation (
2):
Here, is set to 0.999, and represents the training batch.
The proposed improvement in this study builds upon the mean teacher framework by introducing both data perturbation and model perturbation. A consistency loss function is employed to constrain the student and teacher models, encouraging them to produce consistent predictions. Gaussian white noise is added to the log-mel spectrogram as data perturbation for the teacher model, denoted as . Additionally, model perturbation is introduced using Dropout, Drop Block, and Max Pool operations designed in the P-RRNN. The student model perturbation is denoted as , and the teacher model perturbation is denoted as .
The student model participates in backpropagation, and the loss of the student model is computed based on the mean teacher’s consistency loss () and the error () between the detection results of the student model and the true labels.
Under data perturbation and model perturbation, the mean teacher framework constrains the outputs of the student and teacher models through consistency loss. Let denote the i-th audio sample, and represent the mean squared error function.
The strong consistency mean squared error loss (
) for
N audio samples is given by
where
is the sum of matrix elements,
is the strong label prediction of the student model, and
is the strong label prediction of the teacher model.
The weakly consistent mean square error loss for N audios is
where
is the weak label prediction of the student model and
is the weak label prediction of the teacher model.
Then,
can be expressed as:
Any strong label in the dataset includes the event category and its time boundary. Let there be a total of strong label audio and a total of frames in the time domain encoding. The vector represents the label event category of the i-th audio frame j. The vector represents the event category of the i-th audio frame j, as predicted by the student model.
Then, the strong label logarithmic cross-entropy loss function is
where
,
, and
C represents the total number of events
Given
weak-labeled audio samples, where the
vector represents the event category of the
i-th audio sample and
represents the predicted event category by the student model, the weak label logarithmic cross-entropy loss function is
Then,
can be expressed as
All loss values are used for student model backpropagation, where the total loss is
where
is the hyperparameter used to balance
.
5. Experiment and Analysis
5.1. Dataset and Preprocessing
This study conducted experiments using the DCASE 2019 Challenge Task 4 development set. The dataset consists of sound events from 10 home environments, namely, speech, dog, cat, alarm/bell ringing, dishes, frying, blender, running water, vacuum cleaner, and electric shaver/toothbrush. The development set includes a training set, validation set, and evaluation set. The length of the clips is 10 s, and clips slightly below 10 s are padded with zeros. The collection of the development set consists of two parts.
The first part consists of synthetic audio clips, which are created by synthesizing foreground sounds from the FSD dataset [
30] with background sounds from the SINS dataset [
31]. A total of 2045 clips with strong labels are used for the training set. The second part consists of real recorded audio clips from the AudioSet [
32], including 14,412 unlabeled clips and 1578 weakly labeled clips used for training. Strongly labeled validation and evaluation sets, each containing 1168 and 692 clips, respectively, are used to evaluate the detection systems.
The experiments were conducted using Jupyter notebooks with PyTorch (version 1.12) to build the neural network. The Python version used was 3.9. The training was performed on a GPU model 3090ti with driver version 515.57 and CUDA version 11.7. The Adam optimizer [
33] was employed to update the model parameters, with an initial learning rate set to 0.01. A cosine annealing function was used to dynamically adjust the learning rate with a minimum of 0.001. The learning rate was annealed every 4 cycles, and a total of 80 iterations were performed during training. The training time of our model is about 160 s per epoch, and the total number of parameters is about twenty-one million. Each batch size consisted of 4 strong label samples, 4 weak label samples, and 16 unlabeled samples.
5.2. Model Pre-Training
Owing to the limited number of annotated samples in SED tasks, the performance of deep learning models in SED is often restricted. To address this issue, pre-training P-ResNet was implemented on the large-scale ImageNet-1K dataset [
34]. This dataset contains at least 1000 images per category and has been annotated through multiple verifications to eliminate the subjective factors of annotators, thereby improving its accuracy.
In this study, to validate the impact of P-ResNet pre-training on the detection system, the training curves of the student model under the influence of pre-training on the DCASE 2019 Task 4 development set are shown in
Figure 5.
The upper plot represents the sum of strong and weak consistency losses between the student model and the teacher model, as well as the logarithmic cross-entropy loss of the student model’s predicted probabilities on the strong label training set (synthetic) and weak label training set, as shown in Equation (
9). The lower plot represents the evaluation of the detection system using the student model on the test set, which consists of a subset of synthetic audio (79 samples) and weak label audio (103 samples) from the development set. The vertical axis represents the sum of the test set Macro Event-based F1 (MEBF) and weak label F1 scores. The training curves demonstrate that pre-training the model with P-ResNet improves the convergence speed of the network, increases the F1 value on the validation set, and reduces the training loss. This outcome indicates that P-ResNet effectively addresses issues such as the difficulty of learning shallow parameters and the insufficient utilization of weight parameters by initializing the network with a pre-trained model.
5.3. Analysis of Results
The experiment conducted a specific comparison of the detection performance of P-RRNN when using pre-training versus the baseline system, using the validation set and evaluation set from DCASE 2019 Task 4. The baseline system [
8] employs a mean teacher model for semi-supervised learning. The detection network uses a CRNN structure. This CRNN network is composed of a 3-layer convolutional neural network (for feature extraction) and BI-GRU (for sequence modeling to classify and recognize sound signals). The evaluation metric used was MEBF, as proposed by the DCASE official guidelines, and as shown in
Table 2.
From the MEBF scores for various SED tasks, it can be observed that, compared to the baseline model, the P-RRNN model significantly improves the detection performance for most sound events, in both the validation and evaluation sets. Particularly, there is a significant improvement in the long-duration events, such as frying, vacuum cleaner, speech, and electric, while the detection performance for short-duration events like dog, dishes, and cat also shows noticeable improvement. This result indicates that P-RRNN has enhanced modeling capabilities for inter-frame relationships in the samples, and the perturbation structure is beneficial for the model to learn information from unlabeled samples. For events with medium durations, blender, and running water demonstrate significant performance improvements on the validation set. However, there is a slight decrease in the detection performance for the alarm sound event on the evaluation set, while it shows a slight improvement on the validation set. This phenomenon may be due to the fact that short-duration sound signals are easily masked by noise, leading to inaccurate detection.
In this study, the validation set of DCASE 2019 Task 4 was used as the test set, and MEBF scores were compared with the detection system mentioned above under the same training set conditions shown in
Table 3. Since the performance of the detection system is influenced by various factors, including hardware environment, software version, and other details, the baseline model mentioned in this paper was reproduced using the provided code and obtaining the corresponding MEBF. The results of other models were obtained by referring to relevant papers. The impact of pre-training on the performance of the detection system was also compared, showing an 8.8% improvement in MEBF when using pre-training. Our research results indicate that when only data perturbation is employed, excluding model perturbation (MP), the MEBF of P-RRNN declines by 5.4%. However, compared to the baseline detection network, P-RRNN exhibits superior detection performance when trained under the same conditions with the mean teacher model. Consequently, these findings demonstrate that our proposed P-RRNN effectively enhances detection performance.
In general, system performance not only depends on the network architecture but is also affected by factors such as dataset quality, data preprocessing, and model training strategies. Compared with CNNs, P-ResNet based on ResNet34 in this paper can improve the expression ability and learning depth of the model, extract more essential features of samples, and use the pre-training model to solve the problem of insufficient network fitting ability. The improved detection system combined with mean teacher and P-RRNN has practical significance for realizing the research goal of creating an intelligent and safe society.
6. Conclusions
In this study, we employed an improved ResNet34 network for SED systems, which involved feature extraction, thus enhancing the flow of sound information in the model, pre-training, and in introducing perturbation factors to the improved teacher model. Experimental results on the DCASE 2019 Task 4 dataset demonstrated that, without pre-training, the detection system achieved a 5% improvement in the MEBF metric on the validation set compared to the baseline system; with pre-training, the detection system achieved a 13.7% improvement in MEBF.
Overall, the P-RRNN model exhibited higher accuracy and robustness in SED tasks compared to the baseline system, but it also has limitations and challenges. This paper also needs to consider the deployment of event detection systems in practical applications. Future work aims to effectively fuse sound features, such as sound spectrogram centroids and scattering transforms, to reduce the complexity of the detection system, using smaller models for multi-SED and achieving better detection performance.
In addition, the strong labeled data for model training is generated by combining foreground and background sounds using Scaper. The foreground and background sounds have clear boundaries, and it is worth further investigating the domain adaptation techniques in SED to reduce the differences between synthesized audio and natural audio.


