Article

Predicting Consumer Service Price Evolution during the COVID-19 Pandemic: An Optimized Machine Learning Approach

by
Theofanis Papadopoulos
1,*,
Ioannis Kosmas
1,
Georgios Botsoglou
2,
Nikolaos I. Dourvas
2,
Christoniki Maga-Nteve
2 and
Christos Michalakelis
1
1
Department of Informatics and Telematics, Harokopio University of Athens, 17778 Tavros, Greece
2
Information Technologies Institute, Centre for Research and Technology Hellas, 57001 Thermi, Greece
*
Author to whom correspondence should be addressed.
Electronics 2023, 12(18), 3806; https://doi.org/10.3390/electronics12183806
Submission received: 28 July 2023 / Revised: 1 September 2023 / Accepted: 5 September 2023 / Published: 8 September 2023
(This article belongs to the Special Issue AI, IoT, and NN Use in HealthCare)

Abstract

:
This research analyzes the impact of the COVID-19 pandemic on consumer service pricing within the European Union, focusing on the Transportation, Accommodation, and Food Service sectors. Our study employs various machine learning models, including multilayer perceptron, XGBoost, CatBoost, and random forest, along with genetic algorithms for comprehensive hyperparameter tuning and price evolution forecasting. We incorporate coronavirus cases and deaths as factors to enhance prediction accuracy. The dataset comprises monthly reports of COVID-19 cases and deaths, alongside managerial survey responses regarding company estimations. Applying genetic algorithms for hyperparameter optimization across all models results in significant enhancements, yielding optimized models that exhibit RMSE score reductions ranging from 3.35% to 5.67%. Additionally, the study demonstrates that XGBoost yields more accurate predictions, achieving an RMSE score of 17.07.

1. Introduction

The far-reaching consequences of pandemics and epidemics impact many aspects of societies. These infectious diseases have profoundly influenced various facets of society, including education [1], mental health [2,3], and business operations [4]. Focusing on the business landscape, it becomes clear that these outbreaks disrupt global supply chains, reduce consumer demand, hinder productivity, and lead to higher unemployment rates. The ongoing COVID-19 pandemic, in particular, has brought about unprecedented economic consequences for businesses on a global scale.
The restrictions and lockdown measures imposed to curb the spread of the virus have severely disrupted global supply chains, leading to shortages of raw materials and components necessary for production [5]. Furthermore, the decrease in consumer demand resulting from financial uncertainty and reduced purchasing power [6] has placed immense pressure on businesses, particularly those operating in industries heavily dependent on discretionary spending [7]. As a result, many businesses have faced significant revenue losses, leading to closures, bankruptcies, and job losses on a large scale [8,9]. The increase in unemployment rates has further exacerbated the economic challenges, as individuals have struggled to meet their basic needs and businesses have faced a shrinking customer base [10]. The COVID-19 pandemic has also disrupted workflows and productivity through remote work arrangements and absenteeism [11]. Reduced workforce efficiency due to illness further contributes to decreased output and economic slowdown. The intricate relationship between consumer service prices and the fortunes of businesses takes center stage in the wake of the COVID-19 pandemic. As businesses grapple with unprecedented disruptions, the ability to anticipate consumer service price trends becomes a crucial factor for informed decision making. Notably, the challenges that businesses face—ranging from supply chain bottlenecks to shifts in consumer demand—are intrinsically tied to pricing dynamics. Fluctuations in consumer service prices can both reflect and shape consumer behavior, impacting demand patterns and revenue streams. Businesses must adapt and make critical decisions to survive and thrive [12].
The COVID-19 pandemic’s unprecedented nature, characterized by its rapid global spread and the necessity of worldwide mandatory countermeasures, has presented businesses with an array of challenges that were previously uncharted. The limitations of traditional forecasting methods in capturing complex dynamic shifts caused by the pandemic have accentuated the pressing need for informed decision making. In this scope, we conducted this study aiming to develop a method to satisfy this need. We deploy machine learning techniques and optimization algorithms to develop a predictive framework for estimating the potential outlook of businesses. The foundation of our analysis lies in a dataset that combines COVID-19 data [13] with relevant economic indicators from various industries [14].
In this context, we aim to gain valuable insights into the impact of the pandemic on businesses. The methodologies used are designed to uncover meaningful patterns from a complex dataset, providing forecasts and supporting evidence-based decision making. To the best of our knowledge, this study represents the first utilization of the XGBoost model in a case study analyzing the impact of the COVID-19 pandemic on consumer service prices within the European Union. In addition to immediate insights, our research paves the way for future investigations. By understanding the impact of infectious outbreaks on economic shifts and consumer behavior, we aim to provide a foundation for ongoing studies that contribute to informed decision making and economic resilience.
The rest of this paper is organized as follows. In Section 2, we present existing relevant methodologies. Section 3 describes the sources and characteristics of the data used in this study, as well as the methodology employed, outlining the research design and the analytical techniques implemented. In Section 4, we present our findings and analyze the results, providing insightful interpretations. Finally, in Section 5, we discuss key findings of our research, address limitations encountered during the study, and propose suggestions for further investigation.

2. Literature Reviews

Understanding the implications of this unprecedented crisis on the economic growth of businesses has become a crucial area of research [15]. Thus, there are many works of research literature involving business modeling and forecasting in the volatile environment of the COVID-19 pandemic. Han Khanh Nguyen [16] explored the possibility of assessing the impact of COVID-19 on logistics businesses using mathematical models and offering recovery and sustainability solutions. Safi et al. [17] utilized time series models to provide insights on the future impact that the COVID-19 pandemic will have on Chinese exports. Suanpang et al. 2020 [18] compared different methods of machine learning to predict the business recovery of the tourism sector from the COVID-19 pandemic, while Fatemeh Safara [19] utilized predictive modeling to forecast consumer behavior during the pandemic. In the study by Semaa et al. [20], a genetic algorithm method was proposed for optimizing financial supply chains in the COVID-19 environment. Gkikas et al. [21] proposed a method for marketing decision making during the pandemic by implementing binary decision trees and genetic algorithms. In another work, Weng et al. [22] proposed a genetic-algorithm-based pipeline to forecast oil price volatility in the midst of the global health crisis. HOA et al. [23] implemented a genetic algorithm method to optimize the logistics of transportation during the COVID-19 crisis. Chaves-Maza et al. [24] explored the utilization of the XGBoost algorithm to assess the impact of COVID-19 on the economy. Romani et al. [25] attempted to forecast post-COVID-19 aviation business development using an MLP neural network, while Vărzaru et al. [26] also utilized the MLP architecture to offer insights into tourism business resilience.
In the pursuit of creating predictive models of high robustness, optimization emerges as a pivotal factor. Consequently, substantial research endeavors have been dedicated to devising strategies that effectively tackle this imperative concern. A significant portion of this research landscape revolves around the utilization of evolutionary algorithms as a cornerstone. In [27], Jalali et al. proposed an evolutionary-based optimization for CNNs in intelligent load forecasting. Wang et al. [28] studied a feature selection technique based on evolutionary algorithms. Neshat et al. [29] offered a hybrid neuro-evolutionary method for wind turbine output prediction. In [30], Arora et al. provided a custom evolutionary algorithm for the hyperparameter tuning of DNNs, while SaiSindhuTheja et al. [31] studied a metaheuristic algorithm in order to perform feature selection for RNNs. In another work, Wang et al. [32] used an algorithm based on differential evolution to improve the performance of CNN models. Raji et al. [33] proposed genetic algorithm hyperparameter tuning for machine learning models. Finally, the study conducted by Borisov et al. [34] served as a guiding benchmark, aiding in the selection of appropriate models for our research.
Informed by our previous work in [35], which laid the foundation for our current study, we delve into the practical utilization of genetic algorithm optimization to predict service prices in the context of the COVID-19 environment. Building upon existing research that employs evolutionary algorithms for model improvement, our aim is to enhance the accuracy of our price prediction models.

3. Materials and Methods

3.1. Dataset

In this study, we employed a comprehensive dataset that integrates information from two distinct sources, each offering valuable insights into different aspects.
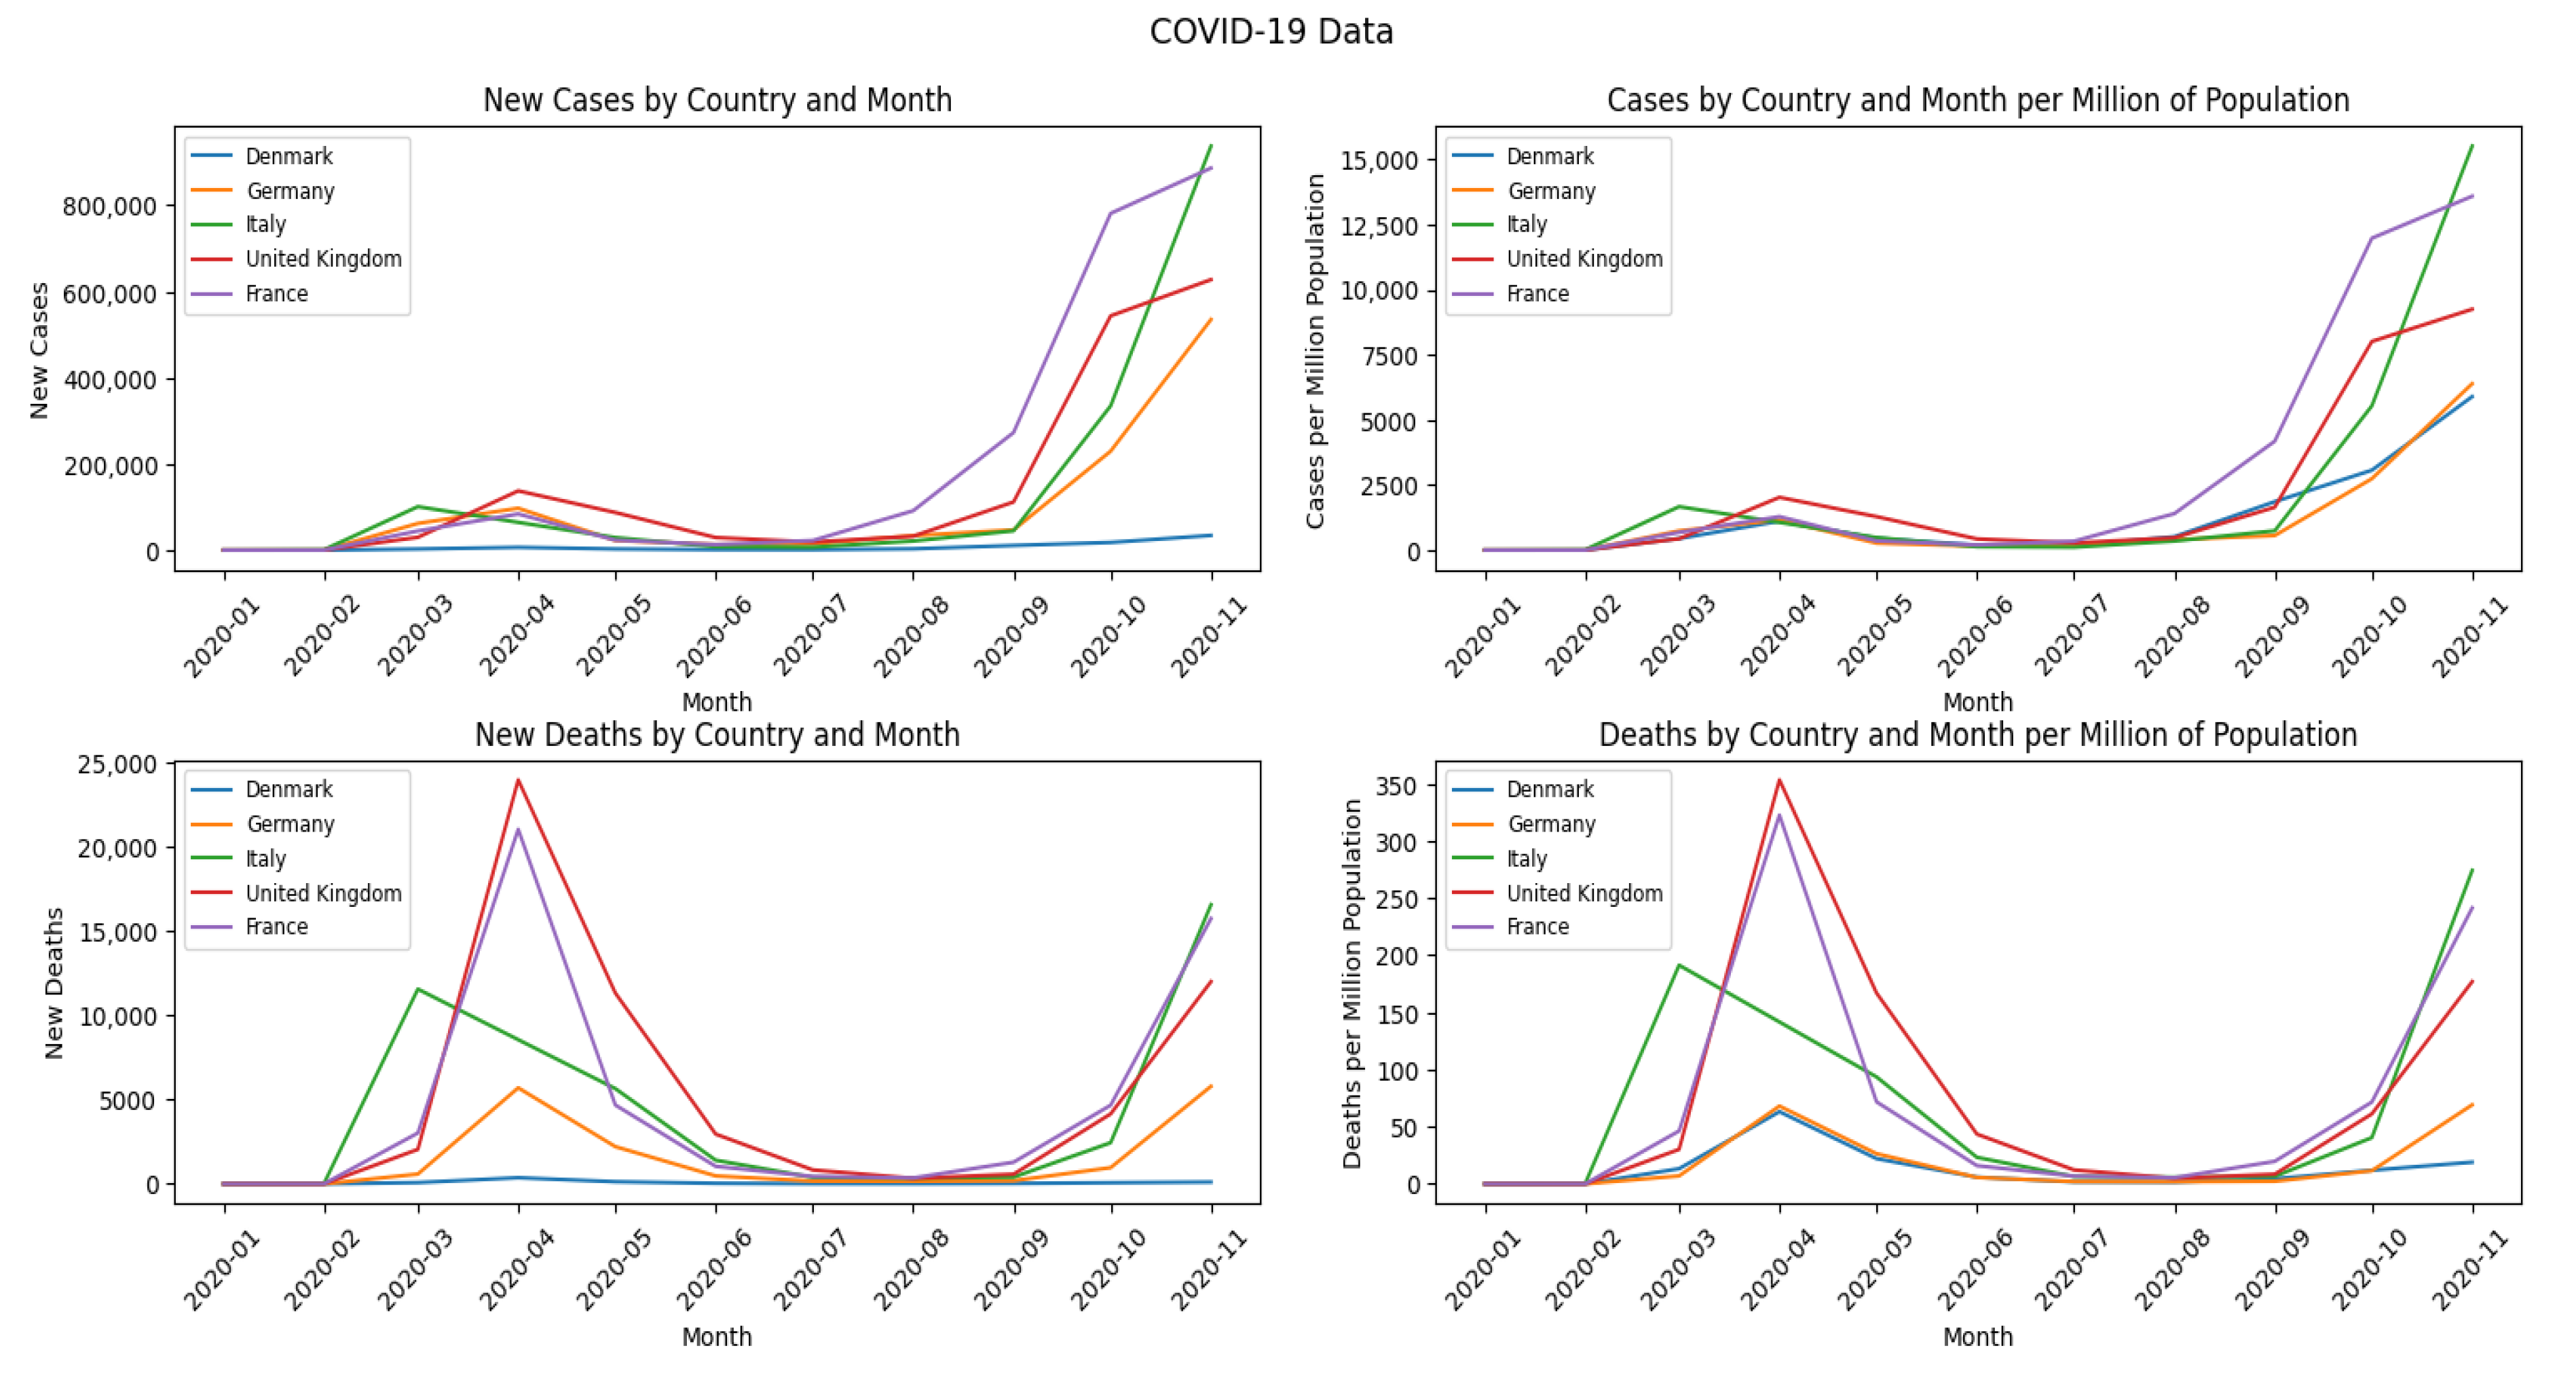
The first part of the dataset, which is publicly available, encompasses data on coronavirus cases and deaths sourced from the World Health Organization (WHO) [13]. The provided dataset includes rates of cases and deaths for European Union (EU) countries per month. The data were further transformed into cases and deaths per million of population, enabling standardized comparisons across diverse regions. Figure 1 depicts the values of COVID-19 data per month and per million of the population for five sample countries.
The second part of the dataset comprises essential information pertaining to the price of consumer services in the Transportation, Accommodation, and Food Service sectors across the EU [14]. These data are derived from the Joint Harmonized EU Programme of Business and Consumer Surveys, conducted by the Directorate-General for Economic and Financial Affairs of the European Commission. These surveys encompass various sectors of economic activity and involve balanced responses obtained monthly by national institutes.
Within this dataset, each participating manager’s responses are accompanied by general information about their respective businesses. The survey questions address multiple facets, including the business situation development, the evolution of demand over the past three months, expectations regarding future demand, changes in employment over the past three months, and anticipated employment trends over the next three months. Additionally, a question pertains to the estimation of changes in the price of services provided over the next three months. The answers to this question were used as a ground truth for this study’s predictive modeling. All the answers to the questions in this dataset are expressed as a balanced percentage and are weighted with a coefficient dependent on the size of the firm. The balanced percentage signifies the difference between positive and negative answers. More specifically:
E B A L t = E U P t E D O t
where E U P t is the percentage of “improved” answers, E D O t the percentage of “deteriorated”, and E B A L t is the balanced percentage for answers in month t.
The Joint Harmonized EU Programme of Business and Consumer Surveys dataset contains monthly entries from various businesses based in 27 EU countries, starting from January to November 2020, for a total of 1626 entries. The distinction within the data is made based on the sub-sector of each business. The number of entries for each sub-sector throughout the data collection period is shown in Table 1.
Overall, 15 features are used as input to the model. These features are described in 
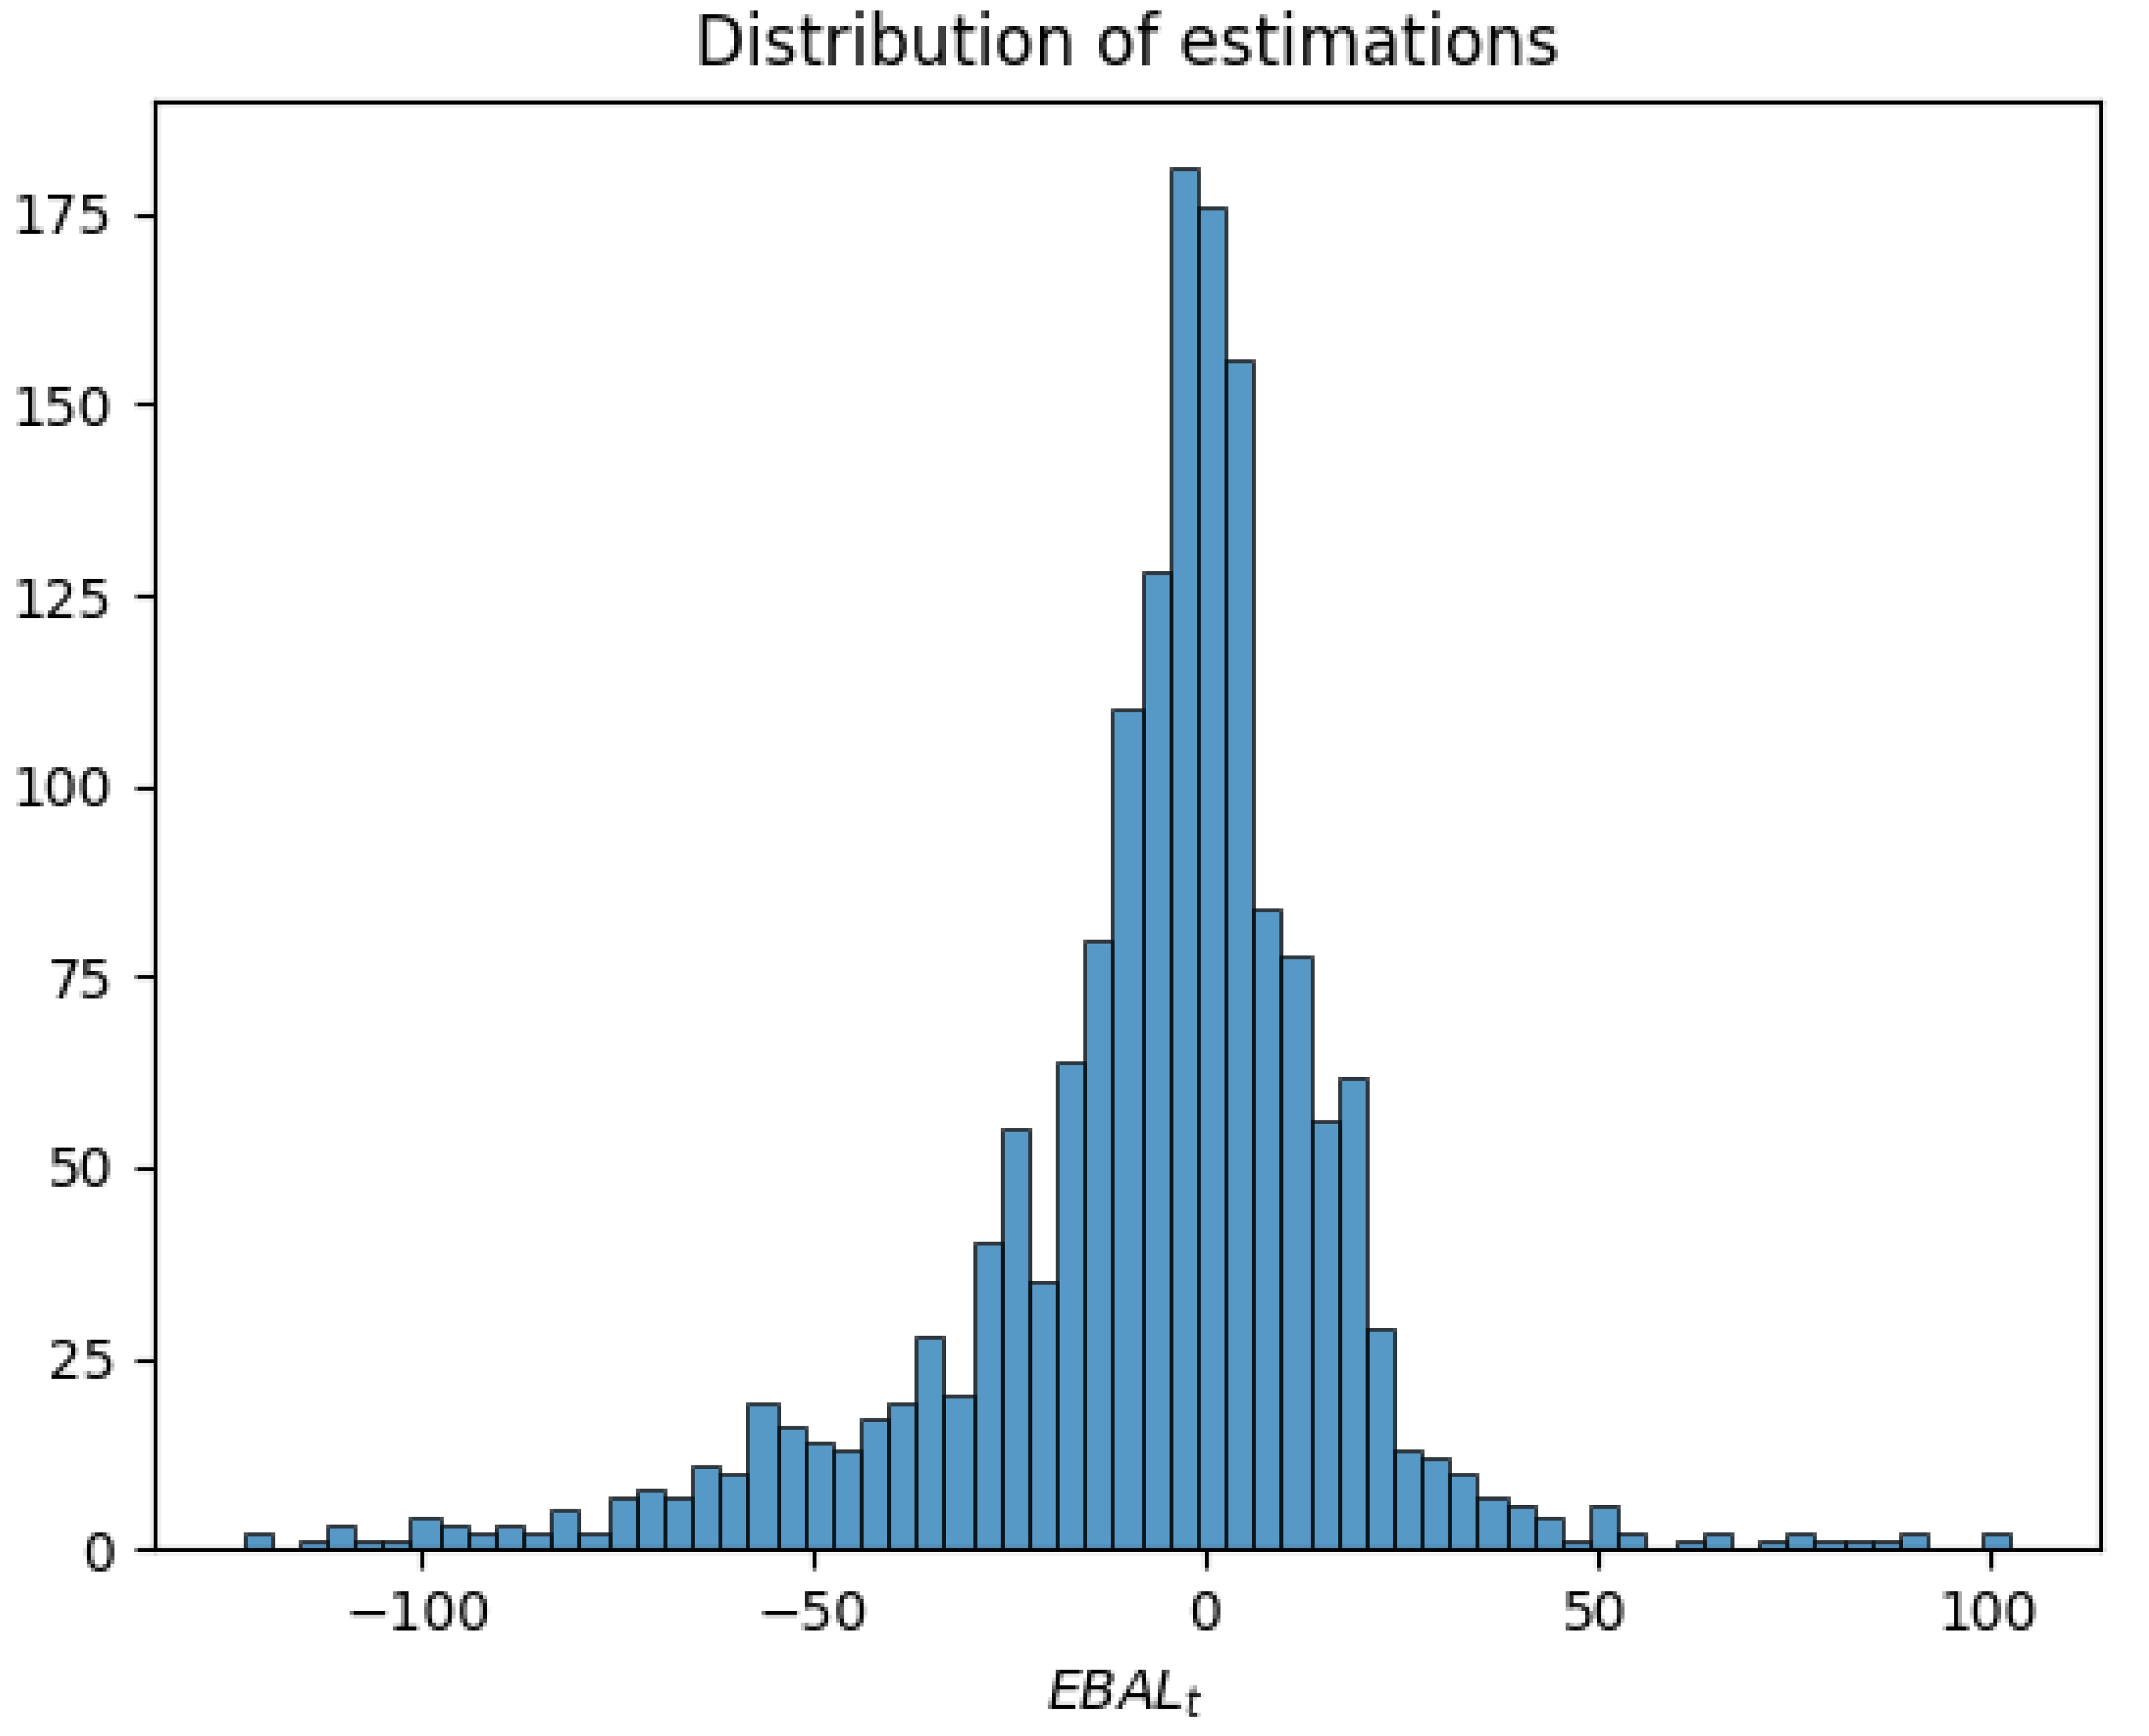
Table 2. The distribution of estimations for prices in the near future contained in the dataset is shown in Figure 2. The histogram provides insights into the range and concentration of estimated price values, a crucial consideration for evaluating the diversity and spread of the data. The distribution appears to be skewed toward negative values, suggesting a tendency for lower estimated prices.
The incorporation of insights from the WHO COVID-19 Dashboard and the Joint Harmonized EU Programme of Business and Consumer Surveys into this comprehensive dataset offers a valuable basis for our study. It allows us to investigate various aspects of the pandemic’s impact and analyze economic trends. By utilizing these combined data sources, our aim is to gain a deeper understanding of the intricate relationship between public health dynamics and the economic landscape. We apply genetic algorithms in order to maximize the potential of this dataset and optimize model parameters to enhance predictive performance.

3.2. Preprocessing

In order to prepare the raw dataset for subsequent analysis, some preprocessing steps were undertaken. These steps ensured the suitability of the data for the chosen analytical techniques and contributed to the overall quality of the results.
Categorical features, represented as string values, required transformation into numerical format. For this reason, categorical encoding was used to convert them into an appropriate form. Additionally, prior to feeding the data into the analytical pipelines of this study, features underwent min-max scaling. Min-max scaling was selected due to its effectiveness in maintaining feature distributions while aligning them to a consistent scale. Finally, the dataset was partitioned into training and testing subsets using 80% of the samples for training purposes and 20% for testing purposes with a 5-fold cross validation strategy. This approach translates to a training set comprising 1300 samples and a testing set comprising 326 samples.

3.3. Methodology

The methodology of this study utilizes genetic algorithms (GAs) [36,37] to optimize the hyperparameters of predictive models. A genetic algorithm is an optimization technique inspired by the process of natural selection. It evolves and refines a population of potential solutions over multiple generations to find the best solution to a complex problem. Genetic algorithms were chosen as the optimization technique due to their ability to efficiently search through a large solution space [38]. In this study, the fitness function for the GA was derived from the loss function of a regressor trained on the dataset. Its aim is to minimize the prediction error and improve the overall performance of the models. The root mean squared error ( R M S E ) was used as the evaluation metric, which is defined as follows:
R M S E = 1 N i = 1 N ( y i y ^ i ) 2
where N represents the number of samples, y i is the observed value, and y ^ i is the predicted value. In this particular scenario, y i pertains to the balanced percentage of responses from each business. This response corresponds to their estimation of the anticipated price change for services offered over the upcoming three months. This estimation is further weighted by a coefficient that takes into account the respective size of each firm [14]. This composite approach ensures a comprehensive and nuanced evaluation of the pricing dynamics within the diverse landscape of businesses under consideration.
The study employed four distinct regression models: the multilayer perceptron (MLP) neural network architecture [39], the XGBoost model [40], the random forest model [41], and the CatBoost model [42]. The multilayer perceptron is a neural network architecture, comprising multiple layers of interconnected nodes, able to learn complex patterns and relationships from data. XGBoost utilizes boosting to enhance decision trees, random forest employs ensemble learning with multiple decision trees, and CatBoost incorporates categorical feature support for improved performance. The genetic algorithm can be applied to modify the hyperparameters of these models, tailoring them to extract maximum predictive accuracy.
By employing these regression models, we aimed to leverage their respective strengths and explore the potential performance gains in regression tasks. The subsequent sections of the methodology chapter delve into the details of the hyperparameter optimization process using GAs for each model, aiming to identify the most effective hyperparameter combinations.
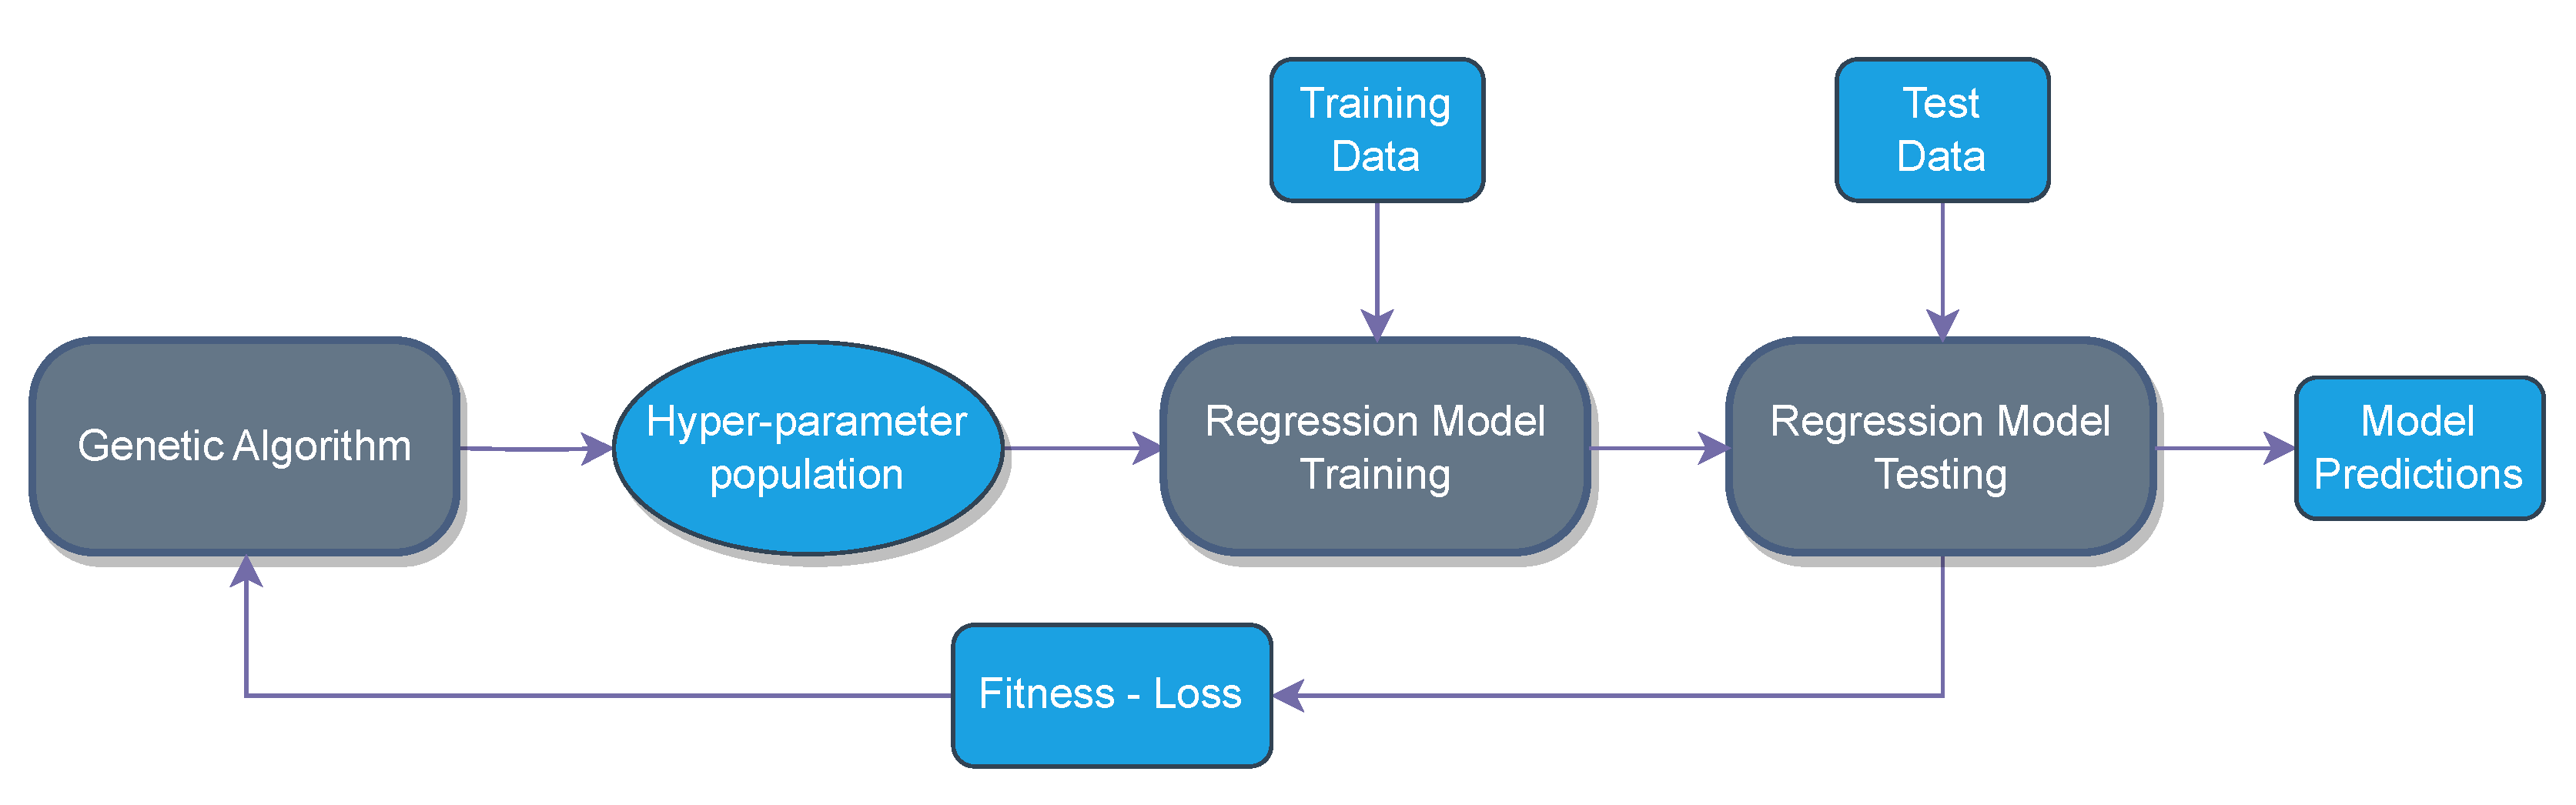
In Figure 3, we present the iterative process of training predictive models on the training data, evaluating their performance on the test data, and using the resulting loss as a fitness function for the GA. Subsequently, the GA generates new populations of hyperparameter combinations through crossover and mutation. This iterative process continues for a specified number of generations, aiming to converge on optimal hyperparameter configurations that improve model performance.
The following subsections provide a detailed breakdown of the utility that each part of the presented pipeline has.

3.3.1. Genetic Algorithm

The GA was employed for optimizing the hyperparameters of the models, with the population characteristics defined as follows:
  • Population Size: A population size of 100 individuals was selected for each generation. This choice aimed to strike a balance between exploring a diverse range of hyperparameter configurations and computational efficiency. A larger population size allows for a more comprehensive search of the hyperparameter space, increasing the chances of finding optimal solutions.
  • Mutation Probability: A mutation probability of 0.2 was set to introduce small random changes to the hyperparameters of individuals in the population. This probability ensures that the GA explores new regions of the hyperparameter space beyond the initially selected individuals. By incorporating mutation, the GA promotes exploration and prevents premature convergence to suboptimal solutions.
  • Crossover Probability: The crossover probability was set to 0.8, facilitating the exchange of hyperparameter characteristics between selected individuals during reproduction. Crossover enables the recombination of promising hyperparameter combinations, potentially leading to the discovery of better solutions. A higher crossover probability increases the chances of sharing beneficial hyperparameter traits between individuals in the population.
  • Number of Generations: The GA was executed for 10 generations, allowing the population to evolve and improve over time. This number of generations strikes a balance between allowing sufficient iterations for convergence and avoiding excessive computational time. By evolving the population over multiple generations, the GA refines the hyperparameter configurations toward more optimal solutions.
The population characteristics were carefully determined through experimentation, with the goals of attaining optimal results while ensuring computational efficiency. The specified GA was applied consistently to all the models. By defining these parameters, the GA efficiently explored the hyperparameter space, gradually converging toward optimal hyperparameter combinations that maximize the performance of the models.
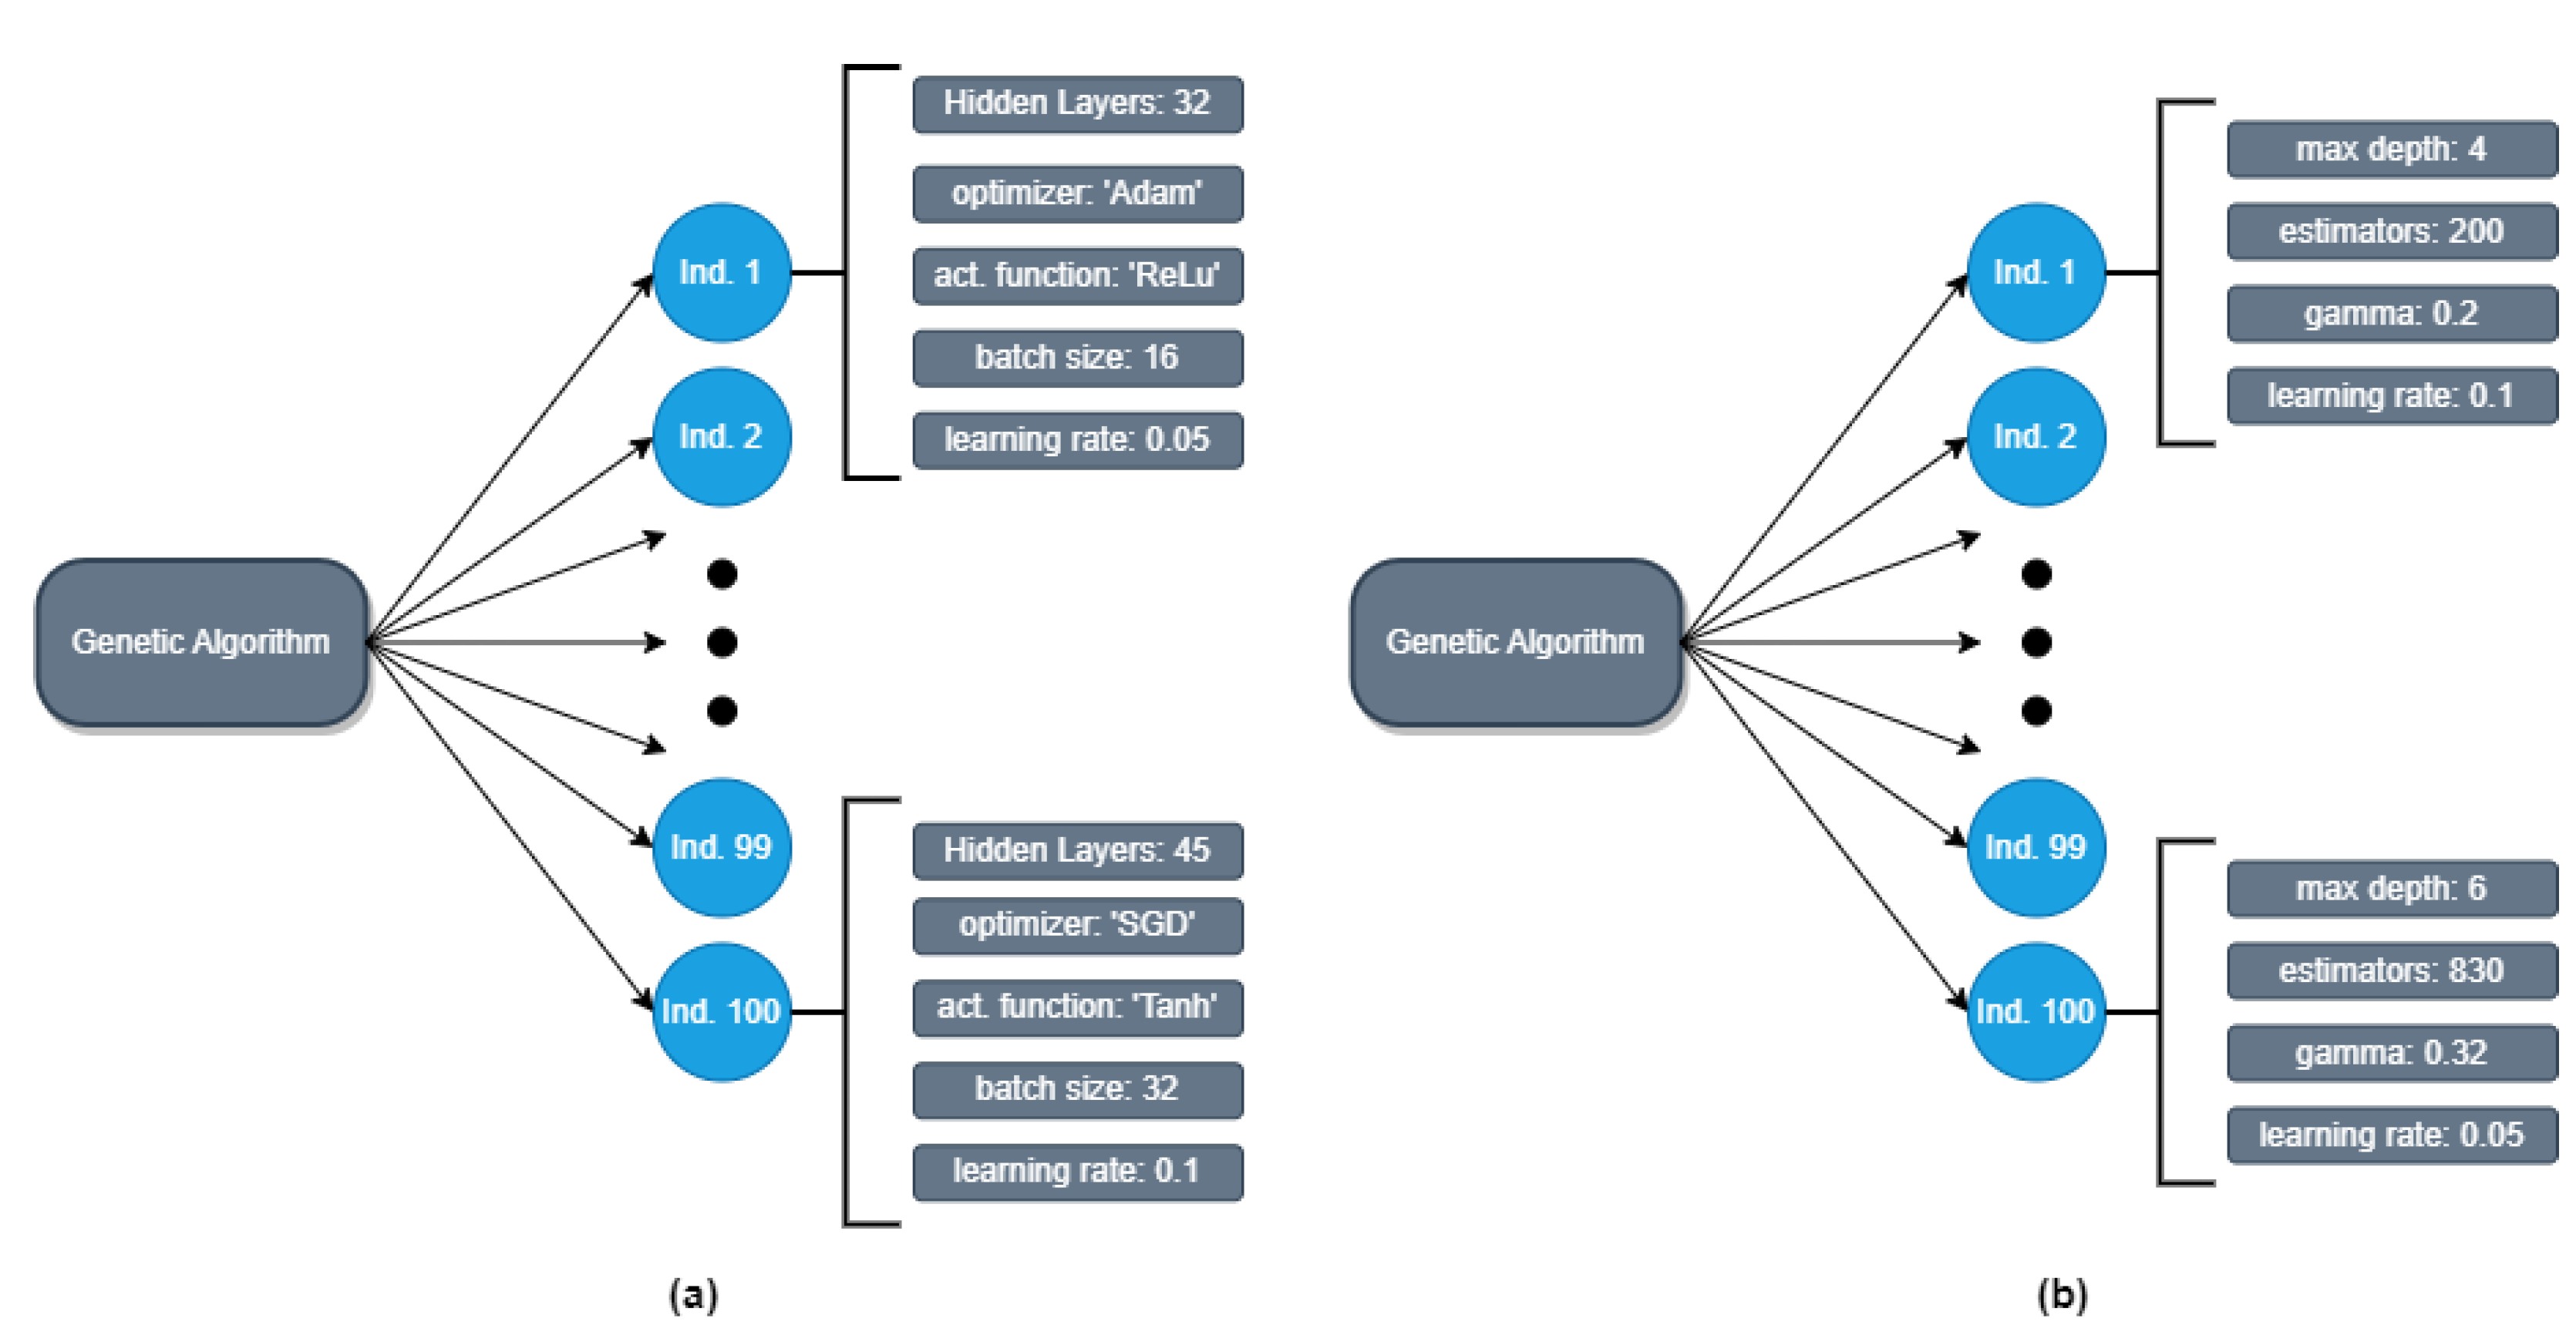
Figure 4 illustrates examples of the population generated by the GA and provides insights into the characteristics of selected individuals. These examples highlight the diverse hyperparameter configurations explored by the GA during its optimization process. By observing these individuals, we can showcase the range of hyperparameter values and combinations explored by the GA in its search for optimal solutions.
The genetic algorithm was executed to identify the optimal hyperparameters for all the models. Each model’s fitness function, derived from the loss function, guided the GA’s search for optimal hyperparameter combinations. The GA iteratively evolved the population over 10 generations, selecting individuals based on their fitness, performing crossover, and applying mutation to explore different hyperparameter configurations. The fittest individuals, which exhibited the lowest prediction error, were prioritized for reproduction, fostering the convergence of the population toward optimal solutions.
Following the GA optimization, a small grid search was conducted around the best hyperparameters obtained from the GA. This additional fine-tuning step aimed to further enhance the models’ performance by exploring neighboring values of the optimized hyperparameters. While the GA effectively explores a wide range of combinations, it may not exhaustively search the immediate vicinity of the best configuration found. The grid search involved systematically evaluating the performance of the models with slight variations in the identified hyperparameters, allowing us to identify potential performance gains that may not have been captured during the GA optimization process. By extensively exploring the range of parameters available, we ensured that the models were configured with the most optimal settings.

3.3.2. MLP Optimization

Each member of the population used for the MLP optimization process was represented by several hyperparameters that determined the model configuration. The population for the MLP fine-tuning contained the following hyperparameters:
  • Number of Layers: The number of hidden layers for the MLP architecture ranged from 1 to 50 in order to uncover the optimal network depth.
  • Optimizer: The choice of optimizer was restricted to stochastic gradient descent (SGD) and Adam.
  • Activation Function: The MLP architecture employed different activation functions, including rectified linear unit (ReLU), hyperbolic tangent (Tanh), logistic (Sigmoid), and identity.
  • Batch Size: The batch size for training varied between 4 and 128.
  • Learning Rate: The learning rate ranged from 0.01 to 0.1, providing a range of step sizes during model training.
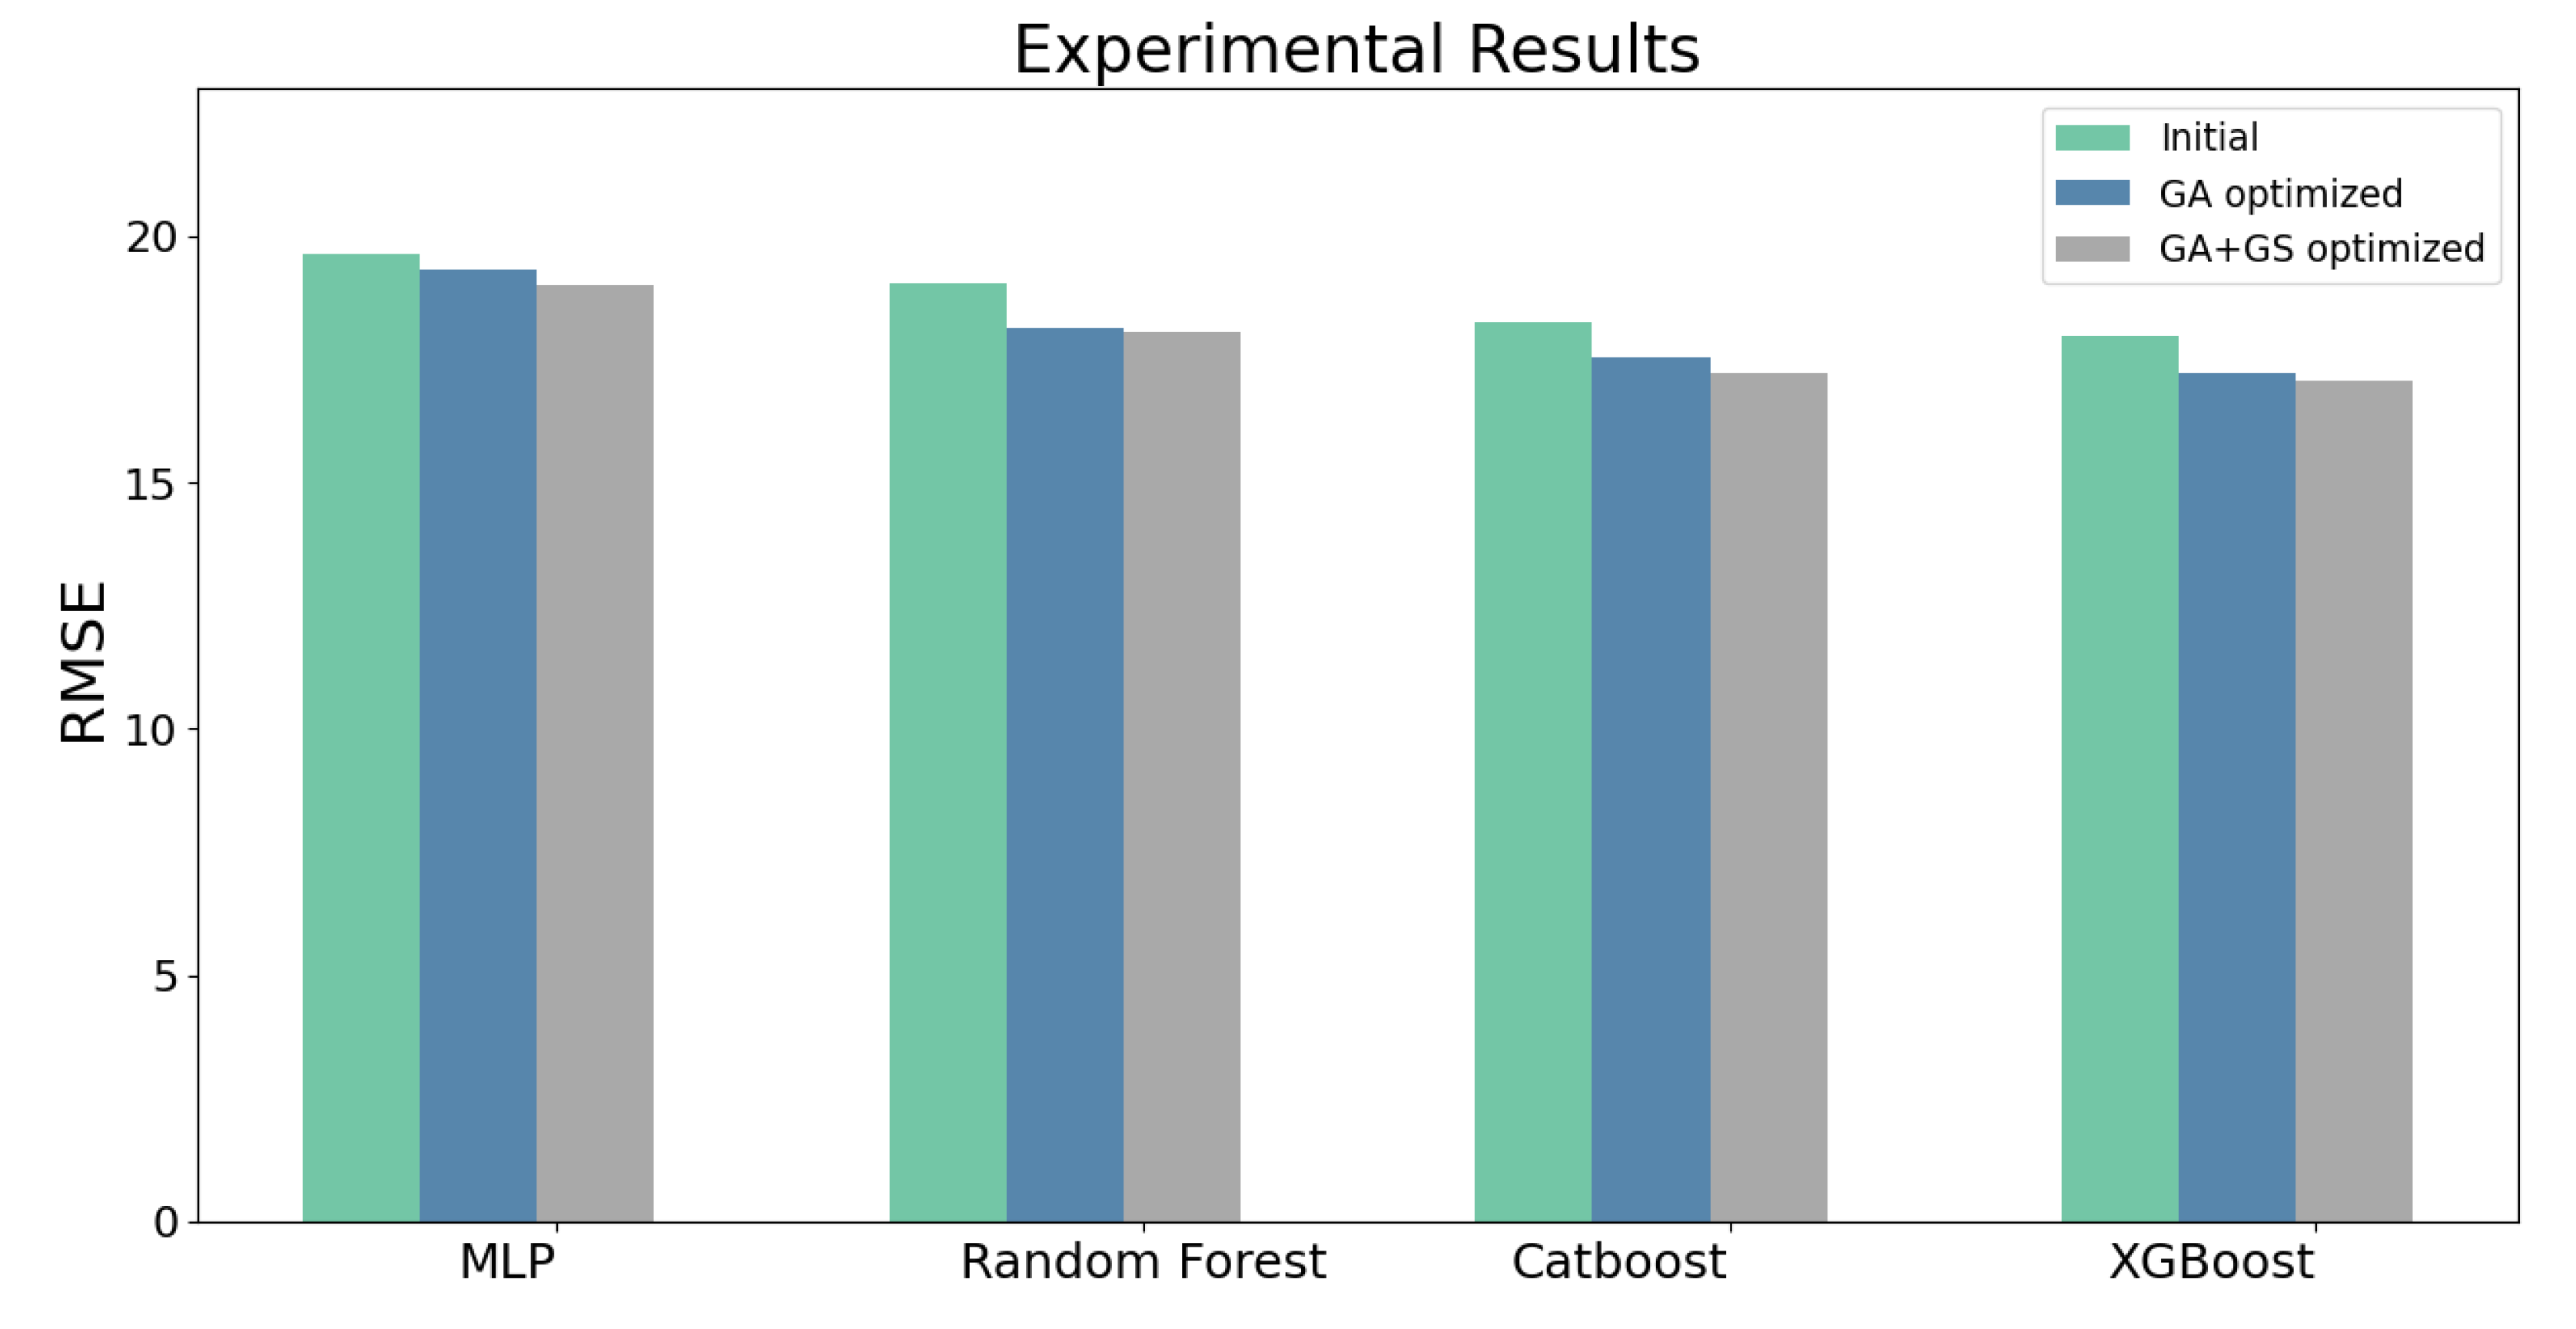
Table 3 summarizes the best hyperparameters obtained for the MLP architecture. The optimization techniques (GA and GA + GS) successfully identified optimal hyperparameter combinations for each architecture, leading to improved performance.

3.3.3. Random Forest Optimization

The optimization process for the random forest model involved the fine-tuning of several critical hyperparameters to enhance predictive performance. The selected hyperparameters for the random forest optimization included:
  • Minimum Samples Split: The minimum number of samples required to split an internal node in the random forest ranged from 2 to 10, aiming to control tree growth and overfitting.
  • Minimum Samples Leaf: The minimum number of samples required to form a leaf node varied between 1 and 5, influencing the granularity of tree structures.
  • Number of Estimators: The number of decision trees in the random forest ensemble was explored across a range from 50 to 1000.
  • Maximum Depth: The maximum depth of each tree in the ensemble spanned from 3 to 10, impacting the complexity of individual trees.
The hyperparameters fine-tuned through the optimization process for the random forest model are displayed in Table 4.

3.3.4. CatBoost Optimization

The hyperparameters selected for optimization in the fine-tuning of the CatBoost model include the following:
  • Number of Estimators: The number of trees in the CatBoost ensemble varied from 50 to 1000.
  • Maximum Depth: The maximum depth of each tree ranged from 3 to 10.
  • Learning Rate: The learning rate for boosting iterations ranged from 0.01 to 0.5.
  • L2 Regularization: The L2 regularization parameter, which controls the amount of regularization applied to the model, ranged from 1 to 10.
The outcomes of the optimization process for the CatBoost model are summarized in Table 5, showcasing the refined hyperparameters.

3.3.5. XGBoost Optimization

The hyperparameters selected for optimization in the fine-tuning of the XGBoost model include maximum depth, number of estimators, gamma, and learning rate:
  • Maximum Depth: The maximum depth of each tree ranged from 3 to 10.
  • Number of estimators: The number of trees in the XGBoost ensemble varied from 50 to 1000.
  • Gamma: The gamma parameter, controlling the minimum reduction in loss required for further partitioning, varied between 0.0 and 1.0.
  • Learning Rate: The learning rate for boosting iterations ranged from 0.01 to 0.1.
Table 6 showcases the final hyperparameters of the XGBoost model obtained through the optimization process.
In summary, the methodology employed a genetic algorithm to optimize the hyperparameters of various machine learning models. The GA leveraged a fitness function derived from the loss function to guide the search for optimal combinations. The optimized hyperparameters were then fine-tuned through a small grid search, allowing for further performance improvements. The subsequent sections present the experimental results and analyses, showcasing the performance enhancements achieved by the optimized models. All results presented in this study were obtained through 5-fold cross-validation.

4. Test

In this section, we present the outcomes and findings derived from our experimental analysis. To provide a well-rounded view of our experimentation, we also delve into the experimental setup that underpins our analysis, detailing the hardware and software configurations utilized for these assessments. The results include the performance evaluation of the different algorithms implemented and the performance assessment of the GA-optimized models, as well as the results of the GA and grid search optimization. These results provide information regarding the effectiveness and impact of the various techniques employed in our study, offering insights into their performance and potential for enhancing predictive accuracy.

4.1. Experimental Setup

The experiments were conducted on a system equipped with a 12th Gen Intel Core i5-12600 × 12 CPU (Intel Corporation, Santa Clara, CA, USA), 16 GB of RAM, and an NVIDIA GeForce RTX 3060 GPU (Nvidia Corporation, Santa Clara, CA, USA). The operating system used was Ubuntu 22.04.2 LTS. The experiments were implemented in Python, utilizing libraries and frameworks such as Scikit Learn 1.2.0, NumPy 1.23.5, XGBoost 1.7.3, and DEAP 1.3.3 for the genetic algorithms.

4.2. Results

Table 7 presents a summary of the results obtained for each model, displaying the corresponding RMSE values under three scenarios: models without any modifications, models enhanced using the GA, and models further refined through a combination of the GA and grid search.
The results obtained from the experiments provide valuable insights into the performance of the models. It is evident that applying the GA consistently led to significant improvements in all the models. However, when combining the GA with GS, even better results were achieved. The random forest exhibited the most notable improvement, with a 5.67% lower RMSE score from the initial experiment. Meanwhile, the XGBoost model, which secured the top performance, also experienced notable improvement, achieving a 5.11% decrease in RMSE score. These findings underscore the effectiveness of employing optimization techniques in enhancing the predictive performance of machine learning models, leading to more accurate and reliable predictions for the given task.
The XGBoost algorithm achieved the best performance in terms of the lowest RMSE score, outperforming the rest of the implemented methods. Specifically, the XGBoost algorithm obtained an RMSE score of 17.07, while the second-best model was the CatBoost, achieving an RMSE score of 17.22.
Figure 5 presents a bar plot illustrating the performance results of our models at different stages of hyperparameter optimization. The bars represent the RMSE achieved for each experiment conducted. The three sets of bars correspond to the initial model performance, the performance after GA optimization, and the further improvement achieved through GA + GS optimization.
For further analysis of our results, we also present a consolidated view of the final results achieved by our models. Figure 6 below provides a comprehensive visual representation of the performance of the models after optimization.
The combined scatter plots depict the predictive capabilities of the models, attained through optimization, with XGBoost demonstrating a slightly superior performance, followed closely by CatBoost. While outliers present some difficulties for all models, they are outweighed by the overall performance enhancements achieved through optimization. This analysis reinforces the efficacy of our methodology in elevating model performance, and suggests the potential of XGBoost to offer reliable forecasting predictions even in complex scenarios.

5. Conclusions

The COVID-19 pandemic has had a significant impact on businesses and economies worldwide. This study focuses on forecasting the price of consumer services during the pandemic using machine learning techniques and optimization algorithms. We utilized various machine learning models and applied a GA to optimize their hyperparameters.
The findings indicate that genetic algorithms significantly improve the performance of the models, resulting in more accurate predictions of service price evolution. This suggests that genetic algorithms are effective in identifying optimal hyperparameter configurations that contribute to better model generalization and prediction accuracy. Among the models compared, XGBoost exhibited the best performance, with an RMSE of 17.07, indicating the strength of its ensemble learning approach.
The integration of survey responses from managers not only adds empirical validation to our predictive models but also lays the groundwork for a comprehensive framework for accurate consumer service price forecasting. This fusion enriches the analysis by infusing real-world perspectives into our predictive models, thereby enhancing their practical relevance. Moreover, this research underscores the potential of integrating diverse data sources and utilizing advanced optimization techniques within the predictive modeling paradigm. This approach demonstrates its promise in enhancing prediction accuracy and model generalization. Importantly, these findings set the stage for future research that could yield insights with implications for business strategies and policy formulation. By doing so, this work opens avenues for stakeholders to draw upon valuable insights and make well-informed decisions amid the dynamic landscape of market conditions. To the best of our understanding, this study represents a pioneering effort in developing a comprehensive forecasting framework tailored to predict consumer service prices. Through the integration of diverse data dimensions and the application of advanced optimization methods, this research builds upon previous investigations. This unique approach positions our work as a meaningful step toward bridging the gap between predictive modeling and the intricate dynamics of real-world consumer service pricing.
However, it is important to acknowledge the limitations of our study. The data used only span up to November 2020, potentially missing the full extent of the pandemic’s impact. Additionally, the exclusion of external factors such as geopolitical events and policy changes could limit the comprehensive understanding of observed effects. Moreover, the study’s focus on the European Union and specific sectors may restrict the generalizability of findings to other regions, industries, and populations.
In summary, this study contributes to the field of business modeling and forecasting during the COVID-19 pandemic. The results underscore the effectiveness of employing advanced analytical tools, such as neural networks and genetic algorithms, to navigate the challenges imposed by this unprecedented crisis. The XGBoost model’s superior performance further highlights the importance of considering boosting algorithms for tackling complex regression tasks.
In regard to future research, there are several avenues to further enhance the study’s predictive performance and gain a deeper understanding of how a public health crisis impacts the economy. One key direction is to further expand the dataset by incorporating additional data sources. Utilizing mobility data, vaccination rates, and government policies could offer valuable insights into the complex interplay between public health measures and economic indicators. Additionally, the type of currency used, inflation rates across different countries, the political regime in place, population density, and the age distribution of the population can contribute to more robust models. Furthermore, temporal analysis can be extended beyond November 2020 to capture the evolving effects of the pandemic over a longer period. This extended timeframe would enable the development of a more robust predictive model, enhancing its capabilities to effectively generalize and make accurate predictions on unseen data. Exploring other state-of-the-art predictive models could also be a valuable approach for future research. Adopting advanced machine learning algorithms and methodologies may provide additional perspectives and opportunities to improve the accuracy and interpretability of predictions. By exploring these potential directions for future research, we can deepen our understanding of how public health crises impact the economy and pave the way for more informed strategies to address such challenges effectively.

Author Contributions

T.P. and G.B., state of the art; T.P., methodology; T.P., software; T.P., I.K., G.B. and C.M.-N., validation of results; T.P., I.K. and G.B., formal analysis; T.P. and G.B., writing—original draft preparation; T.P., I.K., G.B., N.I.D. and C.M.-N., writing—review and editing; T.P., I.K., G.B., N.I.D. and C.M.-N., visualization; N.I.D., C.M.-N. and C.M., supervision. All authors have read and agreed to the published version of the manuscript.

Funding

This research received no external funding.

Data Availability Statement

Not applicable.

Conflicts of Interest

The authors declare no conflict of interest.

Abbreviations

The following abbreviations are used in this manuscript:
COVID-19Coronavirus Disease 2019
SARSSevere Acute Respiratory Syndrome
H1N1Influenza A virus subtype H1N1
WHOWorld Health Organization
EUEuropean Union
GAGenetic Algorithm
MLPMultilayer Perceptron
GSGrid Search
ReLURectified Linear Unit
TanhHyperbolic Tangent
RMSERoot Mean Square Error
SGDStochastic Gradient Descent

References

  1. Taya-Acosta, E.A.; Barraza-Vizcarra, H.M.; de Jesus Ramirez-Rejas, R.; Taya-Osorio, E. Academic Performance Evaluation Using Data Mining in Times of Pandemic: Relationship between Access to the Virtual Classroom and Grades of University Students. TECHNO REV. Int. Technol. Sci. Soc. Rev./Rev. Int. Tecnol. Cienc. Soc. 2022, 11, 89–106. [Google Scholar] [CrossRef]
  2. Hall, H. The effect of the COVID-19 pandemic on healthcare workers’ mental health. JAAPA 2020, 33, 45–48. [Google Scholar] [CrossRef]
  3. Dale, R.; O’Rourke, T.; Humer, E.; Jesser, A.; Plener, P.L.; Pieh, C. Mental health of apprentices during the COVID-19 pandemic in Austria and the effect of gender, migration background, and work situation. Int. J. Environ. Res. Public Health 2021, 18, 8933. [Google Scholar] [CrossRef]
  4. Huremović, D. Brief history of pandemics (pandemics throughout history). In Psychiatry of Pandemics: A Mental Health Response to Infection Outbreak; Springer: Cham, Switzerland, 2019; pp. 7–35. [Google Scholar]
  5. Moosavi, J.; Fathollahi-Fard, A.M.; Dulebenets, M.A. Supply chain disruption during the COVID-19 pandemic: Recognizing potential disruption management strategies. Int. J. Disaster Risk Reduct. 2022, 75, 102983. [Google Scholar] [CrossRef] [PubMed]
  6. Kaye, A.D.; Okeagu, C.N.; Pham, A.D.; Silva, R.A.; Hurley, J.J.; Arron, B.L.; Sarfraz, N.; Lee, H.N.; Ghali, G.E.; Gamble, J.W.; et al. Economic impact of COVID-19 pandemic on healthcare facilities and systems: International perspectives. Best Pract. Res. Clin. Anaesthesiol. 2021, 35, 293–306. [Google Scholar] [CrossRef]
  7. Lund, S.; Ellingrud, K.; Hancock, B.; Manyika, J.; Dua, A. Lives and Livelihoods: Assessing the Near-Term Impact of COVID-19 on US Workers; McKinsey Global Institute: New York, NY, USA, 2020; pp. 1–10. [Google Scholar]
  8. Fairlie, R.; Fossen, F.M. The early impacts of the COVID-19 pandemic on business sales. Small Bus. Econ. 2022, 58, 1853–1864. [Google Scholar] [CrossRef]
  9. Swagel, P. CBO’s Current Projections of Output, Employment, and Interest Rates and a Preliminary Look at Federal Deficits for 2020 and 2021; Congressional Budget Office: Washington, DC, USA, 2020. [Google Scholar]
  10. Jomo, K.S.; Chowdhury, A. COVID-19 pandemic recession and recovery. Development 2020, 63, 226–237. [Google Scholar] [CrossRef] [PubMed]
  11. Bloom, N.; Bunn, P.; Mizen, P.; Smietanka, P.; Thwaites, G. The impact of COVID-19 on productivity. Rev. Econ. Stat. 2020, 1–45. [Google Scholar] [CrossRef]
  12. Donthu, N.; Gustafsson, A. Effects of COVID-19 on business and research. J. Bus. Res. 2020, 117, 284–289. [Google Scholar] [CrossRef]
  13. World Health Organization. WHO COVID-19 Dashboard. 2020. Available online: https://covid19.who.int/ (accessed on 20 February 2023).
  14. European Commission. The Joint Harmonised EU Programme of Business and Consumer Surveys—User Guide; Directorate-General for Economic and Financial Affairs: Brussels, Belgium; Luxembourg, 2020. [Google Scholar]
  15. Craven, M.; Liu, L.; Mysore, M.; Wilson, M. COVID-19: Implications for Business; McKinsey & Company: New York, NY, USA, 2020; Volume 8. [Google Scholar]
  16. Nguyen, H.K. Application of mathematical models to assess the impact of the COVID-19 pandemic on logistics businesses and recovery solutions for sustainable development. Mathematics 2021, 9, 1977. [Google Scholar] [CrossRef]
  17. Safi, S.K.; Sanusi, O.I.; Tabash, M.I. Forecasting the impact of COVID-19 epidemic on China exports using different time series models. Adv. Decis. Sci. 2022, 26, 102–127. [Google Scholar]
  18. Suanpang, P.; Jamjuntr, P. A comparative study of deep learning methods for time-series forecasting tourism business recovery from the COVID-19 pandemic crisis. J. Manag. Inf. Decis. Sci. 2021, 24, 1–10. [Google Scholar]
  19. Safara, F. A computational model to predict consumer behaviour during COVID-19 pandemic. Comput. Econ. 2022, 59, 1525–1538. [Google Scholar] [CrossRef] [PubMed]
  20. Semaa, H.; Alaoui, S.S.; Farhaoui, Y.; Aksasse, B.; Mousrij, A.; Hou, M.A. Modeling Financial Supply Chain Planning Under COVID-19 Conditions for Working Capital Optimization Through Genetic Algorithm: A Real Case Study. Int. J. Appl. Metaheuristic Comput. 2022, 13, 1–23. [Google Scholar] [CrossRef]
  21. Gkikas, D.C.; Theodoridis, P.K.; Beligiannis, G.N. Enhanced Marketing Decision Making for Consumer Behaviour Classification Using Binary Decision Trees and a Genetic Algorithm Wrapper. Informatics 2022, 9, 45. [Google Scholar] [CrossRef]
  22. Weng, F.; Zhang, H.; Yang, C. Volatility forecasting of crude oil futures based on a genetic algorithm regularization online extreme learning machine with a forgetting factor: The role of news during the COVID-19 pandemic. Resour. Policy 2021, 73, 102148. [Google Scholar] [CrossRef]
  23. Hoa, N.T.X.; Anh, V.H.; Anh, N.Q.; Ha, N.D.V. Optimization of the transportation problem in the COVID pandemic with time-window vehicle routing problem. In Proceedings of the International Conference on Emerging Challenges: Business Transformation and Circular Economy (ICECH 2021), Ninh Binh, Vietnam, 5–6 November 2021; Atlantis Press: Amsterdam, The Netherlands, 2021; pp. 237–245. [Google Scholar]
  24. Chaves-Maza, M.; Martel, E.M.F. Entrepreneurship support ways after the COVID-19 crisis. Entrep. Sustain. Issues 2020, 8, 662. [Google Scholar] [CrossRef]
  25. Romani, D.D.; Nasution, D.; Syahputra, A.; Usman, U.; Prayitno, H. Artificial Neural Network Model in Forecasting Post-COVID-19 Aviation Business Development Using Multi Layer Perceptron (MLP). Bp. Int. Res. Critics Inst. J. 2021, 4, 13189–13199. [Google Scholar]
  26. Vărzaru, A.A.; Bocean, C.G.; Cazacu, M. Rethinking tourism industry in pandemic COVID-19 period. Sustainability 2021, 13, 6956. [Google Scholar] [CrossRef]
  27. Jalali, S.M.J.; Ahmadian, S.; Khosravi, A.; Shafie-khah, M.; Nahavandi, S.; Catalão, J.P. A novel evolutionary-based deep convolutional neural network model for intelligent load forecasting. IEEE Trans. Ind. Inform. 2021, 17, 8243–8253. [Google Scholar] [CrossRef]
  28. Wang, X.; Hu, T.; Tang, L. A multiobjective evolutionary nonlinear ensemble learning with evolutionary feature selection for silicon prediction in blast furnace. IEEE Trans. Neural Netw. Learn. Syst. 2021, 33, 2080–2093. [Google Scholar] [CrossRef] [PubMed]
  29. Neshat, M.; Nezhad, M.M.; Abbasnejad, E.; Mirjalili, S.; Groppi, D.; Heydari, A.; Tjernberg, L.B.; Garcia, D.A.; Alexander, B.; Shi, Q.; et al. Wind turbine power output prediction using a new hybrid neuro-evolutionary method. Energy 2021, 229, 120617. [Google Scholar] [CrossRef]
  30. Arora, P.; Jalali, S.M.J.; Ahmadian, S.; Panigrahi, B.; Suganthan, P.; Khosravi, A. Probabilistic Wind Power Forecasting Using Optimized Deep Auto-Regressive Recurrent Neural Networks. IEEE Trans. Ind. Inform. 2022, 19, 2814–2825. [Google Scholar] [CrossRef]
  31. SaiSindhuTheja, R.; Shyam, G.K. An efficient metaheuristic algorithm based feature selection and recurrent neural network for DoS attack detection in cloud computing environment. Appl. Soft Comput. 2021, 100, 106997. [Google Scholar] [CrossRef]
  32. Wang, X.; Wang, Y.; Tang, L.; Zhang, Q. Multi-Objective Ensemble Learning with Multi-Scale Data for Product Quality Prediction in Iron and Steel Industry. IEEE Trans. Evol. Comput. 2023. [Google Scholar] [CrossRef]
  33. Raji, I.D.; Bello-Salau, H.; Umoh, I.J.; Onumanyi, A.J.; Adegboye, M.A.; Salawudeen, A.T. Simple deterministic selection-based genetic algorithm for hyperparameter tuning of machine learning models. Appl. Sci. 2022, 12, 1186. [Google Scholar] [CrossRef]
  34. Borisov, V.; Leemann, T.; Seßler, K.; Haug, J.; Pawelczyk, M.; Kasneci, G. Deep neural networks and tabular data: A survey. IEEE Trans. Neural Netw. Learn. Syst. 2022, 1–21. [Google Scholar] [CrossRef]
  35. Papadopoulos, T.; Kosmas, I.J.; Nikolaidou, M.; Michalakelis, C. Forecasting Consumer Service Prices during the Coronavirus Pandemic Using Neural Networks: The Case of Transportation, Accommodation and Food Service Sections across EU. In Proceedings of the International Conference Economies of the Balkan and Eastern European Countries, Florence, Italy, 20–22 May 2022; Springer: Cham, Switzerland, 2022; pp. 333–357. [Google Scholar]
  36. Mirjalili, S.; Mirjalili, S. Genetic algorithm. In Evolutionary Algorithms and Neural Networks: Theory and Applications; Springer: Cham, Switzerland, 2019; pp. 43–55. [Google Scholar]
  37. Holland, J.H. Genetic algorithms. Sci. Am. 1992, 267, 66–73. [Google Scholar] [CrossRef]
  38. Sagi, O.; Rokach, L. Ensemble learning: A survey. Wiley Interdiscip. Rev. Data Min. Knowl. Discov. 2018, 8, e1249. [Google Scholar] [CrossRef]
  39. Popescu, M.C.; Balas, V.E.; Perescu-Popescu, L.; Mastorakis, N. Multilayer perceptron and neural networks. WSEAS Trans. Circuits Syst. 2009, 8, 579–588. [Google Scholar]
  40. Chen, T.; Guestrin, C. XGBoost: A scalable tree boosting system. In Proceedings of the 22nd ACM SIGKDD International Conference on Knowledge Discovery and Data Mining, San Francisco, CA, USA, 13–17 August 2016; pp. 785–794. [Google Scholar]
  41. Breiman, L. Random forests. Mach. Learn. 2001, 45, 5–32. [Google Scholar] [CrossRef]
  42. Prokhorenkova, L.; Gusev, G.; Vorobev, A.; Dorogush, A.V.; Gulin, A. CatBoost: Unbiased boosting with categorical features. Adv. Neural Inf. Process. Syst. 2018, 31, 6638–6648. [Google Scholar]
Figure 1. Line plots of COVID-19 data contained in the dataset for 5 sample countries.
Electronics 12 03806 g001
Figure 2. Histogram of E B A L t for the expectations of service price evolution in the dataset. The x-axis represents the estimated change in price values, while the y-axis indicates the frequency of occurrence.
Electronics 12 03806 g002
Figure 3. Visual representation of the core steps involved in the hyperparameter-tuning pipeline using a GA.
Electronics 12 03806 g003
Figure 4. Example populations generated by the GA. Each node represents an individual within the population, with each subfigure corresponding to a different optimization process. (a) demonstrates the MLP optimization population, while (b) demonstrates the XGBoost optimization population. The highlighted nodes in each subfigure depict example characteristics of individual configurations.
Electronics 12 03806 g004
Figure 5. This figure provides a visualization of the experimental results produced by each different pipeline with a comparison of the optimization techniques used.
Electronics 12 03806 g005
Figure 6. In this figure, scatter plots of the different models’ predictions are shown.
Electronics 12 03806 g006
Table 1. Entries of data per business sub-sector.
Sub-SectorNumber of Entries
Accommodation278
Land transport and transport via pipelines278
Food and Beverage service activities278
Warehousing and support activities for transportation267
Postal and courier activities198
Water transport169
Air transport158
Table 2. Dataset features used as input.
FeatureDescription
CountryBusiness country of origin
Country Economic SizeClassification of country’s economy size into small, medium, large
PopulationPopulation of the country
Land AreaLand area of country
New CasesNew cases in the month of data entry
New DeathsNew deaths in the month of data entry
Cases/1 million of populationNormalized cases per million of population
Deaths/1 million of populationNormalized deaths per million of population
Services sub-sectorsSub-sector of current business
Q1Business situation development over the past 3 months
Q2Evolution of the demand over the past 3 months
Q3Expectation of the demand over the next 3 months
Q4Evolution of the employment over the past 3 months
Q5Expectations of the employment over the next 3 months
Confidence Indicator(Q1 + Q2 + Q3)/3
Table 3. MLP best parameters.
OptimizationLayersLearning RateActivation FunctionOptimizerBatch Size
GA480.081ReLUAdam39
GA + GS460.081ReLUAdam36
Table 4. Random forest best parameters.
OptimizationMax DepthEstimator NumberMin. Samples SplitMin. Samples Leaf
GA929224
GA + GS929522
Table 5. CatBoost best parameters.
OptimizationMax DepthEstimator NumberLearning RateL2 Regularization
GA56030.1340.5
GA + GS56010.1440.5
Table 6. XGBoost best parameters.
OptimizationMax DepthEstimator NumberLearning RateGamma
GA69690.034660.3315
GA + GS69600.037660.3515
Table 7. Experimental results of each pipeline for different stages of optimization.
ModelInitial RMSEGA-Optimized RMSEGA- and GS-Optimized RMSEPercentage Improvement
MLP19.6519.3118.993.35%
Random Forest19.0318.1318.055.15%
Catboost18.2617.5517.225.67%
XGBoost17.9917.2317.07 15.11%
1 Among the models compared, the XGBoost algorithm exhibited the best performance.
Disclaimer/Publisher’s Note: The statements, opinions and data contained in all publications are solely those of the individual author(s) and contributor(s) and not of MDPI and/or the editor(s). MDPI and/or the editor(s) disclaim responsibility for any injury to people or property resulting from any ideas, methods, instructions or products referred to in the content.

