Article

Development of a Hybrid Method for Multi-Stage End-to-End Recognition of Grocery Products in Shelf Images

1
Computer Engineering Department, Istanbul Arel University, Buyukcekmece, 34537 Istanbul, Turkey
2
Computer Engineering Department, Istanbul Bilgi University, Eyupsultan, 34060 Istanbul, Turkey
3
Computer Engineering Department, Yildiz Technical University, Davutpasa, 34220 Istanbul, Turkey
*
Author to whom correspondence should be addressed.
Electronics 2023, 12(17), 3640; https://doi.org/10.3390/electronics12173640
Submission received: 21 July 2023 / Revised: 18 August 2023 / Accepted: 24 August 2023 / Published: 29 August 2023
(This article belongs to the Special Issue Application of Machine Learning in Graphics and Images)

Abstract

:
Product recognition on grocery shelf images is a compelling task of object detection because of the similarity between products, the presence of the different scale of product sizes, and the high number of classes, in addition to constantly renewed packaging and added new products’ difficulty in data collection. The use of conventional methods alone is not enough to solve a number of retail problems such as planogram compliance, stock tracking on shelves, and customer support. The purpose of this study is to achieve significant results using the suggested multi-stage end-to-end process, including product detection, product classification, and refinement. The comparison of different methods is provided by a traditional computer vision approach, Aggregate Channel Features (ACF) and Single-Shot Detectors (SSD) are used in the product detection stage, and Speed-up Robust Features (SURF), Binary Robust Invariant Scalable Key points (BRISK), Oriented Features from Accelerated Segment Test (FAST), Rotated Binary Robust Independent Elementary Features (BRIEF) (ORB), and hybrids of these methods are used in the product classification stage. The experimental results used the entire Grocery Products dataset and its different subsets with a different number of products and images. The best performance was achieved with the use of SSD in the product detection stage and the hybrid use of SURF, BRISK, and ORB in the product classification stage, respectively. Additionally, the proposed approach performed comparably or better than existing models.

1. Introduction

Computer vision approaches are used to find solutions for many real-world problems, such as object recognition, object detection, and object segmentation in different areas. Currently, there are numerous methods offering a promising performance for the technical requirements of the aforementioned problems applied to specific implementation areas. Among these issues, product recognition and detection in the shelf images of grocery products is an important computer vision problem with wide research efforts from both academic and industrial points of view.
The role of an automatic product recognition system is to find the location and class of products on a given shelf image from groceries. A hybrid method for the multi-stage end-to-end recognition of grocery products in shelf images was offered in this study. The process of product recognition begins with the product detection; then, the process classifies products and, finally, concludes with refinement. An automatic product recognition system offers numerous benefits to producers, suppliers, and customers. On the producers’ side, producers desire their products to be properly placed in the markets shelves according to the layout (planogram). According to the results of [1], sales rose by 7.8% and profit rose by 8.1% within two weeks when the optimized planogram was perfectly matched. To ensure the planogram compliance, the general procedure is manually controlled by employees by confirming the compatibility of the photos taken in the markets with the planogram at regular intervals. However, this manual process is prone to human mistake and needs non-negligible person-hours. On the suppliers’ side, automatic product recognition is useful for stock tracking, the replenishment of inventory, and planogram compliance. In particular, the necessary information for the management of supermarkets is provided in real time. The obtained information from an automatic product recognition system makes it possible to increase sales by identifying the products that are out of stock or misplaced and improving the customer experience by analyzing the shopping patterns. The research about out-of-stocks [2] also shows that 31% of the customers who cannot find the requested item on the shelf buy the same product from another grocery store, 22% buy the different brand of the same product, and 11% give up the product when they cannot find it. On the customers’ side, a successful product recognition system makes it possible for customers find the product they are looking for faster, to obtain help with in-market navigation, and to make price comparisons easier. It also provides a more comfortable shopping experience for visually impaired customers. When evaluated in terms of all stakeholders, product recognition creates a solution that saves time, increases sales [1], and increases customer satisfaction [3]. However, product recognition has specific challenges to handle, as shown in Figure 1. In addition to the familiar computer vision difficulties (scene complexity, blurring, irregular lighting conditions, different viewing angle, etc.), other significant challenges are also encountered in recognizing the products on the grocery shelves, such as different shelf designs, different product sizes, constantly changing product packaging, high packaging design similarity among different product types, and the high number of product classes. Therefore, an effective product recognition system is required to obtain a satisfactory performance for all different parties benefiting from such an approach.
In this paper, the problem of product recognition on grocery shelf images is considered; the algorithm takes a shelf image as input and accordingly returns localization and labels of all predefined products in the image. The proposed multi-stage process handles the above-mentioned challenges using a product-independent detection process and different scale, rotation, and affine invariant feature extraction methods together. The algorithm has three main steps. The stage of product detection finds the localization of each existing product in the image with three different methods: a proposed traditional computer vision approach, the Aggregate Channel Features (ACF) [4] detector, and the Single-Shot Detector (SSD) [5]. The stage of product classification matches the product templates and product detection results with more appropriate feature extraction methods, such as Speed-up Robust Features (SURF) [6], Binary Robust Invariant Scalable Key points (BRISK) [7], Oriented Features from Accelerated Segment Test (FAST), and Rotated Binary Robust Independent Elementary Features (BRIEF) (ORB) [8], as well as a hybrid usage of SURF, BRISK, and ORB. At the third stage, refinement produces the final result by improving the classification result and localizations with the clustering algorithm. The entire Grocery Products [9] dataset and its subsets (GP-20 [10], GP-181 [11]) are used for testing these methods. Additionally, a training set is created from the Grocery Dataset [12], and the subset of SKU-110K [13] is used for the training of ACF [4] and SSD [5].
Figure 1. Sample images representing the challenges of grocery product recognition problem: (a,b) different viewing angle shelf image in SKU-110K [13]. (c) Blurred shelf image in grocery products [9]. (d,e) Different shelf design images in SKU-110K [13]. (f) Cluttered background shelf image in SKU-110K [13]. (g,h) Product images having high packaging design similarity among different product types in grocery products [9].
Electronics 12 03640 g001
The contributions of this study compared to the existing literature, summarized in Section 2 are three-fold:
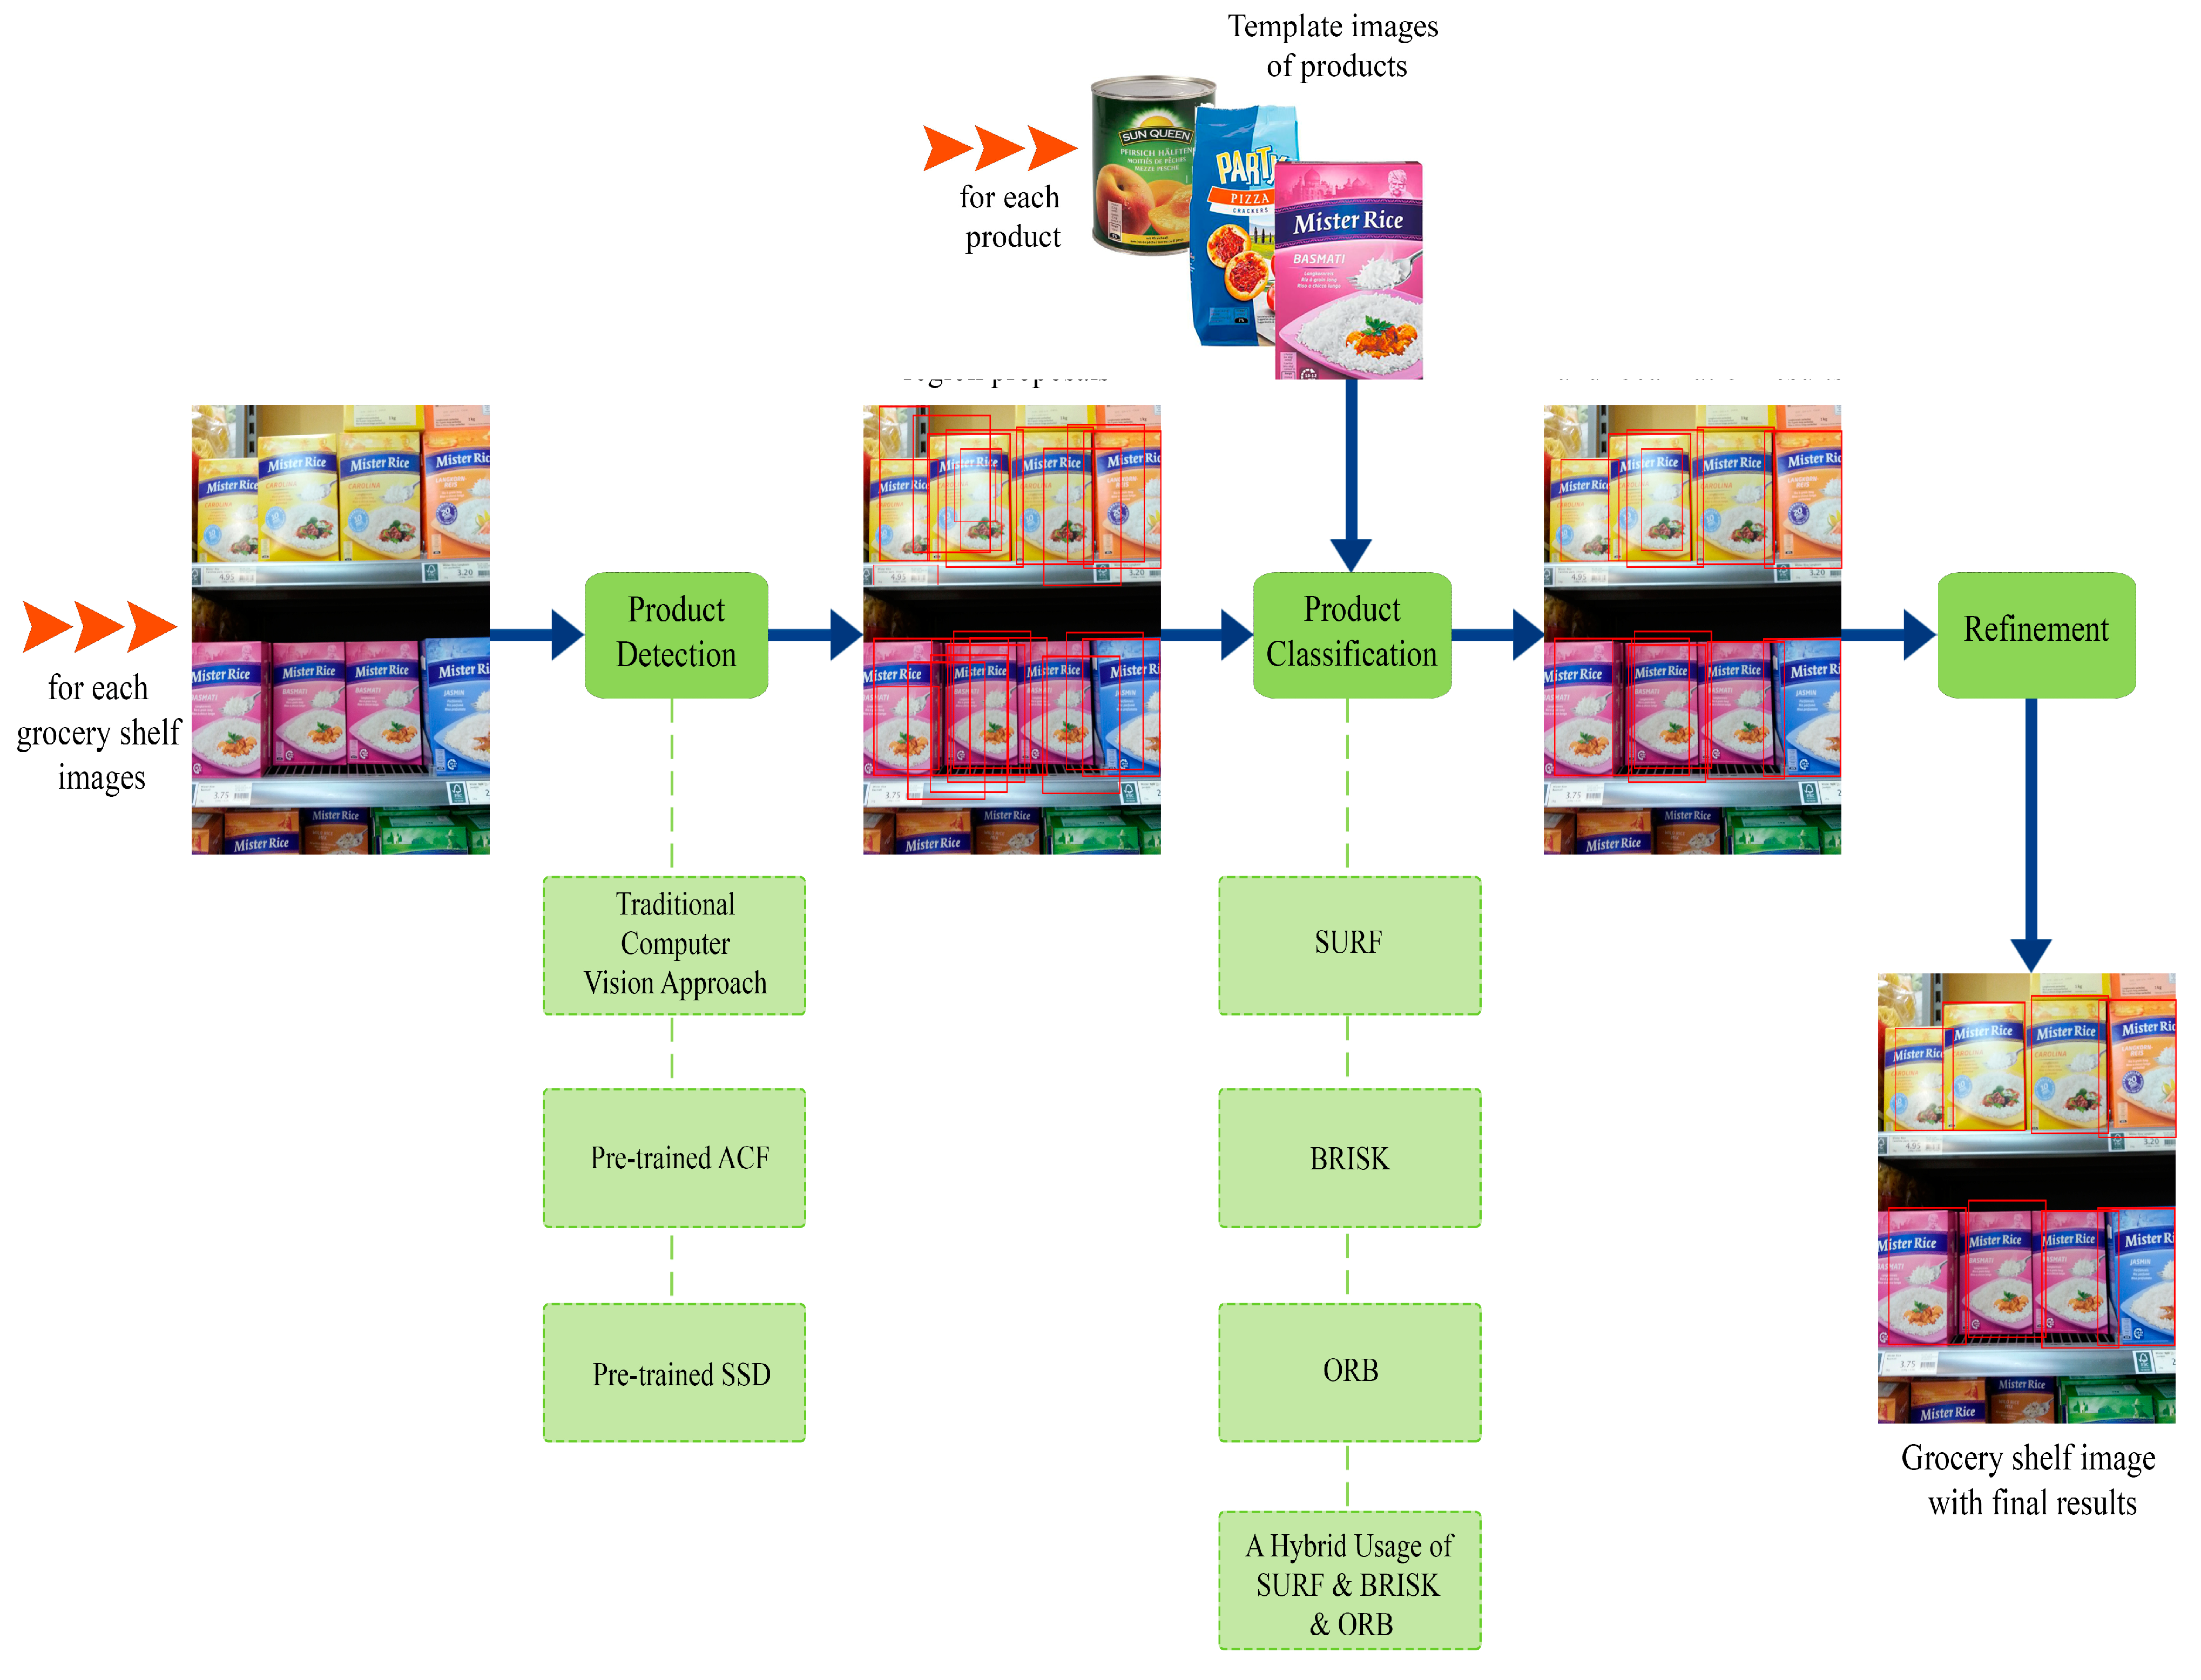
  • A new sequential approach, including a product-independent detection process and a hybrid product recognition concept enhanced by a refinement procedure, is presented to handle a wide variety of products such as constantly renewed packaging and newly added products in grocery products.
  • A model in which different feature extraction methods are used together is proposed, since different methods provide better results in different products due to the wide variety of products. Therefore, a combination of these methods can be more promising for such an application.
  • The performance of the proposed approach in product recognition is compared with the different methods presented in the product detection and classification stages. In addition, run-time evaluation is included to show that the performance and run-time the proposed system is balanced.
The rest of the article consists of the following sections: Section 2 introduces the existing studies related to product recognition. Section 3 details the multi-stage recognition process and used methods. Section 4 presents the information of datasets and shows the experimental results of the proposed methods on these datasets. Finally, Section 5 gives the concluding remarks of the study.

2. Related Works

Several solutions have been proposed in the literature to solve in-store problems such as planogram matching, product recognition, and stock tracking. The most widely used, barcode [14,15] and Radio Frequency Identification (RFID) tags [16,17,18,19], provide solutions with some limitations. The systems using barcodes have some drawbacks due to the limited visibility, openness to environmental damage, and human error [20]. On the RFID side, problems such as the high cost of RFID tags, sensitivity to environmental conditions, data security, and information collisions are encountered [21]. With the need for new approaches, the increase in the ease of data collection and the decrease in the costs of data storage and processing have led to an increase in the use of traditional computer vision and deep learning methods instead of such hardware-based solutions. Alternative algorithms for product recognition in shelf images have been presented using different computer vision and deep learning methods. As shown in Table 1, in addition to the studies that deal with this problem as a whole [22,23,24,25,26], there are also studies [12,13,27,28,29,30,31,32,33,34] that have brought separate solutions to different parts of the problem and combined them [10,11,35]. In addition, there are also studies [36,37] that have attempted to solve the product recognition problem by recognizing the text on the product instead of recognizing it from the features of the image. On the other hand, the product recognition problem on the market shelves is also an object detection and object recognition problem. Therefore, the recent methods [38,39,40] that have been applied and proven successful in various areas can solve the different stages of product recognition problem on the grocery shelf images. For the product detection part, methods such as the immune coordination deep network [38] and the immune extreme region-based target extraction algorithm [39] may be useful, while methods such as multiple kernel k-means [40] may also contribute to the refinement stage.

2.1. Three-Stage Non-End-to-End Product Recognition

The performance of a product recognition system depends to the solutions to three main problems: shelf detection, product detection, and product classification. The detection of shelf lines in shelf images has a performance-enhancing effect in terms of both searching for the product in a more limited area and eliminating products detected in the wrong area. Previous studies [27,29] have dealt with the problem of shelf detection on the Grocery Dataset [12]. The authors of [27] reached 83.4% accuracy on 229 shelf images with Hough Transform, and [29] achieved 99.03% accuracy on 350 shelf images using the Gaussian Mixture Model to detect shelves. The authors of [12,27,28,29] handled the product detection problem with different methods, and the performances were tested on combinations of the Grocery Dataset. The best performance was reached in [29], with 97.31% recall and 94.05% precision values, using the Cascade Object Detector Algorithm for product detection, as well as the mean and median filter for eliminating incorrect detection. The authors of [12,27,29] proposed several solutions for the product classification problem. In [29], 99.21% accuracy was achieved by classifying the shape-based Fisher Vector extraction obtained from the properties of Dense Scale Invariant Features (DenseSIFT) and Local Binary Pattern information with Extreme Learning Machines. These studies presented several solutions to different parts of product recognition problem; however, they did not perform an end-to-end system for real use in retail. Additionally, the Grocery Dataset is a limited collection consisting of only cigarette packages. The proposed methods did not test more complex datasets in terms of product variety (consisting of different product sizes and shapes), and there is no information that these systems system can show same performance on other datasets.

2.2. Product Detection Stage

Previous studies [13,30,31,34] have focused on only the product detection problem. The results obtained using Faster R-CNN (Region-based Convolutional Network) [41], YOLO9000 (You Only Look Once) [42], RetinaNet [43], Mask R-CNN [44], YoloV3 [45], and CenterNet [46], which are commonly used object detection algorithms in the literature, were compared with the developed methods in [13,30,31]. The SKU-110K dataset [13], which consists of label information with a single class for each product on the shelf, was used for training and testing the system. The authors of [13] proposed a unified framework for oriented and densely packed object detection with improved RetinaNet with EM-Merger and achieved an improved performance compared to the existing algorithms presented in [41,42,43,44]. The authors of [30] offered two different models, which were Gaussian Decoder Network (GDN) as an extended version of RetinaNet, and Gaussian Layer Network (GLN), as a kind of RetinaNet architecture with fewer parameters and better accuracy compared to the GDN. Both GDN and GLN showed better performance from the previous study in [13]. Additionally, the highest performance was achieved with Dynamic Refinement Network (DRN) consisting of two modules: feature selection and dynamic refinement heads, as in [31]. The authors of [34] focused on object detection in dense scenes such as retail shelves. The proposed method consisted of Cascade R-CNN, ResNet101, Feature Pyramid Network (FPN), and balanced L1 loss. Region proposals that have the low quality due to dense scenes were improved with Cascade R-CNN. The positioning loss from the loss function was balanced and constrained using the balanced L1 loss. Additionally, an improvement of the performance on the detection of small objects was provided by FPN. According to state-of-the-art object detection methods, Faster R-CNN [41], YoloV3 [45], and RetinaNet [43], the high detection accuracy was achieved by the study. The speed of the proposed method was slow and did not meet the real-time requirements of detecting products on grocery shelves because of the cascade structure used. The authors of [13,30,31,34] gave comparable results for the product detection part. However, they did not propose an end-to-end result, and product recognition is a very challenging problem regarding the dense structure of these dataset.

2.3. Product Classification Stage

On the other stage, the product classification problem was handled in [32]. An Instagram-trained convolutional network (ResNext-INet) was fine-tuned with a new neural network layer called the LocalConcepts-Accumulation (LCA) layer and Maximum Entropy (ME) loss to classify three different grocery product datasets. According to the results, the proposed method achieved a higher accuracy compared to image matching based on key points detection and ResNext-INet without fine-tuning. This study showed that using a convolutional network for product classification and fine-tuning of the convolutional network can provide increased accuracy. In this case, having more than one training image for each class is important for the training of the network.
The improved Siamese neural network was used for product classification in [33]. The network improvement was realized by updated the cross-entropy loss function with the Euclidean distance and added dual attention mechanisms. The proposed algorithm outperformed more conventional techniques when tested on two widely used datasets. This study overcame the problem of insufficient data in the training phase, which is one of the important problems of retail product identification as also encountered in [32]. On the other hand, an end-to-end solution to the problem of product recognition on grocery shelves was not offered.

2.4. Product Detection and Classification Stages Performed Jointly

The detection and classification of products were performed jointly in [22,23,24,25,26], which dealt with this problem as a whole. In [22], an end-to-end product recognition and comparative results of three different methods were given using five different scales on frame-by-frame windows taken from shelf images. According to the obtained precision and recall values, the best performance was reached by the Scale Invariant Feature Transform (SIFT) [47], followed by color histogram matching and, finally, Boosted Haar-like features. Although this study did not yield significant results, it provides a baseline for the product recognition problem.
The authors of [23] proposed an application for visually impaired users, aiming to find the products present in a shopping lists from video images of retail shelves. The SURF [6] identifiers and the Multi-Class Naive Bayes classifier [48] were used to recognize the products from the regions obtained with a method based on optical flow [49]. The performance of the system was measured by detecting 10 items from 25 different shopping lists in 10 different video images. According to the results of the study, the number of missed products increased when the threshold for obtaining the correct product increased. In addition, when the threshold was decreased, gathering the number of wrong products increased. The mentioned study was unable to suggest the optimal threshold for users to complete their shopping list.
In [24], the products were reclassified with a pre-trained convolutional neural network (CNN) model (VGG-f network [50]) after the estimation of a short-list of possible categories with a probabilistic inference model based on SIFT [47] features. The proposed method reached a higher mean average precision (mAP) value than previous studies in [9,41] on different datasets [9,22]. However, these mAP values still need considerable improvement to implement this technique to solve real problems in the retail industry [51]. Still, the proposed model is useful when it is not possible to collect enough data for training a deep detection model. However, deep models show better performance if more training data exist [52].
The authors of [25] offered a new approach to recognize fine-grained products. A confidence set was created according to potential product arrangements on the shelf and the integrated visual hierarchy between brands in this approach. The results of the confidence set were assured to contain the correct classes at a specific confidence level. The method [25] performed better than the most advanced CNN models but this method did not prove its performance on the state-of-art fine-grained grocery product datasets (e.g., Grocery Products [9]).
In a previous study [26], the task-specific training of joint detection and recognition model was proposed with four procedures. First, a joint model on a fully annotated dataset was trained. The training process was then modified over time until training on task-specific datasets was achieved. With the different procedures used in the study, it was shown that splitting the training in a detection and recognition phase did not detract from the performance of the model compared to training it as a traditional multiclass detector. The performance of joint detection and recognition models depend on whether on a dataset is fully annotated or not. Moreover, annotating all products on shelves is challenging task in real grocery product recognition problem because of the continuous products adding and changes in product packaging.

2.5. Multi-Stage End-to-End Product Recognition

The authors of [11] tackled the product recognition problem with an end-to-end three-step model, in which the steps were unconstrained product recognition, graph-based consistency check, and product verification. That is, feature matching and a generalized Hough Transform were used for unconstrained product recognition. Then, the compliance between the planned products positions on shelves (planogram) and the positions obtained in the previous stage were checked in the graph-based consistency check part. Lastly, different methods were used for product verification, and among them, the most successful method was BRISK [7]. In addition to the training and test dataset, the use of planogram information provided an improved performance for determining the product location and identifying the missed products. However, in the case of an inability to reach planogram knowledge, it was not possible to reach the expected performance.
Another study [10] presented results on two datasets with a different number of classes and different number of images. Their method consisted of pre-candidate selection, fine-selection, and post-processing stages. Using SURF features [6] was more accurate on the easier dataset, while the deep neural network (DNN) features had a better performance on the more complex dataset. The proposed method had high complexity since it required creating separate candidate windows for each product in the first stage, and it caused an increase in the processing time to extract features in the second stage.
In another end-to-end three step study [35], a customized YOLOv2 [42] was used for the detection step, learned descriptors with VGG-16 [53] were utilized for recognition, and, finally, some refinement strategies were employed. According to the results, the authors of [35] recorded higher recognition performance compared to [11] and [41]; however, the system required an extra dataset to train YOLOv2. Additionally, most of grocery product datasets are not large enough for training a deep learning model because of they have fewer images with a higher number of classes compared to common object datasets [51].
The other end-to-end studies [36,37] attempted to solve the product recognition problem by recognizing the text on products. The aim of these studies was to improve shopping experience, especially for visually impaired peoples. The stages of [36] were considered in the order of pre-processing, product detection, and product recognition (including text detection and text recognition). YOLOv5 [54] was used to detect products; the backbone network with ResNet50, FPN, and a new post-processing technique was used for text detection; and, finally, the Selective Context Attentional Text Recognizer (SCATTER) [55] was used to recognize the products’ text information. The proposed method enhances the effectiveness of the existing techniques. In a two-stage study [37], the Deep Belief Network (DBN) was used for selecting the images that were not captioned, and Bald Eagle Search (BES) was used to generate text according to products. The suggested technique outperformed the existing classifiers in terms of precision, recall, accuracy, and success rate while having a lower MSE value. It may be advantageous to recognize the product types with very similar packaging from the text instead of the image features. However, in real grocery shelf images, the text may not appear or may appear incomplete depending on the position of the product or the angle of the photo. In addition, some proposed methods for recognizing products from text are computationally expensive.
The aforementioned studies, together with other works in the literature, have provided relevant contributions to the research area of product recognition. However, some of them have fallen short of covering all of the required steps of a real-time, applicable product recognition process, whereas the other more completed studies have different drawbacks regarding the utilized dataset and computational burden.

3. Multi-Stage End-to-End Product Recognition Approach

The problem of product recognition on grocery shelf images is more complicated than the classical object detection problems due to the challenges of large-scale classification, data limitation, intra-class variation, and flexibility [51]. To handle these challenges, different solutions with comparable results are proposed in this study.
The proposed multi-stage end-to-end recognition approach shown in Figure 2 consists of three stages: product detection, product classification, and refinement. The claim of this study is that use of the proposed three-stage hybrid method instead of product recognition directly provides significant contributions to the challenges mentioned in this study. Considering that:
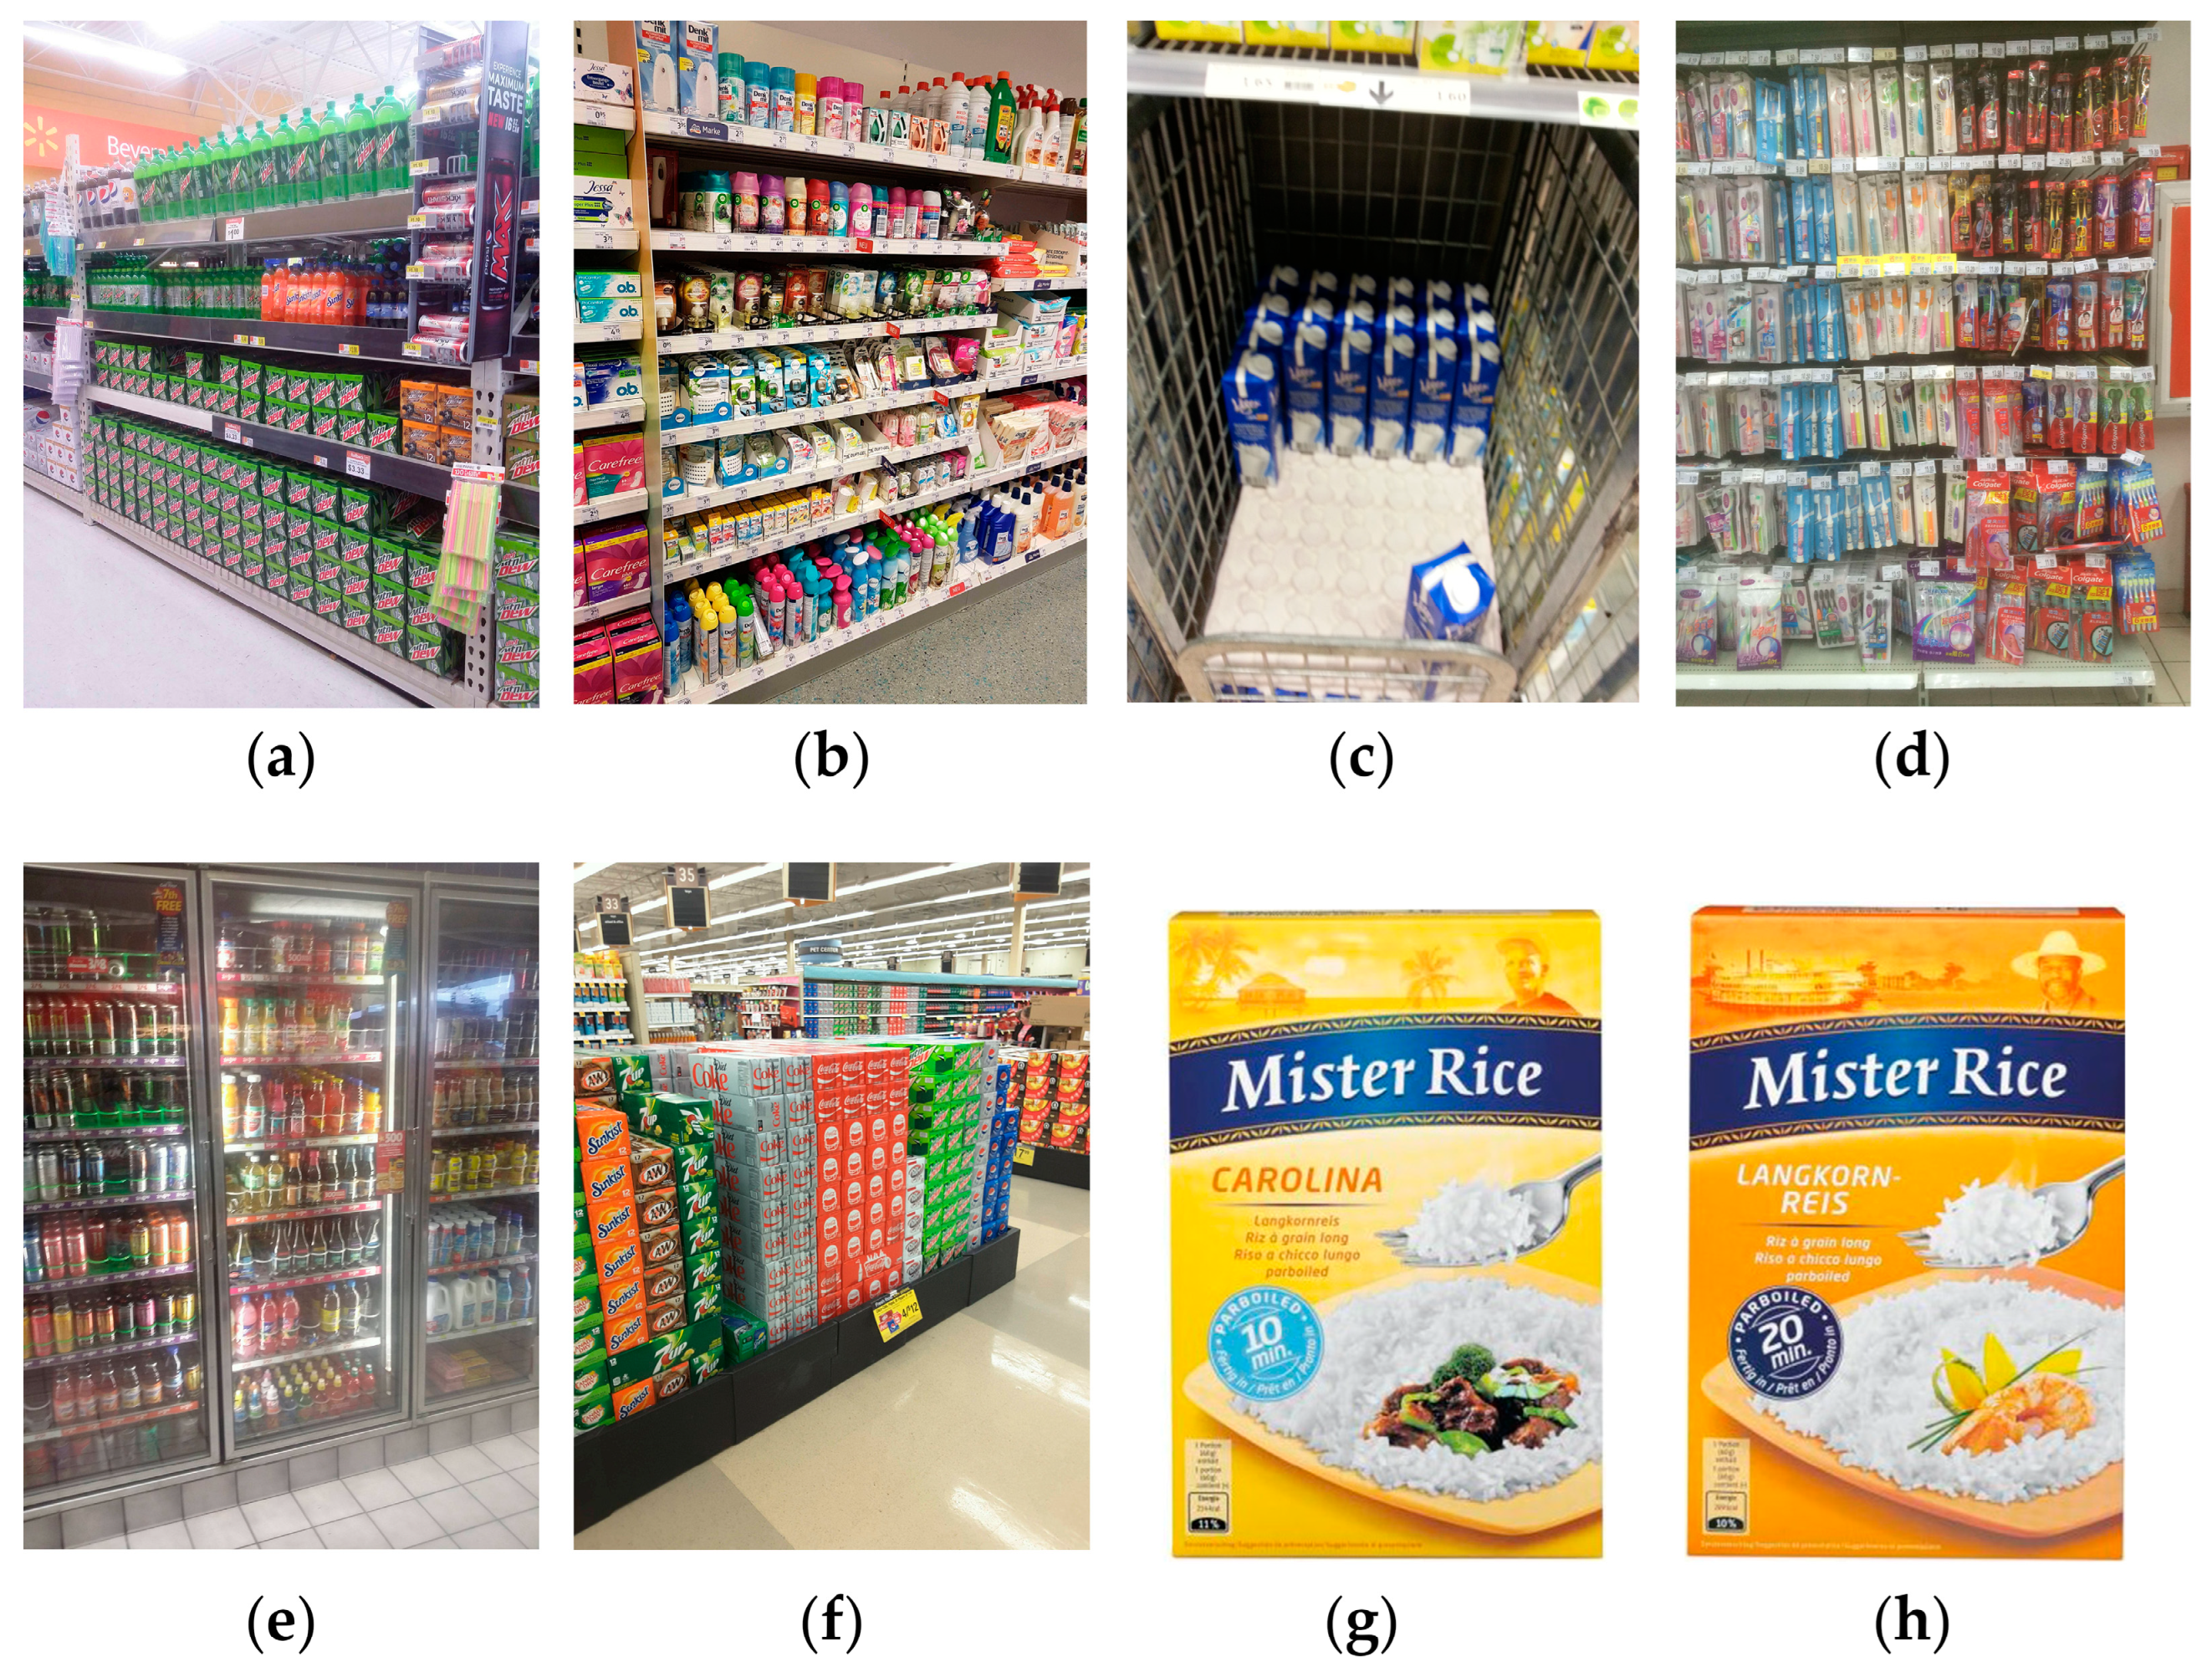
  • Although the performance of the state-of-art object detection methods [5,41,44,45] have been improved, the success of object recognition decreases as the number of classes increases [51]. Therefore, product recognition directly with the state-of-art object detection methods is not sufficient for large-scale datasets.
  • Data collection for product recognition problem have difficulty due to the high number of classes, in addition to the presence of constantly renewed packaging and newly added products. In the case of an insufficient number of images for each class, product locations can be determined with a single-class object detection algorithm, and then the products can be classified to handle limitations on product recognition datasets [51].
  • The presence of constantly renewed packaging and newly added products require re-training the system when product recognition is applied directly. On the contrary, the proposed product-independent detection process is not affected by additional or removed products in grocery stores and provides more flexible detection.
  • The similarity between products, different scales of product sizes, and diversity in the color and shape of products lead to an insufficient recognizability for all products with a single method [11]. Therefore, relying on multiple types of features jointly to successfully recognize a wider range of product classes is required. With this aim, the hybrid usage of SURF [6], BRISK [7], and ORB [8] features is proposed in this study.
The proposed method is depicted in Figure 2, where it can be seen that the system makes it possible to find potential regions of products in a shelf image as an input, then match features between template image of products and the potential regions found, and, finally, reduce multiple detections and classifications of the same product.

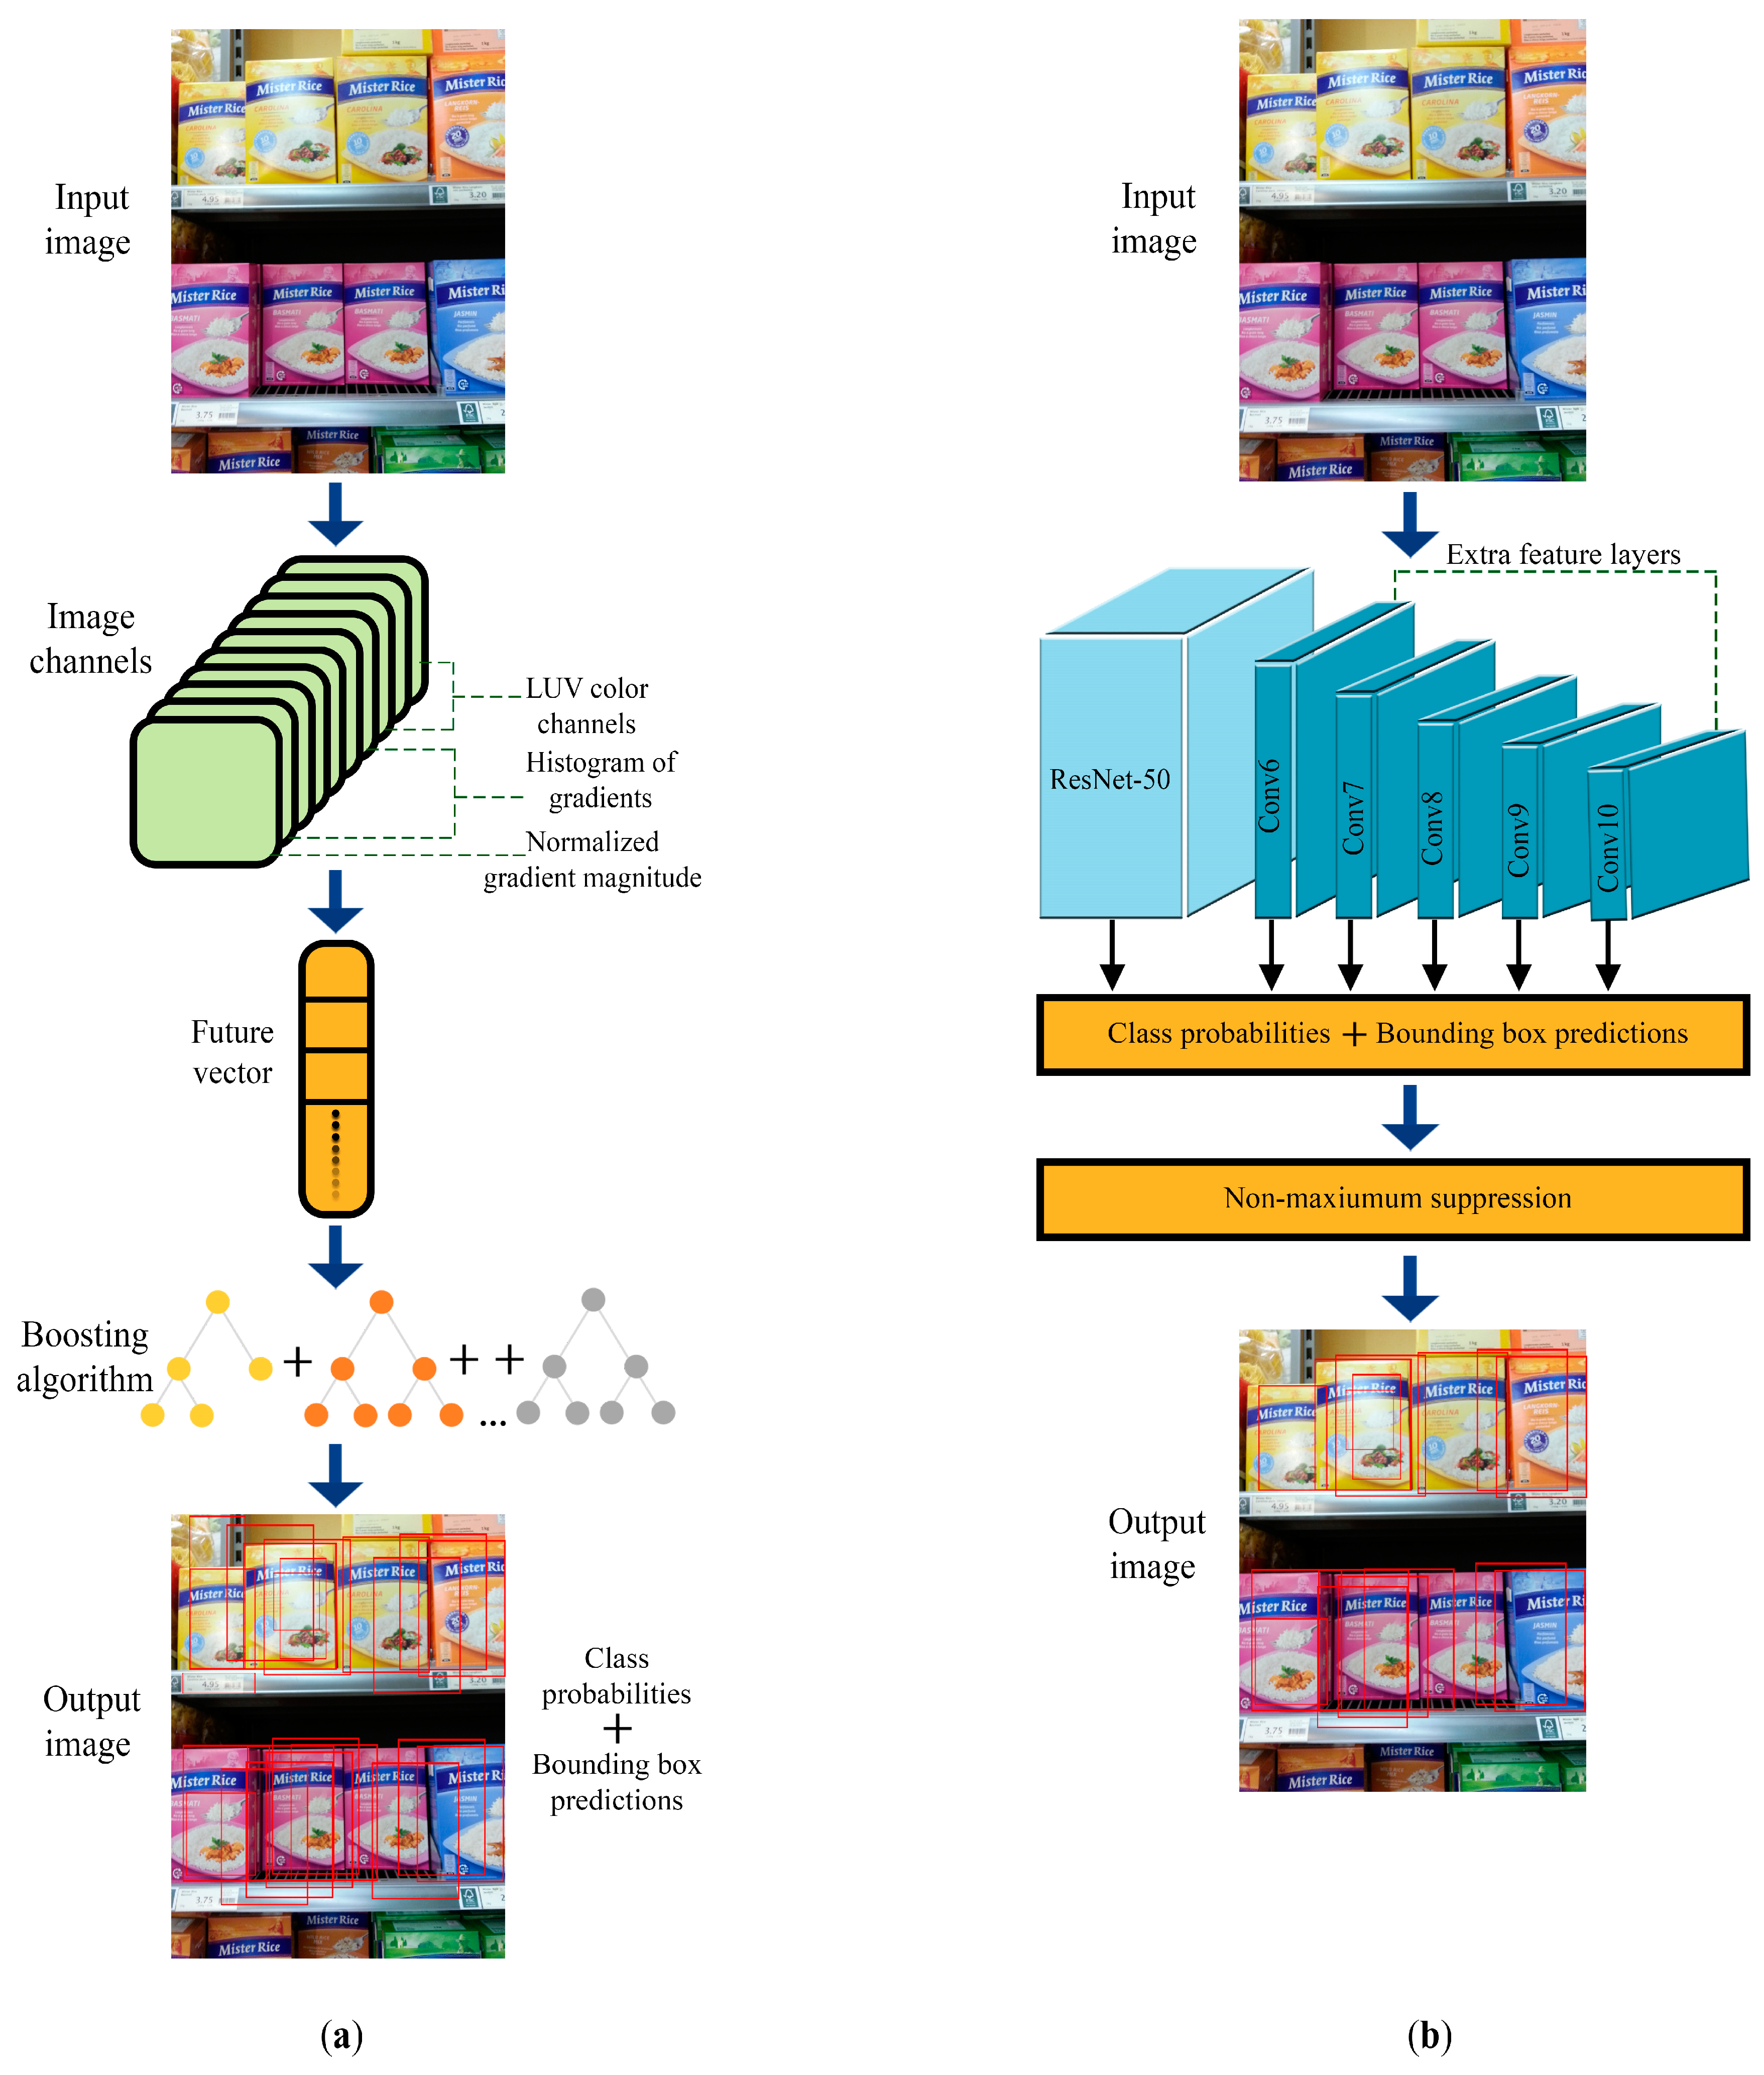
3.1. Product Detection

The stage of product detection identifies the potential regions of each existing product in the shelf image. This research compares the performance of three different methods: a proposed traditional computer vision approach, a learning-based ACF [4] detector, and a DNN-based SSD [5]. The aim of this comparison is to show the advantages and disadvantages of these three different-based proposed approaches on the performance of the product recognition problem.
The proposed traditional computer vision approach consists of three steps, as detailed in Figure 3. First, horizontal lines were identified with Hough Transform [56] for the detection of shelf lines; then, vertical lines were highlighted with Hough Transform to find the start and end points of the products on each shelf. As a result of this process, the starting and ending points of some products may not be determined, and this prevents the method from detecting many products in the first stage. An enhancement step was offered to handle this problem. The locations of missing products were completed using the area information determined from the previous steps. Additional region proposals were also created in areas with high probability of coexistence of similar products considering the nearby product sizes.
The second proposed method uses the ACF [4] (see Figure 4a for the flow diagram) for Stage-1. A normalized gradient magnitude, a histogram of oriented gradients (six channels), and LUV color channels (total: 10 channels) were computed to represent a feature vector of the input image, and then a boosting algorithm was used for classifying the image. The ACF and its different implementations have achieved good performance in some detection problems such as the detection of humans [57], locusts [58], aircrafts [59], and cross-sectional areas of the fetal limb in an ultrasound image [60]. Although ACF has not been used for product recognition before, it is expected that having good performance for recognizing objects with similar properties can lead to a sufficient performance while creating region proposals for products that are similar to each other.
Finally, the third method proposes to utilize the SSD [5] (see Figure 4b for the flow diagram), which is a single-stage detector represented by concurrent bounding-box for regression and classification. Single-stage models [5,45] are faster than two-stage models [41,61], which detect objects with region proposal algorithms and then apply an independent classification for each region. The other one-stage model, YOLO, has a limitation for identifying smaller objects in images, and it is challenging to generalize objects with unconventional aspect ratios or configurations [62]. The product recognition problem has to deal with the recognition of products at different scales and product sizes. The SSD can detect small and large objects simultaneously using features of different depth (multi-dimensional feature maps). Additionally, the SSD [5] achieves a high accuracy even on low-resolution input images. As a result, the SSD was selected for the DNN-based model of Stage-1 due to the above-mentioned advantages. The pre-trained weights on the ImageNet dataset were used as the initial weight model for the SSD with the base network ResNet-50 [63]. As shown in Figure 4, potential product regions of Stage-1 were obtained using non-maximum suppression to filter the predictions from the ResNet-50 network and extra feature layers.

3.2. Product Classification
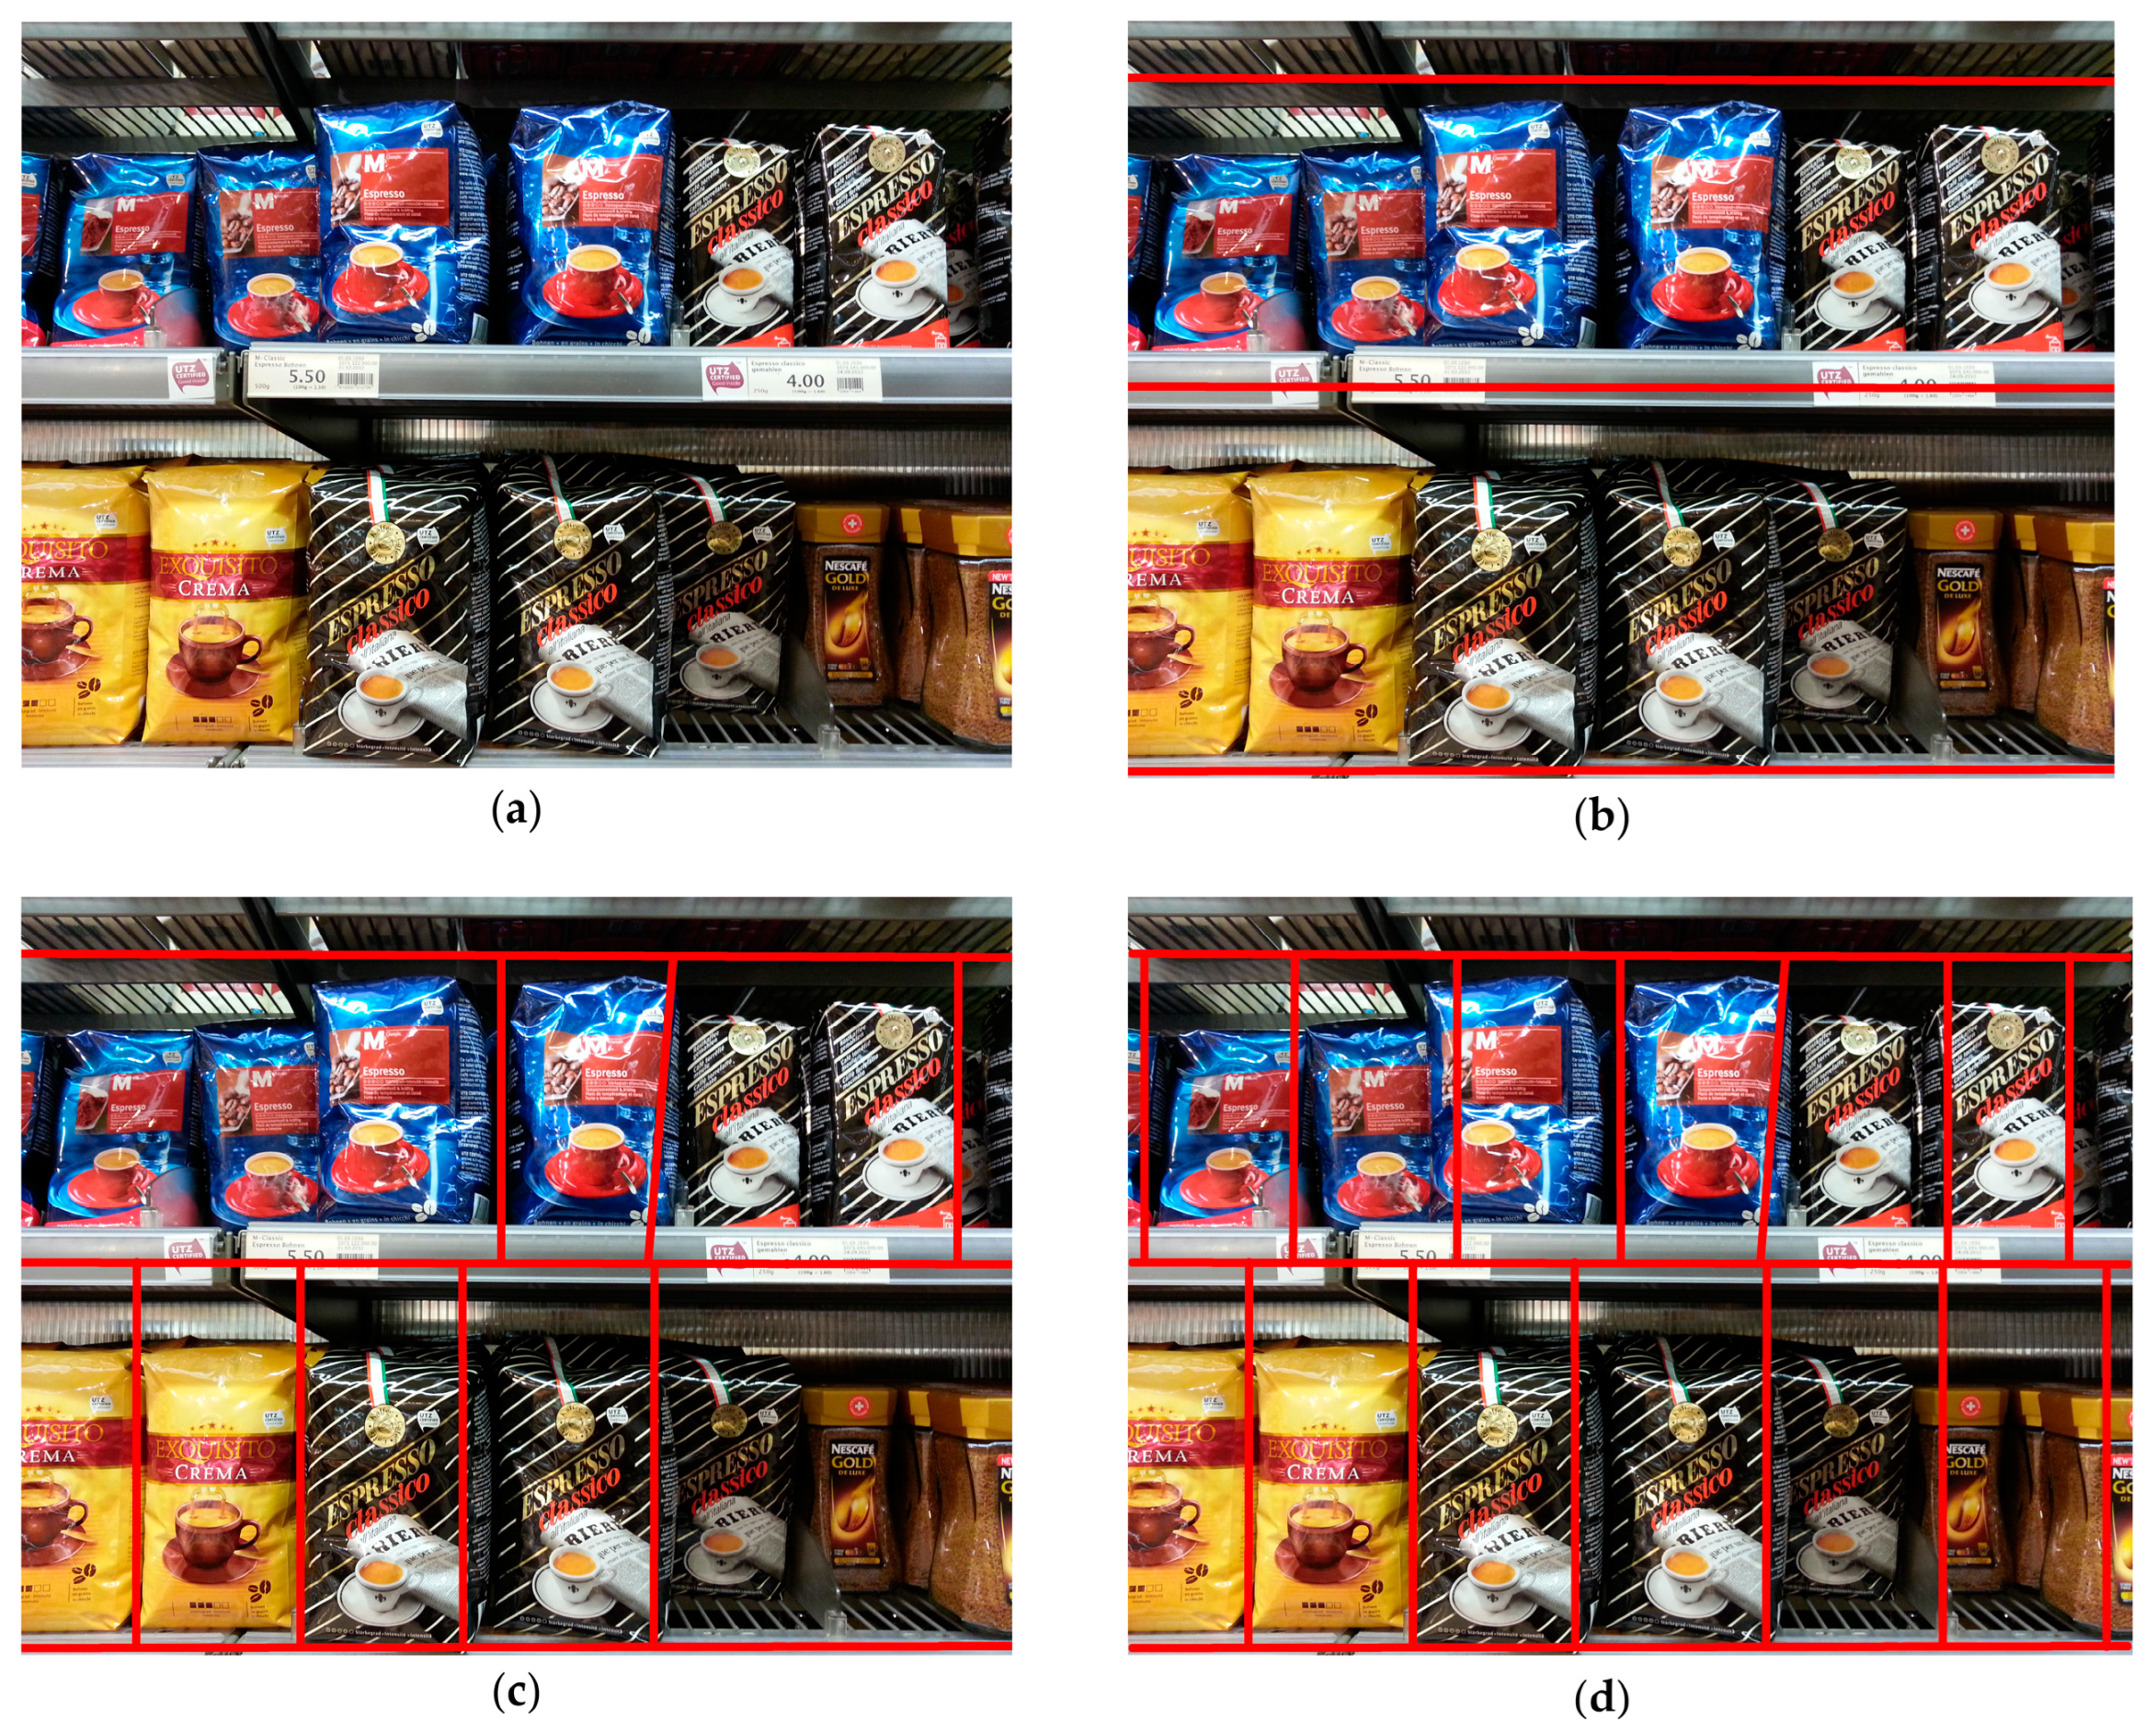
Before feature matching is applied between the region proposals obtained from shelf images and the template images of products, a pre-elimination process is performed to reduce the number of region proposals. The pseudo-code of the pre-elimination process is shown in Table 2. The pre-elimination process eliminates region proposals in two specified ways (aspect ratio and color histogram) and does not introduce them into the next phases of the proposed method. First, the aspect ratio of the product template and the region proposals are calculated for elimination according to the aspect ratio. Here, 1.5 times the aspect ratio of the product template is considered the upper threshold, and 0.5 times is the lower threshold. When the region proposal is higher than upper threshold or lower than the lower threshold, this region proposal is eliminated. Then, the normalized Hue, Saturation, and Value (HSV) color histogram of the template images and region proposals which are not eliminated, with the restriction of the aspect ratio, are extracted. In the widely used HSV color space, the colors like red or blue are expressed by Hue, the lightness level is expressed by Value, how different a color appears from gray of same lightness is expressed by Saturation [64]. If the histogram intersection of the products template images and region proposals is lower than a pre-fixed threshold, then these regions are eliminated. Therefore, the remaining region proposals are the new region proposal set of next steps. The advantage of pre-elimination is to decrease the number of proposed regions before the following feature extraction step and, consequently, the number of operations to be performed for next steps is reduced.
Finally, features of the product templates and the remaining regions are extracted to classify each product. According to a comparative analysis of feature extraction methods, SURF [6], BRISK [7], and ORB [8] extract the highest number of discriminative features with efficient computational performance. Additionally, SURF [6] and BRISK [7] are the most scale-invariant feature detectors, and ORB [8] and BRISK [7] are more rotation-invariant than others [65]. The feature extraction processes of SURF [6], BRISK [7], and ORB [8] consist of three main steps: key point detection, feature vector description, and matching vectors between different images.
In the widely used scale-invariant feature extraction method (SURF) [6], the key points of the two images, which will be matched, are detected as blob-type structures by Gaussian smoothing filters horizontally and vertically; then, they integrated to Hessian matrix for each key point. Then, the neighborhood of every key point is divided into a number of 4 × 4 sub-square regions. A 64-dimensional (4 × 4 × 4) feature vector of all sub-regions is obtained by computing the two-dimensional Haar wavelet for the input image and its integral image. At the matching step, the distance between the feature vectors of two image is calculated using the Euclidean distance. Two feature vectors are matched when the distance between them is less than the threshold.
BRISK [7] is another feature extraction method that detects corners using the Adaptive and Generic Accelerated Segment Test (AGAST) [66] algorithm and filters them with the corner score from Features from Accelerated Segment Test (FAST) [67], searching for the maxima in the scale space pyramid providing invariance to the scale. The descriptor of BRISK is based on comparing the intensity values of the key points. A descriptor with 512 bits in length is obtained when the value of first point is larger than the second one; then, output is 1. Otherwise, the output is 0 for each key point pairs. In the matching case, the Hamming distance is used, which leads to a short execution time comparing to the Euclidean distance. As usual, if the distance between two feature vectors is less than a fixed threshold, then the descriptors are matched.
ORB [8] feature extraction method is a combination of FAST [67] and BRIEF [68] with some modifications. First, FAST detects key points in the scale space pyramid of the image. Then, the Harris corner measure is applied to sort key points and find the top N of them. Then, a rotation matrix of the local orientation through the intensity-weighted centroid of the patch with located corner at center is computed. After that, the BRIEF descriptors are steered according to the orientation, and the binary string is kept as the ORB descriptor. Finally, at the matching step, the Hamming distance is used as in BRISK [7], and the descriptors are matched if the obtained value is less than the threshold.
For each feature extraction method, if the matching score calculated as the ratio of number of matched features between product template and region proposal to the number of features found in product template is greater than a prefix threshold, then the algorithm infers that this region proposal is classified to this product with this matching score.
In addition to the feature extraction methods SURF [6], BRISK [7], and ORB [8] used separately for matching region proposals and product templates, a hybrid use of these three methods was tested in this work because different features are more distinguishable in different products. The matching scores obtained by three different feature extraction methods for all region proposals of each product class were normalized on a class base and compared with each other. Then, the feature extraction method with the highest matching score was selected as the method specific to recognize that product class.

3.3. Refinement

The bounding boxes, with information of the product class and matching score for each shelf image, were obtained from the product classification stage. Multiple overlapped bounding boxes for each product placed in shelf images must be combined into a single bounding box in the most correct way. With this aim, the refinement stage obtained the final result by making improvements on the information of product classes and localizations with the clustering algorithm, as in [10] but with some modifications. The main difference from [10] is the addition of neighborhood relation to the clustering algorithm. Neighborhood relation is expected to make a positive contribution using the knowledge that grocery shelf displays often have a high probability of juxtaposing the same products. The neighborhood-related clustering algorithm (NR_CA) consists of the following steps:
(1)
The obtained region proposals for each test image are ordered from the highest score to the lowest score.
(2)
The region proposal of the highest score is taken as the first element of the first cluster.
(3)
If the intersection area of the region proposal in the ranking and any cluster is larger than half of its own area, then these region proposals are included in the same cluster. If a region proposal cannot be assigned to any of the existing clusters, then a new cluster is created.
(4)
A cluster is represented by the average of each bounding box values in the same cluster, the maximum of the matching score, and its class information.
(5)
These processes continue until there is no non-clustered region proposal.
(6)
In order to add neighborhood relations to all the obtained clusters, a distance matrix is calculated between the two closest points of cluster pairs.
(7)
In cases where this distance is less than a prefix threshold (half of the width of each cluster), it is assumed that the products are side by side, and the values of matching scores are increased by 1/10 of their own score.
(8)
Clusters are eliminated if the new score is less than 40% of the maximum score from all clusters.
At the end of this process, the final information of product classes and localizations are obtained.
The neighborhood-related clustering algorithm can handle situations such as different shelf designs, different product sizes, high numbers of product classes, and high densities of scenes. The parameters used are calculated specifically for each shelf image and show the same performance when faced with different situations. Three different parameters are used in neighborhood-related clustering algorithm: (1) the minimum intersection area of the region proposal and any cluster, (2) the minimum distance measure for establishing a neighborhood relationship, and (3) the minimum score of the cluster for deciding to elimination. The threshold of (1) is identified for the product overlaps 50% with any of the region proposal; it represents that product the highest frequency and should be included in this class. The threshold (2) specifies half of the width of each cluster, representing that the products are close to each other and that there is no other product between them. The threshold (2) is specified at 40% of the maximum score from all clusters for the elimination process.

4. Experimental Study

In this section, the performance of the proposed methods on different data sets are shown comparatively. First, the datasets used are explained in detail, and then the experimental results are given in following sub-sections.

4.1. Datasets

In the literature, several datasets have been used to tackle the product recognition problem consisting of different product groups, which differ in product type, size, and similarity. This study uses the Grocery Dataset [12], SKU-110K [13], Grocery Products [9], and its subsets (GP-20 [10], GP-181 [11]), which are the commonly used and publicly available datasets; their samples are shown in Figure 5, and details are given in Table 3. For the first stage of the proposed approach, a dataset is required, in which all the products on the shelf are labeled. A new dataset was created by combining images from the Grocery Dataset [12] and SKU-110K [13] for ACF and SSD training. To evaluate the proposed end-to-end system performance and to provide comparable results, the existing Grocery Products [9] and its subsets [10,11], which have different numbers of product varieties and test images, were used.
SKU-110K [13]: This dataset consists of a total of 11,762 shelf images, of which 70% (8233) are training, 5% (588) are validation, and 25% (2941) are test images. Each product on the shelf in the dataset was labeled as a single class, and product types were not specified. The differences between the existing datasets and the SKU-110K are the large number and density of objects appearing in each image, the diversity of the product classes, and the differences in the nature of the image scenes.
Grocery Dataset [12]: This dataset is more specific because it consists only of packages of cigarettes. Shelf images have different lightning and designs, and images were taken from various distances. The dataset consists of product images from 10 different categories and 354 shelf images with annotated ground truths.
Grocery Products [9]: This dataset consists of hierarchical categories and differs from the other datasets because of its fine-grained structure. The training set consists of 27 food categories and 3235 fine-grained products, e.g., an Aproz classic water is a subclass of Water/Drinks/Food that is represented with a template image with a white background taken in ideal studio conditions. The test set consists of 680 shelf images with different lighting conditions, viewing angles, and zoom levels containing interesting products. When the same groups of products are contained together in a test image, they are surrounded by a single bounding box.
GP-20 [10]: This dataset was created by selecting 20 grocery products from the Grocery Products [9] training set. Each product was represented with a single instance. The test set consists of 61 test images of shelves containing the selected products and 10 images without any product of interest. The annotations of shelf images were rebuilt manually with item-specific bounding boxes of the selected products.
GP-181 [11]: This dataset is another subset of the Grocery Products [9] dataset created by selecting 181 grocery products. As in GP-20, each product was represented with a single instance. The 74 testing shelf images were annotated with item-specific bounding boxes; however, unlike GP-20, each product in shelf images was labeled with a bounding box.
The Grocery Dataset [12] and SKU-110K [13] differ in the number and density of the products in the shelf images. To train detectors during the first stage, samples from these two datasets were combined to increase the diversity in the training set. For this purpose, 588 images from the SKU-110K dataset were reserved for validation, and all 354 images of the Grocery Dataset were combined (GD + SKU-110Kval). All products in the shelf images were labeled as shown in Figure 5.
The Grocery Products [9] dataset is one of the commonly used collections in the literature for the problem of product detection on-shelf. Therefore, Grocery Products [9] and its subsets (GP-20 [10], GP-181 [11]) were chosen to compare the performance of the proposed approach against existing studies. Therefore, the training and test sets were used in this study, as indicated in Table 3 and as covered by the existing studies [9,10,11,35,69,70]. No changes were made to the training and test sets. First, the smallest-scale dataset, GP-20 [10], was used to compare the different feature extraction methods in this study. Then, the proposed approach was tested with the GP-181 [11] and Grocery Products [9] datasets.

4.2. Experimental Results

The first step of the multi-stage end-to-end recognition approach provides a product-independent detection process. Therefore, the proposed methods in the first phase used the pre-trained ACF [4] and SSD [5] models for product detection. On the other hand, the traditional computer vision method, which is another proposed method, detects the product directly on the test image without the need to train.
The GD + SKU-110Kval dataset was used for the training of the ACF [4] and SSD [5]. The ACF [4] and SSD [5] were used as specified in [4,5] and shown the flow diagram in the Figure 4. In the ACF [4] detector, the number of stages and negative sample factors are two significant parameters needed to be specified. In the study [58], the optimal value of negative sample factors was found to be 4, and the optimal value of the number of stages was 6. Accordingly, the ACF was trained with these values of parameters. In the SSD, transfer learning was used with pre-trained weights on the ImageNet setting as the initial weight model before training with the GD + SKU-110Kval dataset. Training of the SSD continued for 10,000 iterations with a batch size of 16. The obtained detection model from the ACF and SSD, specified as in [4,5] with selected parameters, was used for creating region proposals of shelf images in the GP-20 [10], GP-181 [11], and Grocery Products [9] datasets.

4.2.1. Results of GP-20

The performance of the proposed methods on the GP-20 dataset was calculated with the evaluation criteria shown in Equations (1) and (2) according to the discrete metric used in [10], wherein the GP-20 dataset was created. In [10], a product was considered as True Positive (TP) if the center of the product bounding box was inside the ground-truth box; otherwise, it was considered as False Positive (FP). The discrete metric precision value is the percentage of rightly detected products (TP) over the total number of detected products, and the discrete metric recall value is the percentage of rightly detected products (TP) over the total number of labelled products.
P r e c i s i o n = T P + F P T P
R e c a l l = T P + F N T P
The performance on the recognition of 20 different products of the proposed multi-stage end-to-end recognition approach on 71 shelf images in the GP-20 dataset is shown in Table 4. In the second row of the table, different methods used in the first step of the proposed method are listed, and in the second column of the table, different methods used in the second phase are listed. Each precision and recall value was found after applying the neighborhood-related clustering algorithm to the methods represented in the row and column to which it is related. As it can be seen from the results in Table 4, the highest precision and recall values were achieved by different methods. However, the optimal value of precision and recall pair was achieved with the SSD in Stage-1 and the hybrid usage of SURF, BRISK, and ORB in Stage-2.
In order to show the contribution of the neighborhood relationship adding to the clustering algorithm in the refinement stage, the clustering algorithm (CA) and the neighborhood-related clustering algorithm (NR_CA) were compared. The performance of the CA with the NR_CA on GP-20 dataset is shown in Table 5. The obtained precision and recall values show that adding a neighborhood relation to the clustering algorithm contributed positively to the performance of the proposed method. The precision value was increased by 0.7, and the recall value was increased by 3.8.
Additionally, as it can be seen in Table 6, the performance of the two proposed methods: (1) the proposed DNN and (2) the proposed Bag of Words (BoW) in [10] obtained an 78.8% precision value and 81.3% recall value from the sequential usage of SSD; hybrid usage of SURF, BRISK, and ORB; and the neighborhood-related clustering algorithm. The proposed DNN in [10] was used with AlexNet [71], and the proposed BoW was used with SURF [6] descriptors for feature extraction. The pipeline method (SSD; hybrid usage of SURF, BRISK, and ORB; and the neighborhood-related clustering algorithm) showed better performance than the proposed methods in [10] because it combined the benefits of using DNN features (SSD) in the first stage and used different features together with SURF in the second stage.
In summary, it is possible to assert that the usage of DNN-based product detection with SSD, the hybrid usage of feature extraction methods, and the addition of neighborhood relation to the clustering algorithm provided a significant contribution to the performance of the system. Thus, a proposed pipeline method (SSD; hybrid usage of SURF, BRISK, and ORB; and the neighborhood-related clustering algorithm) was obtained for the performance evaluation of other datasets.

4.2.2. Results of GP-181

The performance of the proposed pipeline method on the GP-181 dataset was calculated according to the mAP and Product Recall (PR), as defined in [35]. A product was considered a True Positive (TP) if the intersection over union (IoU) between the predicted and ground truth bounding box was higher than 0.5; otherwise it was considered a False Positive (FP). The mAP value was measured as the approximation of the area under the Precision-Recall curve for the detector, and the PR was measured as the average product recall across all the shelf images [35].
Comparative results with previously published works [11,35] are given in Table 7. Although, unlike this study, [11] used planogram information to determine the product locations and identify the missed products, the proposed pipeline model (SSD; SURF, BRISK, and ORB; and NR_CA) achieved higher mAP and PR values from [10].
Additionally, the obtained mAP value was ~5% higher than [35] when the PR value approached [35]. The reason for obtaining higher results compared to the GP-20 can be explained by the fact that recognizing all products on the shelf images reduces the number of FPs. Using the SSD in this study instead of the YOLO in [35] also contributed to removing the limitation of YOLO in identifying smaller objects in the images.

4.2.3. Results of Grocery Products

The performance of the proposed pipeline method on the Grocery Products dataset was calculated according to the Categorization Accuracy (CA), Product Accuracy (PA), Product Precision (PP), and Product Recall (PR), as defined in [69]. That is, the CA was calculated as the average of the ratios of the number of correctly classified images to the total number of images for each class of 27 food categories, as in Equation (3); PA was calculated as the average of the ratios of the intersection of the ground-truth and predicted bounding box to the union of them for each of the 3235 fine-grained class. as in Equation (4); PP was calculated as the average of the ratios of the intersection of the ground-truth and predicted bounding box to just ground truth for each of the 3235 fine-grained class, as in Equation (5); and PR was calculated as the average of the ratios of the intersection of the ground-truth and the predicted bounding boxes for each of the 3235 fine-grained class, as in Equation (6). In Equations (3)–(6), T is denoted as the total number of classes, k i is the number of images that classified correctly in class i, n i is the total number of images in class i, C i is the ground-truth bounding box of labeled product, and C i is bounding box of predicted product.
C A = 1 T i = 1 T k i n i .
P A = 1 T i = 1 T C i C i C i C i .
P P = 1 T i = 1 T C i C i C i .
P R = 1 T i = 1 T C i C i C i .
Comparative results with previously published papers [9,69,70] and the results of this study are given in Table 8. In [9], the product recognition process was realized by multi-class ranking with random forests, dense pixel matching, and a genetic algorithm for optimization matching. In [69], SURF [6] and Hough Transform were used to identify and pose grocery products. Unlike other studies, [70] attempted to identify products by detecting the words on the product packages using Optical Character Recognition (OCR) [72] techniques; then, visual features were extracted using discriminative patches, and products were recognized using SVM. The CA of the proposed pipeline model achieved higher accuracy than [70]. The PA and PR values of the proposed model were higher than [9,69], while the PP value was just higher than [9]. Recognizing products with detecting the words was insufficiently successful when compared to the other results. The proposed pipeline method (SSD; the hybrid usage of SURF, BRISK, ORB; and the neighborhood-related clustering algorithm) prevailed for most of the performance metrics obtained from [9,69,70].

4.3. Running Time Performance Evaluation

Real-time processing is needed in an autonomous product recognition system on grocery shelves. For the sides of the producers, suppliers, and customers, the duration of response to their problems is highly important. In addition to the product recognition performance of this study, the evaluation of running time on the GP-20 dataset was considered. In the product detection stage, training time can be ignored when training the SSD due to the product-independent detection process. The averaged testing time of product detection was 0.37 s on 71 shelf images in the GP-20. The number of products in the shelf images and the dimensions of the products directly affected detection time. At the product classification stage, the hybrid usage of SURF, BRISK, and ORB did not create any significant time loss. The running time for each feature extraction method and hybrid method of 20 product images in the GP-20 dataset is shown in Table 9. Every time a new product was added, it was necessary to process with three feature extraction methods (SURF, BRISK, and ORB). However, after deciding which feature was the most distinctive for a product, the process continued through only one feature extraction method while testing it on new shelf images. Therefore, the hybrid usage of SURF, BRISK, and ORB was faster than using SURF alone. In addition, in another study using the GP-20 [10], this time was, on average, 1 s for the 10 training samples.

5. Conclusions

A hybrid method was proposed in this study for the multi-stage end-to-end recognition of grocery products in shelf images. Several algorithms were utilized to handle the challenges of large-scale classification, data limitation, intra-class variation, and flexibility for different stages of the problem. In Stage-1, SSD was more efficient than the other tested product detection methods, as a traditional computer vision approach and ACF. In Stage-2, the hybrid usage of SURF, BRISK, ORB features provided better results than using them separately. At the final stage, the clustering algorithm was improved by adding neighborhood relation. The experimental results on the datasets with images at different scales were determined and compared with existing studies. Most of the obtained results achieved higher performances on different metrics. In addition, the run-time performance evaluation of this study met the real-time system requirements. As future work, the performance of the proposed system will be increased by training the SSD with larger datasets. In the field of performance and speed, the new versions of YOLO and SSD will be compared. In addition, for the different stages of the product recognition problem, recent methods that have shown efficiency in various application areas (immune coordination deep network, the immune extreme region-based target extraction algorithm, and multiple kernel k-means) will be applied.

Author Contributions

Conceptualization, C.G.M., E.B.S. and S.V.; methodology, C.G.M., E.B.S., H.A. and S.V.; software, C.G.M.; validation, C.G.M., E.B.S., H.A. and S.V.; formal analysis, C.G.M.; investigation, C.G.M., E.B.S. and H.A.; resource, C.G.M., E.B.S., H.A. and S.V.; writing—original draft preparation, C.G.M.; writing—review and editing, E.B.S. and H.A.; supervision, E.B.S., H.A. and S.V. All authors have read and agreed to the published version of the manuscript.

Funding

This research received no external funding.

Data Availability Statement

The other datasets used in this study which are publicly available can be found here:

Conflicts of Interest

The authors declare no conflict of interest.

References

  1. Shapiro, M. Executing the Best Planogram; Professional Candy Buyer: Norwalk, CT, USA, 2009. [Google Scholar]
  2. Gruen, W.T.; Corsten, D.S.; Bharadwaj, S. Retail Out of Stocks: A Worldwide Examination of Extent, Causes, and Consumer Responses; Grocery Manufacturers of Amerika: Washington, DC, USA, 2002. [Google Scholar]
  3. Berger, R. Optimal Shelf Availability: Increasing Shopper Satisfaction at the Moment of Truth. October 2016. Available online: http://ecr-community.org/wp-content/uploads/2016/10/ecr-europe-osa-optimal-shelf-availability.pdf (accessed on 20 June 2023).
  4. Dollar, P.; Appel, R.; Belongie, S.; Perona, P. Fast feature pyramids for object detection. IEEE Trans. Pattern Anal. Mach. Intell. 2014, 36, 1532–1545. [Google Scholar] [CrossRef]
  5. Liu, W.; Anguelov, D.; Erhan, D.; Szegedy, C.; Reed, S.; Fu, C.Y.; Berg, A.C. SSD: Single shot multibox detector. In Lecture Notes in Computer Science; Springer: Berlin/Heidelberg, Germany, 2016; Volume 9905 LNCS, pp. 21–37. [Google Scholar] [CrossRef]
  6. Bay, H.; Tuytelaars, T.; Van Gool, L. LNCS 3951—SURF: Speeded Up Robust Features. In Lecture Notes in Computer Science; Springer: Berlin/Heidelberg, Germany, 2006. [Google Scholar]
  7. Leutenegger, S.; Chli, M.; Siegwart, R.Y. BRISK: Binary Robust invariant scalable keypoints. In Proceedings of the IEEE International Conference on Computer Vision, Washington, DC, USA, 6–13 November 2011; pp. 2548–2555. [Google Scholar] [CrossRef]
  8. Rublee, E.; Rabaud, V.; Konolige, K.; Bradski, G. ORB: An efficient alternative to SIFT or SURF. In Proceedings of the IEEE International Conference on Computer Vision, Washington, DC, USA, 6–13 November 2011; pp. 2564–2571. [Google Scholar] [CrossRef]
  9. George, M.; Floerkemeier, C. LNCS 8690—Recognizing Products: A Per-exemplar Multi-label Image Classification Approach. In Lecture Notes in Computer Science; Springer: Berlin/Heidelberg, Germany, 2014. [Google Scholar]
  10. Franco, A.; Maltoni, D.; Papi, S. Grocery product detection and recognition. Expert Syst. Appl. 2017, 81, 163–176. [Google Scholar] [CrossRef]
  11. Tonioni, A.; Di Stefano, L. Product recognition in store shelves as a sub-graph isomorphism problem. In Lecture Notes in Computer Science; Springer: Berlin/Heidelberg, Germany, 2017; Volume 10484 LNCS, pp. 682–693. [Google Scholar] [CrossRef]
  12. Varol, G.; Kuzu, R.S. Toward retail product recognition on grocery shelves. In Proceedings of the 6th International Conference on Graphic and Image Processing (ICGIP 2014), Beijing, China, 24–26 October 2014. [Google Scholar] [CrossRef]
  13. Goldman, E.; Herzig, R.; Eisenschtat, A.; Goldberger, J.; Hassner, T. Precise detection in densely packed scenes. In Proceedings of the 2019 IEEE/CVF Conference on Computer Vision and Pattern Recognition (CVPR), Long Beach, CA, USA, 15–20 June 2019; pp. 5222–5231. [Google Scholar] [CrossRef]
  14. Fernandcz, W.P.; Xian, Y.; Tian, Y. Image-Based Barcode Detection and Recognition to Assist Visually Impaired Persons. In Proceedings of the 2017 IEEE 7th Annual International Conference on CYBER Technology in Automation, Control, and Intelligent Systems (CYBER), Honolulu, HI, USA, 31 July–4 August 2017; pp. 1241–1245. [Google Scholar] [CrossRef]
  15. Kulyukin, V.; Kutiyanawala, A. From ShopTalk to ShopMobile: Vision-based barcode scanning with mobile phones for independent blind grocery shopping. In Proceedings of the 2010 Rehabilitation Engineering and Assistive Technology Society of North America Conference (RESNA 2010), Las Vegas, NV, USA, 26–30 June 2010; Volume 703, pp. 1–5. Available online: http://digital.cs.usu.edu/~vkulyukin/vkweb/pubs/RESNA2010_VKulyukin1.pdf (accessed on 20 June 2023).
  16. Condea, C.; Thiesse, F.; Fleisch, E. RFID-enabled shelf replenishment with backroom monitoring in retail stores. Decis. Support Syst. 2012, 52, 839–849. [Google Scholar] [CrossRef]
  17. Metzger, C.; Thiesse, F.; Gershwin, S.; Fleisch, E. The impact of false-negative reads on the performance of RFID-based shelf inventory control policies. Comput. Oper. Res. 2013, 40, 1864–1873. [Google Scholar] [CrossRef]
  18. Wolbitsch, M.; Hasler, T.; Goller, M.; Gutl, C.; Walk, S.; Helic, D. RFID in the Wild—Analyzing Stocktake Data to Determine Detection Probabilities of Products. In Proceedings of the 2019 Sixth International Conference on Internet of Things: Systems, Management and Security (IOTSMS), Granada, Spain, 22–25 October 2019; pp. 251–258. [Google Scholar] [CrossRef]
  19. Busu, M.F.M.; Ismail, I.; Saaid, M.F.; Norzeli, S.M. Auto-checkout system for retails using Radio Frequency Identification (RFID) technology. In Proceedings of the 2011 IEEE Control and System Graduate Research Colloquium, Shah Alam, Malaysia, 27–28 June 2011; pp. 193–196. [Google Scholar] [CrossRef]
  20. McCathie, L. The Advantages and Disadvantages of Barcodes and Radio Frequency Identification in Supply Chain Management. Bachelor’s Thesis, University of Wollongong, Wollongong, Australia, 2004; p. 125. [Google Scholar]
  21. Maulana, F.; Nixon; Putra, R.P.; Hanafiah, N. Self-Checkout System Using RFID (Radio Frequency Identification) Technology: A Survey. In Proceedings of the 2021 1st International Conference on Computer Science and Artificial Intelligence (ICCSAI), Jakarta, Indonesia, 28 October 2021; pp. 273–277. [Google Scholar] [CrossRef]
  22. Merler, M.; Galleguillos, C.; Belongie, S. Recognizing groceries in situ using in vitro training data. In Proceedings of the 2007 IEEE Conference on Computer Vision and Pattern Recognition, Minneapolis, MN, USA, 18–23 June 2007. [Google Scholar] [CrossRef]
  23. Winlock, T.; Christiansen, E.; Belongie, S. Toward real-time grocery detection for the visually impaired. In Proceedings of the 2010 IEEE Computer Society Conference on Computer Vision and Pattern Recognition—Workshops, San Francisco, CA, USA, 13–18 June 2010; pp. 49–56. [Google Scholar] [CrossRef]
  24. Karlinsky, L.; Shtok, J.; Tzur, Y.; Tzadok, A. Fine-grained recognition of thousands of object categories with single-example training. In Proceedings of the 2017 IEEE Conference on Computer Vision and Pattern Recognition (CVPR), Honolulu, HI, USA, 21–26 July 2017; Volume 2017, pp. 965–974. [Google Scholar] [CrossRef]
  25. Baz, I.; Yoruk, E.; Cetin, M. Context-Aware Confidence Sets for Fine-Grained Product Recognition. IEEE Access 2019, 7, 76376–76393. [Google Scholar] [CrossRef]
  26. De Feyter, F.; Goedemé, T. Joint Training of Product Detection and Recognition Using Task-Specific Datasets. In Proceedings of the 18th International Joint Conference on Computer Vision, Imaging and Computer Graphics Theory and Applications, Lisbon, Portugal, 19–21 February 2023; VISAPP; SciTePress: Setúbal, Portugal, 2023; Volume 5. [Google Scholar]
  27. Varol, G. Product Placement Detection Based on Image Processing. In Proceedings of the 2014 22nd Signal Processing and Communications Applications Conference (SIU), Trabzon, Turkey, 23–25 April 2014. [Google Scholar] [CrossRef]
  28. Pan, X.; Ren, Y.; Sheng, K.; Dong, W.; Yuan, H.; Guo, X.; Ma, C.; Xu, C. Dynamic refinement network for oriented and densely packed object detection. In Proceedings of the IEEE/CVF Conference on Computer Vision and Pattern Recognition, Seattle, WA, USA, 13–19 June 2020; pp. 11204–11213. [Google Scholar] [CrossRef]
  29. Gökdag, Ü. Planogram Matching Control in Grocery Products by Image Processing. In Proceedings of the 2016 24th Signal Processing and Communication Application Conference (SIU), Zonguldak, Turkey, 16–19 May 2016. [Google Scholar] [CrossRef]
  30. Srivastava, M.M. Bag of tricks for retail product image classification. In Lecture Notes in Computer Science; Springer: Berlin/Heidelberg, Germany, 2020; Volume 12131 LNCS, pp. 71–82. [Google Scholar] [CrossRef]
  31. Gokdag, U.; Akpınar, M.Y. Raf Görüntüleri Üzerinde Nesne Tanımaya Dayalı Planogram Eşleştirme. In Proceedings of the Conference: XVIII. AKADEMİK BİLİŞİM KONFERANSI—AB 2016, Aydın, Turkey, February 2019. [Google Scholar]
  32. Kant, S. Learning Gaussian Maps for Dense Object Detection. 2020, pp. 1–13. Available online: http://arxiv.org/abs/2004.11855 (accessed on 20 June 2023).
  33. Wang, C.; Huang, C.; Zhu, X.; Zhao, L. One-shot retail product identification based on improved Siamese neural networks. Circuits Syst. Signal Process. 2022, 41, 6098–6112. [Google Scholar] [CrossRef]
  34. Xu, C.; Zheng, Y.; Zhang, Y.; Li, G.; Wang, Y. A method for detecting objects in dense scenes. Open Comput. Sci. 2022, 12, 75–82. [Google Scholar] [CrossRef]
  35. Tonioni, A.; Serra, E.; Di Stefano, L. A deep learning pipeline for product recognition on store shelves. In Proceedings of the 2018 IEEE International Conference on Image Processing, Applications and Systems (IPAS), Sophia Antipolis, France, 12–14 December 2018; pp. 25–31. [Google Scholar] [CrossRef]
  36. Selvam, P.; Koilraj, J.A.S. A deep learning framework for grocery product detection and recognition. Food Anal. Methods 2022, 15, 3498–3522. [Google Scholar] [CrossRef]
  37. Tiwary, T.; Mahapatra, R.P. Enhancement in web accessibility for visually impaired people using hybrid deep belief network–bald eagle search. Multimed. Tools Appl. 2023, 82, 24347–24368. [Google Scholar] [CrossRef]
  38. Zhou, Z.; Zhang, B.; Yu, X. Immune coordination deep network for hand heat trace extraction. Infrared Phys. Technol. 2022, 127, 104400. [Google Scholar] [CrossRef]
  39. Yu, X.; Ye, X.; Zhang, S. Floating pollutant image target extraction algorithm based on immune extremum region. Digit. Signal Process. 2022, 123, 103442. [Google Scholar] [CrossRef]
  40. Liu, X.; Zhu, X.; Li, M.; Wang, L.; Zhu, E.; Liu, T.; Gao, W. Multiple kernel k-means with incomplete kernels. IEEE Trans. Pattern Anal. Mach. Intell. 2019, 42, 1191–1204. [Google Scholar] [CrossRef]
  41. Ren, S.; He, K.; Girshick, R.; Sun, J. Faster R-CNN: Towards Real-Time Object Detection with Region Proposal Networks. IEEE Trans. Pattern Anal. Mach. Intell. 2017, 39, 1137–1149. [Google Scholar] [CrossRef] [PubMed]
  42. Redmon, J.; Farhadi, A. YOLO9000: Better, faster, stronger. In Proceedings of the IEEE Conference on Computer Vision and Pattern Recognition (CVPR), Honolulu, HI, USA, 21–26 July 2017; Volume 2017, pp. 6517–6525. [Google Scholar] [CrossRef]
  43. Lin, T.Y.; Goyal, P.; Girshick, R.; He, K.; Dollar, P. Focal Loss for Dense Object Detection. IEEE Trans. Pattern Anal. Mach. Intell. 2020, 42, 318–327. [Google Scholar] [CrossRef] [PubMed]
  44. He, K.; Gkioxari, G.; Dollár, P.; Girshick, R. Mask R-CNN. IEEE Trans. Pattern Anal. Mach. Intell. 2020, 42, 386–397. [Google Scholar] [CrossRef]
  45. Redmon, J.; Farhadi, A. YOLOv3: An Incremental Improvement. arXiv 2018, arXiv:1804.02767. [Google Scholar]
  46. Zhou, X.; Wang, D.; Krähenbühl, P. Objects as Points. arXiv 2019, arXiv:1904.07850. [Google Scholar]
  47. Lowe, D.G. Object recognition from local scale-invariant features. In Proceedings of the Seventh IEEE International Conference on Computer Vision, Kerkyra, Greece, 20–25 September 1999; Volume 2, pp. 1150–1157. [Google Scholar] [CrossRef]
  48. Barrington, L.; Marks, T.K.; Hsiao, J.H.W.; Cottrell, G.W. Nimble: A kernel density model of saccade-based visual memory. J. Vis. 2008, 8, 17. [Google Scholar] [CrossRef] [PubMed]
  49. Lucas, B.D. An Iterative Image Registration Technique with an Application to Stereo Vision. In Proceedings of the Proceedings of the 7th International Joint Conference on Artificial Intelligence, Vancouver, BC, Canada, 24–28 August 1981. [Google Scholar]
  50. Chatfield, K.; Simonyan, K.; Vedaldi, A.; Zisserman, A. Return of the devil in the details: Delving deep into convolutional nets. In Proceedings of the BMVC 2014—British Machine Vision Conference, Nottingham, UK, 1–5 September 2014; pp. 1–11. [Google Scholar] [CrossRef]
  51. Wei, Y.; Tran, S.; Xu, S.; Kang, B.; Springer, M. Deep Learning for Retail Product Recognition: Challenges and Techniques. Comput. Intell. Neurosci. 2020, 2020, 8875910. [Google Scholar] [CrossRef]
  52. Wei, Y.; Yaoran, S.; Tao, D.; Sailing, H. Detecting Retail Products In Situ Using CNN without Human Effort Labeling. arXiv 2019, arXiv:1904.09781. [Google Scholar]
  53. Simonyan, K.; Zisserman, A. Very deep convolutional networks for large-scale image recognition. In Proceedings of the 3rd International Conference on Learning Representations, ICLR 2015—Conference Track Proceedings, San Diego, CA, USA, 7–9 May 2015; pp. 1–14. [Google Scholar]
  54. Jocher, G. Ultralytics/yolov5: V3.1—Bug Fixes and Performance Improvements. 2020. Available online: https://github.com/ultralytics/yolov5 (accessed on 20 February 2023).
  55. Litman, R.; Anschel, O.; Tsiper, S.; Litman, R.; Mazor, S.; Manmatha, R. SCATTER: Selective context attentional scene text recognizer. In Proceedings of the IEEE/CVF Conference on Computer Vision and Pattern Recognition (CVPR), Seattle, WA, USA, 13–19 June 2020; IEEE: Piscataway, NJ, USA, 2020; pp. 11959–11969. [Google Scholar] [CrossRef]
  56. Hough, P.V. Method and Means for Recognizing Complex. Patterns. Patent No. 3,069,654, 18 December 1962. [Google Scholar]
  57. Bastian, B.T.; Jiji, C.V. Integrated feature set using aggregate channel features and histogram of sparse codes for human detection. Multimed. Tools Appl. 2020, 79, 2931–2944. [Google Scholar] [CrossRef]
  58. Yi, D.; Su, J.; Chen, W. Locust Recognition and Detection via Aggregate Channel Features. In Proceedings of the 2nd UK Robotics and Autonomous Systems Conference (UK-RAS 2019), Loughborough, UK, 24 January 2019. [Google Scholar]
  59. Zhao, A.; Fu, K.; Sun, H.; Sun, X.; Li, F.; Zhang, D.; Wang, H. An Effective Method Based on ACF for Aircraft Detection in Remote Sensing Images. IEEE Geosci. Remote Sens. Lett. 2017, 14, 744–748. [Google Scholar] [CrossRef]
  60. Hermawati, F.A. Combination of Aggregated Channel Features (ACF) Detector and Faster R-CNN to Improve Object Detection Performance in Fetal Ultrasound Images. Int. J. Intell. Eng. Syst. 2018, 11, 65–74. [Google Scholar] [CrossRef]
  61. Girshick, R. Fast R-CNN. In Proceedings of the Computer Vision and Pattern Recognition, Boston, MA, USA, 7–12 June 2015. [Google Scholar] [CrossRef]
  62. Hsu, W.-Y.; Lin, W.-Y. Adaptive Fusion of Multi-Scale YOLO for Pedestrian Detection. IEEE Access 2021, 9, 110063–110073. [Google Scholar] [CrossRef]
  63. He, K. Deep Residual Learning for Image Recognition. In Proceedings of the Conference on Computer Vision and Pattern Recognition (CVPR), Las Vegas, NV, USA, 27–30 June 2016. [Google Scholar]
  64. Du, C.; Sun, D. Comparison of three methods for classification of pizza topping using different colour space transformations. J. Food Eng. 2005, 68, 277–287. [Google Scholar] [CrossRef]
  65. Saleem, Z. A Comparative Analysis of SIFT, SURF, KAZE, AKAZE, ORB, and BRISK. In Proceedings of the 2018 International Conference on Computing, Mathematics and Engineering Technologies (iCoMET), Sukkur, Pakistan, 3–4 March 2018; pp. 1–10. [Google Scholar] [CrossRef]
  66. Mair, E.; Hager, G.D.; Burschka, D.; Suppa, M.; Hirzinger, G. Adaptive and Generic Corner Detection Based on the Accelerated Segment Test. In Proceedings of the ECCV 2010: 11th European Conference on Computer Vision, Heraklion, Crete, Greece, 5–11 September 2010. [Google Scholar]
  67. Rosten, E.; Drummond, T. Machine learning for high-speed corner detection. In Lecture Notes in Computer Science; Springer: Berlin/Heidelberg, Germany, 2006; Volume 3951 LNCS, pp. 430–443. [Google Scholar] [CrossRef]
  68. Calonder, M.; Lepetit, V.; Strecha, C.; Fua, P. BRIEF: Binary Robust Independent Elementary Features. In Proceedings of the ECCV 2010: Computer Vision—ECCV 2010, Heraklion, Crete, Greece, 5–11 September 2010; pp. 778–792. [Google Scholar] [CrossRef]
  69. Yörük, E.; Öner, K.T.; Akgül, C.B. An efficient Hough transform for multi-instance object recognition and pose estimation. In Proceedings of the 2016 23rd International Conference on Pattern Recognition (ICPR), Cancun, Mexico, 4–8 December 2016. [Google Scholar]
  70. George, M.; Mircic, D.; Sörös, G.; Floerkemeier, C.; Mattern, F. Fine-Grained Product Class Recognition for Assisted Shopping. In Proceedings of the 2015 IEEE International Conference on Computer Vision Workshop (ICCVW), Santiago, Chile, 7–13 December 2015; Volume 2015, pp. 546–554. [Google Scholar] [CrossRef]
  71. Krizhevsky, A.; Hinton, G.E. ImageNet Classification with Deep Convolutional Neural Networks. Commun. ACM 2017, 60, 84–90. [Google Scholar] [CrossRef]
  72. Smith, R. An overview of the Tesseract OCR engine. In Proceedings of the Ninth International Conference on Document Analysis and Recognition (ICDAR 2007), Curitiba, Brazil, 23–26 September 2007. [Google Scholar]
Figure 2. Multi-stage end-to-end recognition process. (Red frames indicate the bounding boxes obtained from each step.)
Electronics 12 03640 g002
Figure 3. The steps of the proposed traditional computer vision approach in Stage-1: (a) original shelf image; (b) shelf image with detected shelf lines after first step; (c) shelf image with detected product regions after second step; (d) shelf image with completed product regions after third step.
Electronics 12 03640 g003
Figure 4. (a) The steps of the ACF in Stage-1. (b) The steps of the SSD in Stage-1. (Red frames indicate the obtained bounding boxes predictions.)
Electronics 12 03640 g004
Figure 5. The sample images of the datasets: (a,b) sample shelf images of SKU-110K [13]; (c,d) sample shelf images of the Grocery Dataset [12]; (e,f) sample shelf images of GP-20 [10]; (g,h) sample shelf images of GP-181 [11]; (i,j) sample shelf images of Grocery Products [9]; (k,l) sample template images of Grocery Products [9]. (Red frames indicates the ground truth information of annotation file of datasets).
Electronics 12 03640 g005
Table 1. Taxonomy table.
PublicationsShelf
Detection
Product
Detection
Product
Classification
Product Detection and Classification Performed JointlyEnd-to-EndRunning Time Performance Evaluation
[10]--**
[11]--
[12]----
[13]----
[22]----
[23]---
[24]---
[25]----
[26]----
[27]---
[28]----
[29]---
[30]-----
[31]-----
[32]----
[33]----
[34]----
[35]--**
[36]---
[37]-**-**
This paper-
✓ denotes the study in the row includes the specified item in the column. * denotes using text detection instead of product detection and using text generation instead of product classification. ** denotes the studies have restricted information about running-time performance evaluation.
Table 2. Pseudo-code of the pre-elimination process.
function: pre_elimination _process(T,R,Thr_Th,Thr_Tl,Thr_ch)
    Input: T = template image set
                        R = region proposals image set
                        Thr_Th = the highest aspect ratio of template image
                        Thr_Tl = the lowest aspect ratio of template image
                        Thr_ch = threshold value for intersection of color histograms
    Output: R_new = new region proposals after pre_elimination process
     R n e w
    for each  T i
             M T ,   N T s i z e   o f   T i
             T h r _ T h max M T ,   N T /   m i n M T ,   N T   * 1.5
             T h r _ T l max M T ,   N T /   m i n M T ,   N T   * 0.5
             H T H S V c o m p u t e   c o l o r   h i s t o g r a m   o f   T i
            for each  R j
                  M R ,   N R s i z e   o f   R j
                 if  max M R ,   N R /   m i n M R ,   N R < T h r _ T h   | |   max M R ,   N R /   m i n M R ,   N R > T h r _ T l   then
                         H R H S V c o m p u t e   c o l o r   h i s t o g r a m   o f   R j
                               if  H R H S V   H T H S V > T h r _ c h
                                      R n e w R n e w R j
                               end if
                        end if
                 end for
            end for
    return R n e w
Table 3. Overview of the datasets used in the study.
Stage of StudyDataset# Product Categories# of ImagesAnnotationsAnnotated Products
Training of Stage 1Grocery Dataset1354 shelf imagesitem-specific bounding boxesAnnotated with all products
SKU-110Kval1588 shelf imagesitem-specific
bounding boxes
Annotated with all products
Training of Stage 2GP-2020one image per product--
GP-181181one image per product--
Grocery Products27average of 112 different product images in each category (25–415)--
3235one image per product--
Testing of end-to-end systemGP-202071 shelf imagesitem-specific
bounding boxes
Annotated with the
selected products
GP-18118173 shelf imagesitem-specific
bounding boxes
Annotated with the
selected products
Grocery Products27680 shelf imagesSingle bounding box contains multiple
instances of products
Annotated with the
selected products
3235680 shelf imagesSingle bounding box contains multiple instances of productsAnnotated with the selected products
# denotes the number of.
Table 4. The performance of all methods of the proposed multi-stage end-to-end recognition approach on the GP-20 dataset.
Methods Used in Product Detection Stage
Traditional Computer Vision ApproachACF Detector *SSD *
PrecisionRecallPrecisionRecallPrecisionRecall
Methods used in Product Classification StageSURF61.682.259.272.371.578.2
BRISK67.665.257.766.873.783.2
ORB76.558.148.568.978.171.6
A hybrid usage of
SURF & BRISK & ORB
75.178.162.771.278.881.3
* Using the GD + SKU-110Kval dataset for the training of the detector. ACF: Aggregate Channel Features. SSD: Single-Shot Detectors. SURF: Speed-up Robust Features. BRISK: Binary Robust Invariant Scalable Key points. ORB: Oriented Features from Accelerated Segment Test, Rotated Binary Robust Independent Elementary Features.
Table 5. The performance of the CA with the NR_CA in the refinement stage on the GP-20 dataset.
PrecisionRecall
CA78.177.5
NR_CA78.881.3
CA: Clustering Algorithm. NR_CA: Neighborhood-Related Clustering Algorithm.
Table 6. The performance of the proposed pipeline method (SSD; hybrid usage of SURF, BRISK, and ORB; and the neighborhood-related clustering algorithm) on the GP-20 dataset.
PrecisionRecall
[10] proposed DNN73.173.6
[10] proposed BoW77.776.5
SSD + SURF & BRISK & ORB + NR_CA (ours)78.881.3
DNN: Deep Neural Network. BoW: Bag of Words. SSD: Single-Shot Detectors. SURF: Speed-up Robust Features. BRISK: Binary Robust Invariant Scalable Key points. ORB: Oriented Features from Accelerated Segment Test, Rotated Binary Robust Independent Elementary Features. NR_CA: Neighborhood-Related Clustering Algorithm.
Table 7. The performance of the proposed pipeline method (SSD; hybrid usage of SURF, BRISK, ORB; and the neighborhood-related clustering algorithm) on the GP-181 dataset.
mAPPR
[11]66.3775.0
[35]76.9385.71
SSD + SURF & BRISK & ORB + NR_CA (ours)81.2384.57
SSD: Single-Shot Detectors. SURF: Speed-up Robust Features. BRISK: Binary Robust Invariant Scalable Key points. ORB: Oriented Features from Accelerated Segment Test, Rotated Binary Robust Independent Elementary Features. NR_CA: Neighborhood-Related Clustering Algorithm.
Table 8. The performance of the proposed pipeline method (SSD); the hybrid usage of SURF, BRISK, ORB; and the neighborhood-related clustering algorithm) on the Grocery Products dataset.
CAPAPPPR
[9]-21.223.543.1
[69]84.632.557.041.6
[70]61.9---
SSD + SURF & BRISK & ORB + NR_CA (ours)76.441.239.448.2
SSD: Single-Shot Detectors. SURF: Speed-up Robust Features. BRISK: Binary Robust Invariant Scalable Key points. ORB: Oriented Features from Accelerated Segment Test, Rotated Binary Robust Independent Elementary Features. NR_CA: Neighborhood-Related Clustering Algorithm.
Table 9. The running times of the used methods in the product classification stage.
SURFBRISKORBA Hybrid Usage of
SURF & BRISK & ORB
GP-20 training set0.2094 s0.0669 s0.0433 s0.0934 s
SSD: Single-Shot Detectors. SURF: Speed-up Robust Features. BRISK: Binary Robust Invariant Scalable Key points. ORB: Oriented Features from Accelerated Segment Test, Rotated Binary Robust Independent Elementary Features.
Disclaimer/Publisher’s Note: The statements, opinions and data contained in all publications are solely those of the individual author(s) and contributor(s) and not of MDPI and/or the editor(s). MDPI and/or the editor(s) disclaim responsibility for any injury to people or property resulting from any ideas, methods, instructions or products referred to in the content.

