Article

Oriented Object Detection in Remote Sensing Using an Enhanced Feature Pyramid Network

1
College of Computer Science&Technology, Chengdu University of Information Technology, Chengdu 610225, China
2
Images and Spatial Information 2011 Collaborative Innovation Center of Sichuan Province, Chengdu 610225, China
*
Author to whom correspondence should be addressed.
These authors contributed equally to this work.
Electronics 2023, 12(17), 3559; https://doi.org/10.3390/electronics12173559
Submission received: 7 July 2023 / Revised: 28 July 2023 / Accepted: 22 August 2023 / Published: 23 August 2023
(This article belongs to the Special Issue Research Advances in Image Processing and Computer Vision)

Abstract

:
Object detection in remote sensing images is a critical task within the field of remote sensing image interpretation and analysis, serving as a fundamental foundation for military surveillance and traffic guidance. Recently, although many object detection algorithms have been improved to adapt to the characteristics of remote sensing images and have achieved good performance, most of them still use horizontal bounding boxes, which struggle to accurately mark targets with multiple angles and dense arrangements in remote sensing images. We propose an oriented bounding box optical remote sensing image object detection method based on an enhanced feature pyramid, and add an attention module to suppress background noise. To begin with, we incorporate an angle prediction module that accurately locates the detection target. Subsequently, we design an enhanced feature pyramid network, utilizing deformable convolutions and feature fusion modules to enhance the feature information of rotating targets and improve the expressive capacity of features at all levels. The proposed algorithm in this paper performs well on the public DOTA dataset and HRSC2016 dataset, compared with other object detection methods, and the detection accuracy AP values of most object categories are improved by at least three percentage points. The results show that our method can accurately locate densely arranged and dynamically oriented targets, significantly reducing the risk of missing detections, and achieving higher levels of target detection accuracy.

1. Introduction

Remote sensing images are typically captured from an aerial perspective, so the orientation of objects in these images often exhibits randomness [1]. Additionally, object detection in remote sensing images poses significant challenges due to the complexity of the imaging environment [2,3,4]. While many algorithms that perform well on natural images have been adapted and improved for remote sensing images, most detection methods still rely on horizontal bounding boxes [5]. These methods struggle to accurately identify the positions of multi-oriented and densely arranged objects, especially when multiple elongated objects are inclined and arranged together, which often leads to blurry localization [6]. As shown in Figure 1, when two ships are docked together at an angle, the use of horizontal bounding boxes introduces ambiguity in their positioning [7]. Therefore, the target position can be located more accurately by an oriented bounding box [8,9,10].
Moreover, unlike natural images that typically have relatively uniform backgrounds, optical remote sensing images often have a wide field of view during imaging, encompassing diverse backgrounds with complex content [11,12,13]. These images also contain a substantial amount of noise, causing great interference in detection and seriously affecting the performance of the detector. The above factors make it difficult for general object detection algorithms to distinguish the target object from the background in remote sensing images [14]. Additionally, in general, a remote sensing image also contains many contours and textures similar to the target to be detected, which also increases the difficulty of detection [15].
In view of the complex backgrounds of remote sensing images, targets are prone to false detection and missed detection, and the targets in the image have the characteristics of random orientation and dense arrangement, which leads to inaccurate positioning of the horizontal bounding box. In this paper, we improved the anchor-free frame detection algorithm of fully convolutional one-stage object detection (FCOS) [16], and proposed an oriented bounding box optical remote sensing object detection method based on an enhanced feature pyramid. Firstly, we integrated an angle prediction structure into the network to enable the detection of oriented objects. This structure introduces the angle parameter to indicate the position of the rotated box relative to the horizontal box, and we added an angle prediction convolution to the regression branch of the network for accurate angle parameter prediction. In addition, in order to adapt to the characteristics of remote sensing images, we modified the conventional FPN structure used in FCOS by incorporating an enhanced feature pyramid network (EFPN) to improve the feature representation of oriented objects. EFPN introduces shallow high-resolution features and integrates a bottom-up fusion path following traditional feature pyramid fusion, further enhancing its expressive capabilities. Additionally, we employed deformable convolutions to enhance the network’s feature extraction ability for rotating targets, thereby improving its overall detection accuracy. Finally, an attention mechanism was introduced to suppress background noise and improve the detection accuracy of the network, reducing false detection and missed detection. The whole framework mainly includes the backbone feature extraction network, the enhanced feature pyramid network, and the detection head for regression and classification. A series of experiments show that the proposed method not only greatly improves the detection accuracy compared with the baseline method, but also has strong generalization performance for oriented object detection in different scenes.

2. Related Work on Object Detection

In recent years, deep learning has been applied in many research field, such as image segmentation [17,18], image reconstruction [19,20,21] and medical image processing [22,23]. Most existing state-of-the-art oriented object detection methods [24,25,26] depend on proposal-driven frameworks, like Fast/Faster R-CNN [27,28,29]. Compared to single-stage oriented object detection methods, this proposed method still has disadvantages in terms of computation time and complexity. It eliminates the step of generating candidate regions and directly performs regression on the predicted boxes. Li et al. [30] designed an oriented object detector based on Centernet. It first detects the keypoint of the object’s center, and then, regresses the bounding box offset vectors based on that keypoint to capture the oriented bounding boxes. This approach addresses the issue of positive–negative anchor imbalance. Xiao et al. [31] proposed a novel aspect-ratio-aware localization center method to better balance the positive sample pixels.
To improve the detection of small objects in remote sensing images, Zhang et al. [32] proposed a method based on Faster R-CNN. They applied upsampling to the candidate regions extracted in the first stage to enlarge the size of the feature map, thus enhancing the detection accuracy of the network. Yang et al. [33] designed a multi-scale feature fusion structure that added more feature pyramids (feature pyramid networks, FPNs) to the shallow features and increased information exchange between features through dense connections, improving the detection accuracy of ships. Considering that targets in optical remote sensing images have different shapes and sizes, Dong et al. [34] proposed an attention-based multi-level feature fusion module to adaptively fuse the multi-level outputs of FPN, enabling better detection of targets with various shapes and sizes.
In the context of single-stage detection algorithms, Zhang et al. [35] proposed a deep separable attention-guided network based on YOLOv3 [36]. By combining multi-level feature concatenation and a channel-wise feature attention mechanism, the network’s feature representation capability was significantly enhanced, leading to improved detection accuracy of small-sized vehicles in remote sensing images. Li et al. [37] aimed to eliminate the influence of background noise by adding attention mechanism modules to features of different scales separately, thereby enhancing the features and improving the network’s detection accuracy. Fu et al. [38] introduced bottom-up connections in addition to the top-down fusion in FPN, which increased feature reuse and further enhanced feature representation capability, effectively improving the detection accuracy of remote sensing targets. To address the low detection accuracy of small-scale targets in existing remote sensing image detection algorithms, Li et al. [39] designed an anchor-free detection algorithm based on a dense path aggregation feature pyramid network. It fully utilized high-level semantic information and low-level positional information in remote sensing images, while mitigating the loss of information during the propagation of shallow features to some extent. Liu et al. [40] proposed a dual-attention module for both the center and boundary, which used a dual attention mechanism to extract attention features for the center and boundary regions of targets, reducing the interference from complex backgrounds.

3. Methods

The network model structure of the proposed method is depicted in Figure 2, comprising three key components: the main backbone network responsible for extracting features from the input image, the enhanced feature pyramid network designed for feature fusion, and the detection head dedicated to predicting the final results.

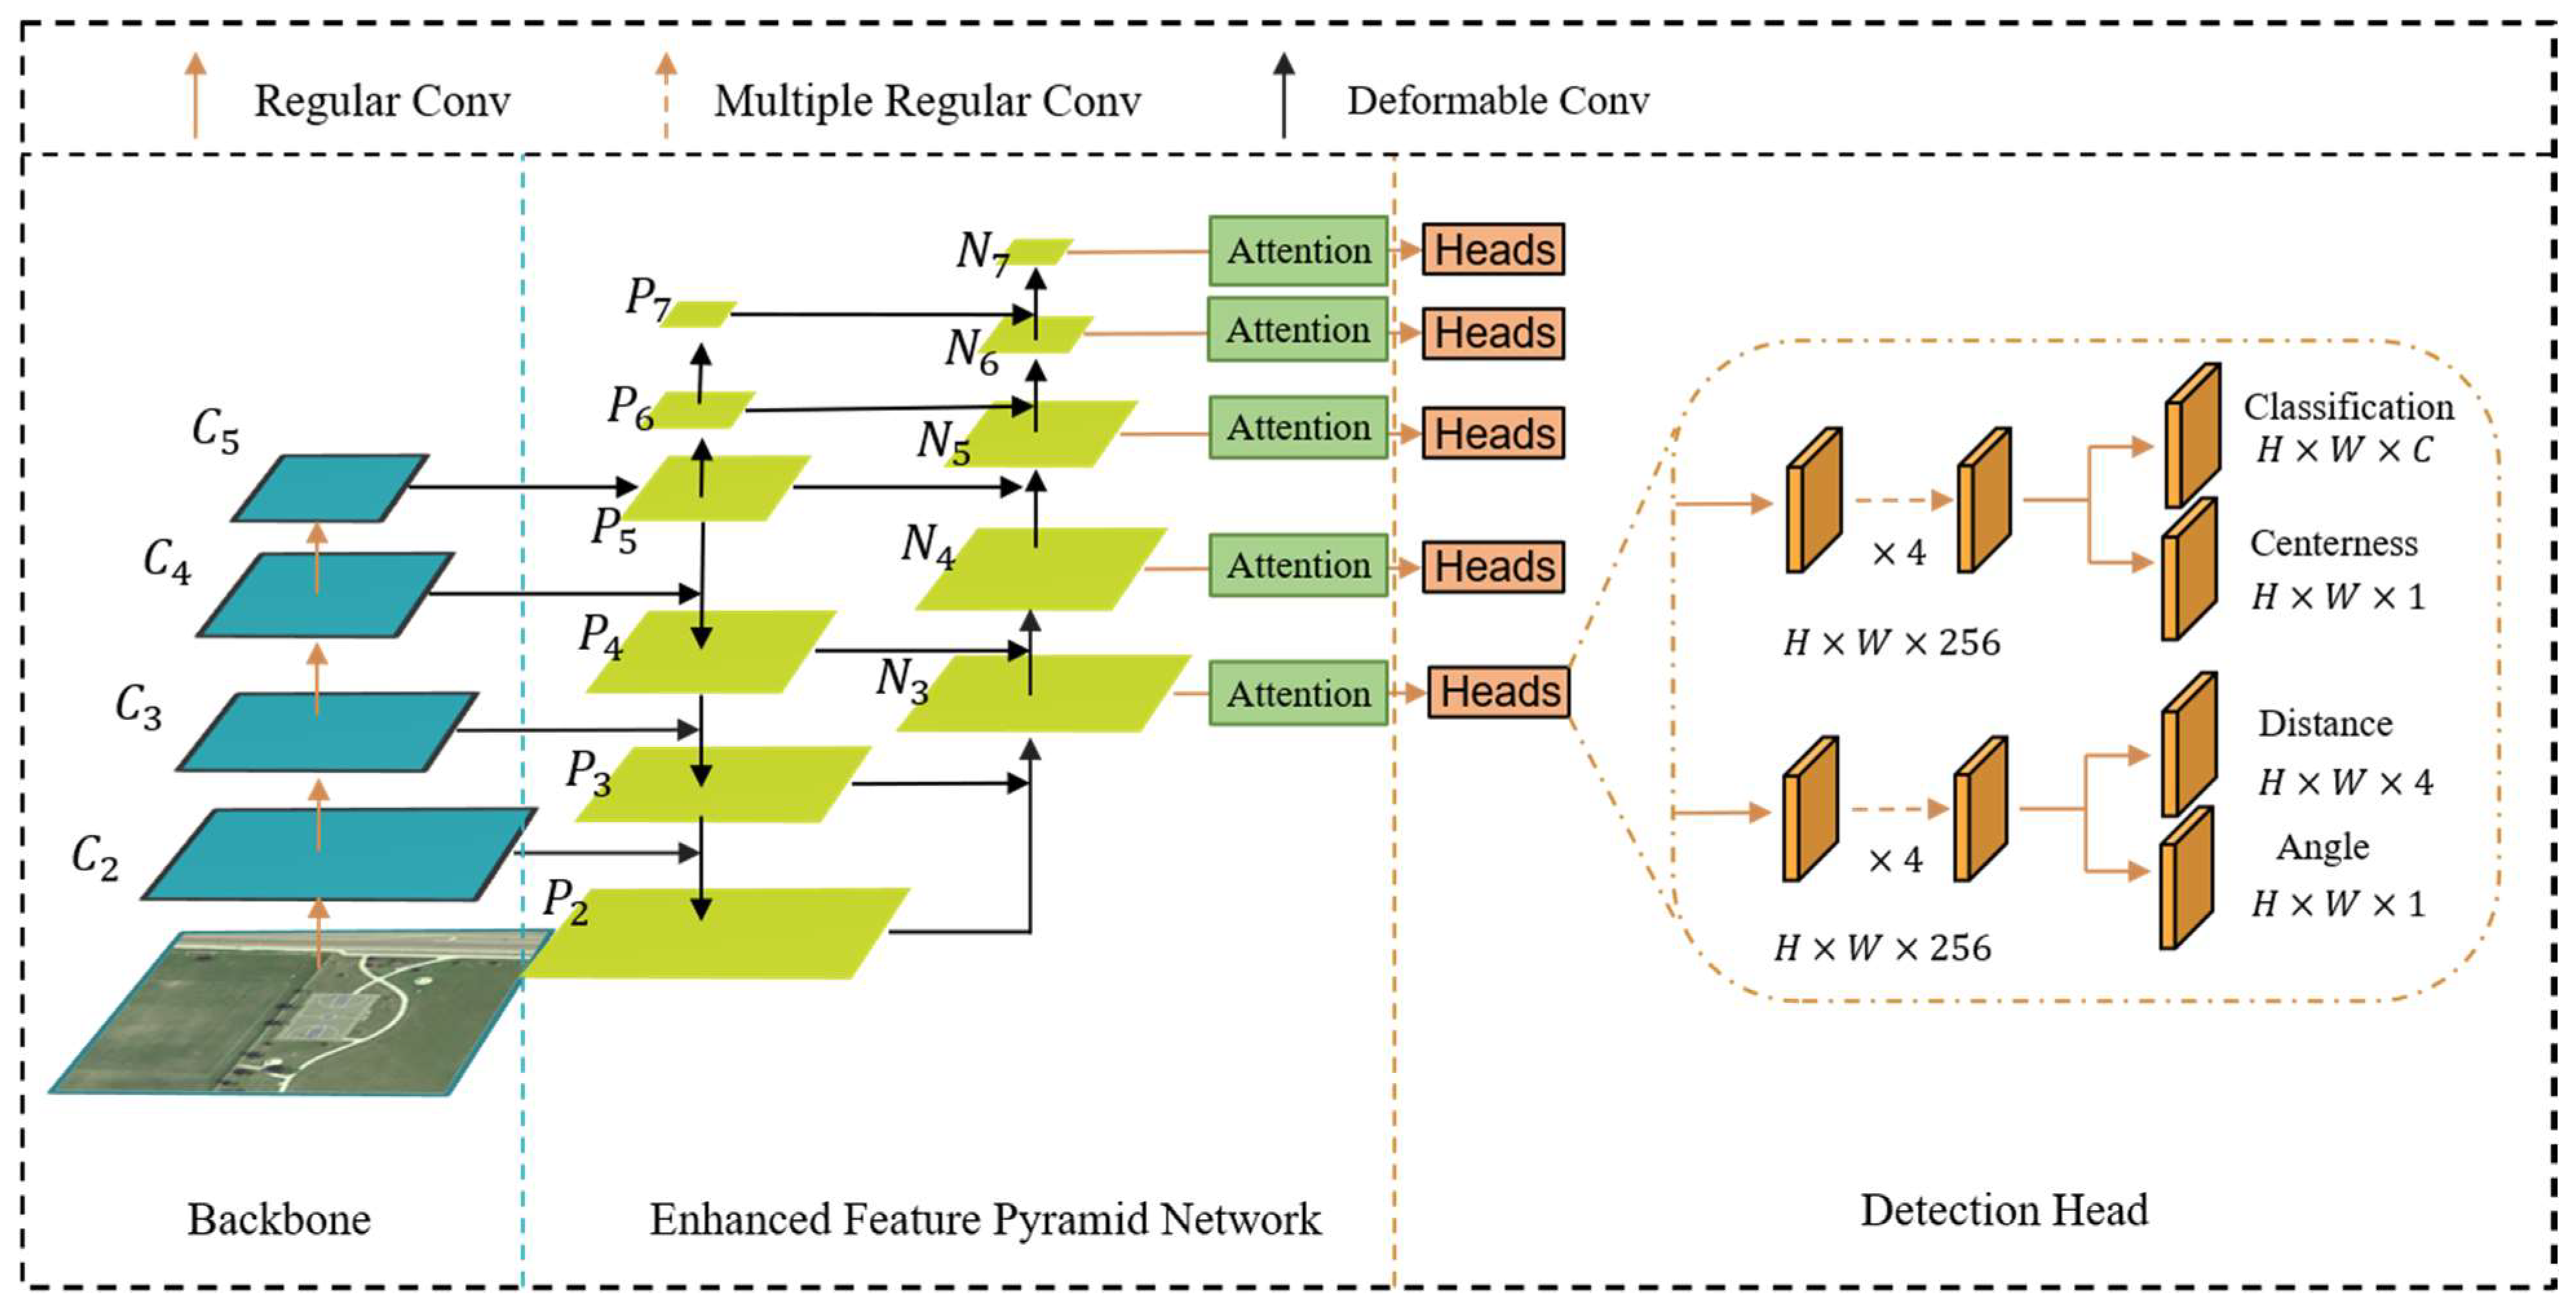
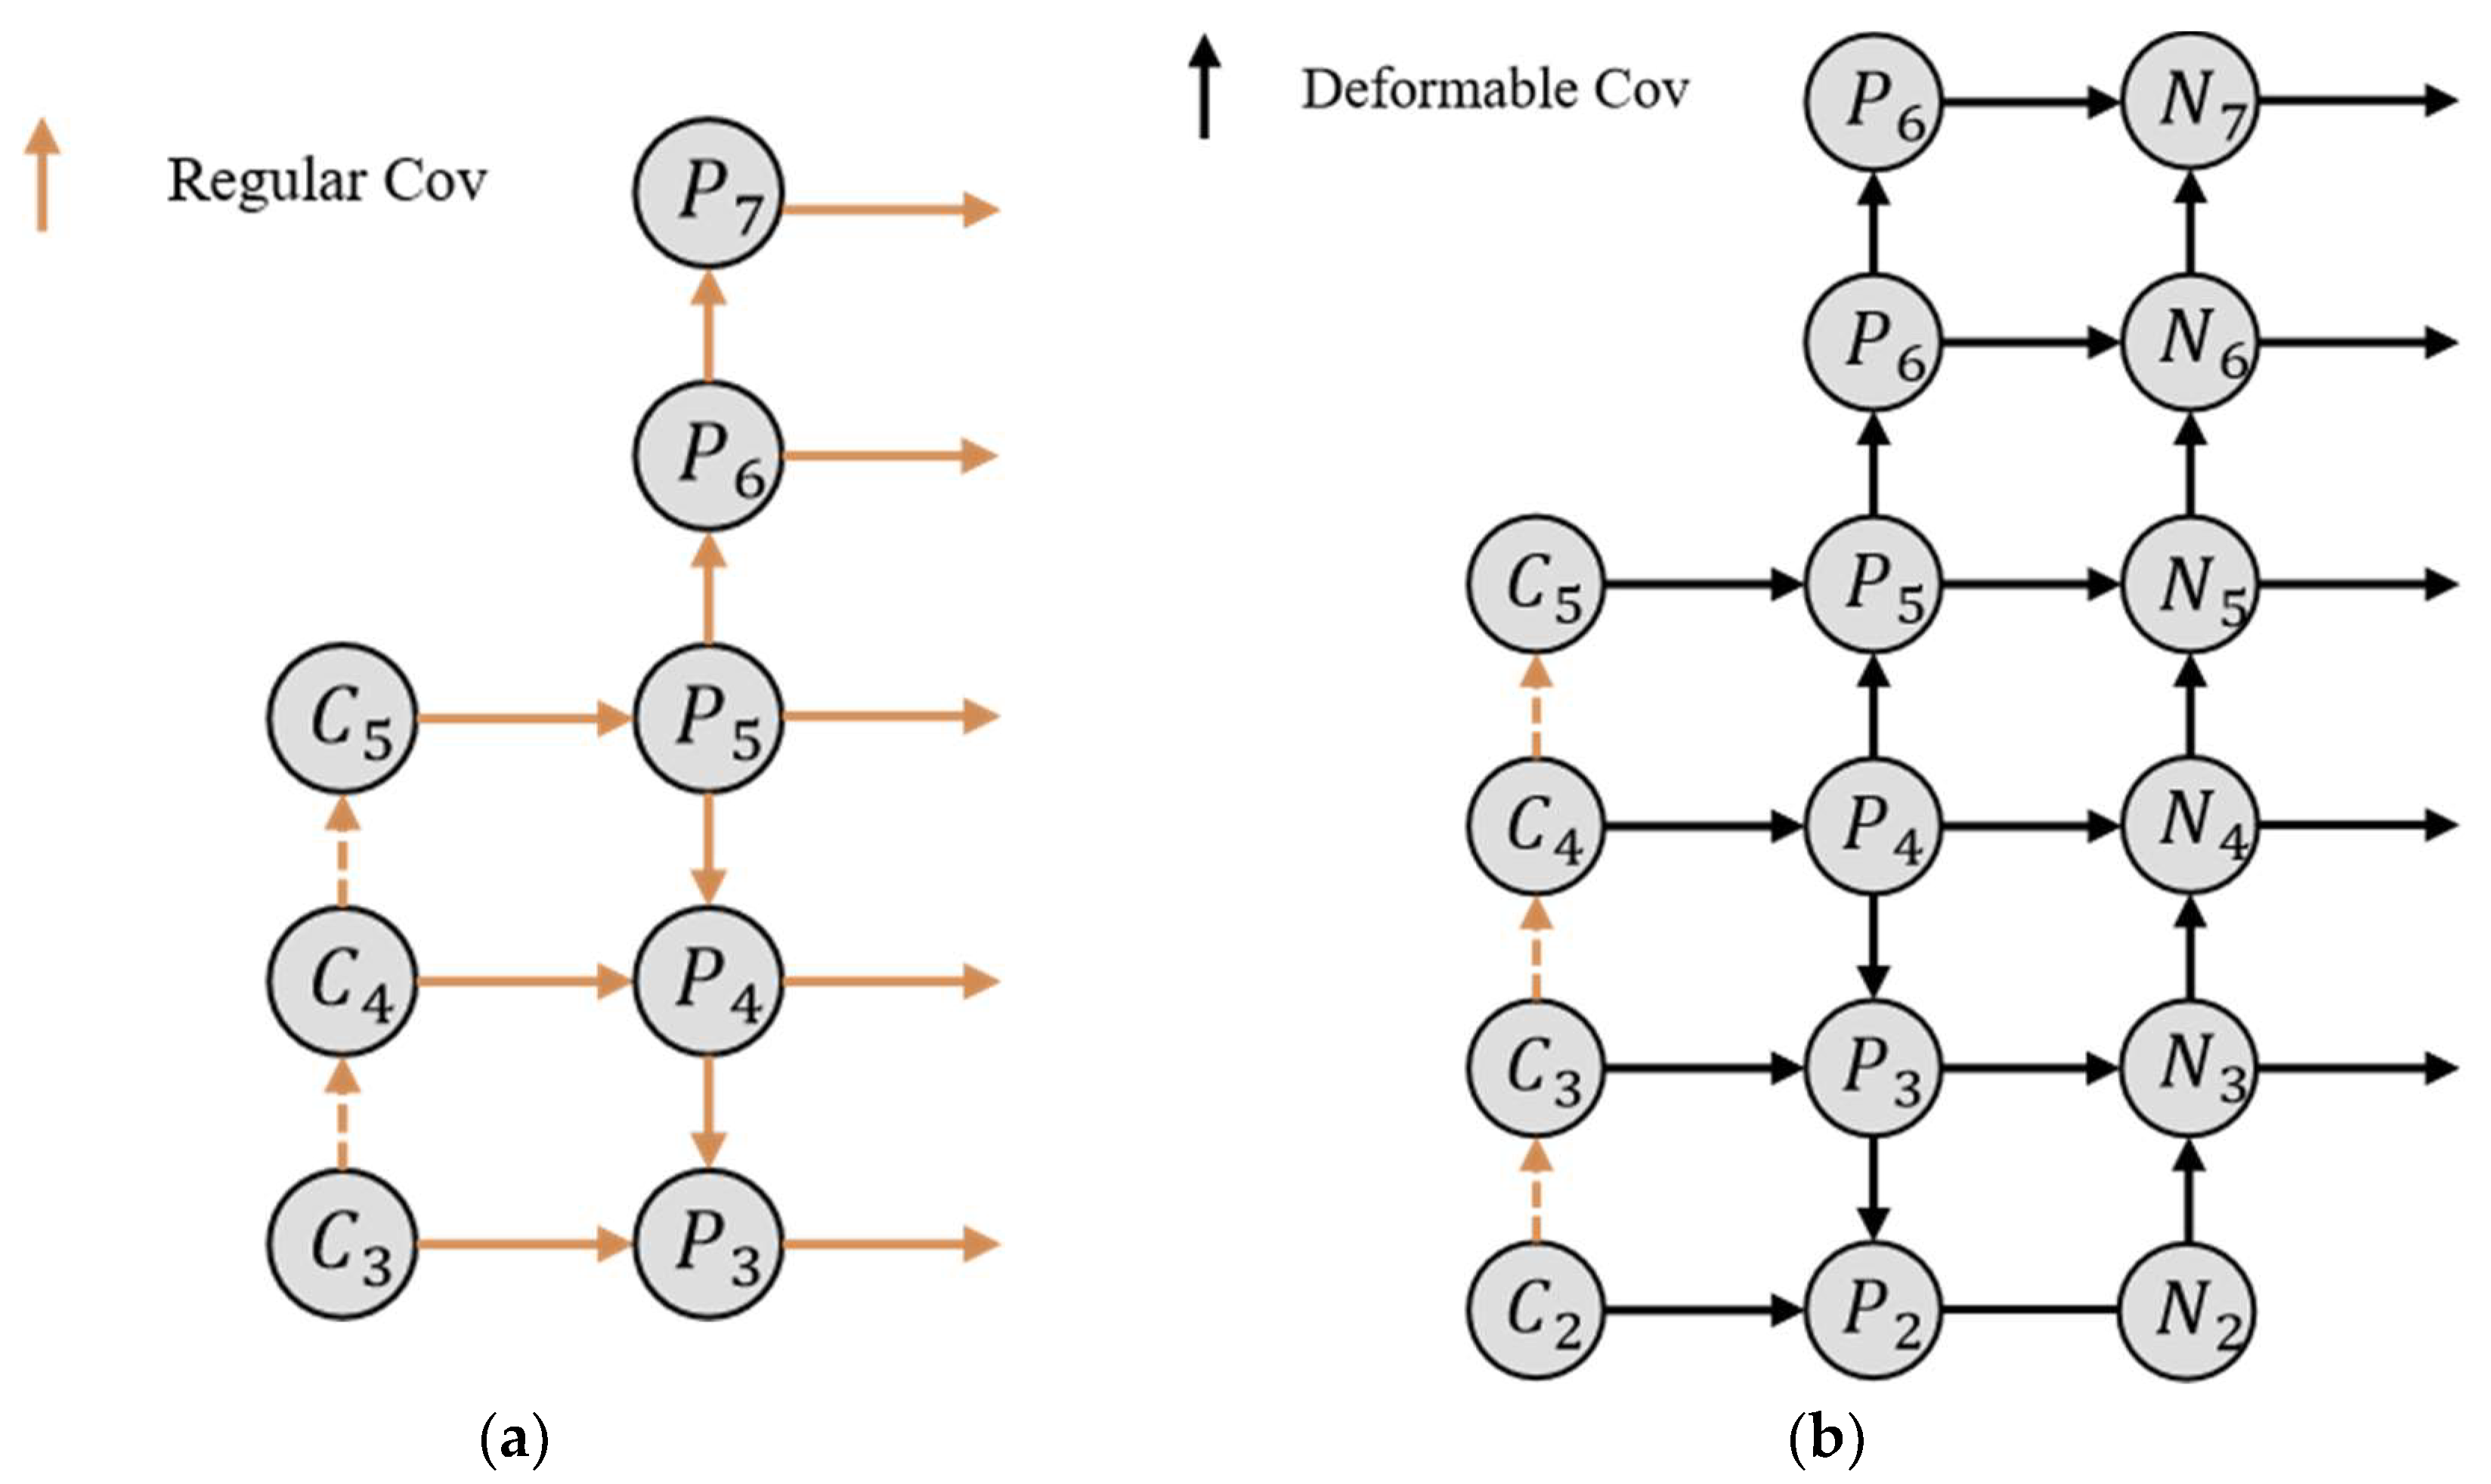
3.1. Enhanced Feature Pyramid

In FCOS, the traditional FPN only utilizes the feature maps C3, C4, and C5 extracted from the ResNet backbone network for feature fusion. However, it ignores the high-resolution feature map C2, leading to the loss of a significant number of target details, especially for small-sized targets. Therefore, it is necessary to incorporate a high-resolution feature map in the feature fusion process.
Furthermore, in the bottom-up pathway of FPN, the shallow features need to pass through several convolutional layers, sometimes dozens or even hundreds, to reach the deeper layers. This results in a severe loss of informative details that are helpful for detection. To address this issue, we introduce an additional bottom-up pathway after the feature fusion in FPN, enriching the information of each level of features and enhancing the model’s prediction performance for objects at multiple scales.
In conventional CNNs, the input feature maps are divided into regions of the same size as the predetermined convolutional kernel, and then, undergo convolutional operations. However, due to the fixed size of the convolutional kernel, the divided regions have the same size on the feature map. This limitation makes traditional convolutional operations less effective for objects with complex deformations.
To address this issue, we incorporate deformable convolution during feature fusion to enhance the network’s ability to extract features from deformable objects. Deformable convolution allows for the adaptive sampling of regions, enabling the network to better capture the characteristics of deformed objects. This improves the network’s generalization performance and makes it more suitable for detecting oriented objects, which are commonly found in remote sensing images.
A comparison between enhanced FPN and traditional FPN structures is illustrated in Figure 3. In the traditional FPN, while fusing features in the top-down pathway, the feature map P5 is upsampled twice to obtain the final output. On the other hand, the enhanced FPN incorporates the high-resolution feature map C2 from the shallow layers into the feature fusion process, and introduces a bottom-up pathway to enhance the expressive power of each layer’s features, thereby improving the detection performance of the network. In Figure 3, the orange arrows represent conventional convolutions, while the black arrows represent deformable convolutions. Deformable convolutions, with their ability to better capture the features of deformable objects, enhance the network’s capability to extract features from objects with various orientations. This further improves the network’s performance in detecting objects with multiple angles.
The fusion process of the bottom-up pathway introduced in the enhanced FPN is depicted in Figure 4. First, the feature map Ni is upsampled by a factor of 2 using nearest-neighbor interpolation. Then, it is added pixel-wise with the feature map Pi+1. After passing through the ReLU, DN (deformable convolutional network), and BN (batch normalization) layers, the final output feature maps N3, N4, N5, N6, and N7 are obtained. It is worth noting that N2 corresponds to the same feature map as P2.
Considering the complexity of the background in remote sensing images, which makes it challenging for object detection algorithms to distinguish the target objects from the background, we address this issue by introducing the channel and spatial attention module (CBAM) after the feature fusion in the enhanced FPN. The CBAM module is utilized to suppress background noise in each output feature map. The spatial attention mechanism computes an attention mask that captures crucial spatial information based on the input features. This mask is then applied to the original features, enhancing useful features and weakening irrelevant features, thereby improving feature selection and enhancement. The channel attention mechanism assigns a learnable weight to each channel of the features. These weights represent the relevance of each channel to the key information. By amplifying the channels that are relevant to the current task and suppressing the irrelevant ones, the network can highlight the informative features that are beneficial for object detection, leading to improved detection accuracy and reducing false positives and false negatives.

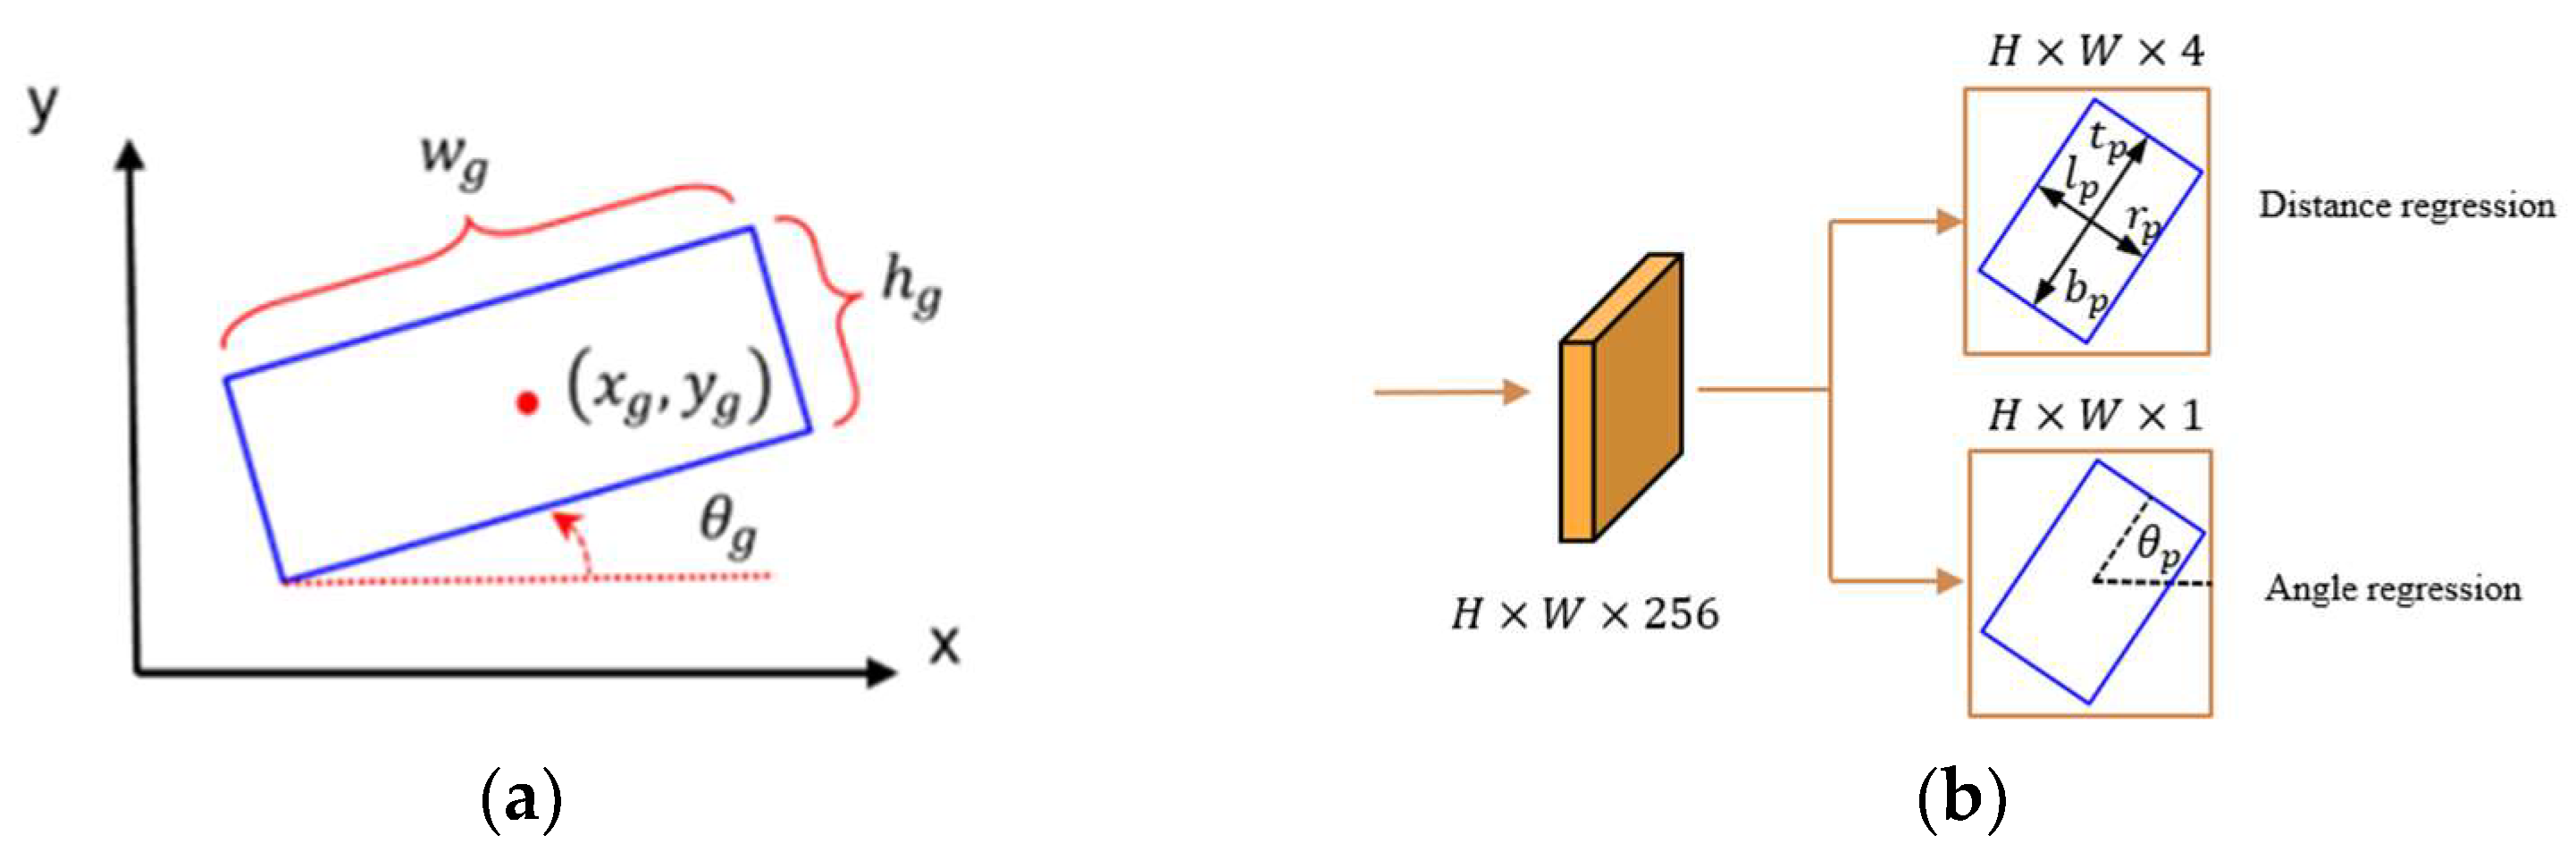
3.2. Oriented Object Detection

In natural images, objects are usually annotated using horizontal bounding boxes, which can accurately represent the position of the object by specifying its center coordinates and dimensions as ( x ,   y ,   w ,   h ) . However, remote sensing images differ significantly from natural images as the orientations of objects in remote sensing images can vary. When objects are densely packed, using horizontal bounding boxes can lead to ambiguous localization. Thus, we introduce an angle parameter to represent the oriented bounding box relative to the level of the frame’s position, represented as ( x ,   y ,   w ,   h ,   θ ) , called five-coordinate representation, and in the network, we use the long-side representation in practice. As shown in Figure 5a, ( x g ,   y g ,   w g ,   h g ,   θ g ) denotes the true labels of the oriented bounding box, where ( x f ,   y f ) denotes the center point of the oriented bounding box, w g represents the length of the long side, h g represents the length of the short side, and θ represents the rotation angle of the box. The angle θ g is defined as the angle between the long side w g and the positive x-axis, and it falls within the range 2 / π ,   2 / π .
In order to detect the rotating target, we add a 1 × 1 convolution to the regression branch of the FCOS network detection head for angle prediction. The improved detection head is shown in Figure 5b. The distance regression branch outputs the predicted distance vector associated with the rotation box, denoted as d p = ( l p ,   t p ,   r p , d p ) , where l p , t p , r p   and b p , respectively, represent the predicted distances from the oriented bounding box to the left, top, right, and bottom boundaries. The angle regression branch predicts the angle θ p of the oriented bounding box.
When a predicted sample falls within the ground truth box, the network considers it a positive sample. In this case, the network needs to regress the angle and distance for that position. Equation (1) is used to transform the coordinates   ( x ,   y ) of the sample point in the current feature map to the coordinate system ( x f , y f ) corresponding to the ground truth box. If x f < w g / 2 and y f < h g / 2 , the sample point is deemed to be within the ground truth annotation box and is considered a positive sample. Regression is then performed to obtain the distance and angle.
( x f y f ) = ( c o s θ g s i n θ g s i n θ g c o s θ g ) ( x x g y y g )
Based on Equation (1), we can transform a point on a specific feature map into the coordinate system corresponding to the ground truth box. By combining Equation (2), we can calculate the distance vector d g = ( l g ,   t g ,   r g , d g ) from this positive sample point to the ground truth box.
{ l g = w g 2 + x f t g = h g 2 y f r g = w g 2 x f b g = h g 2 + y f

3.3. Loss Function

Our method’s loss function comprises four components: distance loss L d , classification loss L c l s , angle loss L a n g l e , and centerness loss L c t r n e s s . Distance loss is obtained using Equation (2) and the predicted distance vector d p = ( l p ,   t p ,   r p , d p ) from the network, and it utilizes the IoU loss [41] function for calculation. Angle loss is computed by comparing the predicted angle with the ground truth angle, using the Smooth L1 loss function. To address the issue of class imbalance, classification loss incorporates the focal loss function.
During training, the network needs to regress for each position within the ground truth annotation box, which introduces inherent ambiguity in the samples. Moreover, when a sample point is located far away from the center of the target box, the predicted distance vector may be significantly inaccurate. In order to solve this problem, we adopt the same strategy as FCOS to suppress the location far from the target center through the centerness branch, so as to improve the accuracy of the prediction box obtained by the network. This approach enhances the accuracy of the predicted boxes. Equation (3) represents the calculation of centerness, and centerness loss is computed using the cross-entropy loss function [42].
c e n t e r n e s s = m i n ( l g , r g ) m a x ( l g , r g ) × m i n ( t g , b g ) m a x ( t g , b g )
The total loss is expressed as the sum of four parts:
L ( c p , d p , θ p , c t p ) = 1 N p o s ( x , y ) L c l s ( c p , c g ) + 1 N p o s ( x , y ) I { c p > 0 } L d ( d p , d g ) + 1 N p o s ( x , y ) I { c p > 0 } L a n g l e ( θ p , θ g ) + 1 N p o s ( x , y ) I { c p > 0 } L c t r n e s s ( c t p , c t g )
where c p represents the predicted classification score at the position ( x , y ) of the sample point, c g represents the ground truth label of class at ( x , y ) . If the sample point is a positive sample, the indicator function I C p > 0 takes a value of 1; otherwise, it is 0. c t p represents the predicted centeredness score, and c t g represents the ground truth label of centeredness. N p o s represents the number of positive samples.

4. Experiments

In order to verify the effectiveness of the method, we designed a series of contrast tests and ablation experiments to verify the detection results, and carried out visual analysis of the detection results.
The experiment utilized ResNet50 as the backbone network for feature extraction. The optimization algorithm employed was stochastic gradient descent (SGD) with a momentum of 0.9. The initial learning rate was set to 0.0025 with a decay factor of 0.0001. The learning rate was adjusted using a step strategy, with a batch size of 14. The training process consisted of 36 epochs, with 1250 iterations per epoch. Specifically, the learning rate was reduced by a factor of 10 at the 24th and 33rd epochs. Additionally, supervised data augmentation techniques were applied in the experiment, including color domain enhancement, affine transformations, random cropping, random rotation, random scale ground truth transformations, and random flipping.

4.1. Datasets and Evaluation Index

We used two remote sensing image datasets, DOTAv1.0 [43] and HRSC2016 [44], to carry out the detection experiments.
The DOTAv1.0 dataset is a widely used large-scale aerial dataset that contains diverse scenes such as forests, oceans, and urban areas. It presents significant challenges and is considered a prominent dataset in the field of aerial object detection. The dataset consists of 15 categories, including football fields, helicopters, swimming pools, circular objects, large vehicles, small vehicles, bridges, ports, playgrounds, basketball courts, tennis courts, baseball fields, oil tanks, ships, and airplanes. It contains a total of 188,282 annotated instances. The images in the dataset have varying sizes ranging from 800 × 800 to 4000 × 4000 pixels, with a total of 2806 images. The dataset is divided into training, validation, and test sets in a ratio of 1:2:3, but the annotations for the test set are not publicly available. Therefore, in this paper, the training set was used to train the network model, and the validation set was used for testing purposes.
Due to the high resolution of the images and the presence of densely packed objects in the dataset, we employed a sliding window cropping approach to standardize the image size to 1024 × 1024 pixels. The sliding window had a step size of 512 pixels, and instances were retained only if their Intersection over Union (IoU) with the original annotations after cropping exceeded 0.7. Figure 6 illustrates the cropped images before and after processing. After this preprocessing step, the training and test sets contained 17,706 and 5566 images, respectively.
The HRSC2016 dataset was collected from Google Erath and labeled for ships. It mainly included two scenes of the sea and docked ships. It contained 1061 images, and the total number of ship targets was 2976. The images varied in size from 300 × 300 to 1550 × 900. We followed the official division method during training and testing, where the number of images in the training set was 617 and the number of images in the test set was 444.
We used AP (average precision) and mAP (mean average precision) to measure the detection results. They are standard evaluation metrics commonly used in object detection models. AP represents the detection accuracy for a specific class, while mAP represents the average precision across all classes in a dataset [45]. The larger the value of mAP/AP, the higher the detection accuracy and the better the performance of the model.
AP represents the area under the curve when plotting precision (P) on the horizontal axis and recall (R) on the vertical axis for a specific class. To calculate precision and recall, the following formulas are generally used:
P = T P T P + F P
R = T P T P + F N
TP (true positive) means that the target category is detected in the prediction box and the IoU value is greater than the threshold; FP (false positive) means that the category is detected in the prediction box but the IoU value is smaller than the threshold; and FN (false negative) means that the prediction box only contains background, but actually, there should be targets, representing missed detection. To calculate the above three values, we set the IoU (the IoU is calculated by finding the intersection area between the predicted bounding box and the ground truth bounding box, and then, dividing it by the area of their union) threshold to 0.5. We first sort the prediction boxes corresponding to the same truth box according to IoU value (in special cases, there will be multiple prediction boxes corresponding to a truth box), and select the largest one to compare with the threshold. When the IOU value of the truth box and the prediction box is greater than 0.5, we consider the detected object TP (the rest of the subsequent detection boxes of the same truth box are considered FP). If the IoU is less than the threshold, it is directly determined as FP.
After obtaining all the TP, FP, and FN values for a class, we use the following formula to obtain the AP and mAP values for the corresponding detection algorithm:
A P = 0 1 P ( R ) d ( R )
m A P = 1 C i = 1 C A P i
In Equation (7), C represents the number of target classes involved in the computation. Higher values of AP and mAP indicate higher detection accuracy and better performance of the model.

4.2. Model Training

After training for 36 epochs with 1250 iterations per epoch on the DOTA dataset, the angle loss, centeredness loss, regression loss, and classification loss of this method gradually decreased, indicating that the model was converging. Figure 7 provides a comparison of the loss reduction between this method and the FCOS baseline with the angle prediction structure during training. The figure shows that the losses of both methods steadily decreased throughout the training process. After approximately 40,000 iterations, both models had converged. Moreover, this method exhibited a faster convergence rate compared to the baseline, suggesting that the proposed approach is superior and easier to train.

4.3. Comparative Experiment and Analysis of Generalization Performance

To assess the effectiveness of our method, we conducted comparative experiments on the DOTA dataset, comparing it against S2aNet [46], Rotated Faster R-CNN with FPN (R-F-R) [47], R3det [48], Rotated RetinaNet (R-R-Net) [49], and the baseline. The experimental results are summarized in Table 1.
Table 1 shows that the mAP value obtained using our method is 3.0% higher than the baseline, which is better than the other algorithms in the table. And the AP values of most categories such as aircraft, bridges, large vehicles, and small vehicles are the highest, especially in densely arranged objects such as baseball stadiums, small vehicles, and basketball courts, the detection accuracy is significantly improved, and the AP values are increased by 3.8%, 4.2%, and 7.4%, respectively, compared with the baseline. Moreover, it has a better detection effect on objects with large aspect ratio such as bridges, harbors, and track and field, and the AP values are 7.9%, 8.1%, and 15.1% higher than the baseline. This is due to the introduction of shallow high-resolution feature maps in the enhanced feature pyramid, which enriches the detailed information of small objects, and the deformable convolution improves the generalization detection ability of the model for objects with large-scale changes.
In order to further validate the effectiveness of our method, we conducted visualizations of the heatmaps generated by the enhanced feature pyramid network on the DOTA dataset. These heatmaps were compared with the output feature maps of the FPN at the baseline. As shown in Figure 8, it can be clearly seen that the characteristic heat map output at the baseline contains a lot of background noise around the target, some target feature information is weakened, and there is a problem of missed detection, while the background around the target output feature heat map of the proposed method is weakened. Using our methodology, the information of the target is enhanced, which verifies the effectiveness of the method.
To further assess the performance of our method, we conducted experiments on the HRSC2016 dataset and compared the results with those of other algorithms, including R-F-R, R3det, R-RetinaNet, and the baseline. The experimental results are presented in Table 2.
It can be seen from Table 2 that the method in this paper still performs well in the HRSC2016 dataset, and the AP value is improved by 2.0% compared with baseline, and is better than other methods in Table 2. This demonstrates the network’s strong generalization performance for oriented object detection in various remote sensing image scenarios.
In order to obtain a more intuitive comparison effect, we visualized the detection results. Figure 9 and Figure 10 are comparisons of the detection results of our method with the baseline, R-RetinaNet, and R-F-R on the DOTA dataset and HRCS2016 dataset, respectively, where (a) represents the real label map, (b) represents the detection result of our method, and (c) represents the baseline detection result. It can be seen that our method reduces false detection and missed detection compared with the other methods, and has better performance in the detection of densely arranged targets.

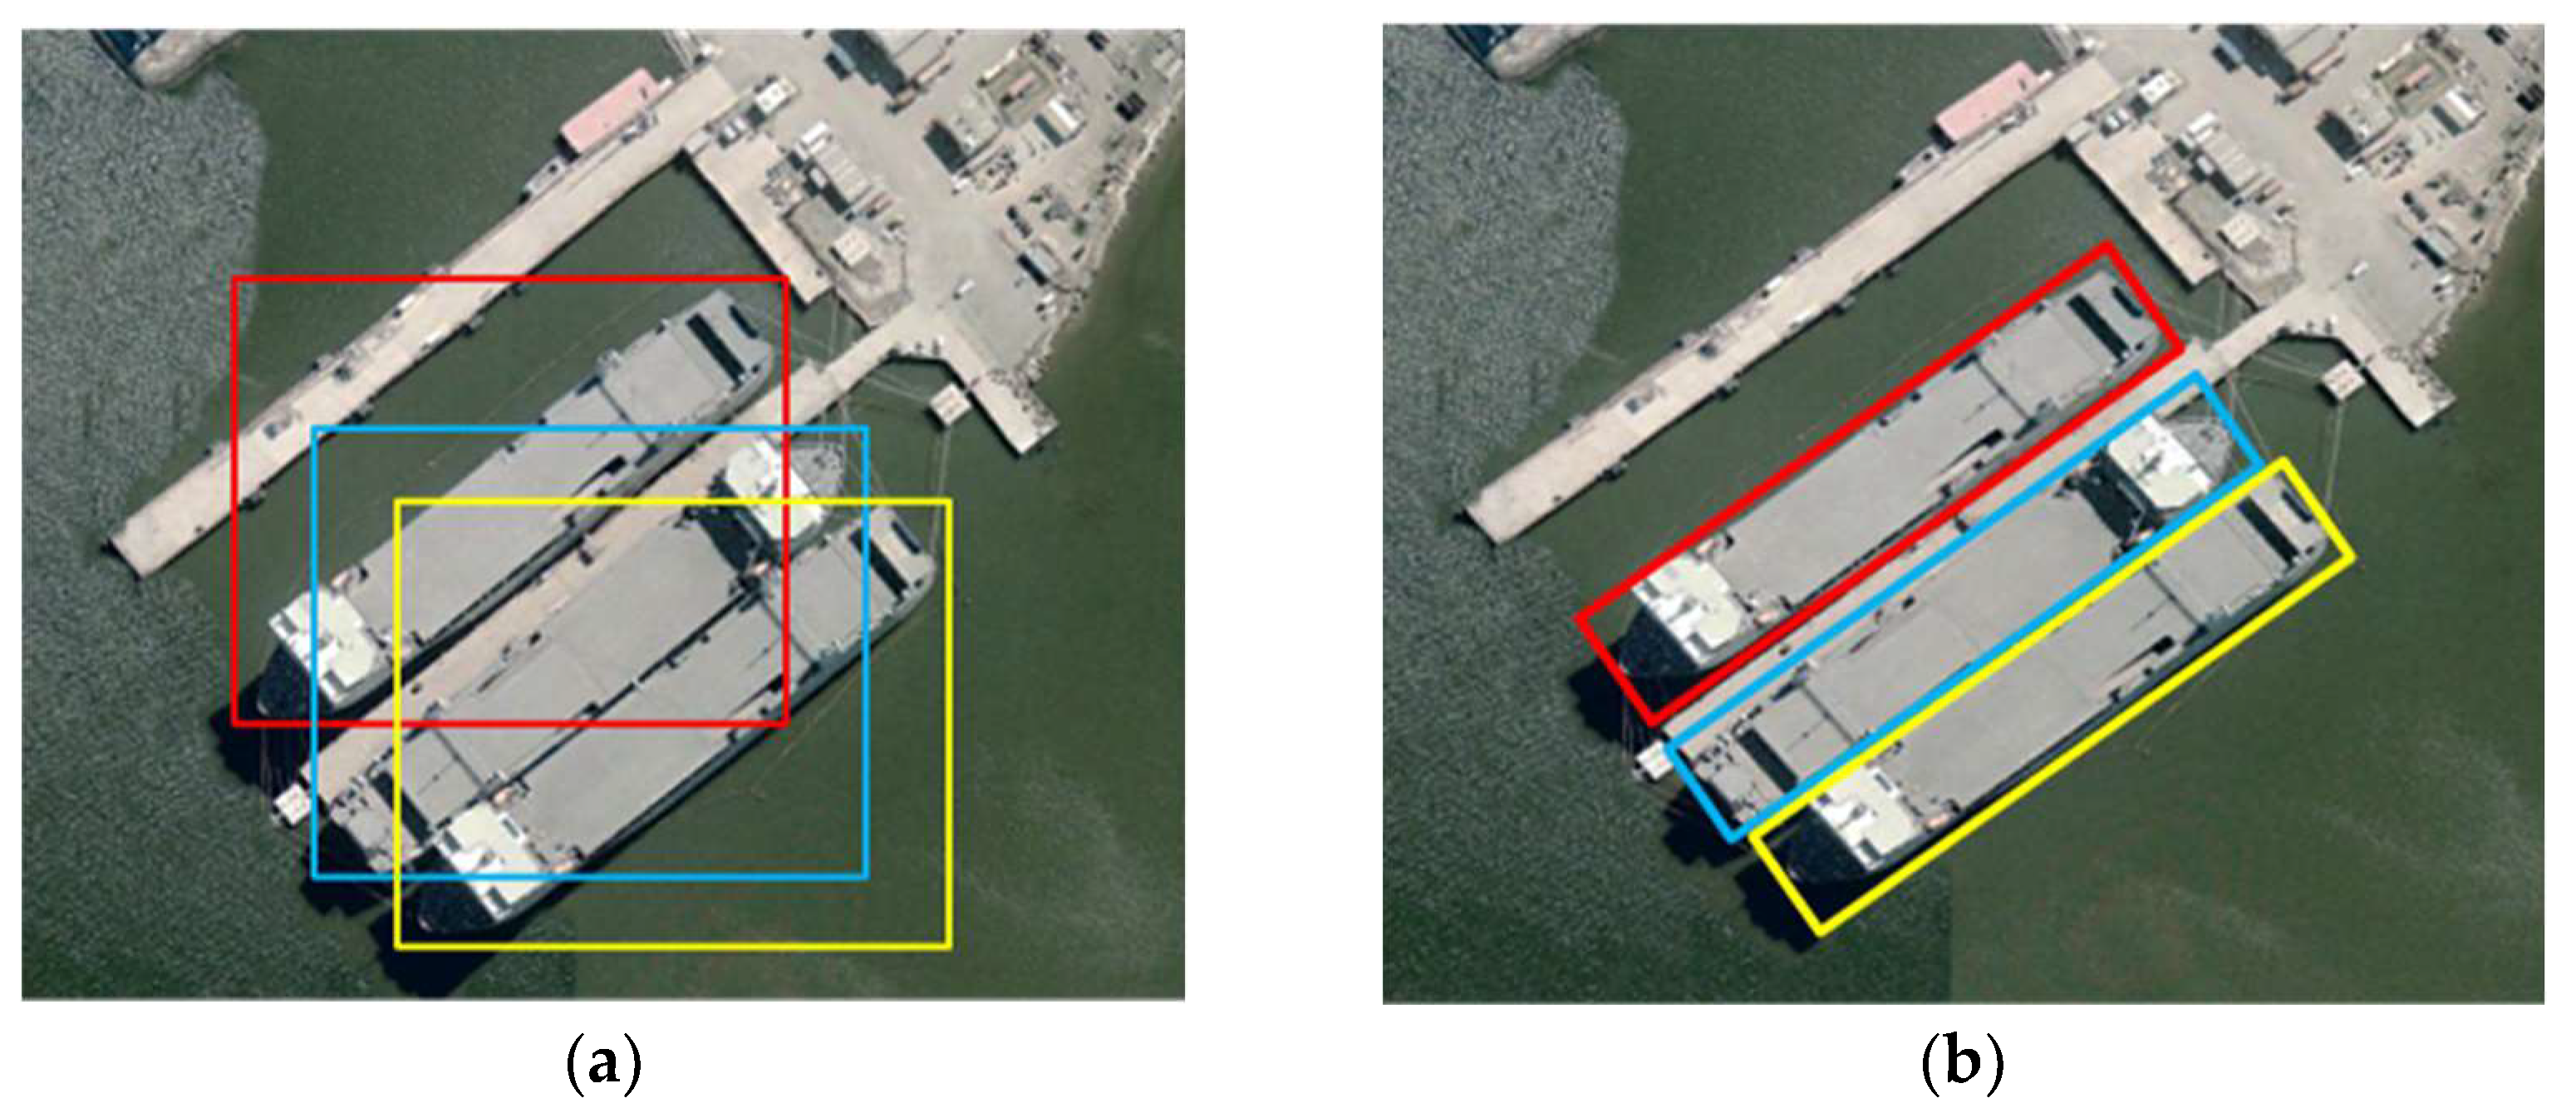
4.4. Ablation Experiment and Detection Result Analysis

To validate the effectiveness of the proposed enhanced feature pyramid network, ablation experiments were conducted on both the DOTA and HRCS2016 datasets. The results are shown in Table 3.
As shown in Table 3, when using deformable convolutions solely in the enhanced feature pyramid network, there is an improvement in mAP values on both datasets. This demonstrates that deformable convolutions possess stronger feature extraction and representation capability for oriented objects in remote sensing images. When introducing only the attention mechanism in the network without using deformable convolutions, there is also an increase in mAP values. This validates the effectiveness of the attention mechanism in suppressing background noise and enhancing the network’s detection accuracy. Furthermore, when both deformable convolutions and the attention mechanism are simultaneously incorporated, the detection accuracy reaches its highest point. This confirms the effectiveness of our proposed enhanced feature pyramid network, which combines the benefits of deformable convolutions and the attention mechanism to improve feature representation and suppress noise, resulting in enhanced overall performance.
An example of the detection results of our method on the DOTA dataset is shown in Figure 11. It can be seen from the figure that this method has better detection results compared to other methods when it comes to tilted and densely arranged targets such as (a) ships and (d) large and small vehicles. and the target can be located more accurately in images with complex backgrounds. In addition, this method can also obtain accurate detection results for images with large deformation and diverse target orientations, and will not be affected by the surrounding background environment, as shown in the detection results of the (e) roundabout and (f) soccer field.

5. Conclusions

In this study, we propose an oriented bounding box object detection method based on an enhanced feature pyramid network. By adding an angle prediction structure to the network, we enable the detection of rotated objects. Additionally, we leverage high-resolution features from a shallow neural network and incorporate a bottom-up pathway to enrich both fine-grained details and semantic information at different levels. Furthermore, we enhance feature representation by using deformable convolutions and introduce an attention mechanism to suppress background noise and highlight information relevant to the detection task.
The experimental results indicate that the proposed algorithm is suitable for target detection in optical remote sensing images with dense target arrangements and significant background interference, especially when there are multiple targets with different orientations. The algorithm ensures satisfactory detection performance and significantly reduces the rates of missed detections and false alarms. Compared to other target detection algorithms, this method exhibits substantial advantages in terms of detection accuracy, target contour representation, and model generalization. However, during the training process, the network requires the cropping of high-resolution dataset images, which increases the experimental time and may result in some information loss due to the presence of numerous densely arranged targets in the images. In future research, we will further investigate the algorithm’s enhancement for detecting high-resolution images and explore different cropping methods.

Author Contributions

X.Z. designed the network architecture, analyzed the data, wrote the paper, and experimentally validated the technical routes; W.Z. designed the technical routes, designed the experiments, analyzed the data, and made revisions to the network; K.W. designed the dataset and made major revisions to the academic content; B.H. analyzed the data and provided funding support; Y.F. selected the topics, determined the paper framework, analyzed and interpreted the data, and made major revisions to the academic content; X.W. acquired the funding and provided the software; J.Z. made major revisions to the academic content. All authors have read and agreed to the published version of the manuscript.

Funding

This research was funded by the Sichuan Natural Science Foundation (No. 2022NSFSC0907); Sichuanl Key Research and Development Program (No. 2022YFG0042, No. 2023YFG0025 ); Project of Innovation Ability Enhancement of Chengdu University of Information Technology (No. KYQN202219); Sichuan Science and Technology Program (No. 2023YFG0025).

Data Availability Statement

The code used in this study can be obtained by contacting the first author. The data source of the DOTA dataset is Detecting Objects in Aerial Images (DOAI) “https://hyper.ai/datasets/4920 (accessed on 28 11 2017)”; the data source of the HRCS2016 dataset is the HRSC2016 dataset samples “https://sites.google.com/site/hrsc2016/ (accessed on 11 05 2016)”.

Acknowledgments

We sincerely thank the authors of S2aNet, FPN, R-F-R, R3det, and R-R-Net for providing their codes to facilitate the comparative experiments, and we thank the anonymous reviewers for their valuable suggestions for improving the quality of this paper.

Conflicts of Interest

The authors declare no conflict of interest.

References

  1. Qiu, H.; Ma, Y.; Li, Z.; Liu, S.; Sun, J. Borderdet: Border feature for dense object detection. In Proceedings of the Computer Vision–ECCV 2020: 16th European Conference, Glasgow, UK, 23–28 August 2020. [Google Scholar]
  2. Shen, Z.; Liu, Z.; Li, J.; Jiang, Y.G.; Chen, Y.; Xue, X. Dsod: Learning deeply supervised object detectors from scratch. In Proceedings of the IEEE International Conference on Computer Vision, Venice, Italy, 22–29 October 2017. [Google Scholar]
  3. Ma, J.; Shao, W.; Ye, H.; Wang, L.; Wang, H.; Zheng, Y.; Xue, X. Arbitrary-oriented scene text detection via rotation proposals. IEEE Trans. Multimed. 2018, 20, 3111–3122. [Google Scholar] [CrossRef]
  4. Kim, K.; Lee, H.S. Probabilistic anchor assignment with iou prediction for object detection. In Proceedings of the Computer Vision–ECCV 2020: 16th European Conference, Glasgow, UK, 23–28 August 2020. [Google Scholar]
  5. Shen, Y.; Liu, D.; Zhang, F.; Zhang, Q. Fast and accurate multi-class geospatial object detection with large-size remote sensing imagery using CNN and Truncated NMS. ISPRS J. Photogramm. Remote Sens. 2022, 191, 235–249. [Google Scholar] [CrossRef]
  6. Zhang, S.; Chi, C.; Yao, Y.; Lei, Z.; Li, S.Z. Bridging the gap between anchor-based and anchor-free detection via adaptive training sample selection. In Proceedings of the IEEE/CVF Conference on Computer Vision and Pattern Recognition, Seattle, WA, USA, 13–19 June 2020. [Google Scholar]
  7. He, K.; Gkioxari, G.; Dollár, P.; Girshick, R. Mask r-cnn. In Proceedings of the IEEE International Conference on Computer Vision, Venice, Italy, 22–29 October 2017. [Google Scholar]
  8. Zhu, C.; Chen, F.; Shen, Z.; Savvides, M. Soft anchor-point object detection. In Proceedings of the Computer Vision–ECCV 2020: 16th European Conference, Glasgow, UK, 23–28 August 2020. [Google Scholar]
  9. Yang, X.; Zhou, Y.; Zhang, G.; Yang, J.; Wang, W.; Yan, J.; Zhang, X.; Tian, Q. The KFIoU loss for rotated object detection. In Proceedings of the Tenth International Conference on Learning Representations (ICLR), Virtual, 25–29 April 2022. [Google Scholar]
  10. Yang, X.; Yan, J.; Liao, W.; Yang, X.; Tang, J.; He, T. Scrdet++: Detecting small, cluttered and rotated objects via instance-level feature denoising and rotation loss smoothing. IEEE Trans. Pattern Anal. Mach. Intell. 2022, 45, 2384–2399. [Google Scholar] [CrossRef] [PubMed]
  11. Li, W.; Chen, Y.; Hu, K.; Zhu, J. Oriented reppoints for aerial object detection. In Proceedings of the IEEE/CVF Conference on Computer Vision and Pattern Recognition, New Orleans, LA, USA, 18–24 June 2022. [Google Scholar]
  12. Yang, X.; Yan, J.; Ming, Q.; Wang, W.; Zhang, X.; Tian, Q. Rethinking rotated object detection with gaussian wasserstein distance loss. In Proceedings of the International Conference on Machine Learning, PMLR, Vienna, Austria, 18–24 July 2021. [Google Scholar]
  13. Yang, X.; Yang, X.; Yang, J.; Ming, Q.; Wang, W.; Tian, Q.; Yan, J. Learning high-precision bounding box for rotated object detection via kullback-leibler divergence. Adv. Neural Inf. Process. Syst. 2021, 34, 18381–18394. [Google Scholar]
  14. Guo, Z.; Liu, C.; Zhang, X.; Jiao, J.; Ji, X.; Ye, Q. Beyond bounding-box: Convex-hull feature adaptation for oriented and densely packed object detection. In Proceedings of the IEEE/CVF Conference on Computer Vision and Pattern Recognition, Nashville, TN, USA, 20–25 June 2021. [Google Scholar]
  15. Yang, X.; Hou, L.; Zhou, Y.; Wang, W.; Yan, J. Dense label encoding for boundary discontinuity free rotation detection. In Proceedings of the IEEE/CVF Conference on computer Vision and Pattern Recognition, Nashville, TN, USA, 20–25 June 2021. [Google Scholar]
  16. Tian, Z.; Shen, C.; Chen, H.; He, T. Fcos: Fully convolutional one-stage object detection. In Proceedings of the IEEE/CVF International Conference on Computer Vision, Seoul, Republic of Korea, 27 October–2 November 2019. [Google Scholar]
  17. Wang, K.; Zhan, B.; Zu, C.; Wu, X.; Zhou, J.; Zhou, L.; Wang, Y. Semi-supervised medical image segmentation via a tripled-uncertainty guided mean teacher model with contrastive learning. Med. Image Anal. 2022, 79, 102447. [Google Scholar] [CrossRef] [PubMed]
  18. Tang, P.; Yang, P.; Nie, D.; Wu, X.; Zhou, J.; Wang, Y. Unified medical image segmentation by learning from uncertainty in an end-to-end manner. Knowl.-Based Syst. 2022, 241, 108215. [Google Scholar] [CrossRef]
  19. Luo, Y.; Zhou, L.; Zhan, B.; Fei, Y.; Zhou, J.; Wang, Y.; Shen, D. Adaptive rectification based adversarial network with spectrum constraint for high-quality PET image synthesis. Med. Image Anal. 2022, 77, 102335. [Google Scholar] [CrossRef]
  20. Wang, Y.; Zhou, L.; Yu, B.; Wang, L.; Zu, C.; Lalush, D.S.; Lin, W.; Wu, X.; Zhou, J.; Shen, D. 3D auto-context-based locality adaptive multi-modality GANs for PET synthesis. IEEE Trans. Med. Imaging 2018, 38, 1328–1339. [Google Scholar] [CrossRef]
  21. Wang, Y.; Yu, B.; Wang, L.; Zu, C.; Lalush, D.S.; Lin, W.; Wu, X.; Zhou, J.; Shen, D.; Zhou, L. 3D conditional generative adversarial networks for high-quality PET image estimation at low dose. Neuroimage 2018, 174, 550–562. [Google Scholar] [CrossRef]
  22. Zhan, B.; Xiao, J.; Cao, C.; Peng, X.; Zu, C.; Zhou, J.; Wang, Y. Multi-constraint generative adversarial network for dose prediction in radiotherapy. Med. Image Anal. 2022, 77, 102339. [Google Scholar] [CrossRef]
  23. Jiao, Z.; Peng, X.; Wang, Y.; Xiao, J.; Nie, D.; Wu, X.; Wang, X.; Zhou, J.; Shen, D. TransDose: Transformer-based Radiotherapy Dose Prediction from CT Images guided by Super-Pixel-Level GCN Classification. Med. Image Anal. 2023, 89, 102902. [Google Scholar] [CrossRef] [PubMed]
  24. Ding, J.; Xue, N.; Long, Y.; Xia, G.S.; Lu, Q. Learning roi transformer for oriented object detection in aerial images. In Proceedings of the IEEE/CVF Conference on Computer Vision and Pattern Recognition, Long Beach, CA, USA, 15–20 June 2019. [Google Scholar]
  25. Xu, Y.; Fu, M.; Wang, Q.; Wang, Y.; Chen, K.; Xia, G.S.; Bai, X. Gliding vertex on the horizontal bounding box for multi-oriented object detection. IEEE Trans. Pattern Anal. Mach. Intell. 2020, 43, 1452–1459. [Google Scholar] [CrossRef] [PubMed]
  26. Yang, X.; Yang, J.; Yan, J.; Zhang, Y.; Zhang, T.; Guo, Z.; Sun, X.; Fu, K. Scrdet: Towards more robust detection for small, cluttered and rotated objects. In Proceedings of the IEEE/CVF International Conference on Computer Vision, Seoul, Republic of Korea, 27 October–2 November 2019. [Google Scholar]
  27. Ren, S.; He, K.; Girshick, R.; Sun, J. Faster r-cnn: Towards real-time object detection with region proposal networks. IEEE Trans. Pattern Anal. Mach. Intell. 2017, 39, 1137–1149. [Google Scholar] [CrossRef] [PubMed]
  28. Girshick, R. Fast r-cnn. In Proceedings of the IEEE International Conference on Computer Vision (ICCV), Santiago, Chile, 7–13 December 2015. [Google Scholar]
  29. Girshick, R.; Donahue, J.; Darrell, T.; Malik, J. Rich feature hierarchies for accurate object detection and semantic segmentation. In Proceedings of the IEEE Conference on computer Vision and Pattern Recognition, Columbus, OH, USA, 23–28 June 2014. [Google Scholar]
  30. Yi, J.; Wu, P.; Liu, B.; Huang, Q.; Qu, H.; Metaxas, D. Oriented object detection in aerial images with box boundary-aware vectors. In Proceedings of the IEEE/CVF Winter Conference on Applications of Computer Vision, Waikoloa, HI, USA, 3–8 January 2021. [Google Scholar]
  31. Xiao, Z.; Qian, L.; Shao, W.; Tan, X.; Wang, K. Axis learning for orientated objects detection in aerial images. Remote Sens. 2020, 12, 908. [Google Scholar] [CrossRef]
  32. Yang, X.; Sun, H.; Sun, X.; Yan, M.; Guo, Z.; Fu, K. Position detection and direction prediction for arbitrary-oriented ships via multitask rotation region convolutional neural network. IEEE Access 2018, 6, 50839–50849. [Google Scholar] [CrossRef]
  33. Dong, X.; Qin, Y.; Gao, Y.; Fu, R.; Liu, S.; Ye, Y. Attention-Based Multi-Level Feature Fusion for Object Detection in Remote Sensing Images. Remote Sens. 2022, 14, 3735. [Google Scholar] [CrossRef]
  34. Zhang, W.; Wang, S.; Thachan, S.; Chen, J.; Qian, Y. Deconv R-CNN for small object detection on remote sensing images. In Proceedings of the IGARSS 2018-2018 IEEE International Geoscience and Remote Sensing Symposium, Valencia, Spain, 22–27 July 2018. [Google Scholar]
  35. Zhang, Z.; Liu, Y.; Liu, T.; Lin, Z.; Wang, S. DAGN: A real-time UAV remote sensing image vehicle detection framework. IEEE Geosci. Remote Sens. Lett. 2019, 17, 1884–1888. [Google Scholar] [CrossRef]
  36. Redmon, J.; Farhadi, A. Yolov3: An incremental improvement. arXiv 2018, arXiv:1804.02767. [Google Scholar]
  37. Li, Q.; Mou, L.; Jiang, K.; Liu, Q.; Wang, Y.; Zhu, X.X. Hierarchical region based convolution neural network for multiscale object detection in remote sensing images. In Proceedings of the IGARSS 2018-2018 IEEE International Geoscience and Remote Sensing Symposium. Valencia, Spain, 22–27 July 2018. [Google Scholar]
  38. Fu, K.; Chang, Z.; Zhang, Y.; Xu, G.; Zhang, K.; Sun, X. Rotation-aware and multi-scale convolutional neural network for object detection in remote sensing images. ISPRS J. Photogramm. Remote Sens. 2020, 161, 294–308. [Google Scholar] [CrossRef]
  39. Li, Y.; Pei, X.; Huang, Q.; Jiao, L.; Shang, R.; Marturi, N. Anchor-free single stage detector in remote sensing images based on multiscale dense path aggregation feature pyramid network. IEEE Access 2020, 8, 63121–63133. [Google Scholar] [CrossRef]
  40. Liu, S.; Zhang, L.; Lu, H.; He, Y. Center-boundary dual attention for oriented object detection in remote sensing images. IEEE Trans. Geosci. Remote Sens. 2021, 60, 5603914. [Google Scholar] [CrossRef]
  41. Rezatofighi, H.; Tsoi, N.; Gwak, J.; Sadeghian, A.; Reid, I.; Savarese, S. Generalized intersection over union: A metric and a loss for bounding box regression. In Proceedings of the IEEE/CVF Conference on Computer Vision and Pattern Recognition, Long Beach, CA, USA, 15–20 June 2019. [Google Scholar]
  42. De Boer, P.T.; Kroese, D.P.; Mannor, S.; Rubinstein, R.Y. A tutorial on the cross-entropy method. Ann. Oper. Res. 2005, 134, 19–67. [Google Scholar] [CrossRef]
  43. Xia, G.S.; Bai, X.; Ding, J.; Zhu, Z.; Belongie, S.; Luo, J.; Datcu, M.; Pelillo, M.; Zhang, L. DOTA: A large-scale dataset for object detection in aerial images. In Proceedings of the IEEE Conference on Computer Vision and Pattern Recognition, Salt Lake City, UT, USA, 18–23 June 2018. [Google Scholar]
  44. Liu, Z.; Yuan, L.; Weng, L.; Yang, Y. A high resolution optical satellite image dataset for ship recognition and some new baselines. In Proceedings of the ICPRAM, Porto, Portugal, 24–26 February 2017. [Google Scholar]
  45. Zheng, L.; Shen, L.; Tian, L.; Wang, S.; Wang, J.; Tian, Q. Scalable person re-identification: A benchmark. In Proceedings of the IEEE International Conference on Computer Vision, Santiago, Chile, 7–13 December 2015. [Google Scholar]
  46. Han, J.; Ding, J.; Li, J.; Xia, G.S. Align deep features for oriented object detection. IEEE Trans. Geosci. Remote Sens. 2021, 60, 5602511. [Google Scholar] [CrossRef]
  47. Liu, Z.; Hu, J.; Weng, L.; Yang, Y. Rotated region based CNN for ship detection. In Proceedings of the 2017 IEEE International Conference on Image Processing (ICIP), Beijing, China, 17–20 September 2017. [Google Scholar]
  48. Yang, X.; Yan, J.; Feng, Z.; He, T. R3det: Refined single-stage detector with feature refinement for rotating object. In Proceedings of the AAAI Conference on Artificial Intelligence, Virtual, 2–9 February 2021. [Google Scholar]
  49. Zhu, M.; Hu, G.; Zhou, H.; Wang, S.; Zhang, Y.; Yue, S.; Bai, Y.; Zang, K. Arbitrary-oriented ship detection based on RetinaNet for remote sensing images. IEEE J. Sel. Top. Appl. Earth Obs. Remote Sens. 2021, 14, 6694–6706. [Google Scholar] [CrossRef]
Figure 1. (a) horizontal bounding box; (b) oriented bounding box.
Electronics 12 03559 g001
Figure 2. A network architecture diagram of our method.
Electronics 12 03559 g002
Figure 3. Comparison diagram between FPN and enhanced FPN: (a) FPN; (b) enhanced FPN.
Electronics 12 03559 g003
Figure 4. The feature fusion process of the enhanced FPN from the bottom-up pathway.
Electronics 12 03559 g004
Figure 5. The oriented bounding box utilized in our approach: (a) representation of the oriented bounding box; (b) diagram of the regression branch with added angle.
Electronics 12 03559 g005
Figure 6. Comparison of images before and after cropping in the DOTA dataset: (a) before image cropping; (b) after image cropping.
Electronics 12 03559 g006
Figure 7. Comparison of training losses between our method and the baseline: (a) classification loss; (b) angle loss; (c) distance loss; (d) centeredness loss.
Electronics 12 03559 g007
Figure 8. Visualization comparison of feature maps between our method and the baseline on the DOTA dataset: (a) The original input image. (b) The feature heatmap generated at the baseline. It is apparent that there is a significant amount of background noise surrounding the objects, and some object features are weakened, leading to missed detections. (c) The feature heatmap generated using our method.
Electronics 12 03559 g008
Figure 9. (a) Original image with labels; (be) comparison of visual detection results of our method, the baseline, R-RetinaNet, and R-F-R on DOTA dataset.
Electronics 12 03559 g009aElectronics 12 03559 g009b
Figure 10. (a) Original image with labels; (be) comparison of visual detection results of our method, the baseline, R-RetinaNet, and R-F-R on HRCS2016 dataset.
Electronics 12 03559 g010aElectronics 12 03559 g010b
Figure 11. Examples of detection results of our method on the DOTA dataset. (af) Plane, storage tank, tennis court, large vehicles, small vehicles, roundabout, and soccer field, respectively. The colors of the boxes corresponding to each category are located below the picture.
Electronics 12 03559 g011
Table 1. Comparison of detection results on the DOTA dataset among different methods.
CategoryMethod
S2aNetR-F-RR3detP-RetinaNetBaselineOurs
Aircraft88.788.688.888.888.189.9 *
Baseball field74.276.275.175.374.278.3 *
Bridge44.647.346.742.840.548.8 *
Track Stadium66.671.2 *67.565.265.266.3
Compact Cars63.665.265.062.465.970.1 *
Large Vehicles80.275.775.269.281.081.3 *
Vessels89.1 *87.986.583.983.987.9
Tennis court89.590.2 *90.089.087.486.9
Basketball Court57.953.053.259.459.459.9 *
Storage Tank67.862.666.965.969.069.7 *
Soccer Field56.364.0 *50.753.356.655.1
Circular Road57.661.7 *59.460.659.960.4
Seaport71.972.465.659.864.772.8 *
Swimming Pool54.860.257.055.054.861.0 *
Helicopter59.053.447.149.956.4 *47.7
mAP68.168.666.365.466.069.0 *
* Indicates the best performance.
Table 2. Comparison of AP values of each method’s detection results on the HRSC2016 datasets.
MethodAP
R-F-R76.4
R-RetinaNet84.8
Baseline87.9
R3det88.8
Ours89.8 *
* Indicates the best performance.
Table 3. Comparison of detection results on the DOTA dataset among different methods.
MethodDeformable ConvolutionAttention ModuleDatasets
DOTAHRCS2016
Baseline 66.087.8
Ours 67.388.2
Ours 66.888.6
Ours69.0 * 89.8 *
* Indicates the best performance. √ Indicates that the module is adopted in the method. √ Indicates the improvement method used in the network structure.
Disclaimer/Publisher’s Note: The statements, opinions and data contained in all publications are solely those of the individual author(s) and contributor(s) and not of MDPI and/or the editor(s). MDPI and/or the editor(s) disclaim responsibility for any injury to people or property resulting from any ideas, methods, instructions or products referred to in the content.

