Article

An Intelligent Detection Method for Approach Distances of Large Construction Equipment in Substations

1
Hubei Engineering and Technology Research Center for AC/DC Intelligent Distribution Network, School of Electrical Engineering and Automation, Wuhan University, Wuhan 430072, China
2
School of Electrical and Automation, Wuhan University, Wuhan 430072, China
3
School of Automation, Wuhan University of Technology, Wuhan 430070, China
*
Author to whom correspondence should be addressed.
Electronics 2023, 12(16), 3510; https://doi.org/10.3390/electronics12163510
Submission received: 12 July 2023 / Revised: 11 August 2023 / Accepted: 17 August 2023 / Published: 19 August 2023
(This article belongs to the Section Artificial Intelligence)

Abstract

:
The safe approach distance detection of large construction equipment in substations is important to ensure the safety and stability of the power system, as well as to prevent equipment damage, power outages and other accidents. The current method is unable to intelligently distinguish construction equipment from power equipment and realize real-time safety approach distance detection. Therefore, this paper constructs a safety approach distance detection system for large-scale construction equipment in substations based on stereo vision and target detection, and realizes real-time high-precision safe approach distance detection between large-scale construction equipment and electric power equipment. Firstly, the system distinguishes construction equipment from power equipment using a GhostNet-based substation construction target detection model. Secondly, the system obtains spatial information regarding the operation scene using a lightweight stereo matching model based on channel attention, then calculates the spatial surface center of the target based on the spatial information and detection results, and finally calculates the safety approach distance between construction equipment and power equipment. Compared with MobileNetv3-YOLOv4, the map and the recall rate of the proposed method are improved by 13.1% and 29.0%; compared with the AnyNet stereo matching method, the proposed method decreases the end point error and 3 pixels error by 34.2% and 25.8%. The actual data show that the detection speed of the proposed method is 19.35 frames per second, and the mean absolute error is 0.942 m and the mean relative error is 3.802%. This method can accurately measure the safe approach distance in real time in real scenarios to guarantee the safety of personnel and equipment.

1. Introduction

Large construction equipment is one of the important means of upgrading and renovating substations, and the degree of standardization of the operation of large construction equipment directly affects the safety and stable operation quality of the power grid [1,2]. Typically, during substation upgrades, large construction equipment is used at a height for a short period of time and covering a large area, which makes supervision difficult. Existing methods, such as manually placing reference warning signs, are difficult to supervise effectively, and collisions with large construction equipment in substations are common [3]. For example, in a substation in Chongqing, China, in 2021, a crane collided with power equipment at a distance during the construction of a 220 kV equipment renovation, resulting in the loss of power to five 220 kV substations, with a loss of load of approximately 296,000 kW and 323,000 out-of-service customers. Therefore, it is important to study the safety distance detection method of large construction equipment to ensure the safety of power equipment and the safe and stable operation of the power grid [4].
Currently, manual monitoring [5,6], electric field monitoring [7,8,9] and equipment positioning [10,11,12] are the main methods for monitoring the safe approach distance of large construction equipment. Manual supervision mainly includes on-site supervision and video monitoring. On-site supervision mainly relies on safety supervision personnel to set up warning signs in advance and limit the operating area of large construction equipment to achieve safe approach distance control [5]. Video monitoring mainly uses surveillance cameras to conduct real-time supervision by safety monitoring personnel to regulate the operation behavior [6]. However, manual monitoring methods have problems such as reliance on personnel subjectivity and the inability to accurately monitor safety distances in real time.
The method based on electric field monitoring directly measures the electric field strength of equipment and estimates the safe approach distance from construction equipment to substation equipment, taking into account various factors such as the changing characteristics of the electric field threshold at the work site. The authors of [7] propose a two-layer monitoring architecture, where the lower slave realizes the electric field measurement function and the upper host monitors the operation of the slave, and the double monitoring of the safety proximity distance is realized by measuring the high-voltage electric field and converting it into an electric signal and directly issuing a warning when the current exceeds the set value. The authors of [8] realized a high-precision safe approach distance warning for large construction equipment, based on a combination of multiple sensors, mainly measuring the field strength around the power equipment, and supplemented with ultrasonic measurements. The authors of [9] realized an extremely high-precision multi-occasion electric field sensor by investigating the principle of multi-dimensional horizontal electric field coupling calculation to meet the actual production requirements of critical distance warning. However, due to factors such as the easy distortion of the electric field in the substation environment and difficulty in accurately measuring the electric field strength, this method has significant distance detection errors.
The method, which is based on construction equipment positioning technology, uses Ultra-Wideband (UWB), Global Positioning System (GPS) and other positioning technologies to accurately monitor the spatial location of the equipment and calculate the safe distance between the construction equipment and the electrical equipment based on known spatial information about the live equipment. Reference [10] was based on the UWB, combined with video monitoring, to achieve crane and boom positioning, so as to calculate the distance from the crane to the electrical equipment and realize the construction equipment over limit alarm. Based on 3D modeling technology, the authors of [11] achieved active early warning for substation construction vehicles accidentally approaching power equipment by transforming the coordinate parameters and automatically generating the working area. Reference [12] combines UWB and 3D modeling technology to construct a substation operation safety management and control system, which realizes the function of personnel and vehicle qualification examination before substation operation and the real-time positioning of personnel and tools during operation. However, the substation upgrade process would change the type, number and location of equipment in the work area, and it is difficult to obtain accurate three-dimensional information of the new power equipment in real time using this method, resulting a blind spot in monitoring.
In recent years, scholars have started to try to implement safe approach distance monitoring methods for power systems through image distance measurement technology [13]. The image distance measurement method aims to obtain the spatial information of the operation object by taking images from different angles for stereo matching and by calculating the disparity, to achieve the safe approach distance measurement [14,15]. Traditional stereo matching methods refer to the prediction of parallax through four steps of matching cost calculation, cost aggregation, disparity calculation and disparity optimization, and do not use deep learning frameworks [16]. Reference [17] estimated the tree height and line tree distance of transmission corridors by analyzing images taken by satellites from two different angles. The authors of [18] used a semi-global matching method for parallax calculation and applied a machine learning nearest neighbor search feature matching algorithm to obtain a set of matching point mappings, which yielded high-precision charging hole matching and localization results. It can be seen that image distance measurement techniques can obtain power scene distance information, but traditional stereo matching techniques have large errors in weak textured, highly reflective and obscured areas [19]. Current methods based on image distance measurement technology cannot obtain high-precision three-dimensional distance information in real time, and accurate three-dimensional information is essential for the safe distance detection of large construction equipment in substations.
The rapid development of machine learning and deep learning is expected to completely change the feature extraction capabilities in the field of stereo matching [20]. Deep learning-based binocular stereo matching methods have started to show huge performance advantages in recent years [21]. Reference [22] first used convolutional neural networks and implemented stereo matching across cost crossings on the basis of costing. Based on this, the authors of [23] achieved high-precision spatial geometry information acquisition based on a spatial pyramid pooling module and inflated convolution. Actual construction operation safety control needs to achieve instantaneous 3D information sense knowledge. Reference [24] downscaled 3D cost volumes and learned through 2D convolution to achieve fast stereo matching and distance detection. In order to effectively utilize image high-frequency information such as texture, color variations, sharp edges, etc., reference [25] proposes an error-aware refinement module that fuses high-frequency information from the original left image and allows the network to learn error-correcting capabilities, which can produce excellent fine details and sharp edges. The application of an image distance measurement technique for the safe approach distance detection of large construction equipment therefore becomes possible.
Summarizing the previous research results on safe approach distance detection methods for large construction equipment in substations, the current method is difficult to adapt to the complex scenarios of substations that are constantly changing with construction, and it is hard to distinguish between electrical equipment and construction equipment, and difficult to balance detection accuracy and detection speed. For the purpose of detecting the safe approach distance between large construction equipment and electrical equipment with high accuracy and speed, and to improve the generalization of the safety distance detection of large construction equipment in substations, this paper constructs a framework for the safe approach distance detection of large construction equipment in substations based on stereo vision and object detection, and proposes a lightweight collaborative detection model for the safe approach distance of large construction equipment. The main contributions of this thesis are summarized as follows:
(1)
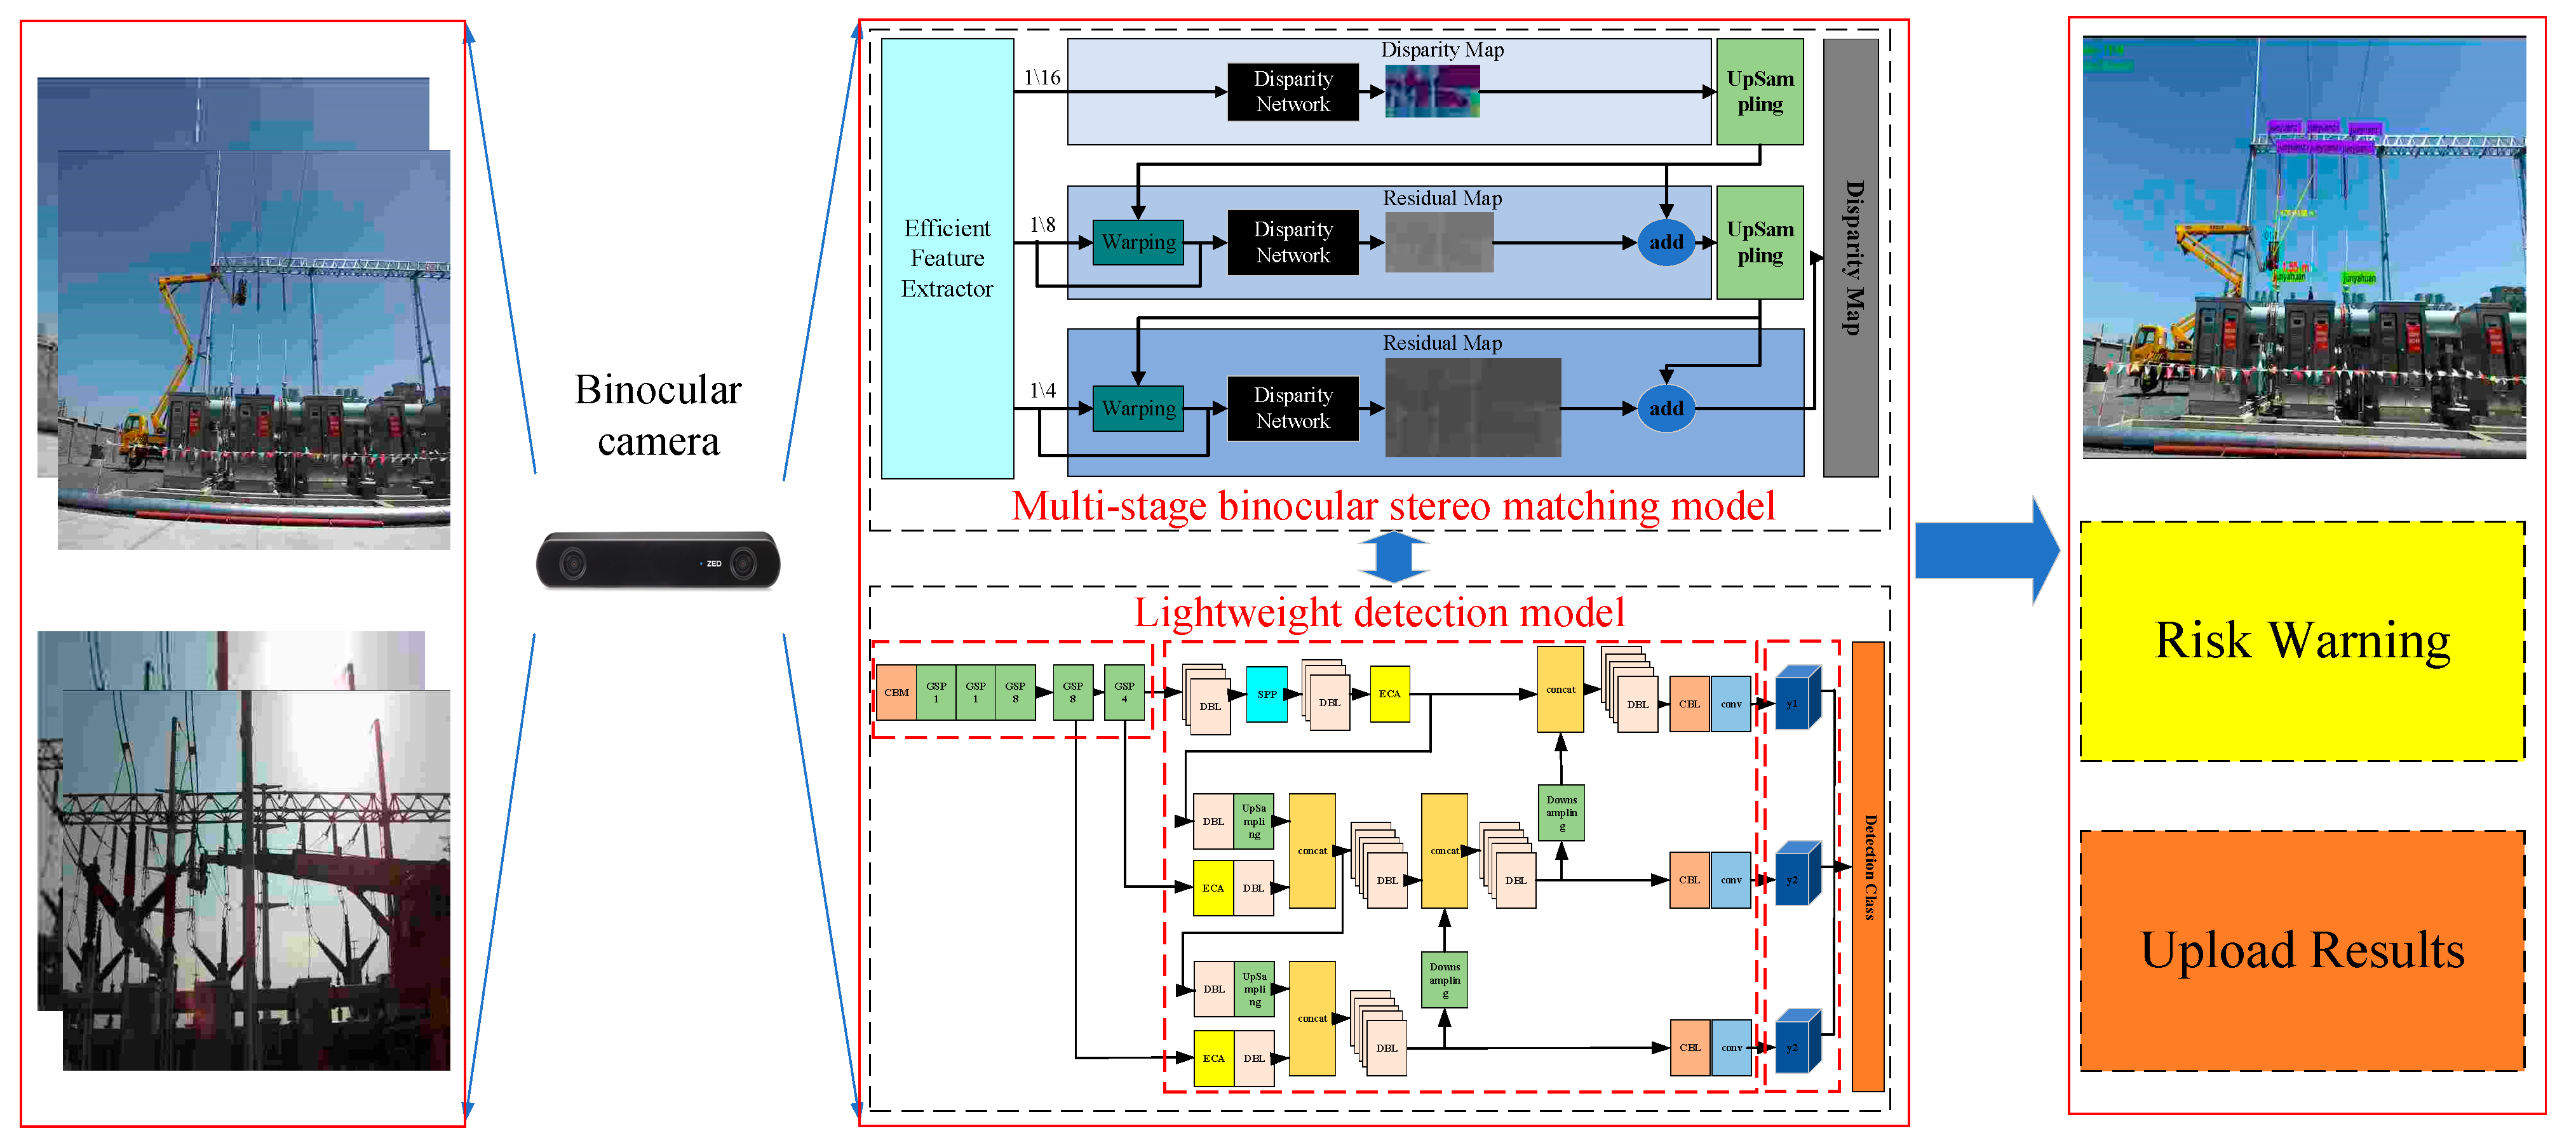
A framework for the safe distance detection of large construction equipment in substations based on stereo vision and object detection is constructed, and a lightweight collaborative detection model for the safe approach distance of large construction equipment based on stereo matching and object detection is proposed to quickly and accurately detect the distance between large construction equipment and electrical equipment in substations, and improve the efficiency of substation construction equipment control.
(2)
The GhostNet-based substation construction lightweight detection method can improve detection speed and accuracy by introducing a GhostNet lightweight feature extraction module and ECANet attention module, especially for substation construction scene images with complex backgrounds and a large number of equipment types.
(3)
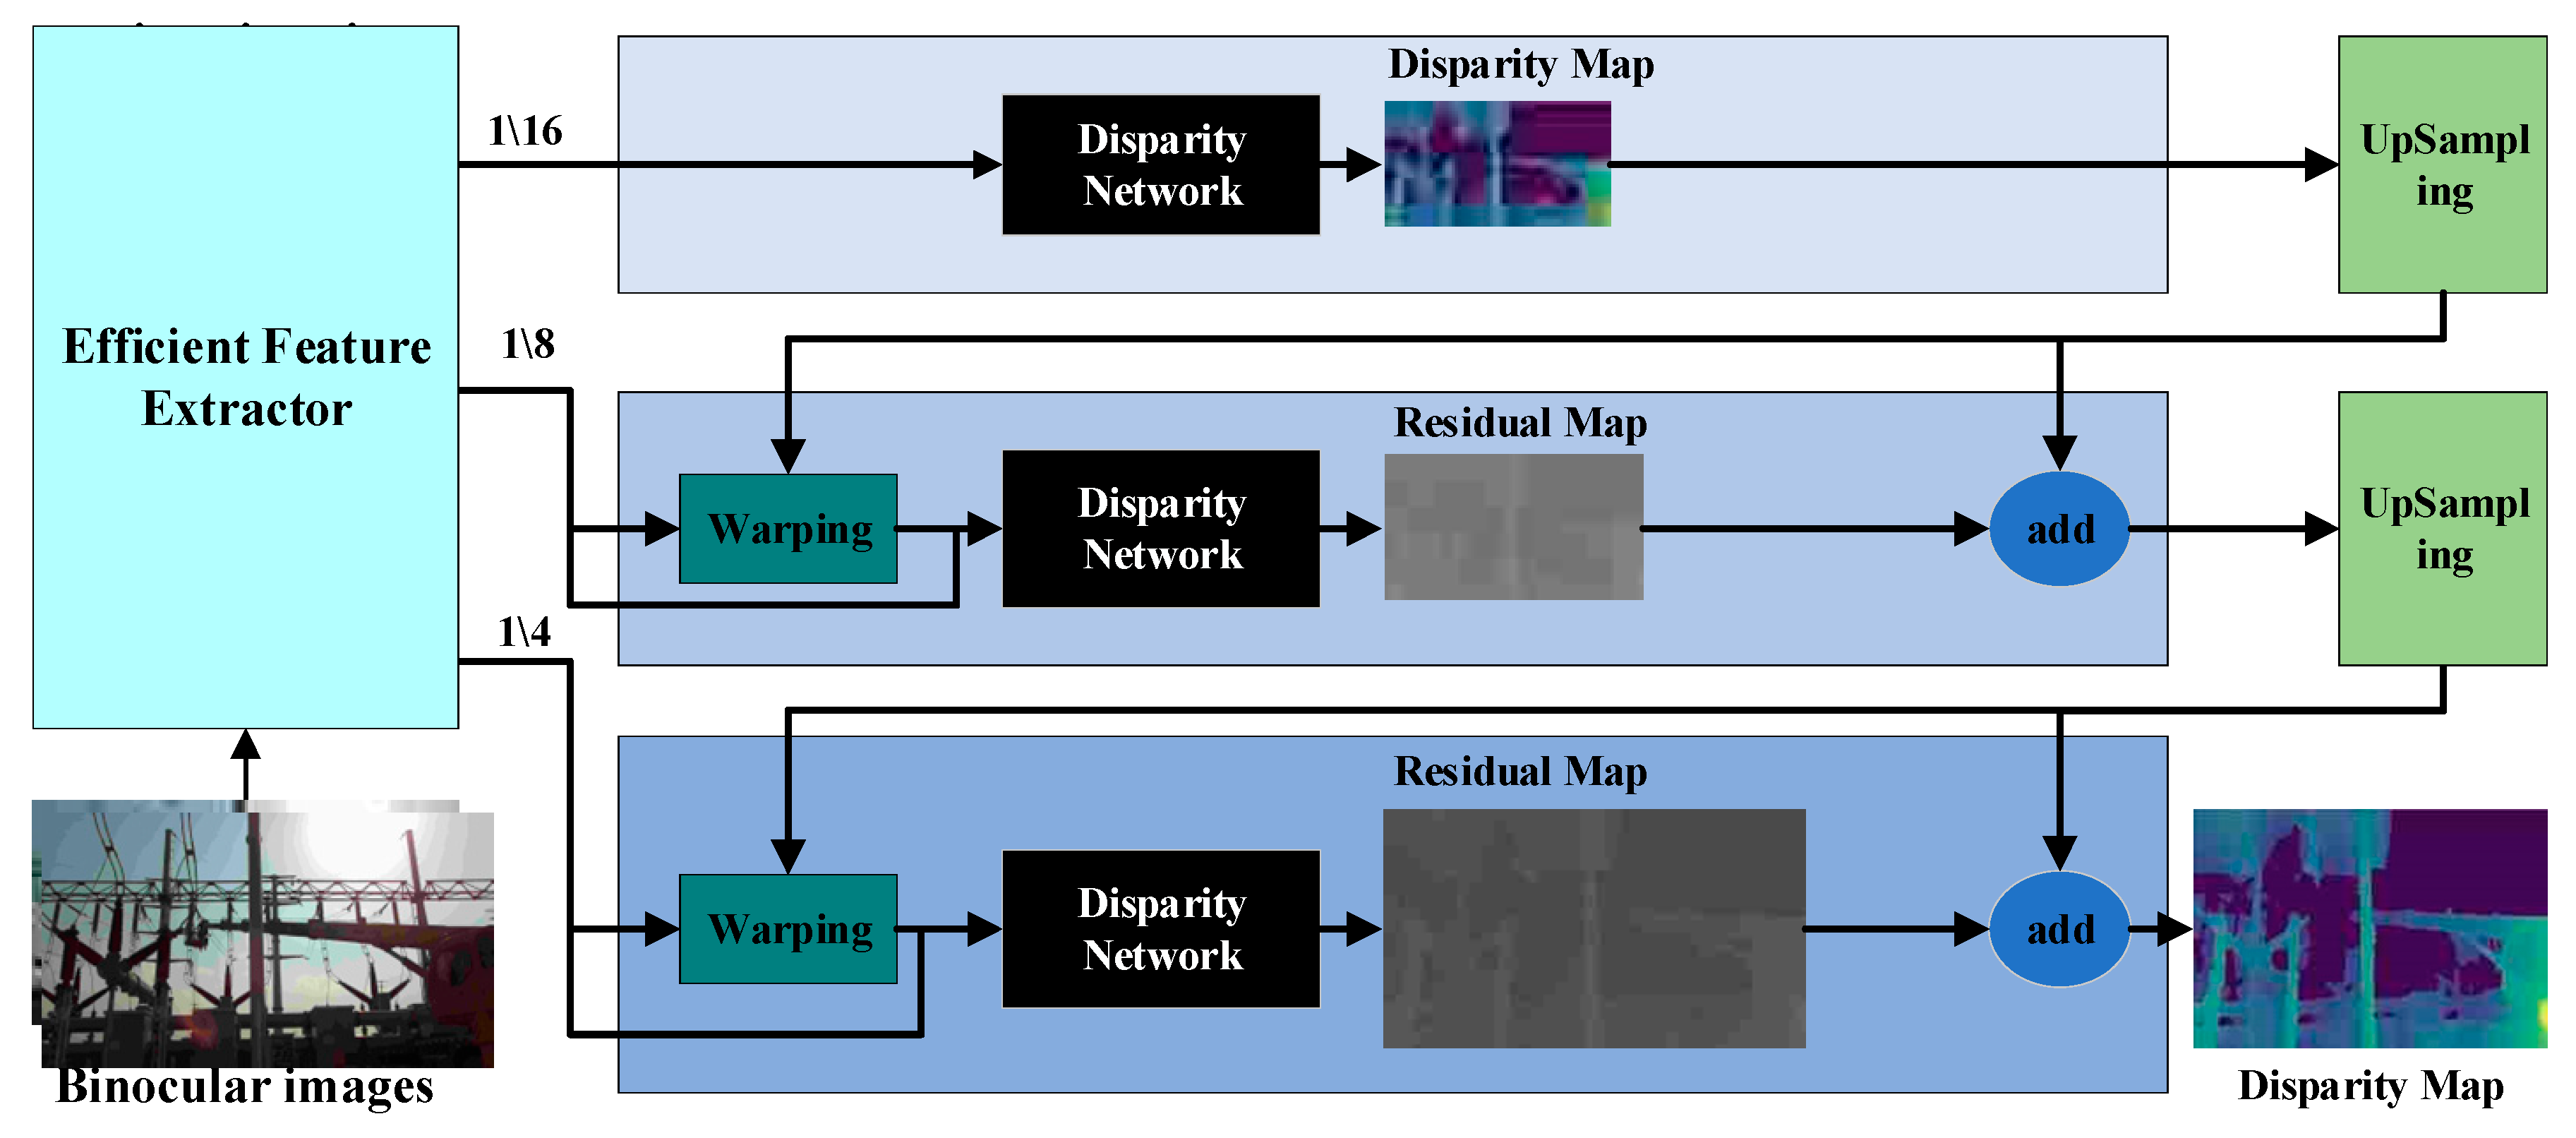
The channel attention-based lightweight stereo matching model, which is based on a multi-stage binocular stereo matching model, is able to adapt to the complex and changing environment of substation construction by introducing the ECANet attention module, which enables the real-time acquisition of high-precision 3D spatial information.
(4)
By comparing with traditional power distance detection methods, the superiority of the proposed method for detecting the safe approach distance between large construction equipment and power equipment in substations is verified.
The rest of the paper is structured as follows: Section 2 proposes a safe approach distance monitoring system for large construction equipment in substations based on stereo vision and object detection. Section 3 presents the lightweight collaborative detection model for the safe approach distance of large construction equipment based on stereo matching and object detection and its improvements. In Section 4, experimental results are presented to validate the proposed approach and conclusions are drawn.

2. A Framework for the Safe Approach Distance Detection of Large Construction Equipment in Substations Based on Stereo Vision and Object Detection

Substation construction operations have a large construction area, numerous adjacent pieces of equipment and changes in the construction environment, and most of the operational risks occur instantaneously when approaching power equipment. There are also high operational risks, a high level of difficulty in control and blind spots in control areas [26]. In order to realize the real-time high-precision safe approach distance detection of substation construction equipment and power equipment, this paper constructs a framework for the safe approach distance detection of large construction equipment in substations based on stereo vision and target detection ideas.

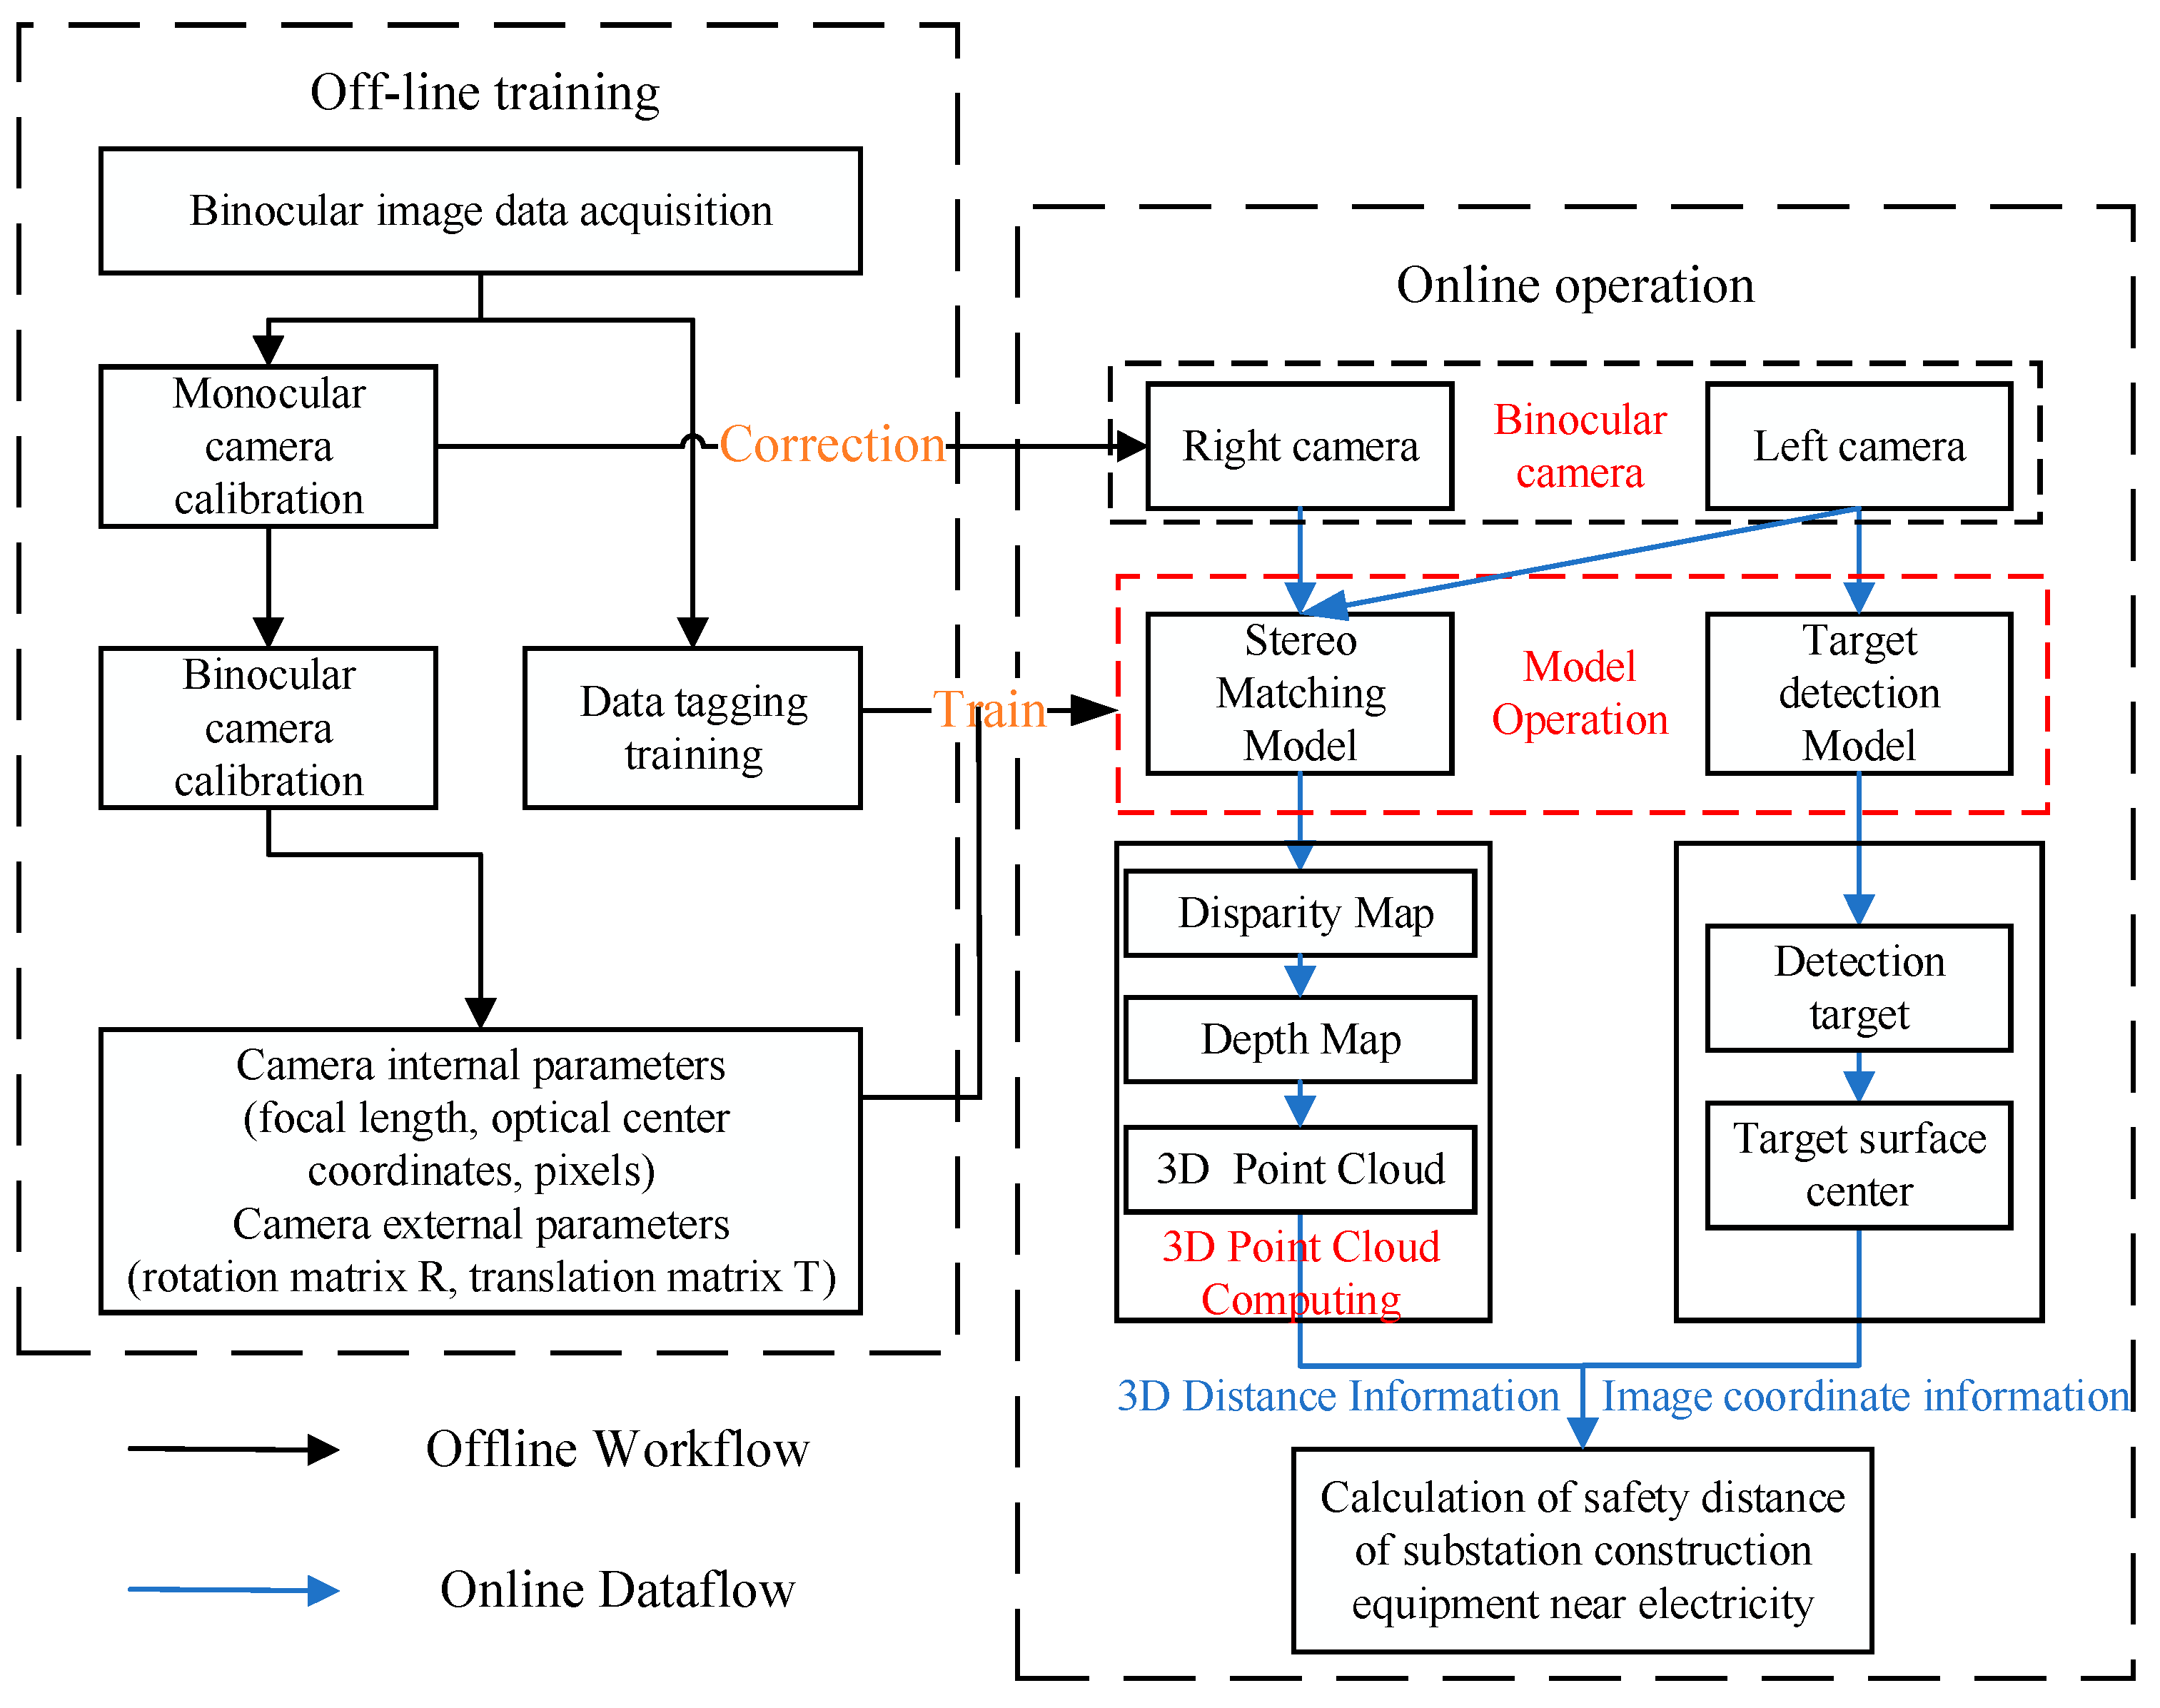
2.1. Method Architecture

This framework adopts binocular cameras to collect images of substation construction work, analyses and processes the binocular images of substation construction work and completes the intelligent detection of the safe approach distance of construction equipment (Figure 1). In addition, voice warnings are issued directly based on the recognition results to quickly warn the operator of the risks, which effectively protects the safety of electrical equipment.
Stereo matching methods based on deep learning only output parallax maps with distance information and cannot be directly combined with object detection. In addition, the simultaneous use of stereo matching algorithms and object detection algorithms is computationally slow and cannot instantly identify operational risks. Therefore, the key to this framework is the collaboration of the target detection algorithm with the stereo matching algorithm and the high speed and accuracy of the algorithm detection. Therefore, this paper improves the YOLOv4 object detection [27] and AnyNet stereo matching algorithms [28] based on GhostNet [29], depth-separable convolution [30] and ECANet (Efficient Channel Attention Net) [31], and combines the scene 3D reconstruction technology to propose a safe approach distance lightweight collaborative detection model for large construction equipment based on stereo matching and object detection.

2.2. Method Flow

As shown in Figure 2, this method firstly calibrates the binocular camera and constructs a binocular camera mathematical model to provide a basis for subsequent stereo matching and 3D reconstruction. Secondly, the stereo matching and object detection models are trained by acquiring binocular images of substation operations. During the online detection phase, firstly, the substation construction lightweight detection model realizes the detection of large construction apparatus and electrical equipment. Secondly, the input of the stereo matching model is the substation construction binocular image, the output is the corresponding disparity map and the 3D point cloud information is obtained from the substation construction disparity map using mathematical calculation. Finally, based on the 3D information and the dynamic detection frame shape output by the object detection network, the 3D point cloud center coordinates of the construction equipment and power equipment are determined and the distance between the construction equipment and power equipment is calculated, thus obtaining a lightweight collaborative detection model for the safe approach distance of large construction equipment based on stereo matching and target detection.

3. Lightweight Collaborative Detection Model for the Safe Approach Distance of Large Construction Equipment Based on Object Detection and Stereo Matching

This paper presents a lightweight collaborative detection model for the safe approach distance of large construction equipment, based on the improved YOLOv4 object detection algorithm and the improved AnyNet stereo matching algorithm.

3.1. GhostNet-Based Substation Construction Lightweight Detection Model

The purpose of improving the YOLOv4 model is to achieve the intelligent detection of substation construction objects with different scenes, complex backgrounds and multi-state features, while ensuring real-time joint recognition with stereo matching networks. This paper replaces the backbone network of YOLOv4 with GhostNet, retaining the multi-scale prediction part and using the Ghost module to reduce the depth network model parameters and computational complexity. Secondly, this paper adds an attention mechanism ECANet at the input of the neck network and feature fusion of YOLOv4. This mechanism assigns higher weights to important features and proposes a GhostNet-based lightweight detection method for substation construction. The model structure diagram is shown in Figure 3. The “*” in the Figure 3 represents the number of modules.

3.1.1. YOLOv4 Algorithm

The YOLOv4 algorithm is currently widely used in industry as a classical target detection algorithm, and the network consists of the following three components:
(1)
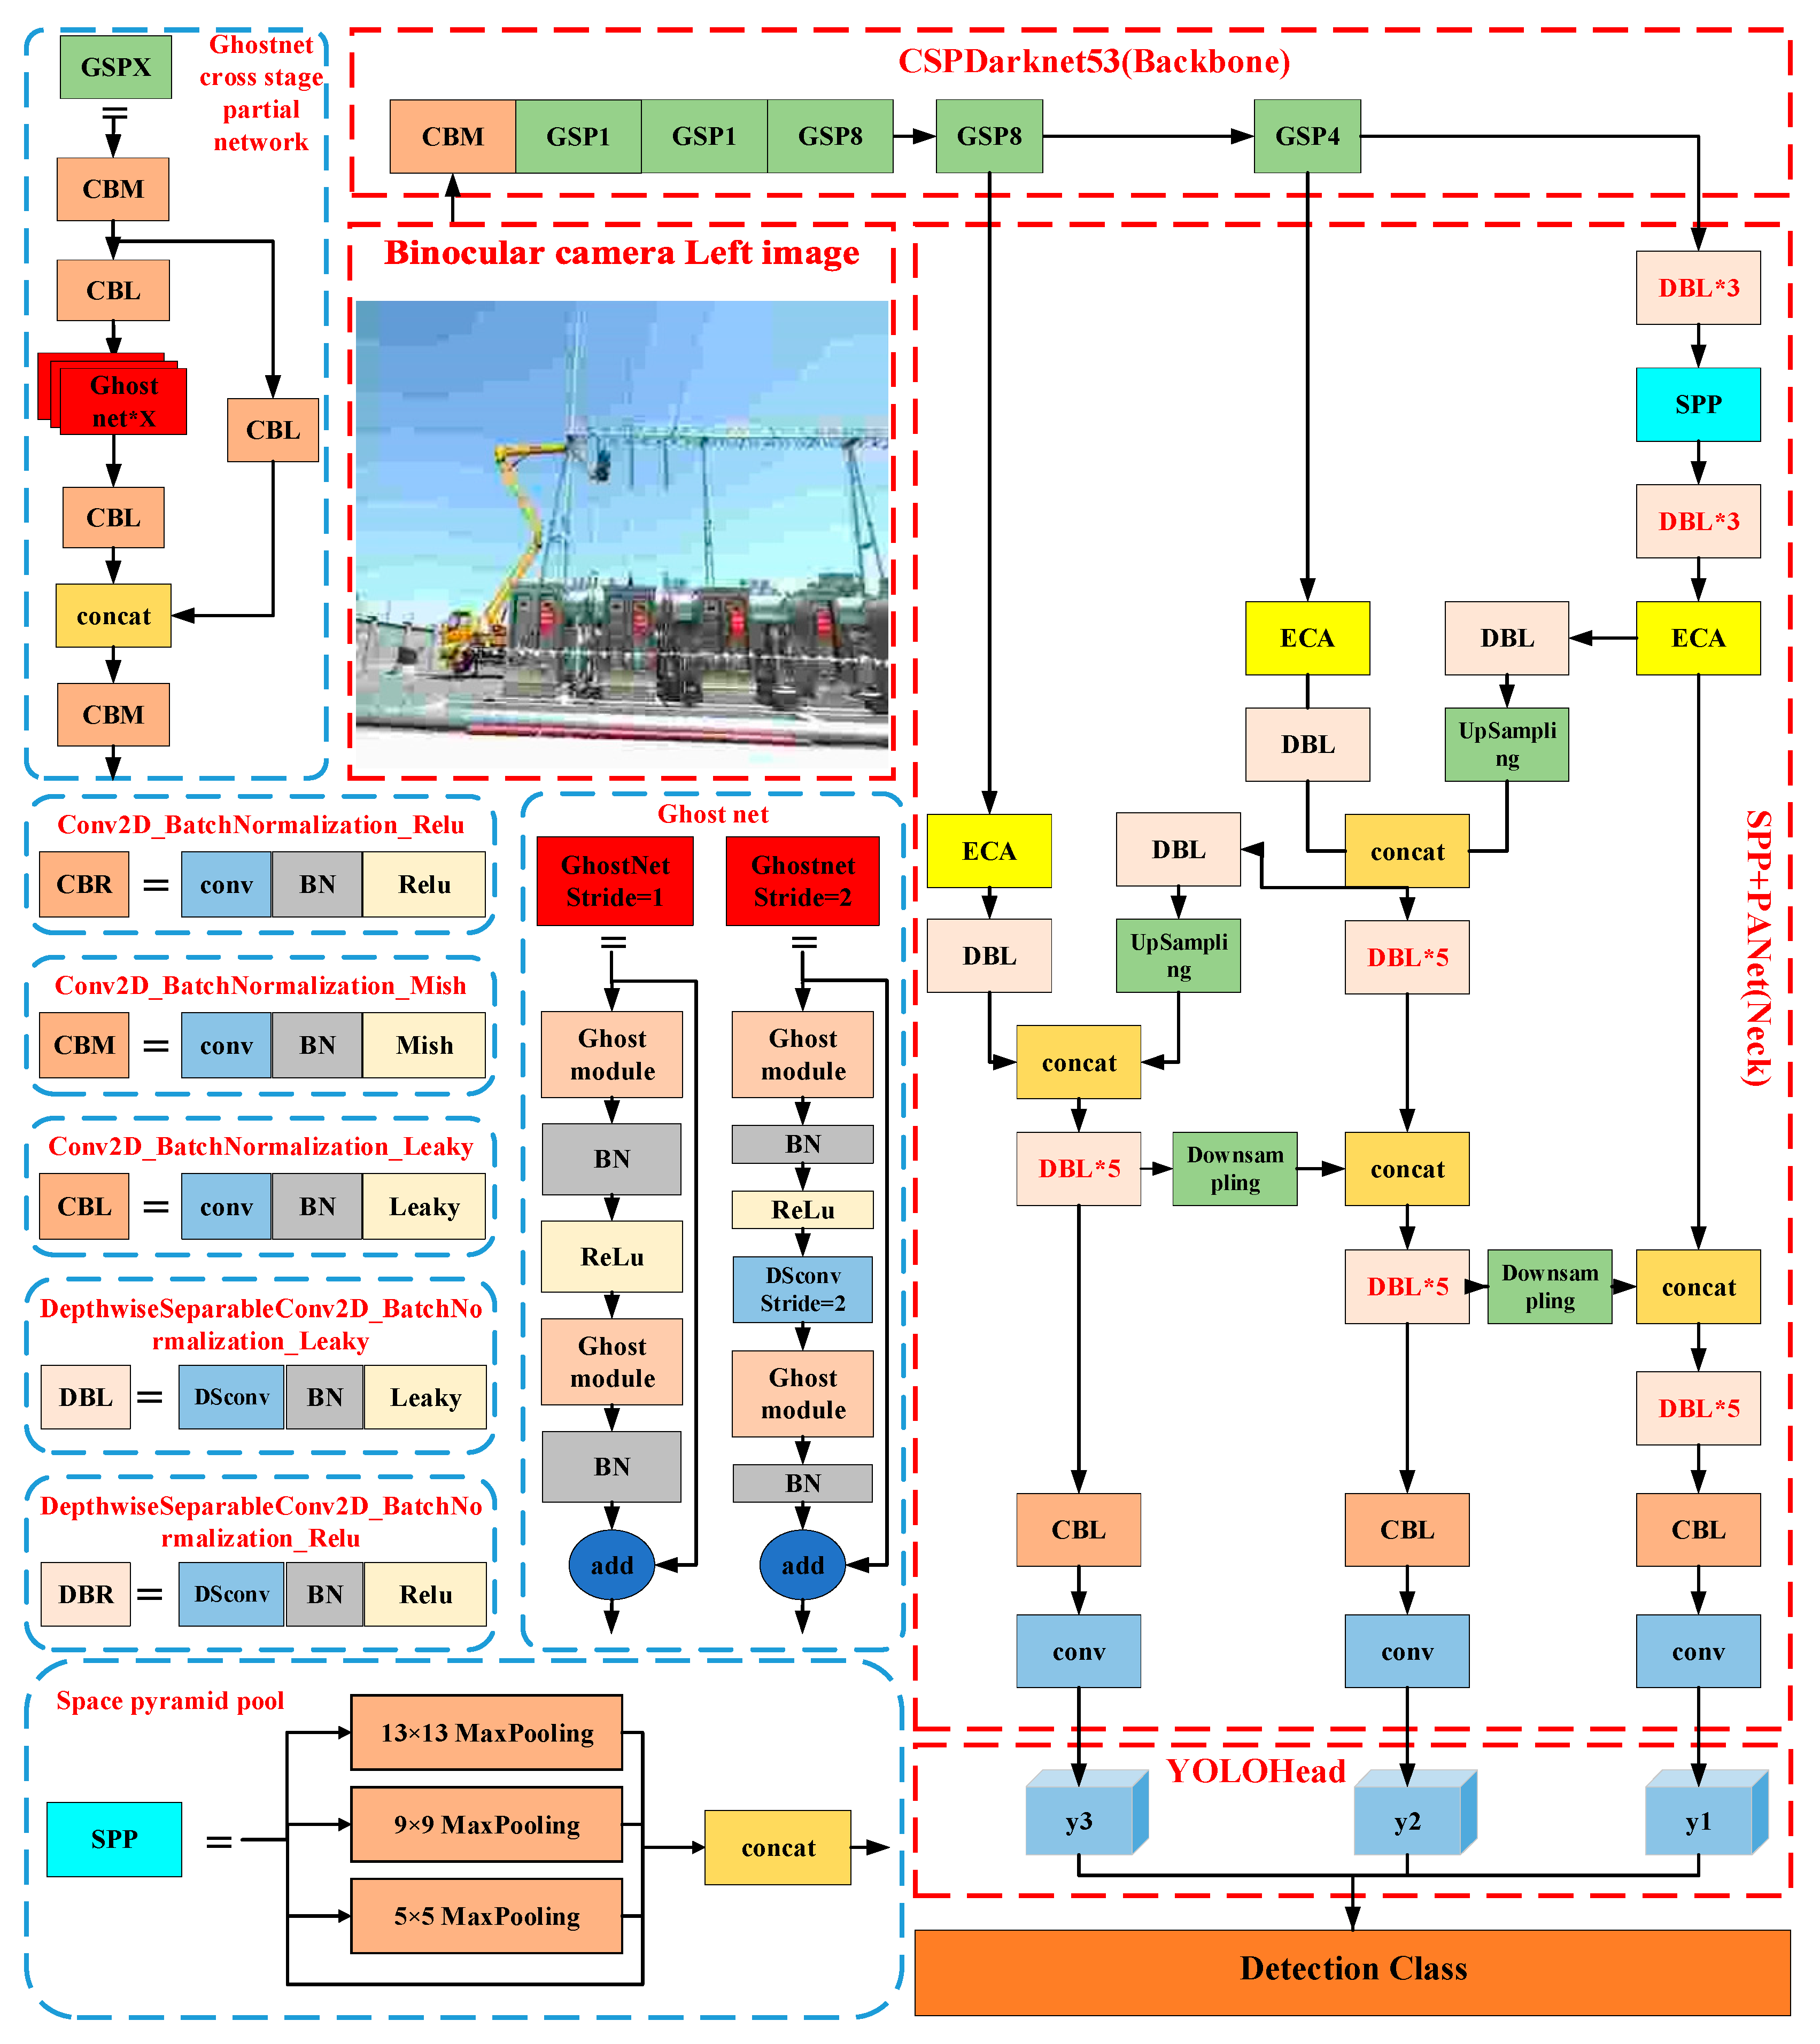
The feature extraction backbone network uses the CSPDarkNet53 [32] based on the residual structure. This structure balances the level of network computation in each layer, increases the depth of information propagation, enhances the learning ability of the convolutional network, and improves the accuracy of network feature extraction.
(2)
The neck network uses spatial pyramid pooling (SPP) [33] and the path aggregation network (PANet) [34]. The SPP module performs a multi-scale maximum pooling operation and links the feature maps as output to extract key contextual features. The PANet structure adds a bottom-up feature propagation path based on the feature pyramid network structure, making it easier for shallow features to propagate to deeper layers of the network to achieve the target localization function.
(3)
The head network utilizes the Complete IoU (CIoU) algorithm to obtain a more stable detection frame, and the best predicted frame is retained by a non-extreme suppression algorithm.

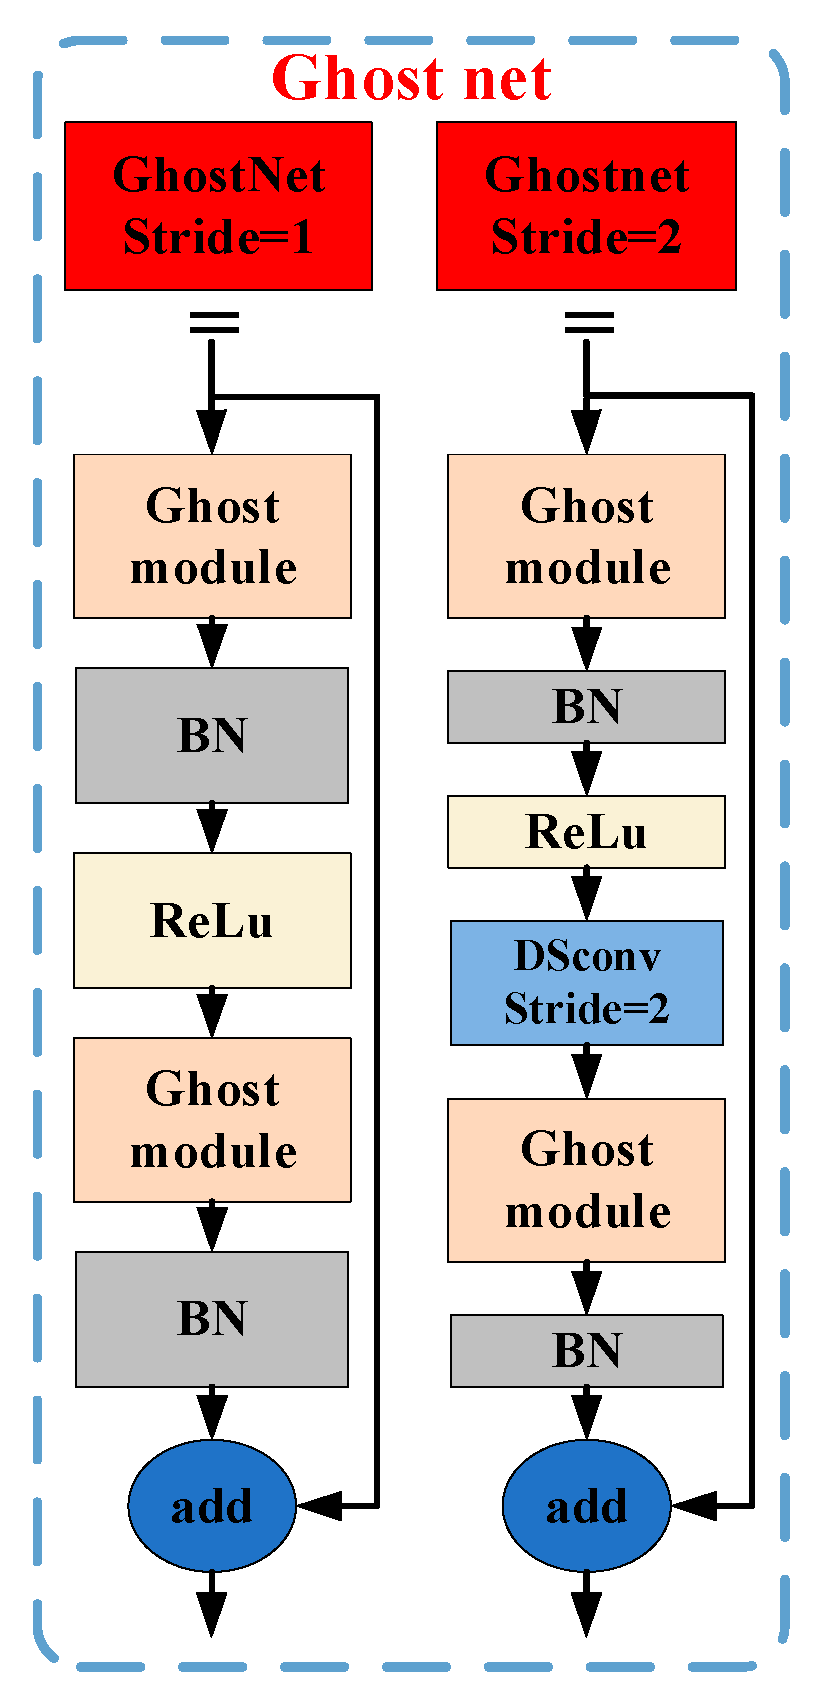
3.1.2. GhostNet-Based Lightweight Feature Extraction Network

As shown in Figure 4, the Ghost module first extracts features using 1 × 1 convolution. Then, the extracted features are grouped and convolved to generate ghost feature maps, and finally the result of fusing the ghost feature map with the initially extracted feature information is output [29]. The Ghost module effectively reduces parameter size while maintaining feature extraction capability.
Considering the large number of parameters and slow computation of the YOLOv4 network, this paper first designs the Ghost_net module to store the Ghost model module, as shown in Figure 5. The Ghost_net module with a step size of 1 mainly consists of two Ghost model modules. The Ghost_net module with step size of 2 inserts a deeply separable convolutional layer. In this paper, the Ghost_net module is used instead of the residual module in the CSPx structure of the YOLOv4 backbone network.
Furthermore, to accelerate computing, this paper uses depthwise separable convolution to lighten the SPP+PANet structure in YOLOv4. This kind of convolution includes deep convolution and pointwise convolution, with a small number of parameters for high quality feature maps.

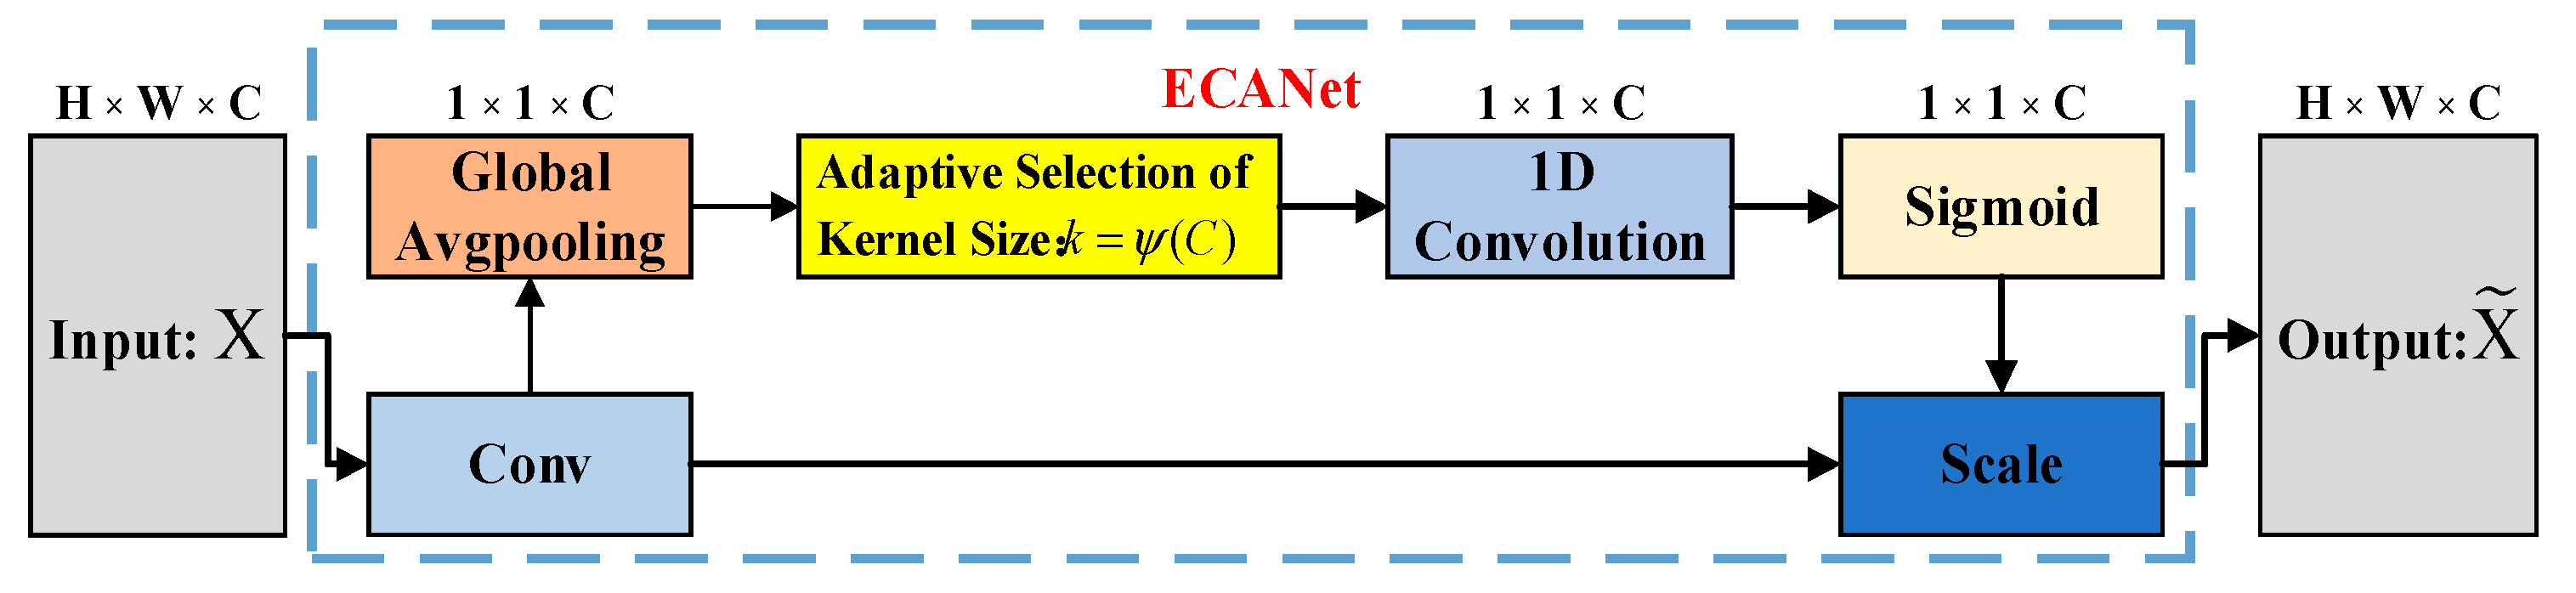
3.1.3. ECANet-Based Fusion Network for Feature Extraction

ECANet is an efficient channel attention module for CNNs that uses a small number of parameters to quickly extract cross-channel information [31]. To achieve information interaction, ECANet applies a global average pool for feature compression in the spatial dimension and outputs channel weights using a convolution of size 1 × k, as shown in Figure 6.
Considering the actual operational environment of substation construction, there is a significant amount of invalid feature information in the images. These invalid features may degrade the detection performance of the model. In this paper, to compensate for the feature loss caused by the lightweight network and to avoid the degradation of detection accuracy, the ECANet module is introduced to the neck network input phase and the feature fusion phase of YOLOv4 applied to extract features in a targeted way, and the feature information of power objects such as cranes, aerial work vehicles, insulators, equalizing rings and bushings is enhanced. The network minimizes the impact of invalid background information on network speed and accuracy, obtains more accurate features, improves feature extraction expression, and achieves the high-precision and fast target detection of substation construction work objects.

3.2. Lightweight Stereo Matching Model Based on Channel Attention

AnyNet uses 2D convolution to extract image features, utilizes a small amount of 3D convolution, and generates disparity matching in stages to achieve a balance between computational speed and accuracy on low fractional rate images. However, this comes at the cost of edge accuracy in stereo matching. Due to the high resolution, diverse scenes, complex backgrounds, and polymorphic targets of the actual operating substation images, AnyNet can only process the data at a slow speed and output a blurred depth map.
Based on the aforementioned issues, as shown in Figure 7, this paper built an efficient feature extraction network based on AnyNet that serves as the foundation for the subsequent fast and accurate matching cost calculation and disparity map prediction. The improvement ideas presented in this paper are as follows: firstly, the 2D convolution of the feature extraction network is replaced by the depthwise separable convolution to accelerate the feature extraction speed; at the same time, the attention mechanism ECANet is added to the output stage of the feature extraction network to obtain a richer and more accurate feature map without compromising the feature extraction speed of the network. This helps achieve a more accurate matching cost calculation in the disparity network, which effectively improves the accuracy of stereo matching.
Figure 7 shows the architecture of the stereo matching network in this paper. First, the binocular images of the substation construction are processed by an efficient feature extractor and this network outputs a multi-scale feature map. In the first stage, the model computes only the lowest resolution feature map and generates a low-resolution disparity map through the disparity network. In the subsequent stages, the model takes the higher resolution feature map and distorts the right feature map with the disparity map generated in the previous stage, generating a residual map through the disparity network that specifies the disparity pixel correction values and corrects the existing disparity map at a higher scale. By incrementally predicting the low scale disparity map to correct the higher scale features and restore the resolution of the disparity map, the model improves the detection accuracy step by step while increasing the detection speed as much as possible. Ultimately, it rapidly obtains a high accuracy disparity map with pixel values in pixels for each position.

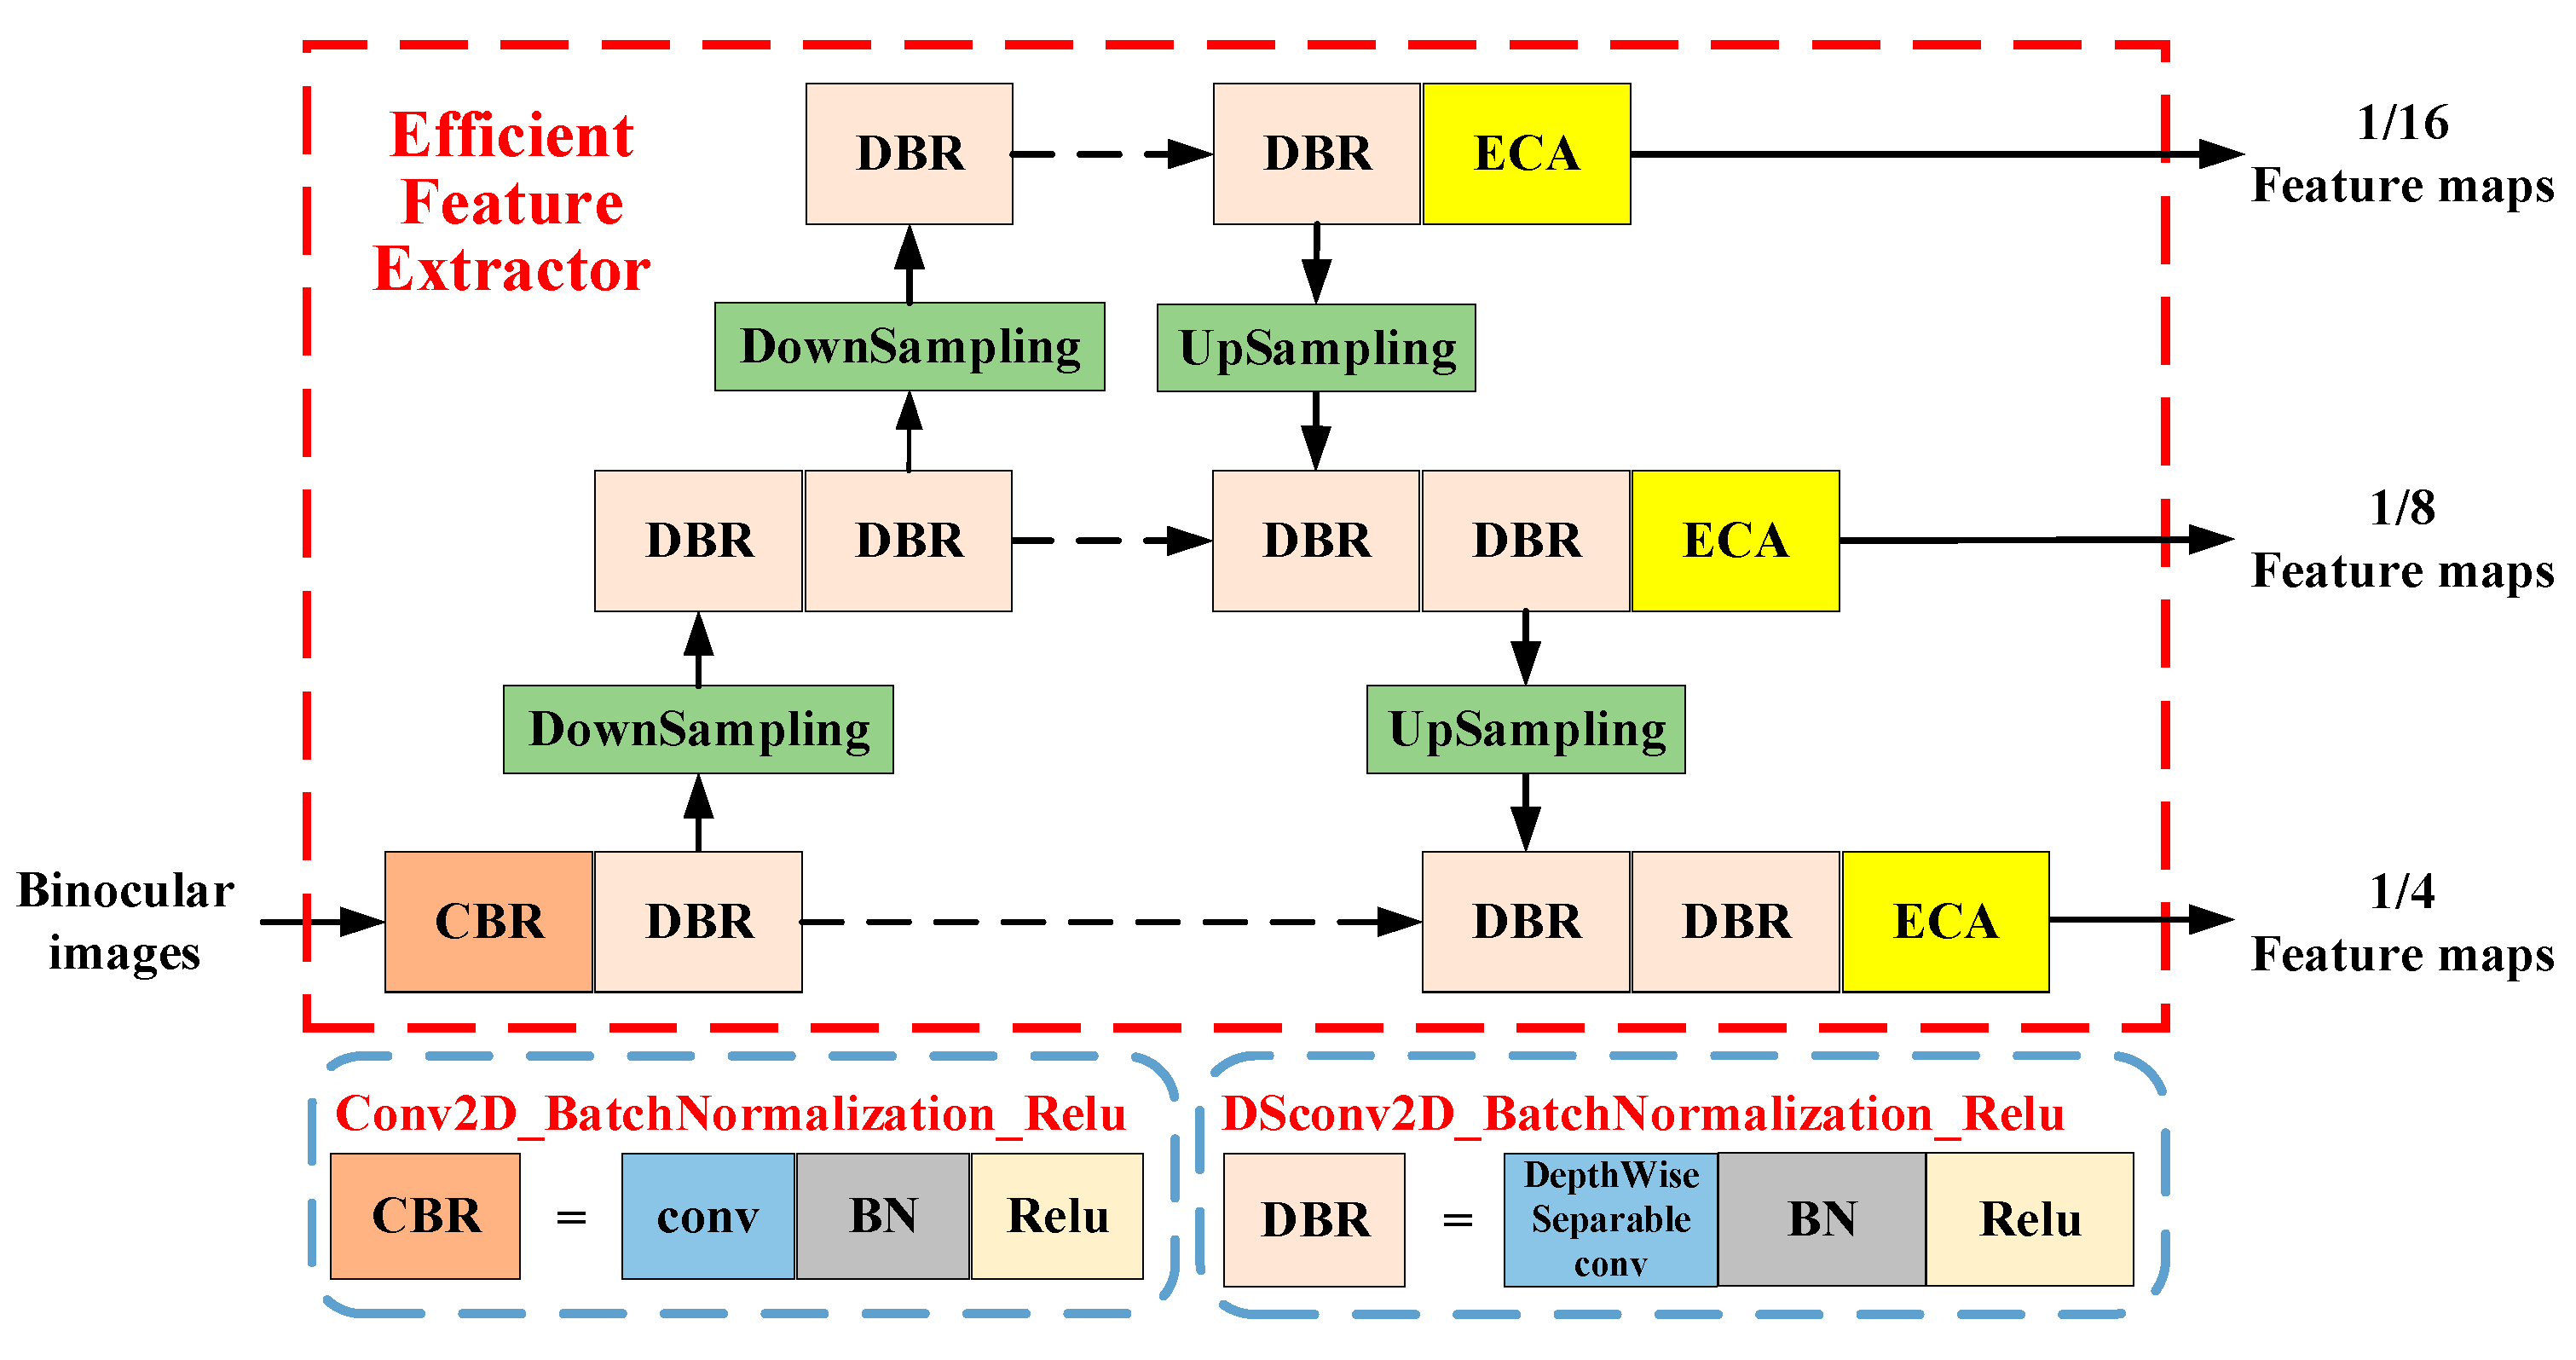
3.2.1. Efficient Feature Extraction Network

Figure 8 details an efficient feature extraction network proposed in this paper. The network extracts multi-resolution feature maps through a U-Net network structure [35]. Lower resolution feature maps extract the global environment, while higher resolution feature maps extract local details. For higher resolution feature maps, the deep and shallow features are fused through a feature pyramid structure. These different resolution feature maps are fed into the subsequent disparity network in stages 1–3.
In order to maintain the feature extraction ability of the model while improving the speed of stereo matching, this paper uses depthwise separable convolution for fast feature extraction. This paper also extracts cross-channel information through ECANet after feature extraction. This enhances the receptive field of the feature extraction layer and enriches the feature information of equipment such as large construction equipment, voltage equalization rings, insulators, and the isolating switch. By enriching the feature detail information, this method effectively improves the feature extraction expressiveness and provides the basis for the subsequent accurate calculation of matching cost, ultimately leading to an improvement in the stereo matching accuracy.

3.2.2. Efficient Feature Extraction Network

The parallax network takes the feature maps of the incoming binocular images as input and outputs the parallax maps. The network generates an initial parallax map in the first stage and a corrected residual map in the subsequent stages. The specific steps are as follows:
(1) Matching cost calculation: Based on the similarity of the corresponding pixels in the left and right images, the network calculates the disparity cost. When the disparity network receives a feature map of size H × W , it calculates the degree of matching between the left image pixel ( i , j ) and the right image pixel ( i , j k ) as the matching cost element ( i , j , k ) based on Equation (1), and finally generates a matching cost of size H × W × D , where D is the maximum parallax considered in this paper.
C i j k = P i j L P i ( j k ) R 1
where the vectors P i j L and P i j R represent each pixel ( i , j ) in the left and right images, where the αth dimension of the vector corresponds to the αth pixel ( i , j ) in the left and right image feature maps.
(2) Matching cost optimization: Disparity networks use 3D convolutional layers to refine the cost and reduce matching cost errors caused by issues such as blurred, occluded, or unclearly matched objects.
(3) Disparity calculation: The disparity network utilized disparity regression to calculate disparity values by calculating the cost-weighted average.
D ^ i j = k = 0 M k × exp C i j k k = 0 M exp C i j k
(4) Residual prediction: By limiting the maximum disparity D to 5, the network generates the corrected residual map to correct the existing disparity map. The network first zooms in on the disparity map generated in step 1, and if the network predicts the disparity of k for the left pixel ( i , j ) , the network replaces left pixel ( i , j ) with pixel ( i , j k ) from each right feature map. The network adds the resulting residual disparity map to the magnified disparity map from the previous stage. The matching cost of this stage is calculated by Equation (3).
C i j k = P i j L P i ( j k + 2 ) R 1

3.2.3. D Point Cloud Computing

The proposed method is mainly to convert the disparity map output from the stereo matching model into the depth map through mathematical computation, and then implement the coordinate system conversion to convert the depth map under the camera coordinate system into 3D point cloud data under the world coordinate system. The 3D point cloud data conversion workflow in the method proposed in this paper is as follows:
(1) By inputting the binocular image of the construction scene, the model proposed in this paper outputs the predicted disparity map D ^ of the operational scene.
(2) On this basis, the depth map Z c of the left image of the substation construction scene is calculated from the known camera parameters, as shown in Equation (4).
Z c = f   T D ^
where Z c is the distance from the camera to each point in the scene; T is the horizontal baseline distance between the left and right cameras; and f is the focal length of the camera.
(3) Based on the known depth information Z c of the left view and camera parameters, all the pixels ( u , v ) of the operation scene left view are converted into 3D coordinates ( X w , Y w , Z w ) to realize the acquisition of 3D point cloud information of the substation construction scene, as shown in Equation (5).
X w Y w Z w 1 = R       T 0       1 1 f x 0 u 0 0 0 f y v 0 0 0 0 1 0 1 Z c u v 1
where f x and f y are the aspects of a single pixel; ( u 0 , v 0 ) are the center coordinates of the imaging surface of the binocular camera; and R and T are the rotation and offset matrices of the external parameters of the camera.

3.3. Calculation of Distance between Large Construction Apparatus and Electrical Equipment

Based on the detection frame of construction equipment and electrical equipment output from the model proposed in this paper, the calculation steps are as follows:
(1) Find 3D point clouds belonging to construction equipment and electrical equipment based on target detection frames and 3D reconstruction results;
(2) By means of the calculated 3D coordinates of the surface centers of the construction apparatus and the electrical equipment at two points ( X k , Y k , Z k ) and ( X , Y , Z ) , the formula for calculating the safety distance is as follows:
d = ( X k X ) 2 + ( Y k Y ) 2 + ( Z k Z ) 2

4. Experimental Results and Analysis

4.1. Description of Experimental Data

The dataset for this paper is presented in Figure 9. Firstly, this paper used the publicly available Scene Flow dataset [36] for model pre-training. This dataset contains 39,824 pairs of RGB image pairs and corresponding dense disparity images with resolution of 960 × 540, and the ratio of training set to validation set is 9:1. Secondly, real binocular stereo images were collected to build a sample library of substation construction scenes. This dataset contains 2000 pairs of RGB image pairs of substation construction scenes and corresponding disparity images with resolution of 1920 × 1080 and a depth range of 5~40 m, and the ratio of the training set to the validation set is 4:1. The subsequent stereo matching model was fine-tuned and the target detection model was trained and validated on this dataset.

4.2. Description of Experimental Data

The training and testing platform configuration of this paper was Ubuntu 18.04, and the graphics card was GTX3060 with 8 G memory. Meanwhile, this paper used the literature [37] to calibrate the binocular camera, and the parameters of the binocular camera used in this paper are shown in Table 1.

4.3. Performance Analysis of GhostNet-Based Substation Construction Lightweight Detection Model

To verify the effectiveness of the GhostNet-based substation construction lightweight detection model, the proposed method is compared with several object detection model methods in an actual substation dataset.

4.3.1. Quantitative Analysis of the Dataset Test Results

Considering that the GhostNet-based substation construction lightweight detection model was improved from the YOLOv4 model, this paper selected YOLOv4-tiny, MobileNetv3-YOLOv4 and GhostNet-YOLOv4 lightweight object detection models for analysis and comparison. The detection results of the different target detection models for power strip operations are shown in Table 2. In this paper, the mean average precision(mAP), recall and frames per second (FPS) processed by the model were chosen to measure the model performance.
As shown in Table 2, although YOLOv4-tiny improves the detection speed by reducing one prediction branch pruning, and the MobileNetV3 module reduced the computational complexity, the detection performance was poor. In contrast, the GhostNet module effectively improved the recall rate and mAP values and reduced the number of parameters and computational complexity. YOLOv4-tiny could achieve the fastest detection speed of 92.913 frames per second, which provided the best lightweight results among the four algorithms. However, it also had the greatest impact on the model’s detection, with a mAP of 74.67% and a recall rate of only 60.02%. Compared to the YOLOv4-tiny model, by introducing the GhostNet module while retaining the three prediction branches, GhostNet-YOLOv4 reduced the model detection speed by 61.86%, but improved mAP and the recall rate by 23.42% and 49.08%. This allows the model detection performance to meet the practical requirements and enables lightweight effects.
When the GhostNet module was introduced, the recall rate of Ghost-YOLOv4 for bushing was only 61.33%, and the AP for aerial work vehicle was only 83%, which was poor for some objects’ detection. For this reason, based on the Ghost-YOLOv4, the proposed model in this paper introduces the ECANet module to improve the model detection performance. Compared with Ghost-YOLOv4, the proposed model slightly increases the model parameters and computational complexity by introducing the ECANet model, and the detection speed decreases by 8.28%, but the introduction of the ECANet model enhances the model detection ability, and the mAP and the recall rate increased by 5.12% and 11.55%, respectively. Although the recall rate of the insulator decreased by 5.75%, the detection performance for other detection objects increased significantly, and in particular the recall rate of bushing increased by 49.92%, and the AP for aerial work vehicles increased by 14.45%, which fully demonstrates the effectiveness of the model proposed in this paper.

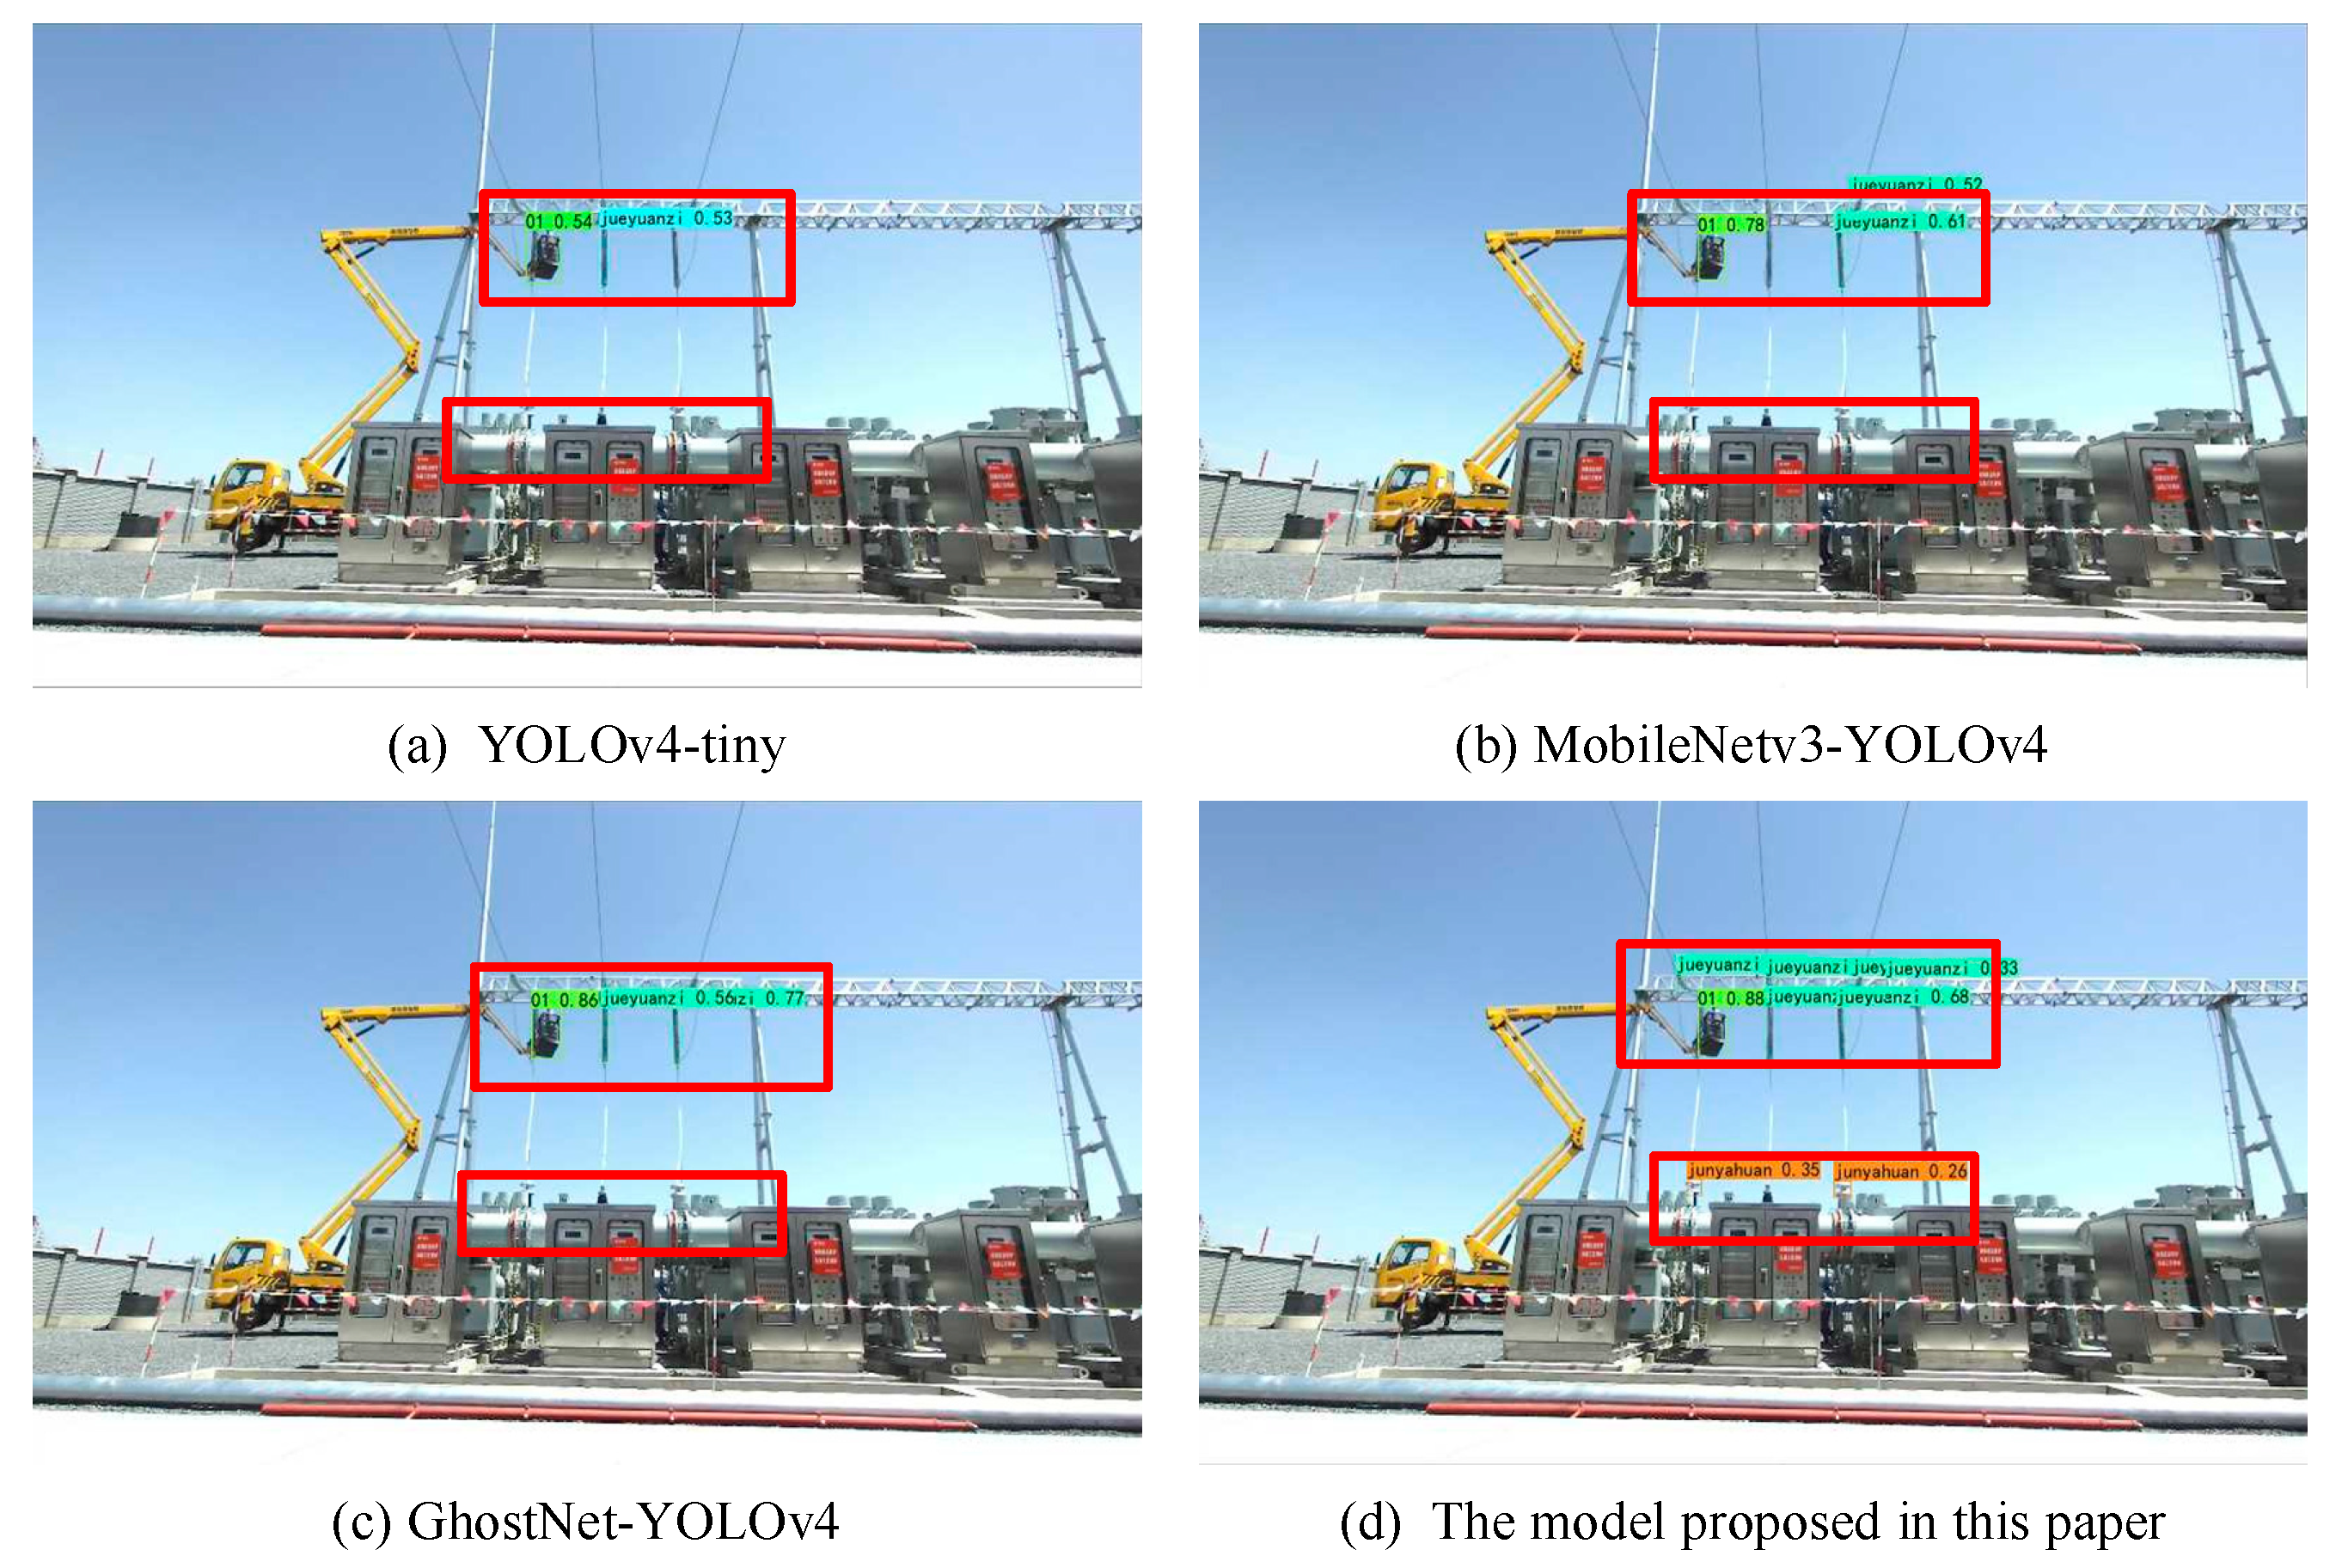
4.3.2. Qualitative Analysis of the Dataset Test Results

As shown in Figure 10, in this paper, the red box is used to circle the place where the image monitoring effect is compared. Compared with the YOLOv4-tiny, MobileNetv3-YOLOv4 and GhostNet-YOLOv4 models, the method proposed in this paper rarely missed the detection of aerial trucks, insulators and bushings in the light complex scene, and Figure 10d shows that only the model proposed in this paper did not miss the detection of the bushings in the images of the lower left and lower right with the best detection effect, which proves that this study used the lightweight transformation of the GhostNet module and efficient extraction of features to improve the detection effect of the model.
As shown in Figure 11, the red box is used to circle the place where the image monitoring effect is compared. For the long-distance, small-target substation operation scenario, YOLOv4-tiny, due to the lack of a prediction branch, and MobileNetv3-YOLOv4, due to the excessive reduction of the model parameters, seriously affected the detection performance of the two models, which could only detect a small number of insulators, and at the same time, the equalizing ring could not be detected. Although GhostNet-YOLOv4 tries to avoid performance loss when reducing the model parameters, it was not effective in detecting small target insulators and voltage-averaging rings, and the best detection results are shown in Figure 11d. In this study, the performance loss of the model parameter reduction was reduced by adding the ECANet module to the model neck network to improve the sensing field of the model’s feature extraction, and the detection results of the proposed model in this paper significantly exceeded those of GhostNet-YOLOv4, which fully proves the effectiveness of the proposed method.
In summary, the proposed model maintained excellent detection performance in complex lighting and long-distance substation construction scenarios, improved the detection speed by reducing parameters through the GhostNet module, and extracted more useful information in feature maps through the ECANet model, with high detection accuracy and very few misses, and at the same time generated detection frames of appropriate size.

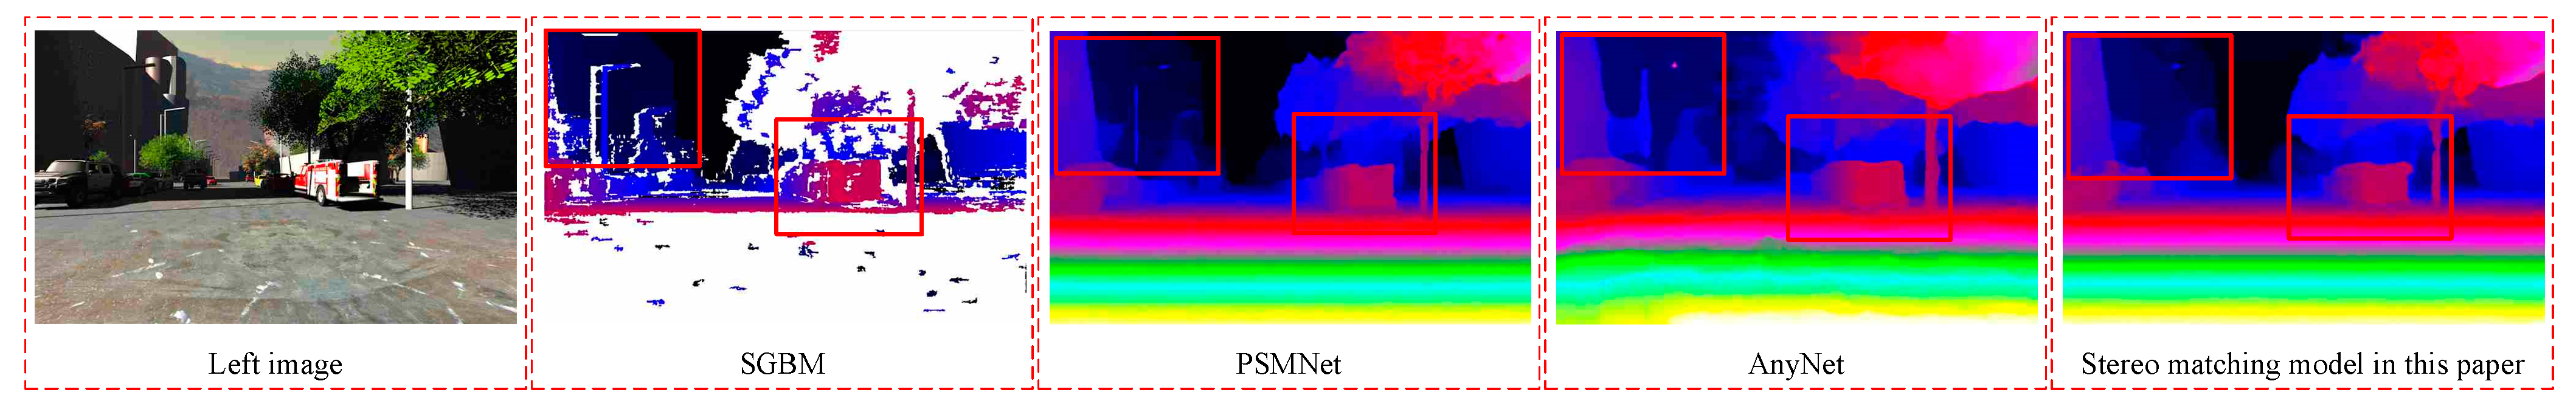
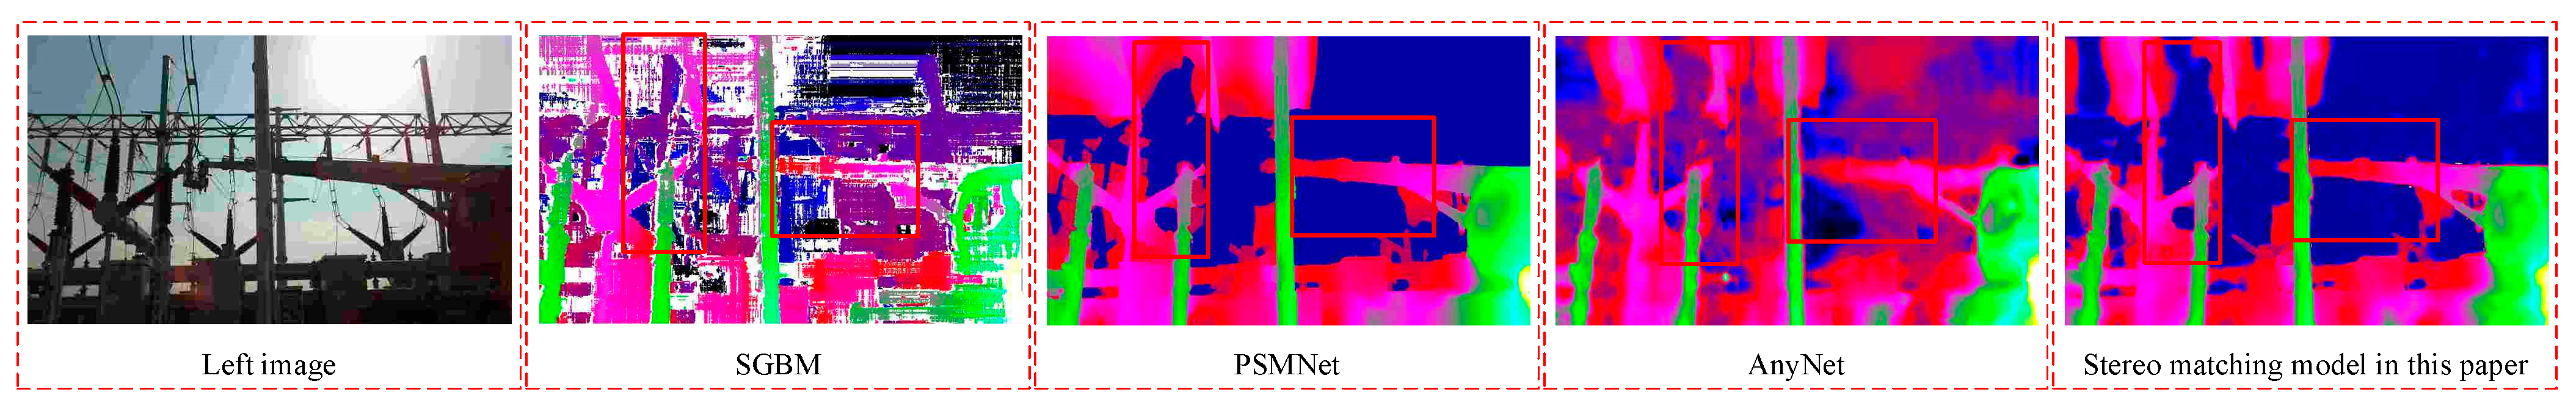
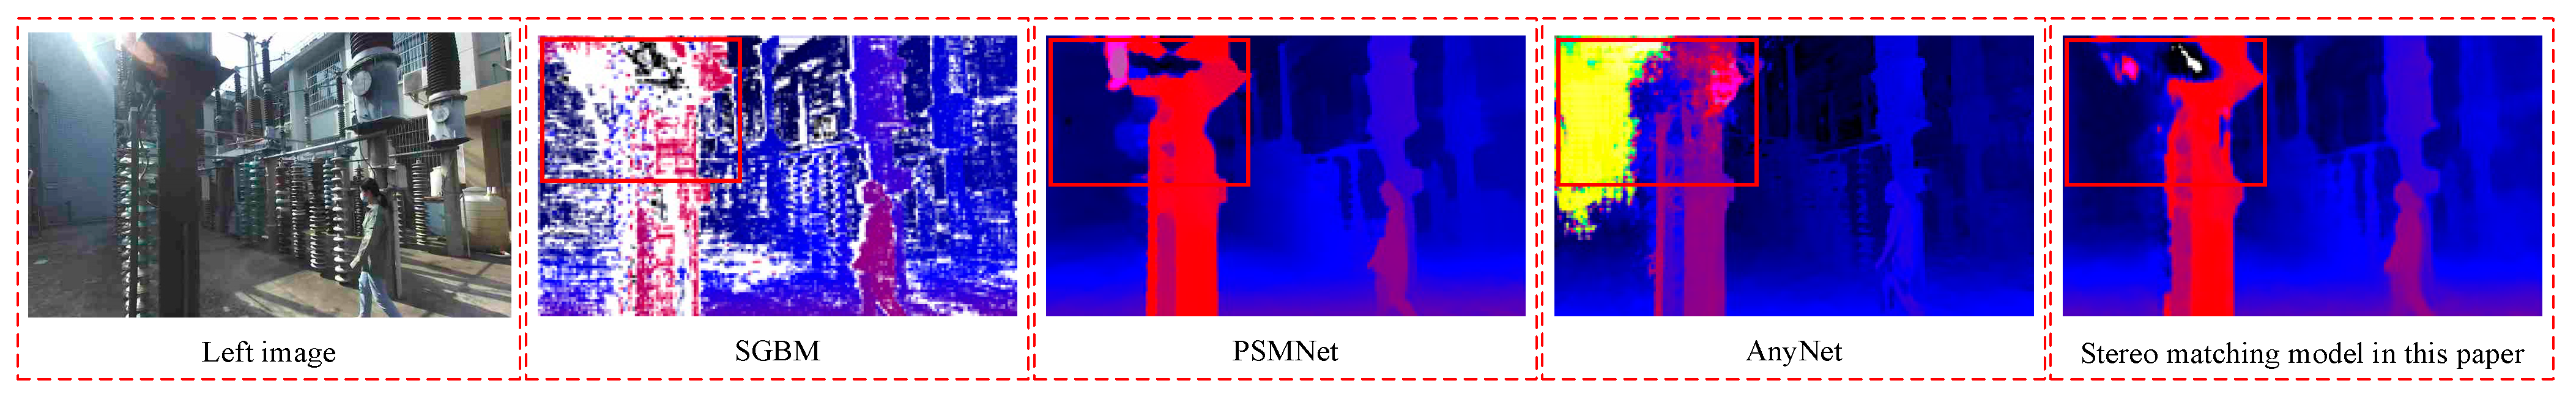
4.4. Performance Analysis of Lightweight Stereo Matching Models Based on Channel Attention

In this paper, the model was first pre-trained on the scene flow dataset. Next, the model was optimally trained on the substation construction scene dataset. The traditional semi-global stereo matching (SGBM) algorithm [38], the deep-learning-based non-real-time stereo matching PSMNet algorithm [23] and the real-time stereo matching AnyNet algorithm [28] were selected for experimental comparison with the proposed stereo matching algorithm in this paper.

4.4.1. Quantitative Analysis of the Dataset Test Results

This paper evaluates the improved network using a metric commonly used in stereo matching [39]; End point Error (EPE) represents the average European distance between the predicted disparity and the ground true disparity over the entire area of the image, as shown in Equation (7), and 3 pixel error (3 px) represents the percentage of pixels with a match point error over 3, as shown in Equation (8). Their results on the banding operation dataset are shown in Table 3.
E P E = 1 N ( x , y ) N | | d e s t ( x , y ) d g t ( x , y ) | | 1
3   p x   e r r o r = 1 N ( x , y ) N | | d e s t ( x , y ) d g t ( x , y ) | | 1 > 3
where N is the aspect of the set of all pixel points of the disparity image and d e s t ( x , y ) and d g t ( x , y ) are the predicted disparity and ground true disparity of the pixel point (x, y).
From the comparison data in Table 3, it can be seen that the traditional stereo matching model SGBM is the worst in both matching accuracy and detection speed; the AnyNet detection speed reached 18.692 frames per second, which initially met the real-time demand, but the detection performance was poorer, and in the error range greater than 3 px, the computational error was 4.69%, and the EPE was 3.48 px. Compared to the real-time stereo matching model AnyNet, the best performing PSMNet, although the 3 px error was reduced by 49.47% and the EPE was reduced by 68.39%, the detection speed was reduced by 96.72% to 0.613 frames per second, which could not meet the real-time demand.
In order to adapt to the real scenario of substation, based on AnyNet, this paper introduced the ECANet module to enhance the feature extraction capability of the model and improve the detection accuracy. Compared with the AnyNet model, the computational error of the model proposed in this paper decreased by 25.80% to 3.48% and the EPE decreased by 34.20% to 2.29 px within the error range of more than 3 px, which was a significant performance improvement. Meanwhile, in order to improve the detection speed of the model, this paper introduced the depth separable convolution in the feature extraction network and reduced the model parameters, which effectively improved the computational speed of the model, and the detection speed was improved by 32.15%. The above two performance improvements fully demonstrate the effectiveness of the model proposed in this paper.

4.4.2. Quantitative Analysis of the Dataset Test Results

In this paper, the visualization of the stereo matching algorithm on the actual substation construction scene set is compared with other methods, as shown in Figure 12, Figure 13, Figure 14 and Figure 15. Among them, the disparity maps are all pseudo-color mapped, and the mapping relationships are shown in Figure 12. In Figure 13, Figure 14 and Figure 15, the red box is used to circle the place where the image monitoring effect is compared.
As Figure 13 shows, a qualitative comparison of the Scene Flow benchmark dataset from the left image and the marked red boxes in the predicted parallax maps obtained through the four networks can be analyzed. SGBM predicted mostly structural structures, incomplete with interruptions; PSMNet predicted cars, walls, trees, and the ground completely, with more accuracy, sharp edges, and the best detection; and AnyNet obtained trees that were all mixed up with the background pattern, and the ground gaps were unclear and street lights matched incorrectly. Compared with the AnyNet method, the poles and trees obtained by the proposed method in this paper were more complete and accurate, and the predicted edges of walls were sharp, accurately distinguishing between the foreground and background, for slightly lower than the PSMNet detection effect. In regions with irregular edges and complex textures, the parallax accuracy predicted by the proposed method in this paper was higher, which could effectively improve the performance of the stereo matching network.
As shown in Figure 14, in this paper, the red circle is used to mark the contrast area in the image. PSMNet had the best detection performance for the parallax prediction of power equipment such as insulators, aerial work vehicles and casings by retaining complete and clear contours and details with clear and sharp edges. AnyNet reduced the utilization of the 3D convolution and reduced the computational complexity, but had a poor detection power for elongated and weakly textured regions. Casing and aerial trucks’ disparity prediction was confused with the background pattern, the gap was not clear, and the detection performance was difficult for practical needs.
As shown in Figure 15, in the substation scene with complex lighting, AnyNet had a large misestimation area due to poor feature advance capability and low robustness; based on AnyNet, the model proposed in this paper strengthens the feature extraction capability and reduces the performance degradation brought by the reduction of 3D convolution by introducing the ECANet module, as shown in the red box. The detection effect of the model proposed in this paper could effectively reduce the misprediction effect compared to that of As shown in the red box, the detection effect of the model proposed in this paper could effectively reduce the error prediction compared to the AnyNet detection effect, and at the same time, the parallax map could be predicted, although the prediction accuracy was not enough in many details. The overall contour of the object, including the edge part of the object, was well predicted to meet the requirements, and it had the appropriate generalizability and feasibility.
In summary, the lightweight stereo matching model based on channel attention could effectively capture cross-channel information and expand the perceptual field of feature extraction, which gives the model better matching performance in slender structures and weak texture regions. Furthermore, the model had excellent matching performance for multi-scale targets in substation construction scenarios through depthwise separable convolution, which significantly improved the model’s matching speed to about 24 FPS while ensuring high matching accuracy.

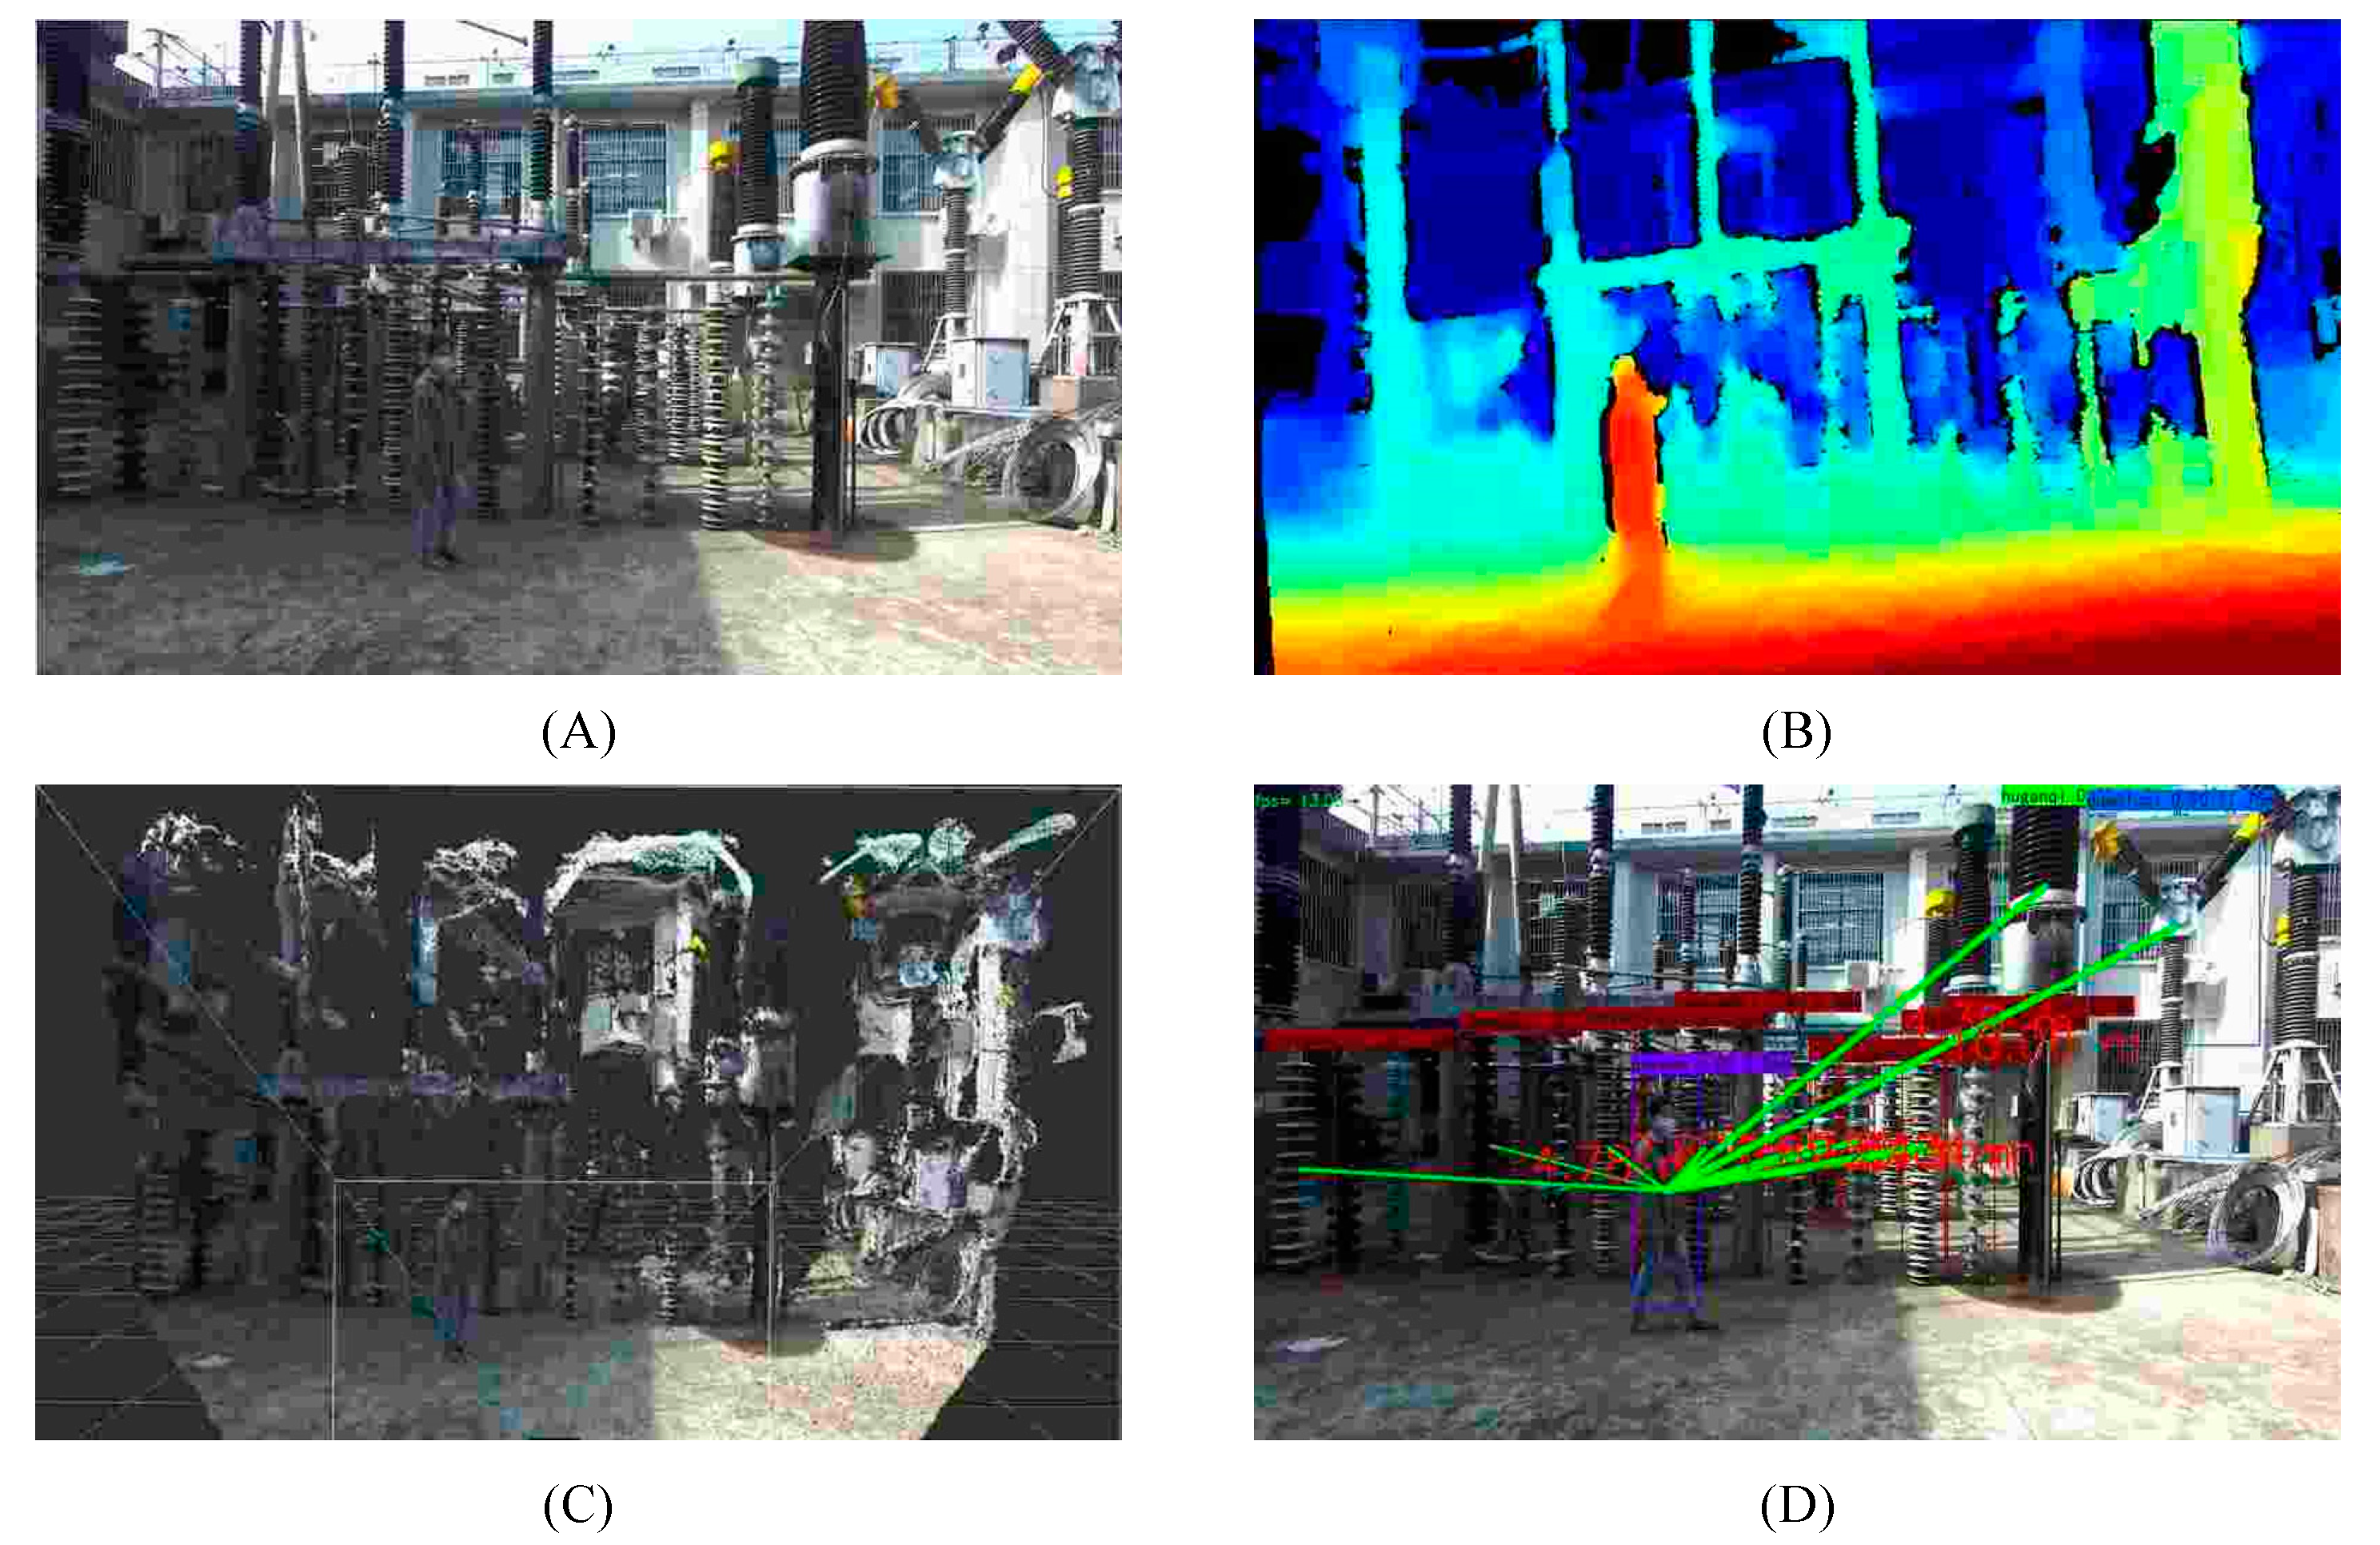
4.5. Performance Analysis of a Lightweight Collaborative Detection Model for the Safe Approach Distance of Large Construction Equipment Based on Stereo Matching and Target Detection

The proposed method was tested in a construction substation, and the effect of this method process is shown in Figure 16. Firstly, the method was based on the substation construction lightweight inspection model to achieve the detection of large construction and power equipment. Meanwhile, the method utilized the lightweight stereo matching model based on channel attention to generate a high-quality dense disparity map, as illustrated in Figure 16B. Additionally, the method generated a depth map and a 3D point cloud map through 3D reconstruction, as shown in Figure 16C. Subsequently, this paper took the center of the target frame as the starting point, and took the mean value of 3D point clouds in the search box as the 3D surface center of the detection target; finally, the geometric distance between the 3D surface center of the construction equipment and power equipment was calculated to determine the safe approach distance to realize the accurate real-time identification of the safety distance of construction equipment near electricity, as shown in Figure 16D. This method effectively guarantees the safety of substation construction operations.
At the same time, in order to verify the generalizability of the method proposed in this paper, this paper tested the proposed method with other substation construction data, as shown in Figure 17. It can be seen that the method proposed in this paper could effectively obtain the scene 3D information (as shown in Figure 17B,C), and at the same time, the method could effectively detect the safety distance between the power equipment and the personnel (as shown in Figure 17D); the method has good generalizability and can be adapted to a variety of electric power production environments.
To verify the feasibility and accuracy of the proposed model in this paper, high-precision laser rangefinder measurement data were adopted as the source of the real safety distance of construction machinery. The accuracy of this method was measured using absolute error and relative error, and five groups of test results are presented in Table 4.
In the testing environment of this paper, the method proposed in this paper could detect 19.35 frames per second of binocular images, meeting the requirements of industrial-level real-time performance. In this method, the average relative error was 3.80%, the minimum absolute error was 0.37 m, the minimum relative error was 1.52%, the maximum absolute error was 2.23 m, and the maximum relative error was 7.16% in the substation construction environment for construction equipment safety distance calculation. This method demonstrated high precision in the real-time detection of safe approach distances for construction equipment.
The source of error of the method proposed in this paper has several aspects, including the error of training data acquisition, the error generated by the calibration process of the internal and external parameters of the camera, the error generated by poor stereo matching of small targets at a long distance and by the power equipment, and factors such as the ambient light, while, for example, as shown by the test number 3 data of the test data in Table 4, the relative error in this test reached 7.16%, which was 88.42% higher than the average relative error. This was due to the disadvantage of binocular stereo vision techniques in long-distance disparity prediction, when the model detected small target goals at long distances, in that, due to the small percentage of the target in the image, there were fewer image features. Therefore, the model proposed in this paper is mainly for ranging scenarios less than 25 m. Meanwhile, for example, as shown in the test number 4 of the test data in Table 4, the outdoor light was too strong to form the glare, so that the substation object texture is lost, which improved the relative error by 6.1% compared to the average relative error.
As shown in Table 5, the average relative error of the SGBM-based distance detection method was 7.91%, which was not suitable for the substation safety approach distance detection scenarios because of its low detection accuracy and detection speed. In addition, the robustness of the method was poor in detecting long-distance targets. Reference [40] achieved a higher accuracy of safety distance detection by laser point cloud data with an average relative error of 2.33%, which was due to the need to collect point cloud data, but the method was not sufficient for the real-time detection of new power equipment added to the substation due to upgrading and remodeling, and it had low versatility. Reference [41] realized the distance detection of electric vehicle charging holes based on the SGBM method and the Scale Invariant Feature Transform (SIFT) feature extraction algorithm, but the method only identified a single charging hole target and for the close-range simple scene less than 500 mm, and its relative error was 5.6%, which could not be adapted to the long-distance complicated substation scenarios. The method proposed in this paper has high detection efficiency, intelligently distinguishes between construction vehicles and electric equipment, has a relative error of only 3.802% in a distance range of less than 30 m, shows a strong robustness and generalization ability in the face of different substation near-electricity operation scenarios, and has real-time detection capability.
Overall, the proposed lightweight collaborative detection model based on stereo matching and target detection is a general method for detecting the safe approach distance of large construction equipment in substations. This method only requires real operation data of substation construction for training. The approach presented in this paper can effectively supervise the safety distance of construction equipment near electricity in real-time, with a high detection accuracy and speed when detecting the binocular images of substation construction operations.

5. Conclusions and Outlook

For the actual substation construction site, the main risks are mostly instantaneous collisions with equipment, high operational risk, difficulty in control, blind areas in control and other related issues. This paper proposes a substation large construction equipment safe approach distance detection method based on stereo vision and object detection, and the conclusions are as follows:
(1)
A lightweight collaborative detection model for the safe approach distance of large construction equipment based on stereo vision and target detection is established. The method realizes the recognition of power equipment and construction vehicles through the object detection model, and converts the stereo-matching-model-perceived disparity data into 3D point cloud data to realize the object localization. The method intelligently distinguishes and localizes power equipment and construction vehicles in real time, thus calculating a safe approach distance for construction vehicles.
(2)
The test results show that the GhostNet module can effectively reduce the computational complexity and improve the computational speed, and the ECANet module can effectively improve the feature extraction ability of the model, both of which can effectively improve the detection performance of the model, and it is suitable for the safety distance detection of substation construction vehicles.
(3)
For the dataset, after comparing the performance analysis of different models, a GhostNet-based substation construction lightweight detection model had a higher detection performance (detection speed was 31.351 frames per second, mAP was 92.16%, the recall rate was 90.37%). A lightweight stereo-matching model based on channel attention likewise had a better detection performance (detection speed of 24.701 frames per second, EPE of 2.29 pixels, 3 px error of 3.48%).
(4)
The results show that a lightweight collaborative detection model has been proposed for the safe detection of approach distances for large construction equipment with a good detection effect, and is jointly composed of the target detection and stereo matching models proposed in this paper. The detection speed of this method is 19.35 frames per second, with an average relative error of only 3.802%.
In this paper, better detection results have been achieved through experimental tests. However, this model is poor for the distance detection of substation scenes larger than 30 m, due to the image target being too small for the stereo matching model, making target feature extraction difficult; at the same time, this model’s outdoor environment anti-glare ability is poor, and strong glare will result in the loss of the target texture. The stereo matching ability has poor stereo matching accuracy for small targets at long distances and glare areas, which will be addressed in future research.

Author Contributions

Conceptualization, B.W. and L.W.; methodology, L.W. and J.Z.; software, L.W.; validation, H.M., P.L. and T.Y.; formal analysis, L.W.; investigation, T.Y.; resources, L.W.; data curation, L.W.; writing—original draft preparation, L.W.; writing—review and editing, J.Z.; visualization, L.W. All authors have read and agreed to the published version of the manuscript.

Funding

This paper is supported by the Major Science and Technology Special Project of Yunnan Provincial Science and Technology Department. Funding organisation: Yunnan Provincial Science and Technology Department, China. Funding number: 202202AD080004.

Data Availability Statement

The datasets presented in this article are not readily available. The dataset used in this manuscript was collected and produced at a substation in Henan, China. Due to the confidentiality requirements of this substation project, this dataset cannot be shared with members outside this project.

Conflicts of Interest

The authors declare no conflict of interest.

References

  1. Li, Q. Technical Manual of Lifting and Transportation Construction for Power Transmission and Transformation Projects; China Electric Power Press: Beijing, China, 2012. [Google Scholar]
  2. Ma, H.; Wang, B.; Gao, W.; Liu, D.C.; Li, Z.Y.; Liu, Z.J. Optimization Strategy for Frequency Regulation Service of Regional Integrated Energy Systems Considering Compensation Effect of Frequency Regulation. Autom. Electr. Power Syst. 2018, 42, 127–135. [Google Scholar]
  3. Zhang, Y.; Li, H.; Liu, Y.; Wang, Y.; Pan, Z.; Zheng, X.; Jiang, Y.; Liu, J.; Li, A.; Jing, H. A Power Operation Site Safety Assistant System Based on Convolutional Neural Network. IOP Conf. Ser. Earth Environ. Sci. 2019, 358, 42–52. [Google Scholar] [CrossRef]
  4. Ma, F.; Wang, B.; Dong, X.; Yao, L.; Wang, H. Safety image interpretation of power industry: Basic concepts and technical framework. Proc. CSEE 2022, 42, 458–475. [Google Scholar]
  5. State Grid Corporation of China. Electricity Supply Enterprise Operation Safety Risk Identification and Prevention Manual; China Electric Power Press: Beijing, China, 2008. [Google Scholar]
  6. Li, X.; Chen, Z. Design and Application of Monitoring System of Remote Video and Environment to Smart Substations. Appl. Mech. Mater. 2018, 496–500, 1634–1637. [Google Scholar] [CrossRef]
  7. Zhou, Q.; He, W.; Li, S. Research on the group-type of high voltage electric field measurement safety distance caution apparatus. Int. J. Grid Distrib. Comput. 2016, 9, 109–120. [Google Scholar] [CrossRef]
  8. Fan, J.; Zhang, M.; Deng, Q.R.; Xin, Y.N.; Wang, L.Y.; Zheng-Hao, H.E.; Bureau, G. Design and Calculation of DC High Voltage Safety Distance Warning System Based on Electric Field Measurement. Water Resour. Power 2017, 35, 183–185+161. [Google Scholar]
  9. Du, X.; Xie, Q.; He, X. Design and Experiment of Multi-electrode Electric Field Vector Sensor System for Electric Early Warning. Yunnan Electr. Power 2023, 51, 33–36+40. [Google Scholar]
  10. Zhang, B.; He, Y.; Cheng, J. Safety Control System of Hoisting Operation Based on UWB and Visual Information. Instrum. Tech. Sens. 2021, 10, 98–102+114. [Google Scholar]
  11. Liu, Y.; Li, X.; Luo, X.; Huang, S.; Li, L.; He, X. Development of a positioning device suitable for electric power workers and vehicle management. J. Jiangxi Vocat. Tech. Coll. Electr. 2021, 34, 8–10. [Google Scholar]
  12. Li, X.; Zhang, J.; Zhang, L.; Luo, X. Research and Application of Substation Operation Safety Management and Control System Based on Three-dimensional Modeling and Composite Positioning. In Proceedings of the 2022 5th International Conference on Intelligent Robotics and Control Engineering (IRCE), Tianjin, China, 23–25 September 2022; pp. 13–19. [Google Scholar]
  13. Liu, Z.; Miao, X.; Chen, J.; Jiang, H. Review of visible image intelligent processing for transmission line inspection. Power Syst. Technol. 2020, 44, 1057–1069. [Google Scholar]
  14. Takouhi, O. Approaches for Stereo Matching. Model. Identif. Control. 1995, 16, 65–94. [Google Scholar] [CrossRef]
  15. Zhang, Y.; Wang, B.; Ma, F.; Luo, P.; Zhang, J.; Li, Y. High-precision Detection Method of Irregular Outer Surface Defects of Power Equipment Based on Domain Adaptation Network. High Volt. Eng. 2022, 48, 4516–4526. [Google Scholar]
  16. Yin, C.; Zhi, H.; Li, H. Survey of Binocular Stereo-matching Methods Based on Deep Learning. Comput. Eng. 2022, 48, 1–12. [Google Scholar]
  17. Kobayashi, Y.; Karady, G.G.; Heydt, G.T.; Olsen, R.G. The utilization of satellite images to identify trees endangering transmission lines. IEEE Trans. Power Deliv. 2009, 24, 1703–1709. [Google Scholar] [CrossRef]
  18. Yu, M.; Li, X. Binocular Visual Recognition Technology for Electric Vehicle Charging Holes Based on SIFT Algorithm. Control. Instrum. Chem. Ind. 2023, 50, 316–322. (In Chinese) [Google Scholar]
  19. Bai, G.; Zheng, Y.; Wu, K.; Wu, S.; Guo, E.; Zhao, Y.; Shan, X.; Tang, X.; Dong, E. Power line identification and localization method for live Working Robot of Distribution Line. Power Syst. Technol. 2023, 47, 2604–2611. [Google Scholar]
  20. Marie, H.S.; Abu El-hassan, K.; Almetwally, E.M.; El-Mandouh, M.A. Joint shear strength prediction of beam-column connections using machine learning via experimental results. Case Stud. Constr. Mater. 2023, 17, e01463. [Google Scholar] [CrossRef]
  21. Zhou, K.; Meng, X.; Cheng, B. Review of Stereo Matching Algorithms Based on Deep Learning. Comput. Intell. Neurosci. 2020, 2020, 8562323. [Google Scholar] [CrossRef]
  22. Bontar, J.; Lecun, Y. Computing the Stereo Matching Cost with a Convolutional Neural Network. IEEE Comput. Soc. 2014, 7–12, 1592–1599. [Google Scholar]
  23. Chang, J.; Chen, Y. Pyramid stereo matching network. In Proceedings of the 2018 IEEE/CVF Conference on Computer Vision and Pattern Recognition (CVPR), Salt Lake City, UT, USA, 18–23 June 2018. [Google Scholar] [CrossRef]
  24. Lu, C.; Uchiyama, H.; Thomas, D.; Shimada, A.; Taniguchi, R.-I. Sparse Cost Volume for Efficient Stereo Matching. Remote Sens. 2018, 10, 1844. [Google Scholar] [CrossRef]
  25. Zhao, H.; Zhou, H.; Zhang, Y.; Zhao, Y.; Yang, Y.; Ouyang, T. EAI-Stereo: Error Aware Iterative Network for Stereo Matching. In Proceedings of the ACCV 2022: 16th Asian Conference on Computer Vision, Macau SAR, China, 4–8 December 2022; pp. 3–19. [Google Scholar]
  26. Wei, Z. Safety Risk Control of Substation Construction Site Hoisting Operation; China Electric Power Press: Beijing, China, 2023. (In Chinese) [Google Scholar]
  27. Bochkovskiy, A.; Wang, C.; Liao, H. YOLOV4: Optimal speed and accuracy of object detection. arXiv 2020, arXiv:2004.10934. [Google Scholar]
  28. Wang, Y.; Lai, Z.; Huang, G.; Wang, B.H.; Van Der Maaten, L.; Campbell, M.; Weinberger, K.Q. Anytime stereo image depth estimation on mobile devices. In Proceedings of the 2019 International Conference on Robotics and Automation (ICRA), Montreal, QC, Canada, 20–24 May 2019; pp. 5893–5900. [Google Scholar]
  29. Han, K.; Wang, Y.; Tian, Q.; Guo, J.; Xu, C.; Xu, C. GhostNet: More features from cheap operations. In Proceedings of the 2020 IEEE/CVF Conference on Computer Vision and Pattern Recognition (CVPR), Seattle, WA, USA, 13–19 June 2020; pp. 1577–1586. [Google Scholar]
  30. Howard, A.; Sandler, M.; Chu, G.; Chen, L.C.; Chen, B.; Tan, M.; Wang, W.; Zhu, Y.; Pang, R.; Adam, H.; et al. Searching for MobileNetV3. In Proceedings of the 2019 IEEE/CVF International Conference on Computer Vision (ICCV), Seoul, Republic of Korea, 27 October–2 November 2019; pp. 1314–1324. [Google Scholar]
  31. Wang, Q.; Wu, B.; Zhu, P.; Li, P.; Zuo, W.; Hu, Q. ECA-Net: Efficient channel attention for deep convolutional neural networks. In Proceedings of the 2020 IEEE/CVF Conference on Computer Vision and Pattern Recognition (CVPR), Seattle, WA, USA, 13–19 June 2020; pp. 11531–11539. [Google Scholar]
  32. Wang, C.Y.; Liao HY, M.; Wu, Y.H.; Chen, P.Y.; Hsieh, J.W.; Yeh, I.H. CSPNet: A new backbone that can enhance learning capability of CNN. In Proceedings of the 2020 1EEE/CVF Conference on Computer Vision and Pattern Recognition Workshops (CVPRW), Seattle, WA, USA, 14–19 June 2020; pp. 1571–1580. [Google Scholar]
  33. Liu, S.; Qi, L.; Qin, H.; Shi, J.; Jia, J. Path aggregation network for instance segmentation. In Proceedings of the 2018 IEEE/CVF Conference on Computer Vision and Pattern Recognition, Salt Lake City, UT, USA, 18–23 June 2018; pp. 8759–8768. [Google Scholar]
  34. He, K.; Zhang, X.; Ren, S.; Sun, J. Spatial pyramid pooling in deep convolutional networks for visual recognition. IEEE Trans. Pattern Anal. Mach. Intell. 2015, 37, 1904–1916. [Google Scholar] [CrossRef]
  35. Ronneberger, O.; Fischer, P.; Brox, T. U-Net: Convolutional Networks for Biomedical Image Segmentation; Springer International Publishing: Cham, Switzerland, 2015. [Google Scholar]
  36. Mayer, N.; Ilg, E.; Hausser, P.; Fischer, P.; Cremers, D.; Dosovitskiy, A.; Brox, T. A large dataset to train convolutional networks for disparity, optical flow, and scene flow estimation. In Proceedings of the 2016 IEEE Conference on Computer Vision and Pattern Recognition (CVPR), Las Vegas, NV, USA, 27–30 June 2016; pp. 4040–4048. [Google Scholar]
  37. Zhang, Z. Flexible camera calibration by viewing a plane from unknown orientations. In Proceedings of the 17th IEEE International Conference on Computer Vision, Kerkyra, Greece, 20–27 September 1999; Volume 1, pp. 666–673. [Google Scholar]
  38. Hirschmuller, H. Stereo processing by semiglobal matching and mutual information. IEEE Trans. Pattern Anal. Mach. Intell. 2007, 30, 328–341. [Google Scholar] [CrossRef]
  39. Zhang, Y.; Fan, Q.; Bao, F.; Liu, Y.; Zhang, C. Single-image super-resolution based on rational fractal interpolation. IEEE Trans. Image Process. 2018, 27, 3782–3797. [Google Scholar] [PubMed]
  40. Mao, X.; Xing, Y.; Luo, G.; Huang, H.; Dong, L.; Lu, C. Measurement of ice thickness of transmission line based on improved SGBM algorithm. Autom. Instrum. 2021, 11, 23–26+31. (In Chinese) [Google Scholar]
  41. Chen, C.; Peng, X.; Song, S.; Wang, K.; Yang, B. Safety distance diagnosis of large scale transmission line corridor inspection based on LiDAR point cloud collected with UAV. Power Syst. Technol. 2017, 41, 2723–2730. (In Chinese) [Google Scholar]
Figure 1. A framework for safe approach distance detection of substations’ large construction equipment based on stereo vision and object detection.
Electronics 12 03510 g001
Figure 2. Flowchart of safe approach distance detection of substations’ large construction equipment based on stereo vision and object detection.
Electronics 12 03510 g002
Figure 3. GhostNet-based lightweight inspection method for substation construction.
Electronics 12 03510 g003
Figure 4. Schematic diagram of the Ghost module.
Electronics 12 03510 g004
Figure 5. Structure of Ghost_net.
Electronics 12 03510 g005
Figure 6. Schematic diagram of the ECANet.
Electronics 12 03510 g006
Figure 7. Schematic diagram of lightweight stereo matching network based on channel attention.
Electronics 12 03510 g007
Figure 8. Schematic diagram of an efficient feature extraction network.
Electronics 12 03510 g008
Figure 9. Example of the binocular dataset in this paper. (A) Scene flow dataset left image. (B) Substation construction scene dataset left image. (C) Scene flow dataset right image. (D) Substation construction scene dataset right image. (E) Scene flow dataset disparity map. (F) Substation construction scenes dataset disparity map.
Electronics 12 03510 g009
Figure 10. Test results of complex light operation scenarios for substation construction. (a) Test results with YOLOv4-tiny. (b) Test results with MobileNetv3-YOLOv4. (c) Test results with GhostNet-YOLOv4. (d) Test results with the model proposed in this paper.
Electronics 12 03510 g010
Figure 11. Test results of long-distance scenarios for substation construction work. (a) Test results with YOLOv4-tiny. (b) Test results with MobileNetv3-YOLOv4. (c) Test results with GhostNet-YOLOv4. (d) Test results with the model proposed in this paper.
Electronics 12 03510 g011
Figure 12. Pseudo-color mapping relationship diagram.
Electronics 12 03510 g012
Figure 13. Visualization of the performance of the proposed algorithm in the Scene Flow dataset compared with other methods.
Electronics 12 03510 g013
Figure 14. Visualization of the performance of the proposed algorithm in the slender structure region compared with other methods.
Electronics 12 03510 g014
Figure 15. Visualization of the performance of the proposed algorithm on weakly textured regions compared with other methods.
Electronics 12 03510 g015
Figure 16. Visualization of the effect of the proposed method. (A) Left image of substation construction scene. (B) Disparity map of substation construction scene. (C) Substation construction scene 3D point cloud. (D) The effect of the method proposed in this paper.
Electronics 12 03510 g016
Figure 17. Visualization of the effect of the proposed method. (A) Left image of worker operation scene. (B) Disparity map of worker operation scene. (C) Worker operation scene 3D point cloud. (D) The effect of the method proposed in this paper.
Electronics 12 03510 g017
Table 1. Binocular camera internal and external calibration parameters.
Calibrated ObjectsLeft CameraRight Camera
Intrinsic matrix 1914.24 0 1110.47 0 1914.24 613.60 0 0 1 1914.24 0 1110.47 0 1914.24 613.60 0 0 1
Distortion parameters 0 0 0 0 0 0 0 0 0 0
Rotation matrix R 0 0 0 0 0
Translation matrix T 120.001 0 0
Table 2. Comparison of different target detection models for the identification of actual datasets for banding operations.
ModelYOLOv4-TinyMobileNetv3-YOLOv4GhostNet-YOLOv4The Proposed Model
AP (%)Recall (%)AP (%)Recall (%)AP (%)Recall (%)AP (%)Recall (%)
Identification
Results (%)
Equalizing ring8648.818469.018779.989088.62
Bushing7950.207577.608761.339291.95
Crane7564.237960.148679.248991.83
Isolating switch7677.949276.739292.319695.19
insulator8575.788773.439185.919180.97
Aerial work vehicle4746.757263.438387.429593.67
mAP (%)74.6781.5087.6792.16
Mean Recall (%)60.6270.0581.0190.37
FPS92.91335.34934.18231.351
Table 3. Quantitative comparison of the model proposed in this paper with other methods on substation construction data.
ModelEPE3 px (%)FPS
SGBM20.830.50.497
PSMNet1.102.370.613
AnyNet3.484.6918.692
The model proposed in this paper2.293.4824.701
Table 4. Test data of the proposed method.
Test NumberReal Distance/mDetection Distance/mAbsolute Error/mRelative Error/%
115.5316.010.483.09
224.3623.990.371.52
331.1233.352.237.16
419.3518.570.784.03
526.4225.570.853.21
Table 5. Performance comparison of distance detection methods.
MethodTechnical ToolsMean Absolute Error/mMean Relative Error/%Whether It Can Be Detected in Real TimeWhether to Support Multiple Scenes
Reference [40]Stereo matching0.0057.91NoYes
Reference [41]LIDAR + 3D reconstruction0.08182.33NoNo
Reference [18]Stereo matching + object identification0.001125.60NoYes
The method proposed in this paperStereo matching + object detection0.9423.802YesYes
Disclaimer/Publisher’s Note: The statements, opinions and data contained in all publications are solely those of the individual author(s) and contributor(s) and not of MDPI and/or the editor(s). MDPI and/or the editor(s) disclaim responsibility for any injury to people or property resulting from any ideas, methods, instructions or products referred to in the content.

