Abstract
The knowledge of signal demodulation processes using superheterodyne receivers is of great importance in the field of telecommunications. Superheterodyne receivers receive the current focus of many scientists in a wide variety of applications. This topic is part of the syllabus of the Communication Theory course at the School of Telecommunications of the Polytechnic University of Cartagena, Spain. The authors found that the academic performance of the students had not been entirely satisfactory in recent years. This situation was aggravated during the COVID-19 lockdown. Students had to reinforce their knowledge independently at home, despite the support provided by teachers. To the best of the authors’ knowledge, there is a noticeable lack of educational tools in this area; of those that are available, they exhibit a mismatch with the specific needs of this subject. This manuscript shows how the design of the educational software tool DOSHER, tailored to enhance the understanding of superheterodyne receivers, successfully alleviated the aforementioned drawbacks. DOSHER was designed, developed, and applied during the 2020–2021 academic year (during the COVID-19 lockdown). The results show that students were not only very satisfied with its use, but they also improved their marks. Analysis of students’ academic performance in the year of DOSHER implementation showed an average improvement in their marks of between 9–12% compared with previous years. In 2021–2022, when DOSHER was fully operational from the start, the improvement in terms of pass rate (31%) at the first mid-term was significant compared to previous years (<20%).
1. Introduction
The pandemic caused by COVID-19, in March 2020, forced Spanish educational institutions to suspend face-to-face teaching activities and their consequent virtual development. This fact required a redesign of the usual teaching and learning contexts at all levels of the Spanish educational system, specially in university teaching. This situation has therefore highlighted the need to strengthen the digitalization of education and the use of software tools to support teaching [1,2,3]. Not only is it essential for teachers and students to acquire greater digital competence, but the need for tools and simulators that can complement or reinforce face-to-face practical activities in the laboratories of many universities has also become apparent. In this sense, in the world of engineering, having software applications to support students in their learning is a fundamental requirement. In addition, the development of what is known as “scientific competence” among students should be facilitated so that they can also carry out experiments and simulations autonomously, thus making it possible to learn theoretical concepts through their application in more realistic environments. Unfortunately, in many cases, the applications and tools available for this purpose are for professional use with expensive licenses or do not even exist for certain fields of interest. Traditionally, the MATLAB and Simulink environments from Mathworks have been used for learning various scientific or engineering disciplines, as well as tools such as PSpice, COMSOL, or Mathcad, and ad hoc applications have been developed in high-level languages such as C++ or Fortran [4,5,6,7].
In particular, knowledge of the signal demodulation processes using superheterodyne receivers is of great importance in the field of telecommunications. Superheterodyne receivers play a central role for multiple scientists in a wide variety of applications, involving high-frequency communications [8,9,10,11,12], lasers [13,14], acoustics [15,16], diagnostic purposes [17,18], etc. This topic is part of the curriculum for bachelor’s degrees in telecommunications and electrical engineering subjects, such as Communication Theory, taught at the Higher Technical School of Telecommunications Engineering (ETSIT) of the Polytechnic University of Cartagena (UPCT), in Murcia, Spain.
To the best of the authors’ knowledge, there is a noticeable lack of educational applications and tools in this area, as well as a mismatch with the specific needs of this subject by those that are available [19,20,21,22,23,24]. There are a few fee-based hardware learning platforms designed to study and understand the working principle and basic operation of superheterodyne radio receivers, such as Scientech TechBooks [25], and some more generic fee-based software simulation applications for communications, such as TIMS (Telecommunication Instructional Modeling System) [26], and kits combining a hardware and software framework [27]. Therefore, the need to develop a graphical, intuitive, flexible, and free tool to reinforce the theoretical knowledge acquired in this branch of telecommunications engineering in an autonomous, practical, fast, and visual way for students, without the need to program code, generate new algorithms, create modules, develop complex setups, and pay a fee, is key. DOSHER, therefore, represents a contribution to the application of educational software in the field of communication systems and the demodulation process, aimed at predicting and analyzing the demodulation of frequency-division multiplex (FDM) signals using superheterodyne receivers. Furthermore, the tool invented by the authors and presented here includes an embedded tutorial with three guided practice exercises for the students to perform, which could be part of syllabuses focusing on the theory of communication.
This research has shown that the development and use of software applications tailored to the needs of students, such as DOSHER, is necessary in the engineering field to improve student satisfaction and academic performance, particularly in situations where face-to-face attendance is not possible.
2. Materials and Methods
The methodology used to design DOSHER involved first compiling the marks achieved by students in the first part of their Communication Theory studies over the years 2017–2018, 2018–2019, and 2019–2020. The data collected showed that the learning about the superheterodyne detection of modulated signals was significantly poor, with a pass rate of less than 20% of those who took the exams. Among the possible reasons for this was the fact that the teaching of this part of the subject requires significant graphical support, which is usually provided by the teacher by solving exercises using the traditional blackboard. In addition, this part of the subject requires extensive practice in order to master the different situations that can arise depending on the tuning parameters chosen and the type of modulated signals. In addition, a decline in academic performance was observed in the course from 2019–2020, when COVID-19 imposed university closures and classes had to be conducted remotely.
Based on this evidence, it was considered necessary to reinforce the teaching–learning process by using free, intuitive software tools adapted to the content of this subject, but nothing with these characteristics was found on the market.
2.1. Intermediate Frequency Demodulation
A superheterodyne receiver is a device present in all modern TV and radio receivers, in which the incoming radio frequency (RF) signal is converted to an intermediate frequency (IF) signal through the intervention of a mixer and a local oscillator [28]. It is also used for the superheterodyne detection of high-frequency acoustic waves [29], or can even involve both acoustic and electromagnetic signals, using a mixer-first acoustic-filtering front end [16].
The block diagram in Figure 1 presents a tunable bandpass filter of BRF bandwidth, a mixer with an also adjustable local oscillator (LO), a fixed bandpass filter centered to IF (fIF) with BIF bandwidth, and a baseband demodulator (either made up of another mixer, LO, and low-pass filter, if they are linearly modulated signals, or if they are Frequency Modulated (FM) or Phase Modulated (PM) signals, by an angle demodulator, for example):

Figure 1.
Block diagram of a one-stage superheterodyne receiver. The receiver is tuned by changing the frequencies of the local oscillator and the RF bandpass filter (tilted arrows).
We can estimate the output frequency of the first mixer as:
where is the frequency of the RF local oscillator, and is the input frequency to the mixer. In a receiver, when is less than the RF (), it is referred to as low-side injection, and the mixer is usually called a low-side down-converter. Alternatively, when the LO frequency is above the RF, it is defined as high-side injection, and the mixer is named a high-side down-converter.
If a high-side tuning is chosen and is the carrier frequency of the channel to be demodulated, we find that, for , and ,
Therefore, the original signal will be transferred to:
Another replica of the signal will fall on the spectrum at:
On the other hand, if a low-side injection is considered, with , the output frequency of the RF mixer will be . One copy of the signal will be carried at:
and the other one will be moved to:
After applying the IF band-pass filter, only the selected signal of interest will go to assuming no interferences at the RF (Figure 2).
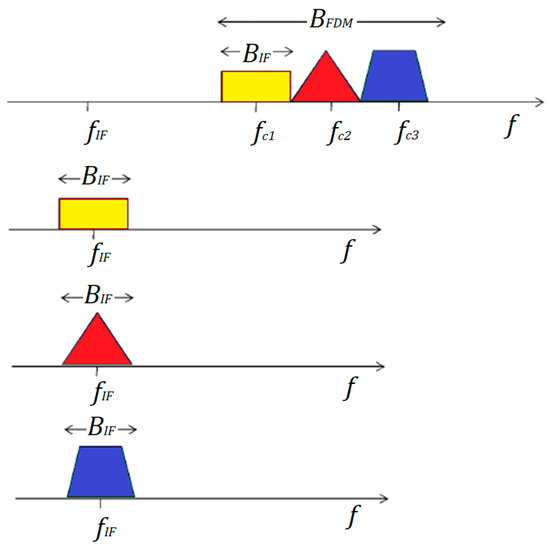
Figure 2.
IF demodulation of each of the 3 channels of the FDM (frequency-division multiplex) band, with the RF local oscillator tuned to the corresponding frequency.
2.2. Image Frequency
Image frequency interference is a negative phenomenon that occurs when portions of other signals that are at a spectral distance from the local oscillator, and specular to the tuned carrier, that is, (when up-side injection) or (when low-side injection), are not properly filtered by the RF filter and cause IF interference. When high-side injection is set:
So, the interference will fall on:
which would properly be filtered by the IF band-pass filter, or
where the interferent signal would overlap with the desired one. Alternatively, if low-side tunning is configured:
Then, the interference will fall at:
which would again be removed by the IF band-pass filter, or
where the interferent RF signal would drop again within the IF band.
2.3. DOSHER Software Tool
The authors were responsible for all the stages of the DOSHER development process, including planning, design, and coding, in order to create, within a few months, a computer program capable of helping students to master this block of the subject, both in class and autonomously at home, and which provides them with guided practical exercises and a complete user manual.
DOSHER (acronym for DOwn Super HEterodyne Receiver) version 1.2 is an application developed in the MATLAB environment, compiled so as to be able to be run autonomously through an executable (.exe) file, which allows the analysis, in frequency and level, of FDM signals modulated in Double Sideband (DSB), Low Single Sideband (LSSB), or Upper Single Sideband (USSB).
2.3.1. Graphical User Interface
The capabilities and tools available in the application are briefly described below. Figure 3 provides a general view of the DOSHER graphical user interface (GUI).
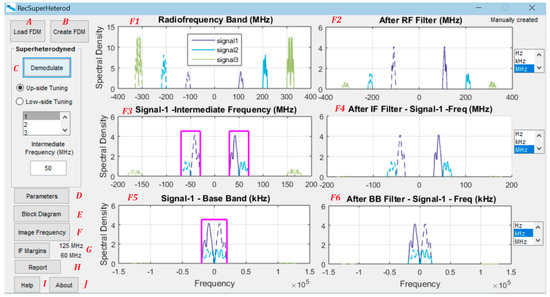
Figure 3.
DOSHER main GUI window. A full and detailed description of all buttons and plots (marked with capital letters that do not actually exist in the GUI) can be found in Appendix A.
Step-by-step menus for the demodulation process with DOSHER are detailed in Appendix A.
The following is a summary of the procedure for DOSHER users to analyze and adjust the parameters of a superheterodyne receiver. First, the student must manually load or create the desired RF multiplex signals. The user then enters the parameters of the filters and local oscillators of each receiver stage in “Parameters”, selects the type of tuning (either up-side or low-side) and the intermediate frequency, and selects the channel to be demodulated from the numbered list. Once the receiver is fully defined, the user proceeds to “Demodulate”. The result of this process is presented graphically in the 6 figures embedded in the DOSHER HMI, showing the power spectral density of the signal before and after each receiver stage. The DOSHER user can check whether there is any interference by image frequency and, if so, in which spectral band it occurs, as well as the intermediate frequency ranges that avoid this negative phenomenon. Finally, once the receiver has been properly designed, the user can generate a report with all the graphs and data by pressing the “Report” button.
2.3.2. DOSHER Flowchart
The flowchart in Figure 4 indicates the step-by-step process to be followed to obtain the available results with DOSHER.
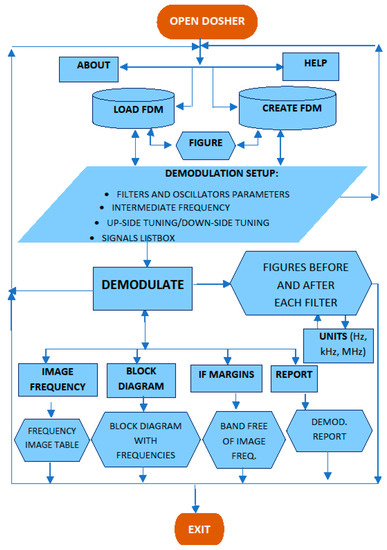
Figure 4.
DOSHER flow diagram.
2.3.3. Guided Practices Using DOSHER
As part of its Help/Tutorial option, DOSHER includes a set of three laboratory sessions (Appendix B) with corresponding instructions to guide students in properly achieving their objectives during their eventual laboratory sessions. In this sense, such exercises are designed to last less than 1 h and 30 min—as discussed in the following section.
The competencies and skills that are expected to be acquired throughout the activities are:
- Understand the basics of demodulation using superheterodyne receivers.
- Review the influence of different linearly modulated signals (DSB, LSSB, USSB) when demodulating with superheterodyne receivers.
- Adjust filters and local oscillator parameters to improve the demodulation of the desired signal with both up-side and down-side tuning.
- Understand the image frequency phenomenon when demodulating signals.
- Design and tune superheterodyne receivers to avoid image frequency interference.
- Increase the motivation to face new challenges and problems in this field of theory of communication and signal processing, and find solutions.
With the practice exercises proposed, the students will be able to:
- Reinforce their knowledge of the demodulation of linearly modulated signals with superheterodyne receivers in a comprehensive and simple way, developing competencies 1 to 5 throughout the 3 practices.
- Analyze, design, and find solutions for superheterodyne receivers, carried out in the practical sessions covering competencies 3 to 6.
- Be aware of the influence of the image frequency phenomenon and how to overcome it, by means of reinforcing skills 4 and 5 in practice 3.
3. Results
The School of Telecommunications at the Universidad Politécnica de Cartagena, Spain used this software in one subject, “Theory of Communication”, throughout the 2020–2021 academic year. This subject is included in two bachelor’s degree programs, with a duration of four academic courses. Theory of Communication is a core subject offered in both the Engineering Telematics and Engineering Telecommunication Systems degree programs in the second quarter of the second year, with 183 students enrolled during the study period. The subject is divided into two main blocks, the first of which focuses on the content of superheterodyne receivers. The tool was made available at the discretion of any enrolled student via remote access to the UPCT Virtual Classroom platform (supported by Moodle) after the first term test until the final exam of the 2020–2021 term, once it was fully debugged.
In addition, a voluntary and anonymous survey based on different authors, [30,31] was administered to the students using DOSHER. Both questions and results are shown in Table 1, where M is the mean and D is the standard deviation of the responses. Students were asked to rate the features, acceptability and usability of DOSHER choosing a scale of 1 (strongly disagree), 2 (disagree), 3 (neither agree nor disagree), 4 (agree), and 5 (strongly agree).

Table 1.
Evaluation survey of DOHSER administrated to rate DOSHER features, using scale of 1 (strongly disagree) to 5 (strongly agree).
In view of the results of the survey, the general assessment of the students (43 replies) can be considered highly satisfactory (4.2 out of 5 for question 14). The analysis of the statistical significance obtained shows, based on the percentage of students who completed the survey, an uncertainty (1σ) of 3.17%, and a margin of error for a confidence interval of 2σ of approximately 6.3%.
In addition, teachers found it interesting to define voluntary tasks in the UPCT virtual platform so that students could upload the reports of the three guided practices included in DOSHER. When the lockdown was over and classroom attendance was allowed, these specific tasks were carried out in the classroom under the guidance and supervision of the teachers (and authors of this study). This provided the basis for a qualitative assessment of the extent to which this tool had achieved its objectives.
The preliminary analysis of the results after the exploitation of DOSHER by the students also shows an improvement that could be attributed to the use of the tool. The evolution of the marks obtained only by the 46 students who did not pass the first test (with the content of Block 1 only) and who took the final exam (covering the whole subject) in the 2020–2021 course is quite good: 74.8% improved their marks compared to the first test. The same analysis was undertaken in previous years. In the absence of DOSHER, 65.2% of the 36 students who failed the first test achieved better marks in the final test in 2017–2018; 63.1% of the 38 improved their marks in 2018–2019; and 61.8% of the 40 improved their marks in 2019–2020.
In the 2021–2022 academic year, the tool was fully implemented in the teaching of the first block of the subject. Although DOSHER is a tool designed to reinforce students’ concepts at home in an autonomous way, this does not prevent teachers from using it as a complementary and very useful tool in class, as was the case. The exercises given in class were quickly solved with DOSHER in a clear, fast, and precise way. The performance of the students in this course showed a significant improvement (31% pass rate among those presented) compared to previous years.
Nevertheless, outcomes should be observed with caution, due to the multiple biases that can occur when extrapolating population samples over time, as well as the variability of the questions in different exams and years.
The analysis of the evolution of the students’ academic performance in the years before and after the use of DOSHER, the satisfaction survey questionnaire, and the review of the reports of the three activities uploaded by the students provide the authors with sufficient data to ensure that the achievement of the objectives initially set out with the DOSHER tool has been largely attained.
Although the DOSHER tool was rated very highly by the students, and the academic results have improved, there is still room for improvement. On the basis of all the data in the study, the authors feel that competences 5 (ability to design and tune superheterodyne receivers) and 6 (increasing student motivation) are still halfway towards the target.
4. Conclusions
In this work, we have presented DOSHER as an intuitive educational tool to acquaint students with the demodulation of linearly modulated FDM signals using superheterodyne receivers. The DOSHER educational tool was developed throughout the academic year 2020–2021 (during the COVID-19 lockdown) with the main objective of supporting autonomous learning of the concepts of this subject by the students, thus reinforcing the classes led by the teacher.
DOSHER is a stand-alone application coded in the MATLAB environment, intuitive, and visual, developed with a friendly graphical interface, to be used as a complementary pedagogical tool to reinforce the teaching of telecommunications engineering subjects related to the processes of demodulation and superheterodyne reception.
Its incorporation into laboratory sessions, or its individual use at home by students, will allow them to improve their academic performance and mitigate future learning difficulties in this field caused by situations that impede presence.
With DOSHER, students can design and tune filters and oscillators to enhance the expected baseband signal at the output of the receiver, starting from FDM signals either predefined in a file or created by the user with the graphical tool included in DOSHER. Students can easily follow the evolution of the signal stage-by-stage from its origin in the RF band to its complete demodulation in the baseband, observing possible interferences, and tuning the intermediate frequency to avoid them.
In addition, DOSHER includes a set of three guided exercises to enable students to acquire knowledge of demodulation and superheterodyne reception.
The authors intend to extend the capabilities of DOSHER in the future by integrating successive stages of frequency conversion and multiple IFs of different values (e.g., dual or triple conversion superheterodyne). We will also include the demodulation of AM signals and further improve the graphical interface.
The analysis of the survey carried out and the results obtained by the students show the need to maintain the use of this tool in the present and the future. DOSHER has been designed by the authors, who teach this subject, so it is fully adapted to the scope of the subject of Communication Theory, it does not present superfluous functions that do not correspond to this subject, and it is intuitive and easy to use. Therefore, any engineering student wishing to consolidate or extend their knowledge of the demodulation processes using superheterodyne receivers should download the tool and start practicing its use.
The authors aim to Increase the pass rate to 50% of students taking this first block of the subject within a few years, and we will continue to strive to fully achieve the original goals.
In conclusion, due to the advantages of the educational tool presented, DOSHER represents an excellent option for enhancing and improving student learning about superheterodyne receivers in any course related to Communication Theory.
Author Contributions
Conceptualization, D.P.-Q., J.-V.R., L.J.-L. and J.M.-S.; methodology, D.P.-Q., J.-V.R., L.J.-L. and J.M.-S.; software, D.P.-Q.; validation, D.P.-Q., J.-V.R., L.J.-L., J.M.-S. and I.R.-R.; formal analysis, D.P.-Q., J.-V.R., L.J.-L. and J.M.-S.; investigation, D.P.-Q., J.-V.R., L.J.-L., J.M.-S. and I.R.-R.; resources, D.P.-Q., J.-V.R., L.J.-L., J.M.-S. and I.R.-R.; data curation, D.P.-Q., J.-V.R., L.J.-L., J.M.-S. and I.R.-R.; writing—original draft preparation, D.P.-Q.; writing—review and editing, D.P.-Q., J.-V.R., L.J.-L., J.M.-S. and I.R.-R.; visualization, D.P.-Q., J.-V.R., L.J.-L., J.M.-S. and I.R.-R.; supervision, D.P.-Q., J.-V.R., L.J.-L., J.M.-S. and I.R.-R.; project administration, D.P.-Q.; funding acquisition, D.P.-Q. All authors have read and agreed to the published version of the manuscript.
Funding
This research received no external funding.
Data Availability Statement
The data that support the findings of this study are available on request from the corresponding author. The software DOSHER is available on http://sicomo.upct.es/index.php/es/, accessed on 7 August 2023.
Conflicts of Interest
The authors declare no conflict of interest.
Appendix A. Software User Guide
- (1)
- Load FDM
When button “Load FDM” (A, in Figure 3) is pressed, the user can load the signals previously created using a simple txt file (e.g., Notepad), with just 6 columns and as many rows as signals desired (Table A1).

Table A1.
Example of predefined RF signals loaded from a text file.
Table A1.
Example of predefined RF signals loaded from a text file.
| Type of Signal 1 | Min Frequency | Max Frequency | Frequency Carrier | Min Amplitude | Max Amplitude |
|---|---|---|---|---|---|
| 1 | 1100 × 106 | 1150 × 106 | 1125 × 106 | 0.1 | 0.1 |
| 2 | 1200 × 106 | 1230 × 106 | 1200 × 106 | 0.2 | 0.4 |
| 3 | 1280 × 106 | 1300 × 106 | 1300 × 106 | 0.1 | 0.3 |
| 3 | 1340 × 106 | 1380 × 106 | 1360 × 106 | 0.3 | 0.6 |
1 Files do not require these headers with description of each field.
Signals are not required to be sorted in the file from the minimum frequency to the maximum one when created. Nevertheless, it is important to avoid overlapping among them, and the maximum number of signals is constrained to 64.
- First column: Type of signal. Employing this parameter, the shape of the signal is defined: Type 1 (square signal), with constant amplitude within the frequency margins; Type 2 (up-Slope signal), with amplitude increasing from the lowest level to the maximum one; Type 3 (down-slope signal), with amplitude decreasing from the highest level to the minimum one. For DSB signals, slope criteria are kept for the Low Side Band.
- Second column: Minimum frequency in Hz.
- Third column: Maximum frequency in Hz.
- Fourth column: Frequency carrier in Hz.
- Fifth column: Minimum amplitude of the signal in W/Hz.
- Sixth column: Maximum amplitude of the signal in W/Hz.
Once the FDM signal is loaded, it will be shown in the top plot (F1) of Figure 3, as well as in a new plot to allow the saving, zoom in/out, or any other image processing (Figure A1).
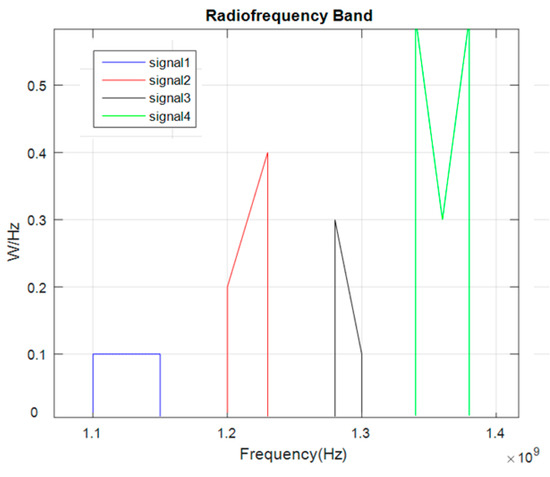
Figure A1.
RF signal in a new plot corresponding to signals defined in Table 1.
- (2)
- Create FDM
By this option (button B, in Figure 3), the user can sequentially create the FDM signals by hand, by first defining the number of signals and then defining the type of modulation, frequencies, and shape of each signal by clicking with a pointer on the graph itself, as displayed in Figure A2.
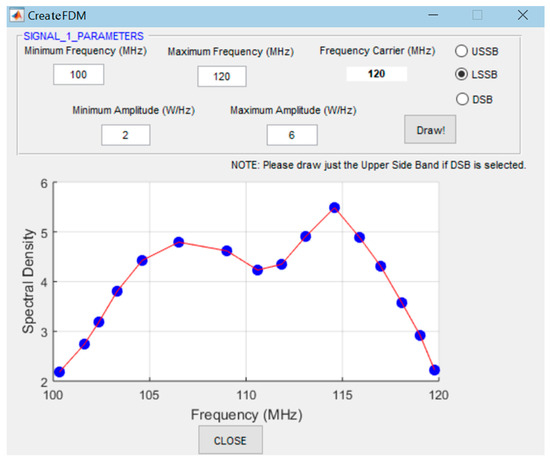
Figure A2.
Tool to manually define and draw USSB, LSSB, or DSB signals.
The result of a manual generation of an FDM built with DSB and SSB signals is presented in Figure A3.
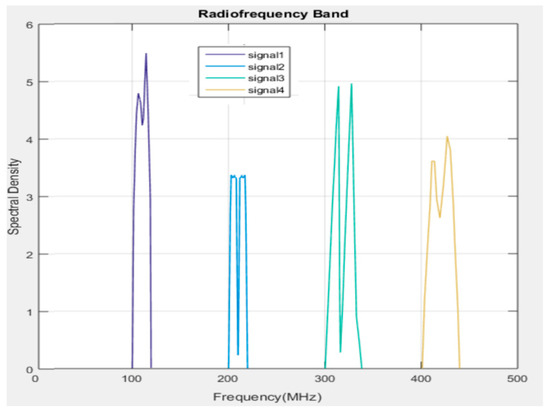
Figure A3.
Signals built with “Create FDM” button.
- (3)
- Demodulate
In the panel framed with the label “Superheterodyned”, when the button Demodulate (C in Figure 3) is pressed, the RF signal previously loaded will be demodulated according to the following parameters:
- Up-Side Tuning/Low-Side Tuning: Radio buttons where the user can choose the frequency of the local oscillator.
- List box, where the user selects the signal/channel to be demodulated to IF and the baseband from the FDM.
- Intermediate Frequency (MHz): The user sets the desirable IF in this edit box.
Once the demodulation process is concluded, the DOSHER tool displays the tuned signal at each stage in the superheterodyne receiver, together with the rest of the filtered signals, from the radio frequency input down to the baseband output. Signals are displayed before and after each filter of the receiver, in the locations shown in Figure A4, both in the graphical user interface (GUI) of DOSHER itself and in other specific plots which are displayed out of the main GUI.

Figure A4.
Superheterodyne locations (F1 to F6) where signals are monitored and displayed.
- F1 is the location of the FDM signals at the input of the superheterodyne receiver and is displayed in the top left graph of Figure 3.
- F2 is the position of the FDM signals once filtered by the RF bandpass filter tuned at the selected channel and displayed in the top right graph of Figure 3.
- F3 provides the output of the RF mixer, and it is displayed on the mid-left graph of Figure 3. The IF bandpass filter will be also overlaid in magenta color over the demodulated signal at the input of such filter.
- The F4 location provides the FDM signals once filtered by the intermediate frequency bandpass filter (fix cut-off frequencies) and displayed in the mid-right graph of Figure 3.
- F5 provides the output of the IF mixer, and it is displayed on the bottom left graph of Figure 3. Together with the desirable demodulated signal, the potential filtered interferers by image frequency will be also displayed.
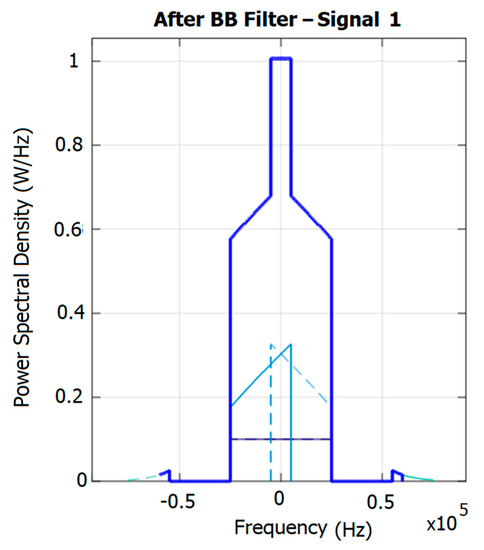
Figure A5.
Signals at the output of the baseband filter.
The desired signal, shown in Figure A5, is present but overlaid with the interferer (in light blue). The global spectral density created by the uncorrelated addition of all signals in the baseband is plotted in solid blue (envelope).
- (4)
- Parameters
By this option (D in Figure 3), the user can configure both gain and roll-off (in dB/decade) of the squared transfer function of the RF, IF, and BB filters, as depicted in Figure A6.
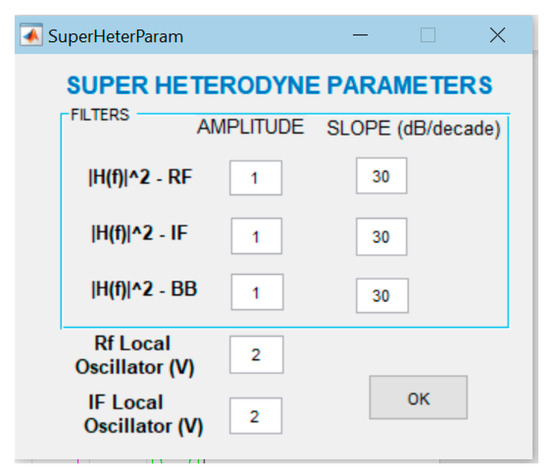
Figure A6.
Superheterodyne parameters for filters and oscillators.
In addition, the amplitude of the RF local oscillator and IF local oscillator can also be selected. The frequency of the RF oscillator is automatically chosen by the tool (as a function of the selected signal) and the frequency of the IF oscillator.
- (5)
- Block Diagram
This tool (E in Figure 3) provides the parameters for both filters and local oscillators for the selected signal (Figure A7).
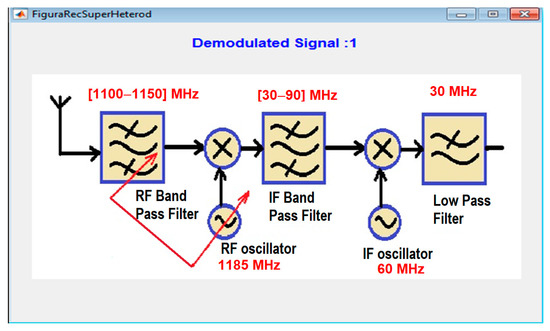
Figure A7.
Block diagram with the selected parameters (in red) for the signal demodulation.
- (6)
- Image Frequency.
The Image Frequency capability (F in Figure 3) allows students to identify for the specific demodulated signal the list of possible interferers, as well as the RF interferent band, the IF interferent band, and the interferent baseband among the signals belonging to the FDM (Figure A8).
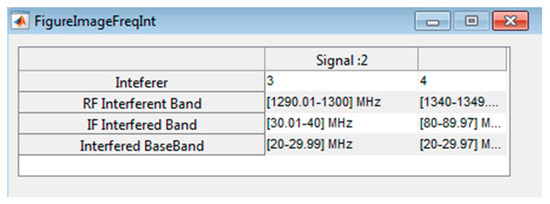
Figure A8.
Image interference table.
- (7)
- Intermediate Frequency Margins
This tool (G in Figure 3) shows the frequency range of IF values where the image interference could be avoided.
- (8)
- Report
This capability (H in Figure 3) allows students to download all the relevant information (spectral density figures and receiver parameters) from the receiver design and demodulation progress of the selected signal throughout the different stages.
- (9)
- Help
This option (I in Figure 3) opens the tutorial for guidance in the use of the DOSHER tool and includes a complete tutorial with guided practices of increasing difficulty.
- (10)
- ABOUT
When the About button is pressed (J in Figure 3), a dialog with the current version of the tool is opened.
Appendix B. Guided Practices
Appendix B.1. Laboratory Session 1—Introduction to DOSHER
The goal of this practice is to train the students in the handling of the different DOSHER tools, options, and plots available. Students will reinforce competence 1 by reviewing the basics of superheterodyne demodulation of signals, as well as competence 3, when tuning the gain and frequencies of filters and oscillators.
- Open DOSHER.
- Load the file called “RF Single DSB Signal_1”.
- Check the bandwidth and maximum and minimum frequencies in the magnified figure provided by DOSHER.
- Edit the file with a text editor application (e.g., Notepad or Wordpad) and compare the values and type of signal displayed with the recorded one. Check the frequency carrier. Identify the kind of modulation of the signal.
- Select Up-Side Tuning, and an intermediate frequency of 100 MHz.
- Click on the “Parameters” button and specify the gain and slope for RF, IF, and BB filters: ideal filters with unity gain and without attenuation. Enter an amplitude of 2V for both RF and IF local oscillators.
- Design, with pen and paper, the superheterodyne receiver required to demodulate the selected signal indicating the frequency band of the filters and frequency of the local oscillators. Click now on the button “block diagram” and compare the results.
- Click on “Demodulate” for the only signal available and check the results.
- Calculate, theoretically, the frequency band and shape of the spectral density of the signal at each stage of the superheterodyne receiver and compare this with the results provided by DOSHER.
- Calculate the final shape and amplitude of the spectral density in the baseband. Verify that the shape and amplitude match the figure provided by DOSHER. Assume that signal 1 is perfectly correlated with itself when demodulated to the baseband, but uncorrelated with any other. Please be aware that the spectral density of the sum is NOT the sum of spectral densities.
Appendix B.2. Laboratory Session 2—Demodulation of FDM Signals Created by Hand
The students will be able to study, design, and optimize superheterodyne receivers when dealing with FDM signals. They will strengthen competence 2 by checking the results with different linear modulated channels; competence 3 when adjusting both parameters of filters and oscillators or demodulating with each type of tuning; and competence 6 by encouraging the students to create new signals using the embedded editor tool or to review the report of results to optimize the demodulation process.
- Define an FDM of three signals by pressing the button “Create FDM”.
- The signals will have the following parameters. The frequency carrier is automatically calculated.
- USSB, Min Freq. 100 MHz, Max Freq. 120 MHz.
- LSSB, Min Freq. 200 MHz, Max Freq. 250 MHz.
- DSB, Min Freq. 300 MHz, Max Freq. 360 MHz.
Shapes are left to the student’s choice.
- 3
- Pick on “Parameters” and specify the gain and slope for the RF, IF, and BB filters: ideal filters with unity gain and 30 dB of attenuation. Enter an amplitude of 2 V for both RF and IF local oscillators.
- 4
- Select signal 1, an IF of 160 MHz, Up-Side Tuning, and click on Demodulate.
- 5
- Compare the theoretical results with the plots provided by DOSHER. Signal 1 will be correctly demodulated without interferences from signals 2 and 3.
- 6
- Click on IF Margins to check the suitable frequency range, where interferences by image frequency should not appear.
- 7
- Repeat the same steps for signals 2 and 3. Are the signals properly demodulated without attenuation and interferences?
- 8
- Compare the frequencies selected by DOSHER in the block diagrams with the expected one.
- 9
- Select Low-Side Tuning and verify the range of frequencies where interferences should not appear.
- 10
- Repeat steps from 5 to 8. Comment on the differences obtained between both demodulations (up-side or low-side).
- 11
- Create a report for each signal demodulated (with low-side tuning) by clicking on such tool. Comment on the results and propose an optimum solution.
Appendix B.3. Laboratory Session 3—Demodulation of FDM Signals Loaded from a File, Image Frequency Interference
In this practice, the students will deepen their knowledge of the effect produced by the image frequency in the demodulation process of FDM signals. Students will mainly develop competence 2 by checking the demodulation process followed by different linear modulations, competencies 4 and 5 by studying the unwanted effect produced by spectral segments of other signals located at the image frequency of the signal to be demodulated, and competence 6 when investigating suitable IF ranges where the effect could be avoided.
- Open DOSHER.
- Upload the file named “RF Signals Lab Session 3.txt”.
- Check in the enlarged figure provided by DOSHER the bandwidth and the maximum and minimum frequencies.
- Edit the text file to check the carrier frequency for each signal. Identify the type of modulation.
- Select Up-Side Tuning, signal 1, and an intermediate frequency of 80 MHz.
- Select “Parameters” and specify the same unity gain for the RF, IF, and BB filters and a filter roll-off of 30, 40, and 25 dB per decade, respectively. Enter an amplitude of 2 V for the local RF and IF oscillators.
- Click on “Demodulate” for the square signal (signal 1) and check the results.
- Discuss the results. Is signal 1 correctly demodulated? Is there interference from some other signal? Why? Could you justify the shape of the spectral density of the demodulated signal obtained in the baseband?
- Design with pencil and paper the block diagram of the superheterodyne receiver required to demodulate signal 1: the frequency band of the filters and frequency of the local oscillators. Compare with the results provided by DOSHER.
- Click on the “Image Frequency” button. Interfering signals and interfered bands will be represented in RF, IF, and BB. Comment on the results.
- Verify the demodulation process by now selecting signal 2, but keeping the rest of the parameters. Is signal 2 correctly demodulated? Is there interference from any other signal? Why? Could you explain the shape of the spectral density of the demodulated signal in the baseband?
- Press the “Image Frequency” button again. Interferers and the interfered band will be displayed in RF, IF, and BB.
- Click on the “IF Margins” button. Justify the recommended frequency range for IF demodulation suggested by the tool.
- Modify the IF frequency by selecting a new one within the above range, for example, 160 MHz. Select signal 1 and click the Demodulate button again.
- Indicate if interference is present now from any other FDM signal by clicking on “Image Frequency”.
- Demodulate signals 2, 3, and 4 with up-tuning and 160 MHz IF. Check for interference now. Include the results obtained.
References
- Cabero-Almenara, J.; Llorente-Cejudo, C. COVID-19: Transformación radical de la digitalización en las instituciones universitarias. Campus Virtuales 2020, 9, 25–34. [Google Scholar]
- Schleicher, A. The Impact of COVID-19 on Education: Insights from Education at a Glance 2020; OECD Publishing: Paris, France, 2020; Available online: https://www.oecd.org/education/the-impact-of-covid-19-on-education-insights-education-at-a-glance-2020.pdf (accessed on 1 August 2023).
- Tarkar, P. Impact of COVID-19 Pandemic on Education System. Int. J. Adv. Sci. Technol. 2020, 29, 3812–3814. [Google Scholar]
- MATLAB, Version 8.5.0 (R2015a); The MathWorks Inc.: Natick, MA, USA, 2015.
- Available online: https://www.orcad.com/orcad-free-download (accessed on 1 August 2023).
- Available online: https://www.comsol.com (accessed on 1 August 2023).
- Available online: https://www.mathcad.com/en/ (accessed on 1 August 2023).
- Dan, L.; Ducournau, G.; Hisatake, S.; Szriftgiser, P.; Braun, R.; Kallfass, I. A Terahertz Wireless Communication Link Using a Superheterodyne Approach. IEEE Trans. Terahertz Sci. Technol. 2020, 10, 32–43. [Google Scholar] [CrossRef]
- Grötsch, C.M.; Dan, I.; John, L.; Wagner, S.; Kallfass, I. A Compact 281–319 GHz Low-Power Downconverter MMIC for Superheterodyne Communication Receivers. IEEE Trans. Terahertz Sci. Technol. 2021, 11, 231–239. [Google Scholar] [CrossRef]
- Ma, L.; Chen, Z.; Zhou, J. Design of a Q-band superheterodyne transceiver. In Proceedings of the 2016 IEEE International Conference on Microwave and Millimeter Wave Technology (ICMMT), Beijing, China, 5–8 June 2016; pp. 904–906. [Google Scholar] [CrossRef]
- Dan, I.; Ducournau, G.; Hisatake, S.; Szriftgiser, P.; Braun, R.; Kallfass, L. A superheterodyne 300 GHz wireless link for ultra-fast terahertz communication systems. Int. J. Microw. Wirel. Technol. 2020, 12, 578–587. [Google Scholar] [CrossRef]
- Zhang, C.; Zhang, J.; Zhang, Y.; Zhang, Y.; Liu, J.; Park, S.M. A Wide-gain-range Intermediate Frequency Integrated Circuit for a Superheterodyne Receiver. J. Semicond. Technol. Sci. 2018, 18, 525–535. [Google Scholar] [CrossRef]
- Wang, Z.; Jing, M.; Zhang, P.; Yuan, S.; Zhang, H.; Zhang, L.; Xiao, L.; Jia, S. Noise analysis of the atomic superheterodyne receiver based on flat-top laser beams. Opt. Express 2023, 31, 19909–19917. [Google Scholar] [CrossRef] [PubMed]
- Jing, M.; Hu, Y.; Ma, J. Atomic superheterodyne receiver based on microwave-dressed Rydberg spectroscopy. Nat. Phys. 2020, 16, 911–915. [Google Scholar] [CrossRef]
- Seo, H.; Zhou, J. A Passive-Mixer-First Acoustic-Filtering Superheterodyne RF Front-End. IEEE J. Solid-State Circuits 2021, 56, 1438–1453. [Google Scholar] [CrossRef]
- Madadi, I.; Tohidian, M.; Cornelissens, K.; Vandenameele, P.; Staszewski, R.B. A High IIP2 SAW-Less Superheterodyne Receiver with Multistage Harmonic Rejection. IEEE J. Solid-State Circuits 2016, 51, 332–347. [Google Scholar] [CrossRef]
- Sun, J.; Lu, C.; Wang, M.; Yuan, H.; Qi, L. Performance Assessment and Prediction for Superheterodyne Receivers Based on Mahalanobis Distance and Time Sequence Analysis. Int. J. Antennas Propag. 2017, 2017, 6458954. [Google Scholar] [CrossRef]
- Song, D.; Liu, H.; Qi, L.; Zhou, B. A General Purpose Adaptive Fault Detection and Diagnosis Scheme for Information Systems with Superheterodyne Receivers. Complexity 2018, 2018, 4763612. [Google Scholar] [CrossRef]
- Özer, T.; Çimen, H.; Akbal, A. A New Educational Modulation Simulator Using for Digital and Analog Modulations. In Proceedings of the 2nd International Conference on Advances in Engineering Sciences and Applied Mathematics (ICAESAM’2014), Istanbul, Turkey, 4–5 May 2014. [Google Scholar] [CrossRef]
- Noga, K.M.; Palczynska, B. The Simulation Laboratory Platform Based on Multisim for Electronic Engineering Education. In Proceedings of the 2018 International Conference on Signals and Electronic Systems (ICSES), Kraków, Poland, 10–12 September 2018; pp. 269–274. [Google Scholar] [CrossRef]
- Diniz, P.; Veiga, A.; Rocha, G. Adapting team-based learning for application in telecommunications engineering using software-defined radio. Int. J. Electr. Eng. Educ. 2019, 56, 238–250. [Google Scholar] [CrossRef]
- Yin, W.; Zhao, Q.; Chen, Z.; Qu, Z. A Blended Lab on Phase-Sensitive Demodulation for Undergraduate Electronic Circuit Design Course. Creat. Educ. 2022, 13, 3332–3345. [Google Scholar] [CrossRef]
- Doallo, M.R.; Mallo, J.N.R. Analog and Digital Demodulation Process Examples Using GNU Radio. In Proceedings of the 2018 IEEE World Engineering Education Conference (EDUNINE), Buenos Aires, Argentina, 11–14 March 2018; pp. 1–5. [Google Scholar] [CrossRef]
- Grayver, E.; Olsen, S. A software-defined radio tool for interference analysis. In Proceedings of the 2018 IEEE Aerospace Conference, Big Sky, MT, USA, 3–10 March 2018; pp. 1–9. [Google Scholar] [CrossRef]
- Scientech TechBooks. Available online: https://www.scientechworld.com/education-software-training-and-skill-development (accessed on 1 August 2023).
- Emona Tims. Available online: https://www.emona-tims.com/emona-product/prepare-lab/ (accessed on 1 August 2023).
- Uengtrakul, B.; Bunnjaweht, D. A cost efficient software defined radio receiver for demonstrating concepts in communication and signal processing using Python and RTL-SDR. In Proceedings of the 2014 Fourth International Conference on Digital Information and Communication Technology and Its Applications (DICTAP), Bangkok, Thailand, 6–8 May 2014; pp. 394–399. [Google Scholar] [CrossRef]
- Haykin, S.; Moher, M. Communication Systems, 5th ed.; Wiley Publishing: Hoboken, NJ, USA, 2009; pp. 135–140. [Google Scholar]
- Tong, Y.; Guo, X.; Li, M.; Tang, H.; Sharmin, N.; Xu, Y.; Wong, K.K. Ultrafast optical phase-sensitive ultrasonic detection via dual-comb multiheterodyne interferometry. Adv. Photonics Nexus 2023, 2, 016002. [Google Scholar] [CrossRef]
- Sanguino, T.D.J.M.; López, C.S.; Hernández, F.A.M. WiFiSiM: An Educational Tool for the Study and Design of Wireless Networks. IEEE Trans. Educ. 2013, 56, 149–155. [Google Scholar] [CrossRef]
- Millán, E.; Belmonte, M.; Ruiz-Montiel, M.; Gavilanes, J.; Pérez-de-la-Cruz, J. BH-ShaDe: A Software Tool that Assists Architecture Students in the Ill-Structured Task of Housing Design. IEEE Trans. Learn. Technol. 2016, 9, 244–257. [Google Scholar] [CrossRef]
Disclaimer/Publisher’s Note: The statements, opinions and data contained in all publications are solely those of the individual author(s) and contributor(s) and not of MDPI and/or the editor(s). MDPI and/or the editor(s) disclaim responsibility for any injury to people or property resulting from any ideas, methods, instructions or products referred to in the content. |
© 2023 by the authors. Licensee MDPI, Basel, Switzerland. This article is an open access article distributed under the terms and conditions of the Creative Commons Attribution (CC BY) license (https://creativecommons.org/licenses/by/4.0/).