Article

YOLOv7-UAV: An Unmanned Aerial Vehicle Image Object Detection Algorithm Based on Improved YOLOv7

1
School of Information Science and Electrical Engineering, Shandong Jiaotong University, Jinan 250357, China
2
School of Information Engineering, Shandong Management University, Jinan 250357, China
3
Shandong Shansen CNC Technology Co., Ltd., Tengzhou 277500, China
*
Authors to whom correspondence should be addressed.
Electronics 2023, 12(14), 3141; https://doi.org/10.3390/electronics12143141
Submission received: 18 June 2023 / Revised: 12 July 2023 / Accepted: 17 July 2023 / Published: 19 July 2023

Abstract

:
Detecting small objects in aerial images captured by unmanned aerial vehicles (UAVs) is challenging due to their complex backgrounds and the presence of densely arranged yet sparsely distributed small targets. In this paper, we propose a real-time small object detection algorithm called YOLOv7-UAV, which is specifically designed for UAV-captured aerial images. Our approach builds upon the YOLOv7 algorithm and introduces several improvements: (i) removal of the second downsampling layer and the deepest detection head to reduce the model’s receptive field and preserve fine-grained feature information; (ii) introduction of the DpSPPF module, a spatial pyramid network that utilizes concatenated small-sized max-pooling layers and depth-wise separable convolutions to extract feature information across different scales more effectively; (iii) optimization of the K-means algorithm, leading to the development of the binary K-means anchor generation algorithm for anchor allocation; and (iv) utilization of the weighted normalized Gaussian Wasserstein distance (nwd) and intersection over union (IoU) as indicators for positive and negative sample assignments. The experimental results demonstrate that YOLOv7-UAV achieves a real-time detection speed that surpasses YOLOv7 by at least 27% while significantly reducing the number of parameters and GFLOPs to 8.3% and 73.3% of YOLOv7, respectively. Additionally, YOLOv7-UAV outperforms YOLOv7 with improvements in the mean average precision (map (0.5:0.95)) of 2.89% and 4.30% on the VisDrone2019 and TinyPerson datasets, respectively.

1. Introduction

With the decrease in the cost of drones, the civilian drone market has entered a period of rapid development. At the same time, target detection technology based on deep learning has also made remarkable progress in recent years, which has made the combination of drones and target detection technology more closely related. The integration of the two can play an important role in many fields, such as crop detection [1], intelligent transportation [2], and search and rescue [3]. However, most target detection models are designed based on natural scene image datasets, and there are significant differences between natural scene images and drone aerial images. This makes it a meaningful and challenging task to design a target detection model specifically suitable from the aerial drone perspective.
In practical application scenarios, real-time target detection of the unmanned aerial vehicle (UAV) aerial video stream places a high demand on the detection speed of the algorithm model. Furthermore, unlike natural scene images, due to the high altitude of UAV flights and the existence of a large number of small targets in aerial images, there are fewer extractable features for these targets. In addition, the UAVs actual flight altitude often varies greatly, leading to drastic changes in object proportions and a low detection accuracy. Finally, complex scenes are often encountered during actual flight shooting, and there may be a large amount of occlusion between densely packed small targets, making them easily obscured by other objects or the background. In general, generic feature extractors [4,5,6] downsample the feature maps to reduce spatial redundancy and noise while learning high-dimensional features. However, this processing inevitably leads to the representation of small objects being eliminated. Additionally, in real-world scenarios, the background exhibits diversity and complexity, characterized by various textures and colors. Consequently, small objects tend to be easily confounded with these background elements, resulting in an increased difficulty of their detection. In summary, there is a need to design a real-time target detection model for UAV aerial photography that is suitable for dense small target scenarios in order to meet practical application requirements.
Object detection algorithms based on neural networks can generally be divided into two categories: two-stage detectors and one-stage detectors. Two-stage detection methods [7,8,9] first use region proposal networks (RPNs) to extract object regions, and then detection heads use region features as input for further classification and localization. In contrast, one-stage methods directly generate anchor priors on the feature map and then predict classification scores and coordinates. One-stage detectors have a higher computational efficiency but often lag behind in accuracy. In recent years, the YOLO series of detection methods has been widely used in object detection of UAV aerial images due to their fast inference speeds and good detection accuracies. YOLOv1 [10] was the first YOLO algorithm, and subsequent one-stage detection algorithms based on its improvements mainly include YOLOv2 [11], YOLOv3 [12], YOLOv4 [13], YOLOv5 [14], YOLOx [15], YOLOv6 [16], YOLOv7 [17], and YOLOv8 [18]. YOLO algorithms directly regress the coordinates and categories of objects, and this end-to-end detection approach significantly improves the detection speed without sacrificing much accuracy, which meets the basic requirements of real-time object detection for unmanned systems.
Previous improvement methods for target detection in UAV aerial images can be categorized into three types: (i) utilizing more shallow feature information, such as adding small target detection layers [19]; (ii) enhancing the feature extraction capability of the target detection network, such as improving the Neck network [20] or introducing attention mechanisms [21]; and (iii) increasing input feature information, such as generating higher resolution images [22], image copying [23], and image cropping [24,25].
Taking into consideration the aforementioned discussion, we propose a high-precision real-time algorithm, namely YOLOv7-UAV, for aerial image detection in unmanned aerial vehicles (UAVs). In summary, the contributions of this paper are as follows:
(1) We have optimized the overall architecture of the YOLOv7 model by removing the second downsampling layer and introducing an innovative approach to eliminate its final neck and detection head. This modification significantly enhances the utilization efficiency of the detection model in capturing shallow-level information.
(2) We present the DpSPPF module as an alternative to the SPPF module. It replaces the original max pooling layers with a concatenation of smaller-sized max pooling layers and depth-wise separable convolutions. This design choice enables a more detailed extraction of feature information at different scales.
(3) We propose the binary K-means anchor generation algorithm, which avoids the problem of local optimal solutions and increases the focus on sparse-sized targets by reasonably dividing the anchor generation range into intervals and assigning different numbers of anchors that need to be generated in each interval.
(4) Extensive experiments were conducted on both the VisDrone dataset and the TinyPerson dataset to validate the superiority of our proposed method over state-of-the-art real-time detection algorithms.

2. Related Work

2.1. YOLOv7

YOLOv7 is one of the most advanced single-stage object detection algorithms that satisfies both real time and high precision requirements. YOLOv7 incorporates several trainable bag-of-freebies, which can significantly enhance the detection accuracy without increasing the inference cost. It uses the “ex-tend” and “compound scaling” methods to improve the utilization of parameters and computational resources. YOLOv7 also incorporates improved re-parametrization modules and label assignment strategies. The YOLOv7 model is mainly composed of three parts: a backbone network (Backbone), a bottleneck layer network (Neck), and a detection network (Head). The backbone network includes standard convolutional layers, max pooling layers, Extended Efficient Layer Aggregation Networks (ELAN) modules, and SPPCSPC modules. The backbone network performs feature extraction, where the ELAN module increases the cardinality of newly added features using group convolution without altering the original gradient propagation path. It merges features from different groups by mixing and merging their cardinalities, which enhances the learned features from different feature maps and improves the usage of parameters and computations. The SPPCSPC module performs feature extraction through max-pooling with different pooling kernel sizes, which expands the model’s receptive field. To fuse feature information on different scales, the neck uses three different sized feature maps extracted from the backbone for feature fusion. This part still uses the PANet [26]structure based on FPN, which adds channels from shallow to deep networks. The model’s head can be viewed as the YOLOv7 classifier and regressor.
However, the YOLOv7 algorithm was not specifically designed to address small object datasets so it cannot be directly applied to the detection of aerial images from unmanned aerial vehicles (UAVs).

2.2. Spatial Pyramid Pooling

Spatial pyramid pooling (SPP) was proposed by Kaiming He et al. [27]. It aggregates features of different sizes by using pooling layers of different scales and produces an output with a fixed size. In the YOLO series, YOLOv4 was the first to incorporate the SPP structure. YOLOv5 replaced the three parallel maximum pooling layers in SPP with three concatenated maximum pooling layers of smaller sizes to obtain Spatial Pyramid Pooling-Fast (SPPF). The impacts of SPPF and SPP on neural network output results are nearly identical, but SPPF has a faster processing speed. YOLOv7 uses the SPPCSPC module, which is a fusion of SPP and CSPNet [28] modules. Compared to the SPP module, the SPPCSPC module can extract richer feature information, but it has a higher number of parameters and a higher computational complexity.

2.3. Anchor Generation Algorithm

Anchors were first introduced in Fast-RCNN as pre-defined bounding boxes that are used to label regions in an image that may contain objects. It aids in the precise and efficient localization of targets for object detection algorithms. During detection, anchor-based object detection models adjust the size of anchors and filter them to obtain the final predicted boxes. In the past, there have been two main approaches to obtaining anchors: one involves manual design, while the other involves clustering algorithms such as K-means and K-means++. In the YOLO series, the anchor mechanism was first introduced in YOLOv2. YOLOv3, YOLOv4, YOLOv5, and YOLOv7 object detection models employ a genetic algorithm to refine the anchor generated by the K-means algorithm.

2.4. Bounding Box Regression Loss Function

The bounding box regression loss function is an important component in object detection tasks which measures the difference between predicted detection boxes and true boxes. In early object detection methods, the Mean Square Error (MSE) loss function was a common choice, which calculates the squared error between the predicted coordinates of the detection box and the true coordinates of the box. However, the MSE loss function is highly sensitive to outliers. To address this issue, Fast R-CNN introduced the Smooth L1 loss function, which uses a square function when the error is small and a linear function when the error is large, while also possessing robustness.
IoU Loss is a loss function based on intersection over union (IoU), which optimizes the model by minimizing the IoU distance between the detection box and the true box, thereby more directly considering the degree of overlap between the detection boxes. GIoU Loss [29] is an improved version of IoU Loss, which not only considers the intersection and union of the two boxes but also considers the distance between their bounding boxes. Zhaohui Zheng et al. [30] proposed DIoU and CIoU. DIoU Loss is an improvement of GIoU Loss, which uses a more accurate distance metric in the calculation of the distance. CIoU Loss further considers the difference in aspect ratios based on DIou loss. Compared to CIoU Loss, EIoU Loss [31] directly considers the difference in length and width and SIoU Loss [32] adds considerations for the angle of the bounding box regression. Jinwang Wang et al. [33] pointed out that IoU is too sensitive to small object position deviations; thus, they designed an evaluation metric (nwd, normalized Gaussian Wasserstein distance) for small objects based on the Wasserstein distance.

3. Methods

3.1. YOLOv7-UAV

YOLOv7 is one of the most advanced single-stage object detection models, which comprises seven distinct versions: YOLOv7-tiny, YOLOv7, YOLOv7-X, YOLOv7-W6, YOLOv7-E6, YOLOv7-D6, and YOLOv7-E6E. Considering the trade-off between detection accuracy and speed, we selected the YOLOv7 model as the foundation for constructing the YOLOv7-UAV network architecture.
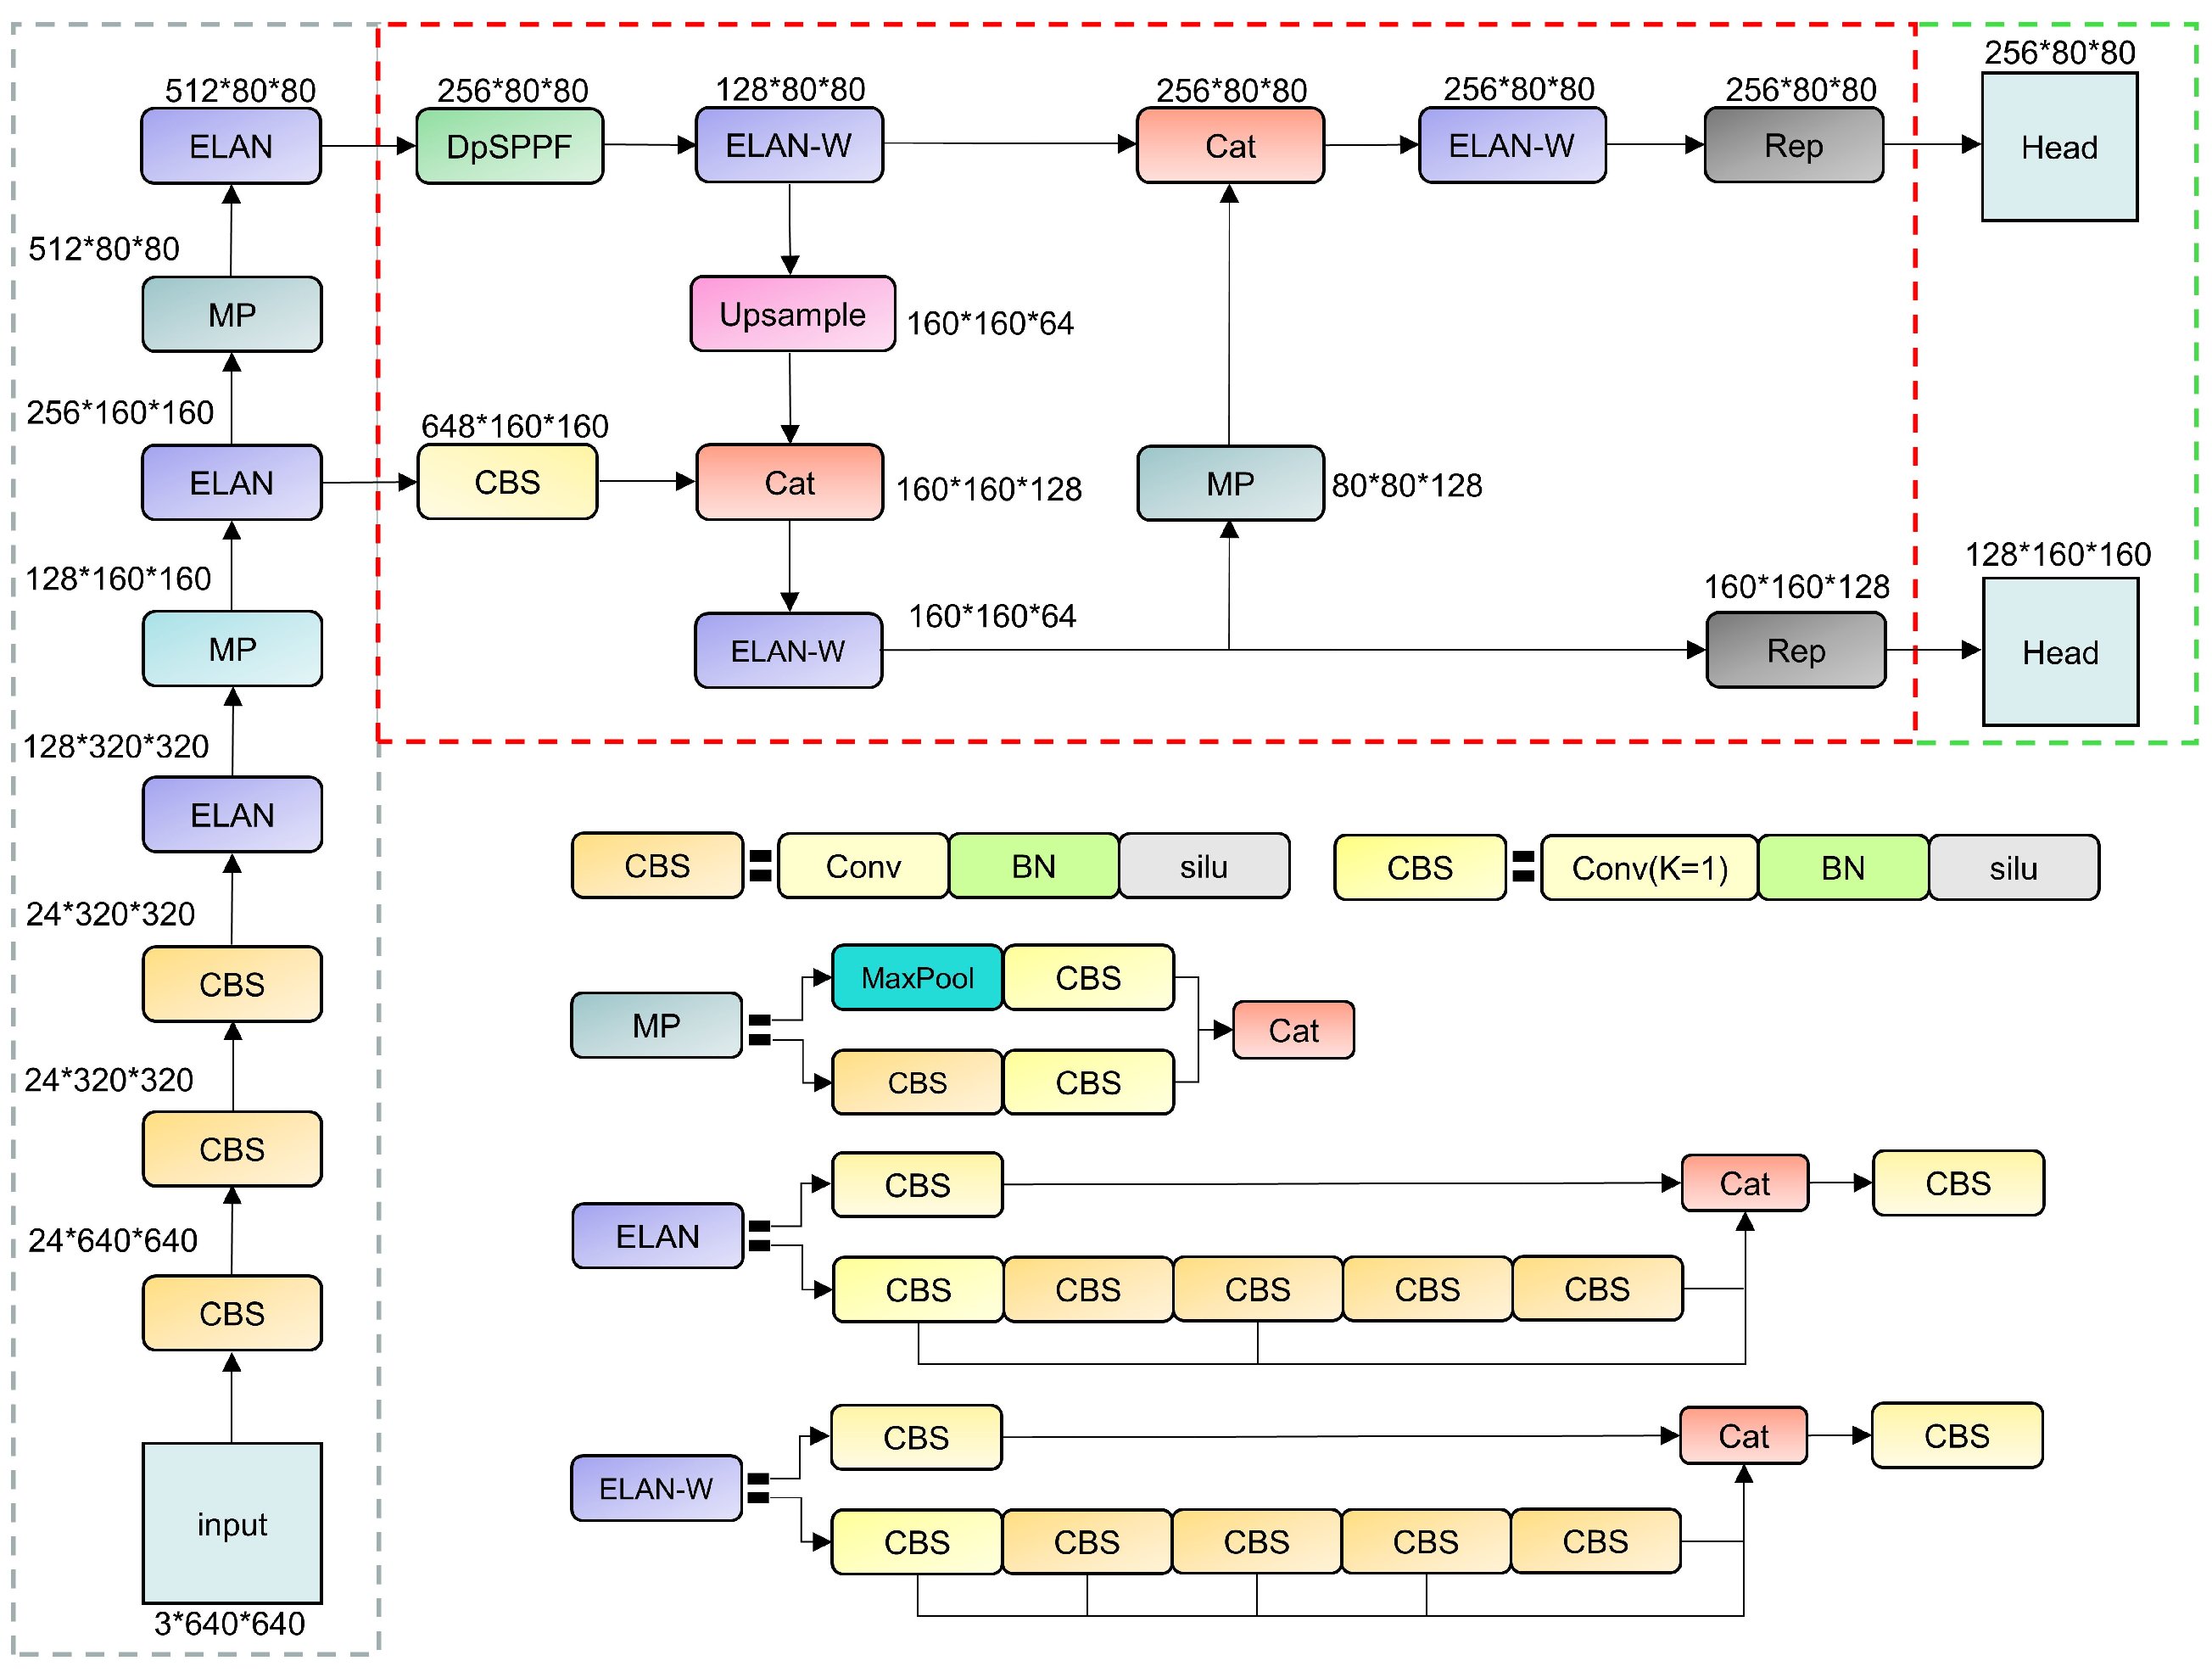
The overall structure of the YOLOv7-UAV model is illustrated in Figure 1, which differs from YOLOv7 in four aspects. In the following four subsections, we will introduce each of these four modifications separately in detail. It should be noted that in order to ensure a fair comparison, we performed an overall scaling of the channel numbers on the modified model to ensure the compared models had similar GFLOPs. The scaling of channel numbers is accomplished through the approach described in Equation (1). We denote the scaling factor for the portion of YOLOv7 that is located before the second downsampling layer as W 1 , and the scaling factor for the remaining portion as W 2 . The GFLOP calculation formula for the CNN neural network is shown in Equation (2). Removing the second downsampling layer in the YOLOv8 model results in a two-fold increase in the height and width of feature maps following the layer, leading to a significant rise in model GFLOPs. However, the model’s GFLOPs can be substantially reduced by reducing the number of feature map channels using a scaling factor W. Additionally, since removing the second downsampling layer does not affect the size of feature maps preceding it, different values of parameter W can be assigned to the the feature maps before and after the second downsampling layer. It is worth noting that the settings of W1 and W2 in this paper not only make the GFLOPs of the model similar before and after adjustment but also adhere to the ratio of GFLOPs between the second downsampling layer of the YOLOv7 model before and after the adjustment. Clearly, there are infinite combinations of W1 and W2 that satisfy this condition. However, due to experimental constraints, we only compared a few of them.
C 2 = C 1 × W 8 × 8
where C 1 and C 2 are the number of channels in a neural network layer before and after scaling, respectively.
GFLOPs = 2 H W k 2 C i C o
where H and W represent the height and width of the output feature map, k denotes the size of the convolutional kernel, and C i and C o correspond to the channel numbers of the input and output feature maps, respectively.

3.1.1. Reducing the Receptive Field of YOLOv7

We removed the second downsampling layer in YOLOv7 in order to reduce the receptive field and mitigate the loss of fine-grained feature information caused by downsampling.
Despite the fact that deep-level feature information is beneficial for object classification, there exists a semantic gap between feature information extracted from different layers, and the overly large receptive field of deep networks is not conducive to detecting small objects. Thus, we removed the third detection head of the YOLOv7 model to enhance its utilization of fine-grained feature information. We then adjusted the model’s channel numbers by scaling them using W 1 = 0.75 and W 2 = 0.5.

3.1.2. Replacing SPPCSPC with DpSPPF

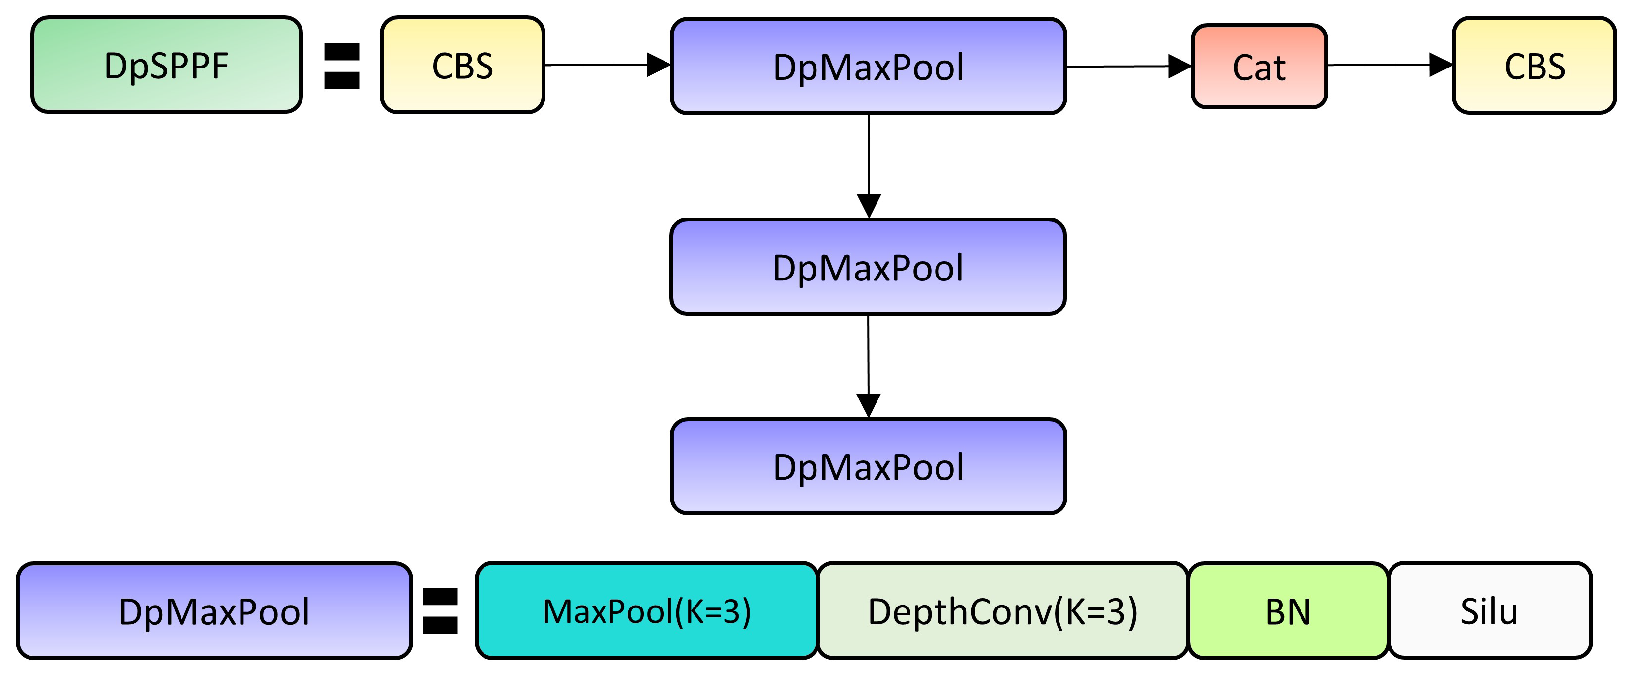
We believe that a large-sized maximum pooling layer will result in the loss of fine-grained feature information, which is detrimental to small object detection. Therefore, we proposed the DpSPPF moudle which replaces the maximum pooling layer (Kernel_size = 5) in the SPPF module with interconnected smaller depth-wise separable convolution (Kernel_size = 3) and max pooling layers (Kernel_size = 3). The structure of the DpSPPF module is illustrated in Figure 2. Subsequently, we incorporated the DpSPPF module into the deepest layer of the YOLOv7 model backbone that had undergone two modifications to aggregate the feature information of different scales.

3.1.3. Binary k-Means Anchor Generation Algorithm

In UAV-based image detection tasks, there exist targets of different sizes, and these targets are imbalanced in both the dataset and real-world scenarios. YOLOv7 initially generates anchors using the K-means algorithm and then applies the standard genetic algorithm to mutate these anchors based on their fitness, which is determined by the overlap between the generated anchors and the dimensions of all the targets in the training set. However, the k-means algorithm is highly influenced by initial points and outliers, which may result in the clustering results being only locally optimal. In addition, when the k-means algorithm is combined with the genetic algorithm in the anchor clustering process, it often focuses on samples with common sizes, while some samples with rare sizes may significantly deviate from the clustering results. To address these issues, we propose an improved anchor generation algorithm referred to as the “binary k-means anchor generation algorithm”.
The binary K-means prior anchor generation algorithm first obtains K cluster centers on the dataset using k-means and the genetic algorithm. Based on the width and height of the cluster anchor with the largest area, the algorithm divides the target size distribution interval for the dataset into three intervals to generate an anchor, requiring each region to generate at least one prior anchor. This helps the generated anchors to be closer to some rare sizes and reduces the probability of them becoming local optimal solutions. In addition, the algorithm determines the number of prior anchors to be generated in each interval based on the ratio between the number of cluster centers contained in each interval, so that more attention can be paid to samples with common sizes during the process of prior anchor generation. Its steps are shown in Algorithm 1.
The selection of a K value affects the degree of attention paid by the target detection algorithm to targets of different sizes, so the selection of a K value needs to be within an appropriate range. Through experiments in Section 3.1.2, we found that when generating six anchors on the VisDrone2019 dataset, as long as the value of K is within [11, 19], the effect of the binary K-means prior anchor generation algorithm is better than that of the K-means prior anchor generation algorithm. The default value of K for YOLOv7-UAV is 12, which was determined as the optimal value through testing on the VisDrone2019 dataset.
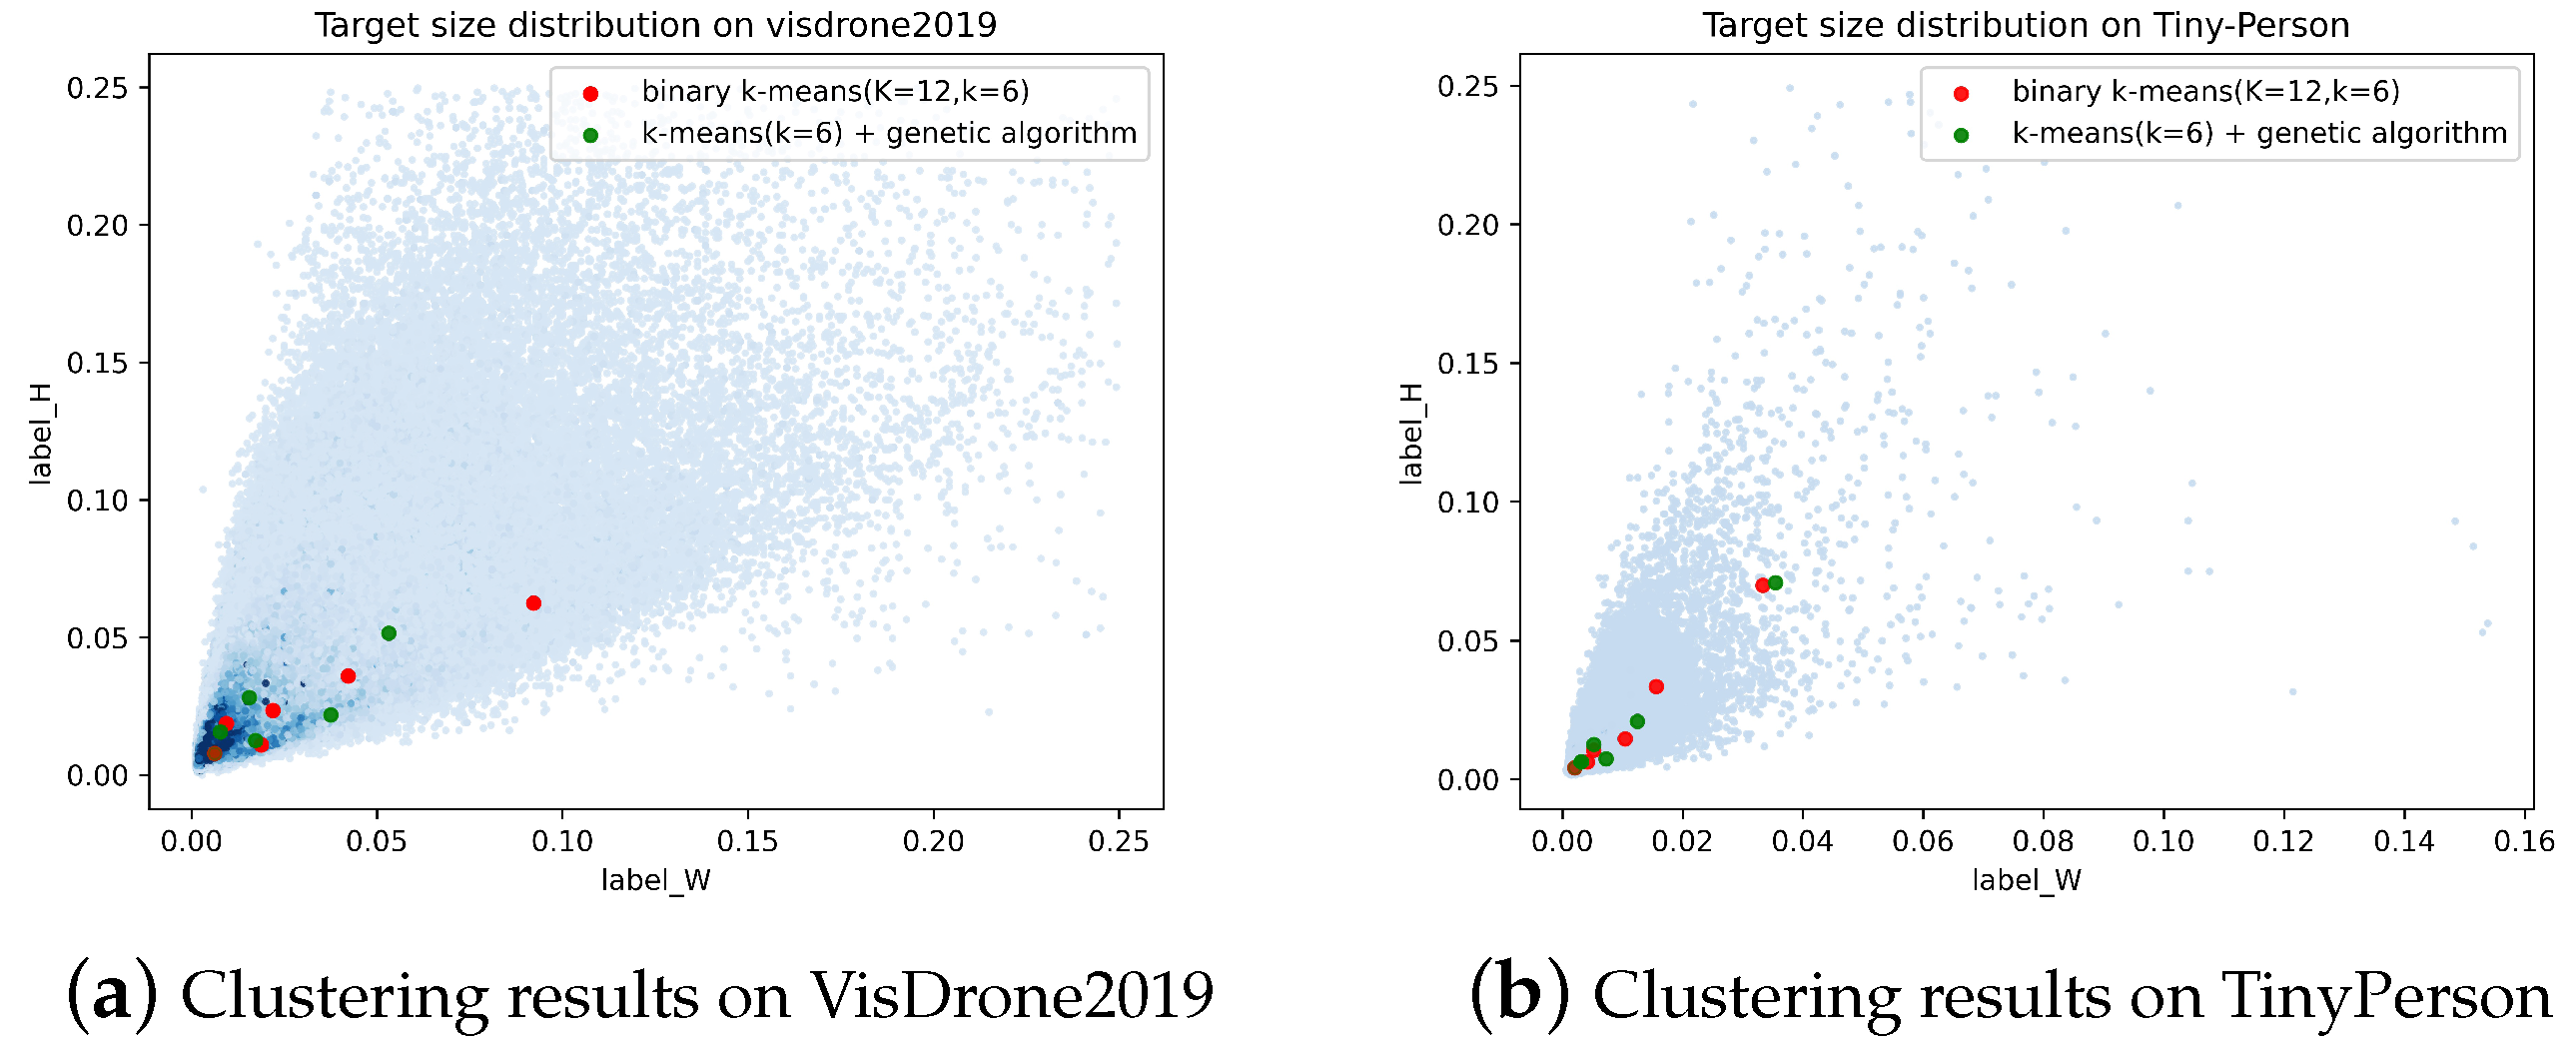
To illustrate more clearly the difference in clustering performance between the binary prior anchor generation algorithm and the approach that sequentially uses k-means and the genetic algorithm, we present in Figure 3a comparison of the two algorithms on the VisDrone2019 dataset and the TinyPerson dataset. From the figure, it can be observed that the anchors generated by the binary K-means prior box generation algorithm are more widely dispersed, yet they also place a greater emphasis on objects of common sizes.
Algorithm 1 Binary K-means anchor generation algorithm
Input:  T = [ ( w 1 , h 1 ) , ( w 2 , h 2 ) , ( w n , h n ) ] , K , k
  1: T: The object bounding box sizes collection of the dataset.
  2: n: The number of objects in the dataset.
  3: K: The number of clusters at the first cluster.
  4: k: The number of anchors needed.
Output:  a n c h o r = ( a 1 , a 2 , , a k )
  5: Consecutively using k-means and genetic algorithm to obtain K cluster centers on T,
      listed in ascending order by their respective areas as A 1 A K .
  6:  N 1 0 , N 2 0 , N 3 0 . N 1 , N 2 ,   a n d   N 3 represent the number of anchors allocated to
      each interval to generate anchor, initially set to 0
  7:  b ( A K [ 0 ] + A K [ 1 ] ) / 6 . It serves as the partition threshold for generating three
      intervals to generate anchor.
  8: for  i = 1 to K do
  9:       if  A i [ 0 ] < 2 b A i [ 1 ] < 2 b  then
10:           if  A i [ 0 ] < b A i [ 1 ] < b  then
11:               N 1 N 1 + 1
12:           else
13:               N 2 N 2 + 1
14:           end if
15:       else
16:            N 3 N 3 + 1
17:       end if
18: end for
19:  T 1 [ ] , T 2 [ ] , T 3 [ ] . T 1 , T 2 , T 3 represent the sets of object bounding box
      sizes within the three interval to generate anchor.
20: for  i = 1 to n do
21:       if  T [ i ] [ 0 ] < 2 b T [ i ] [ 1 ] < 2 b  then
22:           if  T [ i ] [ 0 ] < b T [ i ] [ 1 ] < b  then
23:               T 1 . a p p e n d ( T [ i ] )
24:           else
25:               T 2 . a p p e n d ( T [ i ] )
26:           end if
27:       else
28:            T 3 . a p p e n d ( T [ i ] )
29:       end if
30: end for
31: for  i = 1 to 3 do
32:       if  N i k / K < 1  then
33:            k i 1 , k k 1 , K K N i
34:       end if
35:       if  k i 1  then
36:            k i N i k / K + 0.5
37:            k k k i , K K N i
38:       end if
39: end for
40: Successively apply K-means and genetic algorithm for clustering on the
     T 1 ( k = k 1 ) , T 2 ( k = k 2 ) , and T 3 ( k = k 3 ) to get the anchor, respectively.

3.1.4. Nwd and Positive/Negative Sample Allocation Strategy

YOLOv7 determines the number of positive samples required (k) for each ground truth object by summing the top 10 IoU scores. The model then selects the top k samples with the smallest cost (the cost is the sum of the classification loss and the regression loss, added in a ratio of 1:3) for each ground truth object as positive samples. Due to the excessive sensitivity of the IoU to size deviations of small objects, this approach leads to an insufficient number of positive samples being assigned to small target ground truths during the training process of object detection networks.
The normalized Wasserstein distance (nwd) is a novel method for evaluating small object detection, which models the bounding boxes as two-dimensional Gaussian distributions and measures the similarity between predicted and ground truth objects, regardless of their overlap. The nwd is less affected by the scale of objects, making it particularly suitable for evaluating small objects. In YOLOv7’s positive/negative sample allocation strategy, we use the weighted nwd metric and IoU metric instead of the IoU metric. The IoU loss is retained, as it is more suitable for medium- to large-sized objects. The computation process of the nwd is shown in Equation (3). After experimental tuning, we set nwd:IoU = 0.5:0.5 for the TinyPerson dataset, and nwd:IoU = 0:1.0 for the VisDrone2019 dataset.
n w d N a , N b = exp W 2 2 N a , N b C
where C is a constant related to the dataset (we adopted the same setting of C = 12.8 as in the original paper [33]), W 2 2 N a , N b is a distance metric which is computed using Equation (4), and N a and N b are Gaussian distributions modeled by B a = ( x a , c a , w a , h a ) and B = ( x b , y b , w b , h b ) .
W 2 2 N a , N b = x a , y a , w a 2 , h a 2 T , x b , y b , w b 2 , h b 2 T 2 2

4. Experiments

4.1. Datasets and Evaluation Metrics

4.1.1. Datasets

The VisDrone2019 [34] dataset consists of a large number of annotated images captured by drones, with a total of 7019 images divided into 10 classes. The training and validation sets contain 6471 and 548 images, respectively. This dataset mainly contains small- and medium-sized targets.
The TinyPerson [35] dataset consists of 1610 images with a total of 72,651 annotated bounding boxes, mainly focusing on small objects. The images in this dataset were mainly captured by unmanned aerial vehicles and are categorized into two groups, namely sea_person and earth_person. The training and testing sets of the dataset comprise 794 and 816 images, respectively. There are a few annotation boxes in TinyPerson that can be ignored, including densely packed crowds that are difficult to separate, ambiguous regions, and shadow regions in water. These annotation boxes were replaced by the mean value of the image region in [35], and we simply ignore them.

4.1.2. Evaluation Metrics

We evaluated the performance of the object detection algorithm using four metrics, namely mean average precision (map), GFLOPs, Frames Per Second (FPS), and parameters. Map is computed using Equation (5), map0.5 denotes the map calculated at an IoU threshold of 0.5 and map(0.5:0.95) denotes the map scores across 10 IoU thresholds ranging from 0.5 to 0.95 with a step size of 0.05. GFLOPs can quantify the computational complexity of the model, parameter can measure the size of the model, and FPS represents the actual inference speed of the model.
m A P = n = 1 N 0 1 P ( R ) d R N
where N represents the total number of categories, P represents precision, and R represents recall.

4.2. Experimental Details

Unless otherwise stated, all experiments were performed with NVIDIA RTX3080ti GPU, a Linux operating system, Pytorch1.12.1, and cuda11.6.
In the experiment conducted on the TinyPerson dataset, we set the number of epochs, batch size, and image input dimensions to 150, 4, and 960 ∗ 960, respectively. In the experiment conducted on the VisDrone2019 dataset, we set the number of epochs, batch size, and image input dimensions to 300, 4, and 640 ∗ 640, respectively. The iteration numbers of the K-means algorithm and genetic algorithm were set to 30 and 1000, respectively. The object detection model was evaluated for FPS on the corresponding test set of the dataset on which it was trained.

4.3. Ablation Experiments

We have divided the construction process of YOLOv7-UAV into four steps: In step 1, we removed the second downsampling layer and the deepest detection head of YOLOv7. Then, we reduced the number of channels in the model using Equation (1) with weights W 1 = 0.75 and W 2 = 0.5 . In step 2, we introduced the DpSPP module. In step 3, we utilized the binary K-means anchor generation algorithm. In step 4, we used the weighted nwd and IoU instead of the IoU in the positive and negative sample allocation strategy. In the tables of each subsection in this chapter, the experimental settings highlighted in bold will serve as the baseline for the subsequent subsection.
Table 1 and Table 2 illustrate the changes in the performance of the object detection model during the construction process of YOLOv7-UAV on the VisDrone2019 and TinyPerson datasets, respectively. The results shown in these two tables indicate that each step of improvement we made to YOLOv7 was effective. In the following four sections, we will further introduce the ablation experiments conducted for each step and compare YOLOv7-UAV with other advanced object detection algorithms. Due to the presence of a large number of intermediate-sized objects in VisDrone2019, we did not apply step 4 to the models trained on VisDrone2019.

4.3.1. Comparison of the Effects of Transforming the Model Structure

We present the impact of changes to the model architecture on the detection model in Table 3 and Table 4. In order to facilitate a fair comparison, we ensured that the experimental setups had similar GFLOP levels by adjusting the overall channel numbers of the models.
The comparative results of the first and third rows, as well as those of the second and fourth rows in both tables, demonstrate that reducing the detection head located at the deepest position of YOLOv7 not only significantly increases the speed of model detection, but also greatly improves the accuracy of detecting unmanned aerial vehicle (UAV) images. The comparative results from the fifth to the seventh rows in both tables indicate that, in terms of both the detection speed and accuracy, the DpSPPF module achieves the best performance compared to the popular SPPF and SPPCSPC modules. The experimental setup in the seventh row of both tables corresponds to step 2 as described in Table 1 and Table 2.

4.3.2. The Impact of the K Value in the Binary k-Means Anchor Generation Algorithm

We conducted an empirical study on the impact of the choice of the K value in the first iteration of the binary K-means anchor generation algorithm on the performance of the object detection algorithm. The results, as shown in Table 5, indicate that as the value of K increases, the generated range of anchors tends to become larger. Furthermore, the binary K-means anchor generation algorithm performs better when the value of K falls within the range of [11, 19]. Specifically, the results in the table also indicate that the object detection algorithm achieves the highest map (0.5:0.95) with K = 12 (i.e., step 3 in Table 1 and Table 2).
In Table 6, we present the impact of the binary K-means anchor generation algorithm on several popular object detection models. For the object detection algorithm with nine anchors, we simply set K to 18 by taking 12 × K 1 / K 2 = 12 × 9 / 6 = 18 . As demonstrated in this table, all detection algorithms exhibited better performances on both datasets, indicating the excellent generalization ability of the binary K-means anchor generation algorithm.

4.3.3. The Impact of Different Weights of nwd and IoU

Table 7 presents the impact of using different weights of nwd and IoU in the positive–negative sample allocation strategy on the detection performance. The results in the table indicate that on the TinyPerson dataset, setting nwd:IoU = 0.5:0.5 (i.e., step 4 in Table 2) yields the best performance, while the VisDrone dataset, which contains a large number of medium-sized objects, does not require the use of the nwd.

4.3.4. Algorithm Comparison

The detection performance comparison of YOLOv7-UAV and other state-of-the-art real-time object detection algorithms on a UAV dataset is presented in Table 8. The algorithm tph-YOLOv5 in the table is specifically designed for detecting small targets in UAV imagery, while YOLOv8m-p2 is a version of YOLOv8 specifically designed for small object detection. The results indicate that YOLOv7-UAV outperforms its counterparts in both detection speed and accuracy.
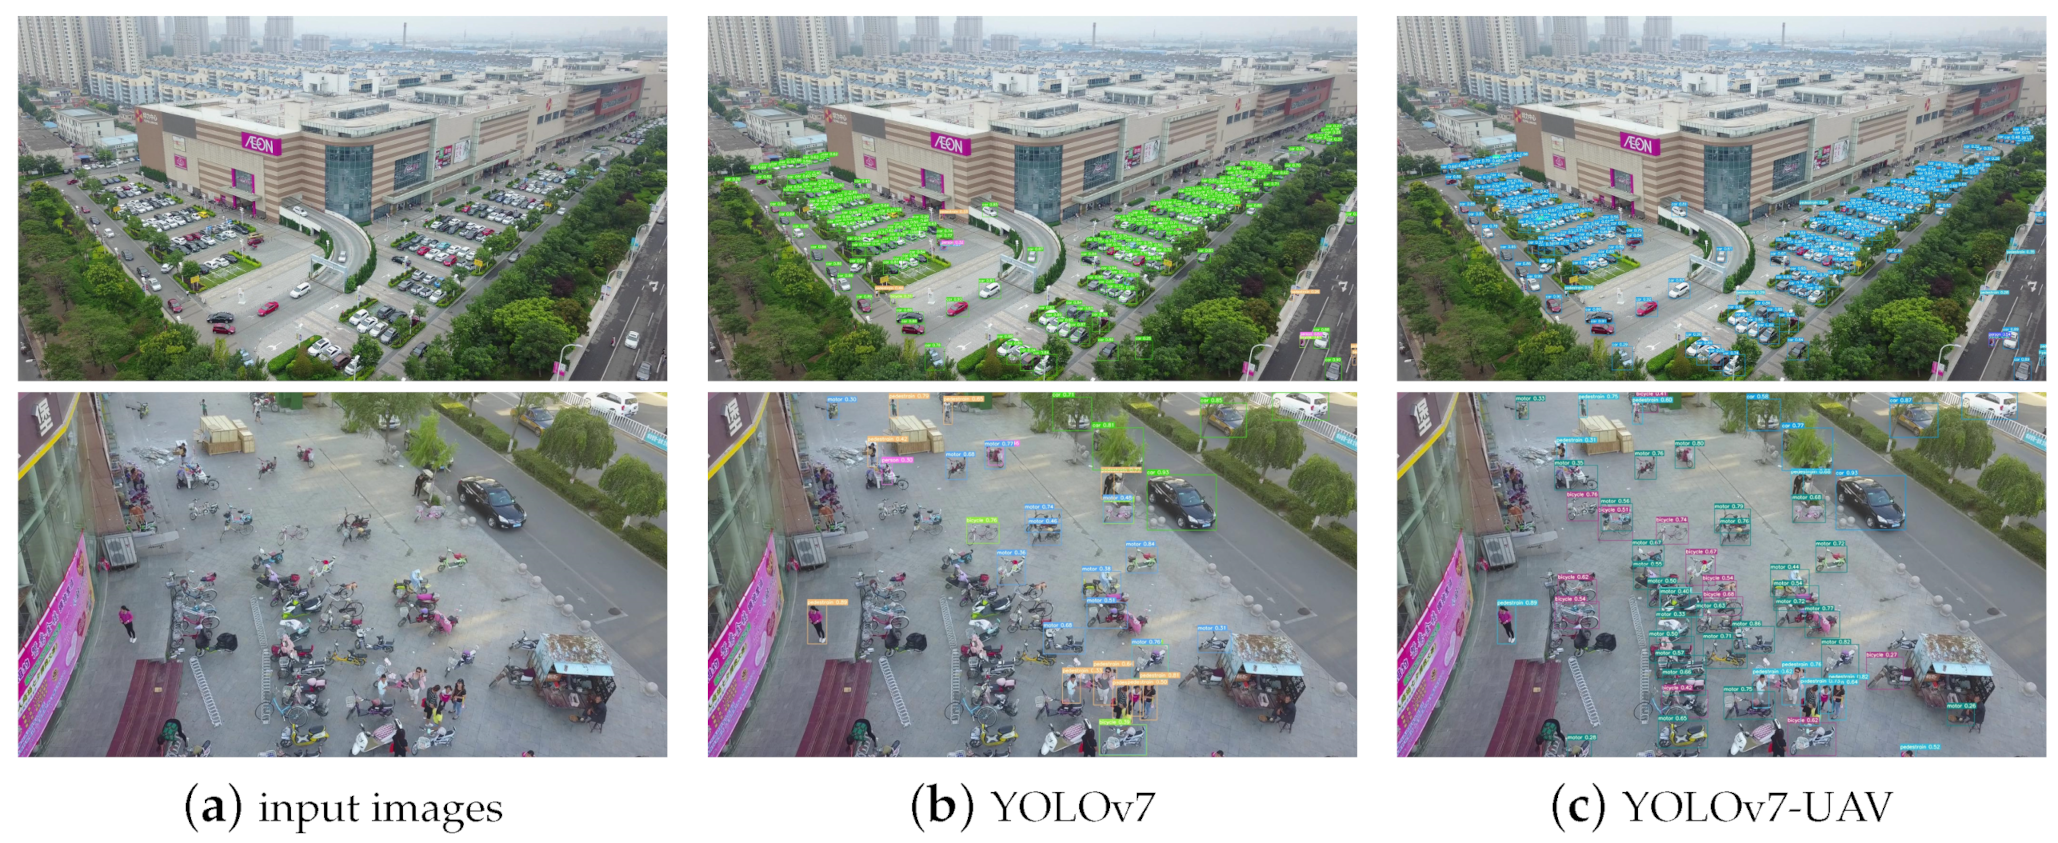
Figure 4 illustrates the detection results of YOLOv7 and YOLOv7-UAV. Both models were trained on the training set of the VisDrone2019 dataset. It can be observed that YOLOv7-UAV has a lower false negative rate and generally higher confidence levels compared to YOLOv7.

5. Conclusions

There exists a significant challenge for existing detection algorithms in detecting a large number of small targets with diverse shooting angles in unmanned aerial vehicle (UAV) images. This paper proposes an algorithm, YOLOv7-UAV, which can detect UAV images in real time. Firstly, the algorithm reduces the loss of feature information and improves the model’s utilization efficiency of fine-grained feature information by removing the second downsampling layer and the deepest detection head of the YOLOv7 model. Then, the algorithm replaces the maximum pooling layer in the SPPF module with concatenated smaller depth-wise separable convolution and maximum pooling layers, optimizing its ability to extract fine-grained feature information while retaining the ability to aggregate multi-scale feature information. Subsequently, the paper proposes a binary K-means anchor generation algorithm that reasonably divides the anchor box generation interval and retains a focus on common sizes to obtain better anchors. Finally, YOLOv7-UAV introduces the weighted nwd and IoU as evaluation metrics in the label assignment strategy on the TinyPerson dataset. Results on the VisDrone2019 and TinyPerson datasets demonstrate that YOLOv7-UAV outperforms most popular real-time detection algorithms in terms of the detection accuracy, detection speed, and memory consumption.
Despite the excellent performance of our proposed method on the unmanned aerial vehicle object detection datasets, there are still some limitations. Specifically, the effectiveness of YOLOv7-UAV on low-power platforms, such as embedded devices, requires further testing and optimization. Moreover, the determination of the K value in the binary K-means anchor generation algorithm is solely based on experimental results, without a sufficient analysis of the factors influencing K. In real-world unmanned aerial vehicle tasks, adverse weather conditions such as fog and darkness may be encountered, which our method has not been specifically optimized for. Additionally, unmanned aerial vehicles can be equipped with camera systems that have a larger field of view (FOV), which introduces radial and barrel distortions that significantly impact the detection of small targets, an aspect that our proposed algorithm has not specifically addressed.
In future work, we plan to optimize the performance of YOLOv7-UAV on low-power platforms by employing model compression techniques such as model pruning and distillation. Moreover, we aim to improve the process of generating anchors using the binary K-means algorithm by directly determining an appropriate K value based on the distribution of data within the dataset and the receptive fields of the target detection model. We plan to incorporate advanced generative networks or construct more abundant datasets to enhance the performance of the YOLOv7-UAV algorithm in challenging environments such as those with dense fog or low light conditions. Additionally, we intend to investigate the rectification issues of wide-angle cameras and devise targeted data augmentation methods to enhance the detection performance of object detection algorithms on images captured with a larger FOV.
Author Contributions

Conceptualization, Y.Z. and T.Z.; data curation, Y.Z. and Z.Z.; methodology, Y.Z. and T.Z.; software, Y.Z. and T.Z.; formal analysis, Z.Z. and W.H.; validation, Y.Z. and T.Z.; visualization, Y.Z. and W.H.; writing—original draft preparation, Y.Z. and T.Z.; writing—review and editing, Y.Z. All authors have read and approved the final manuscript.

Funding

The work described in this paper was partially supported by the National Natural Science Foundation of China under Grant No. 61801277, the Shandong Provincial Natural Science Foundation under Grant No. ZR202211030011 and the Excellent Youth Innovation Team of Shandong Province Higher Education No. 2020KJN014.

Data Availability Statement

The data that support the findings of this study are available from the corresponding author upon reasonable request.

Acknowledgments

The authors thank the anonymous and editor reviewers for their critical comments and suggestions for improving the manuscript.

Conflicts of Interest

The authors declare that they have no known competing financial interests or personal relationships that could have appeared to influence the work reported in this paper.

References

  1. Zhao, J.; Zhang, X.; Yan, J.; Qiu, X.; Yao, X.; Tian, Y.; Zhu, Y.; Cao, W. A wheat spike detection method in UAV images based on improved YOLOv5. Remote Sens. 2021, 13, 3095. [Google Scholar] [CrossRef]
  2. El-Sayed, H.; Chaqfa, M.; Zeadally, S.; Puthal, D. A traffic-aware approach for enabling unmanned aerial vehicles (UAVs) in smart city scenarios. IEEE Access 2019, 7, 86297–86305. [Google Scholar] [CrossRef]
  3. Martinez-Alpiste, I.; Golcarenarenji, G.; Wang, Q.; Alcaraz-Calero, J.M. Search and rescue operation using UAVs: A case study. Expert Syst. Appl. 2021, 178, 114937. [Google Scholar] [CrossRef]
  4. Xie, S.; Girshick, R.; Dollár, P.; Tu, Z.; He, K. Aggregated residual transformations for deep neural networks. In Proceedings of the IEEE Conference on Computer Vision and Pattern Recognition, Honolulu, HI, USA, 21–26 July 2017; pp. 1492–1500. [Google Scholar]
  5. Howard, A.G.; Zhu, M.; Chen, B.; Kalenichenko, D.; Wang, W.; Weyand, T.; Andreetto, M.; Adam, H. Mobilenets: Efficient convolutional neural networks for mobile vision applications. arXiv 2017, arXiv:1704.04861. [Google Scholar]
  6. Gao, S.H.; Cheng, M.M.; Zhao, K.; Zhang, X.Y.; Yang, M.H.; Torr, P. Res2net: A new multi-scale backbone architecture. IEEE Trans. Pattern Anal. Mach. Intell. 2019, 43, 652–662. [Google Scholar] [CrossRef] [PubMed] [Green Version]
  7. Girshick, R. Fast r-cnn. In Proceedings of the IEEE International Conference on Computer Vision, Santiago, Chile, 7–13 December 2015; pp. 1440–1448. [Google Scholar]
  8. He, K.; Gkioxari, G.; Dollár, P.; Girshick, R. Mask r-cnn. In Proceedings of the IEEE International Conference on Computer Vision, Venice, Italy, 22–29 October 2017; pp. 2961–2969. [Google Scholar]
  9. Cai, Z.; Vasconcelos, N. Cascade r-cnn: Delving into high quality object detection. In Proceedings of the IEEE Conference on Computer Vision and Pattern Recognition, Salt Lake City, UT, USA, 18–22 June 2018; pp. 6154–6162. [Google Scholar]
  10. Redmon, J.; Divvala, S.; Girshick, R.; Farhadi, A. You only look once: Unified, real-time object detection. In Proceedings of the IEEE Conference on Computer Vision and Pattern Recognition, Las Vegas, NV, USA, 27–30 June 2016; pp. 779–788. [Google Scholar]
  11. Redmon, J.; Farhadi, A. YOLO9000: Better, faster, stronger. In Proceedings of the IEEE Conference on Computer Vision and Pattern Recognition, Honolulu, HI, USA, 21–26 July 2017; pp. 7263–7271. [Google Scholar]
  12. Redmon, J.; Farhadi, A. Yolov3: An incremental improvement. arXiv 2018, arXiv:1804.02767. [Google Scholar]
  13. Bochkovskiy, A.; Wang, C.Y.; Liao, H.Y.M. Yolov4: Optimal speed and accuracy of object detection. arXiv 2020, arXiv:2004.10934. [Google Scholar]
  14. Jocher, G.; Chaurasia, A.; Stoken, A.; Borovec, J.; Kwon, Y.; Fang, J.; Michael, K.; Montes, D.; Nadar, J.; Skalski, P.; et al. ultralytics/yolov5: v6. 1-tensorrt, tensorflow edge tpu and openvino export and inference. Zenodo 2022. [Google Scholar] [CrossRef]
  15. Ge, Z.; Liu, S.; Wang, F.; Li, Z.; Sun, J. Yolox: Exceeding yolo series in 2021. arXiv 2021, arXiv:2107.08430. [Google Scholar]
  16. Li, C.; Li, L.; Jiang, H.; Weng, K.; Geng, Y.; Li, L.; Ke, Z.; Li, Q.; Cheng, M.; Nie, W.; et al. YOLOv6: A single-stage object detection framework for industrial applications. arXiv 2022, arXiv:2209.02976. [Google Scholar]
  17. Wang, C.Y.; Bochkovskiy, A.; Liao, H.Y.M. YOLOv7: Trainable bag-of-freebies sets new state-of-the-art for real-time object detectors. In Proceedings of the IEEE/CVF Conference on Computer Vision and Pattern Recognition, Vancouver, BC, Canada, 18–22 June 2023; pp. 7464–7475. [Google Scholar]
  18. Jocher, G. Ultralytics YOLOv8: v6. Available online: https://github.com/ultralytics/ultralytics (accessed on 2 April 2023).
  19. Sun, W.; Dai, L.; Zhang, X.; Chang, P.; He, X. RSOD: Real-time small object detection algorithm in UAV-based traffic monitoring. Appl. Intell. 2021, 52, 8448–8463. [Google Scholar] [CrossRef]
  20. Qiu, Q.; Lau, D. Real-time detection of cracks in tiled sidewalks using YOLO-based method applied to unmanned aerial vehicle (UAV) images. Autom. Constr. 2023, 147, 104745. [Google Scholar] [CrossRef]
  21. Zhu, X.; Lyu, S.; Wang, X.; Zhao, Q. TPH-YOLOv5: Improved YOLOv5 based on transformer prediction head for object detection on drone-captured scenarios. In Proceedings of the IEEE/CVF International Conference on Computer Vision, Montreal, QC, Canada, 10–17 October 2021; pp. 2778–2788. [Google Scholar]
  22. Deng, S.; Li, S.; Xie, K.; Song, W.; Liao, X.; Hao, A.; Qin, H. A global-local self-adaptive network for drone-view object detection. IEEE Trans. Image Process. 2020, 30, 1556–1569. [Google Scholar] [CrossRef] [PubMed]
  23. Bai, Y.; Zhang, Y.; Ding, M.; Ghanem, B. Sod-mtgan: Small object detection via multi-task generative adversarial network. In Proceedings of the European Conference on Computer Vision (ECCV), Munich, Germany, 8–14 September 2018; pp. 206–221. [Google Scholar]
  24. Liao, J.; Piao, Y.; Su, J.; Cai, G.; Huang, X.; Chen, L.; Huang, Z.; Wu, Y. Unsupervised Cluster Guided Object Detection in Aerial Images. IEEE J. Sel. Top. Appl. Earth Obs. Remote Sens. 2021, 14, 11204–11216. [Google Scholar] [CrossRef]
  25. Akyon, F.C.; Altinuc, S.O.; Temizel, A. Slicing aided hyper inference and fine-tuning for small object detection. In Proceedings of the 2022 IEEE International Conference on Image Processing (ICIP), Bordeaux, France, 16–19 October 2022; pp. 966–970. [Google Scholar]
  26. Liu, S.; Qi, L.; Qin, H.; Shi, J.; Jia, J. Path aggregation network for instance segmentation. In Proceedings of the IEEE Conference on Computer Vision and Pattern Recognition, Salt Lake City, UT, USA, 18–22 June 2018; pp. 8759–8768. [Google Scholar]
  27. He, K.; Zhang, X.; Ren, S.; Sun, J. Spatial pyramid pooling in deep convolutional networks for visual recognition. IEEE Trans. Pattern Anal. Mach. Intell. 2015, 37, 1904–1916. [Google Scholar] [CrossRef] [PubMed] [Green Version]
  28. Wang, C.Y.; Liao, H.Y.M.; Wu, Y.H.; Chen, P.Y.; Hsieh, J.W.; Yeh, I.H. CSPNet: A new backbone that can enhance learning capability of CNN. In Proceedings of the IEEE/CVF Conference on Computer Vision and Pattern Recognition Workshops, Seattle, WA, USA, 14–19 June 2020; pp. 390–391. [Google Scholar]
  29. Rezatofighi, H.; Tsoi, N.; Gwak, J.; Sadeghian, A.; Reid, I.; Savarese, S. Generalized intersection over union: A metric and a loss for bounding box regression. In Proceedings of the IEEE/CVF Conference on Computer Vision and Pattern Recognition, Long Beach, CA, USA, 15–20 June 2019; pp. 658–666. [Google Scholar]
  30. Zheng, Z.; Wang, P.; Liu, W.; Li, J.; Ye, R.; Ren, D. Distance-IoU loss: Faster and better learning for bounding box regression. In Proceedings of the AAAI Conference on Artificial Intelligence, New York, NY, USA, 7–12 February 2020; Volume 34, pp. 12993–13000. [Google Scholar]
  31. Zhang, Y.F.; Ren, W.; Zhang, Z.; Jia, Z.; Wang, L.; Tan, T. Focal and efficient IOU loss for accurate bounding box regression. Neurocomputing 2022, 506, 146–157. [Google Scholar] [CrossRef]
  32. Gevorgyan, Z. SIoU loss: More powerful learning for bounding box regression. arXiv 2022, arXiv:2205.12740. [Google Scholar]
  33. Wang, J.; Xu, C.; Yang, W.; Yu, L. A normalized Gaussian Wasserstein distance for tiny object detection. arXiv 2021, arXiv:2110.13389. [Google Scholar]
  34. Du, D.; Zhu, P.; Wen, L.; Bian, X.; Lin, H.; Hu, Q.; Peng, T.; Zheng, J.; Wang, X.; Zhang, L.; et al. The Vision Meets Drone Object Detection in Image Challenge Results. In Proceedings of the 2019 IEEE/CVF International Conference on Computer Vision Workshop (ICCVW), Seoul, Republic of Korea, 27–28 October 2019; pp. 213–226. [Google Scholar]
  35. Yu, X.; Gong, Y.; Jiang, N.; Ye, Q.; Han, Z. Scale match for tiny person detection. In Proceedings of the IEEE/CVF Winter Conference on Applications of Computer Vision, Snowmass Village, CO, USA, 1–5 March 2020; pp. 1257–1265. [Google Scholar]
Figure 1. Structure of YOLOv7-UAV.
Electronics 12 03141 g001
Figure 2. Structure of DpSPPF.
Electronics 12 03141 g002
Figure 3. Comparison of clustering results between the binary k-means anchor generation algorithm with the approach that sequentially uses k-means and a genetic algorithm. (The ‘k’ and ‘K’ represent the number of anchors to be generated and the number of clusters in the first clustering step of the binary K-means prior box generation algorithm, respectively. The graph’s coordinate points are indicative of the size of the targets, with a darker shade of blue indicating a higher number of targets represented).
Electronics 12 03141 g003
Figure 4. The detection results of YOLOv7 and YOLOv7-UAV (the sample images are all from the testing set of the VisDrone2019 dataset).
Electronics 12 03141 g004
Table 1. Impact of each step evaluated on VisDrone2019.
Stepsmap(0.5:0.95)map0.5FPSGFLOPs
YOLOv727.79%48.94%70103.3
Step 129.74%51.24%8972.5
Step 230.38%51.94%8776.8
Step 330.68%52.21%8976.8
Table 2. Impact of each step evaluated on TinyPerson.
Stepsmap(0.5:0.95)map0.5FPS
YOLOv71.74%7.12%64
Step 14.98%16.98%90
Step 25.18%17.67%86
Step 35.40%18.27%86
Step 46.04%20.56%86
Table 3. Impact of changes in the YOLOv7s architecture evaluated on VisDrone2019 (‘dsp’ refers to the second downsampling layer).
Change W 1 , W 2 map(0.5:0.95)map0.5FPSGFLOPsParams/M
-dsp1.0, 0.530.68%52.19%6799.89.18
-dsp-head0.825, 0.5530.74%52.42%8796.13.49
-dsp0.87, 0.43530.04%51.50%7179.87.06
-dsp-head0.75, 0.529.74%51.24%8972.52.74
-dsp-head+sppf0.75, 0.530.03%51.44%8776.83.07
-dsp-head+sppcspc0.75, 0.530.35%51.92%8496.04.57
-dsp-head+dpsppf0.75, 0.530.38%51.94%8776.83.07
Table 4. Impact of changes in the YOLOv7s architecture evaluated on TinyPerson (‘dsp’ refers to the second downsampling layer).
Change W 1 , W 2 map(0.5:0.95)map0.5FPS
-dsp1.0, 0.54.09%14.75%57
-dsp-head0.825, 0.555.09%17.15%80
-dsp0.87, 0.4353.45%12.21%58
-dsp-head0.75, 0.54.98%16.98%90
-dsp-head+sppf0.75, 0.54.97%17.15%88
-dsp-head+sppcspc0.75, 0.54.81%16.65%85
-dsp-head+dpsppf0.75, 0.55.18%17.67%86
Table 5. The impact of the K value in the binary k-means anchor generation algorithm on VisDrone2019.
K = ?map(0.5:0.95)Anchor
step 230.38%[4,5, 5,10, 11,8, 10,18, 24,14, 34,33]
1030.22%[4,5, 5,9, 12,11, 14,24, 25,14, 45,32]
1130.60%[4,5, 6,12, 11,7, 14,15, 27,22, 57,39]
1230.68%[4,5, 6,12, 12,7, 14,15, 27,23, 59,40]
1330.61%[4,5, 6,12, 12,8, 15,16, 31,24, 64,43]
1430.58%[4,5, 6,12, 13,8, 16,17, 34,26, 69,46]
1530.47%[4,5, 7,12, 14,8, 19,19, 41,30, 78,51]
1730.48%[4,5, 7,12, 14,8, 19,20, 42,31, 85,55]
1930.39%[4,6, 12,8, 8,15, 22,20, 48,34, 91,56]
Table 6. Impact of the binary K-means anchor generation algorithm on several detection models.
DatasetModelmap(0.5:0.95)Binary K-Means Anchor
VisDroneYOLOv5-l+0.84%[3,5, 7,7, 8,15, 17,9, 20,20, 42,20, 23,42, 45,40, 80,52]
YOLOv7+0.26%[3,5, 7,7, 8,15, 17,9, 20,20, 42,20, 23,42, 45,40, 80,52]
Step2+0.30%[4,5, 6,12, 12,7, 14,15, 27,23, 59,40]
TinyPersonYOLOv5-l+0.11%[2,3, 3,6, 5,5, 4,9, 8,9, 7,16, 15,18, 20,40, 38,81]
YOLOv7+0.19%[2,3, 3,6, 5,5, 4,9, 8,9, 7,16, 15,18, 20,40, 38,81]
Step2+0.22%[2,4, 4,6, 5,10, 10,14, 15,32, 32,67]
Table 7. Impact of using different weights of nwd and IoU.
Datasetnwd:IoUmap(0.5:0.95)map0.5
VisDrone0:130.68%52.21%
0.05:0.95−0.02%−0.18%
0.1:0.9−0.02%−0.27%
0.2:0.8−0.44%−0.28%
TinyPerson0:15.40%18.27%
0.2:0.8+0.18%+0.61%
0.35:0.65+0.28%1.14%
0.5:0.5+0.64%+2.29%
0.65:0.35+0.45%+1.24%
0.8:0.2+0.31%+1.34%
Table 8. Performance of the YOLOv7-UAV algorithm and other object detection algorithms.
DatasetModelmap(0.5:0.95)map0.5FPSGFLOPsParameter/M
VisDroneYOLOv5l22.83%39.62%55107.846.16
YOLOv6m21.65%31.70%5682.034.24
tph-YOLOv527.63%46.39%32145.760.43
YOLOv727.79%48.94%70103.336.53
YOLOv827.88%45.25%73164.946.61
YOLOv8m-p229.76%48.29%6898.025.04
YOLOv7-UAV30.68%52.21%8976.83.07
TinyPersonYOLOv5l2.08%8.93%52107.746.11
YOLOv6m2.87%9.27%5182.034.23
tph-YOLOv52.33%9.57%34145.360.36
YOLOv71.74%7.12%64103.236.49
YOLOv84.73%14.4%68164.746.58
YOLOv8m-p25.81%17.87%6397.925.03
YOLOv7-UAV6.04%20.56%8676.73.07
Disclaimer/Publisher’s Note: The statements, opinions and data contained in all publications are solely those of the individual author(s) and contributor(s) and not of MDPI and/or the editor(s). MDPI and/or the editor(s) disclaim responsibility for any injury to people or property resulting from any ideas, methods, instructions or products referred to in the content.