Abstract
This paper introduces a state-of-the-art inverter–machine codesign methodology for achieving an energy-efficient electric drive system. The methodology is applied in an optimal design case study with the context of the latest trend in the 800 V system. To reduce the voltage rating, a three-level active neutral point clamped topology is utilized in the inverter design, incorporating silicon carbide technology for high-speed operation. This combination allows for efficient power conversion with reduced losses. In the machine design, the increased number of poles that can be achieved in the design phase, along with the utilization of high-speed switching frequencies, enables the development of more efficient machines. Based on the design of the experiment method, by optimizing the parameters of both the inverter and machine simultaneously, using a cosimulation model, the 7.7% of total energy loss during drive cycle operation can be improved.
1. Introduction
The increasing adoption of electric vehicles (EVs) has prompted extensive research on high-voltage electric drive systems, such as 800 V systems, in order to improve driving range and battery charging speed [1]. In [1], an 800 V system allows for a higher operating voltage limit for the motor compared to a conventional 400 V system, thus enabling high-speed operations and loss reduction due to lower current. However, this necessitates design adaptations to accommodate the increased voltage. Specifically, the power device of the inverter must be engineered to withstand an 800 V load, and as such, devices with a rated voltage of 1200 V are primarily employed to account for safety margins. The deployment of wide-bandgap (WBG) devices such as silicon carbide (SiC) and gallium nitride (GaN) provide distinct advantages in terms of enhancing the inverter efficiency and decreasing filter size under high-voltage conditions due to their superior breakdown voltage and diminished switching losses compared to silicon-based devices [2,3,4]. Moreover, the total harmonic distortion (THD) of the output voltage and current can be improved with a higher switching frequency, which notably boosts motor efficiency [5]. The multilevel topology of the inverter enables a decrease in the voltage level applied to each power device, which in turn allows for the utilization of a device with a voltage rating 650 V rather than one with 1200 V rating. This not only improves efficiency but is also effective in reducing THD [6]. Particularly, the active neutral point clamped (ANPC) inverter topology holds a notable advantage in terms of managing and balancing the losses of each device relative to the modulation technique when compared to the other multilevel topologies such as neutral point clamped (NPC) [7,8]. In the context of EV traction drives, interior permanent magnet synchronous machine (IPMSM) is widely used due to their impressive power density and efficiency, which has sparked numerous investigations into IPMSM design [9,10,11]. However, the interaction between the design variables of the inverter and those of the machine cannot be overlooked, particularly in applications involving high-speed operations. For example, determining the most efficient pulse width modulation (PWM) strategy is heavily influenced by machine parameters and main load conditions such as the load current, inductance of the machine, power factor and modulation index (MI) [12]. Therefore, it is essential to accurately interpret the main load conditions, identify the optimal machine design parameters, and evaluate the impact of an inverter PWM strategy while taking these factors into account. While substantial research has been conducted on energy-efficient design in each field of inverters and motors individually, studies integrating the design parameters of these two key components concurrently remain limited. This paper presents an integrated inverter–machine design methodology, considering the interactive aspect of traction drives in an 800 V system. Utilizing SiC devices and a three-level ANPC topology, the optimal switching frequency and PWM strategy are identified, and an enhanced machine design that aligns with the increased switching frequency is presented. Through the design of experiments (DOE), an energy-efficient design process that simultaneously considers both inverter and machine parameters is executed with an emphasis on the drive cycle under the worldwide harmonized light vehicles test cycle (WLTC) class 3. Additionally, the experimental results corresponding to the frequency and PWM strategies of the 3L-ANPC are dealt with by utilizing resistance and inductor loads. This approach promotes an integrated perspective that could significantly enhance overall system efficiency.
2. Energy Loss Consumption under Drive Cycle
The benchmark specification of the 800 V traction model is provided in Table 1. The inverter design employs a conventional two-level half-bridge topology, and the power device is comprised of Si-insulated gate bipolar mode transistors (IGBTs). Due to the thermal restrictions of the IGBTs, the switching frequency is set at 12 kHz. The machine design involves an IPMSM and utilizes a hairpin-type winding. This design enables enhanced power density, thanks to a higher fill factor within the slot compared to typical circular distributed windings [13]. To improve energy efficiency, the target is the minimization of total energy loss consumption during the WLTC class 3 cycle [14]. The WLTC has been adopted as a standard for measuring fuel economy in numerous countries beyond Europe, and it effectively reflects actual driving conditions and driver habits. Using this as a basis for designing electric drives can enhance energy reduction efforts by focusing on areas of more frequent usage. Based on the vehicle specifications outlined in Table 2, the torque–speed profile of the machine can be calculated from the vehicle speed profile. The general longitudinal vehicle dynamic model is shown in Figure 1. Using Equations (1)–(7), the vehicle profile is converted to the torque versus the speed profile of the IPMSM, where Fdrive, Fm, Fr, Fa, and Fc are the driving force, acceleration force, rolling resistive force, aerodynamic drag force, and climbing force, respectively.

Table 1.
Benchmark specifications of 800 V traction model.

Table 2.
Specifications of the vehicle.
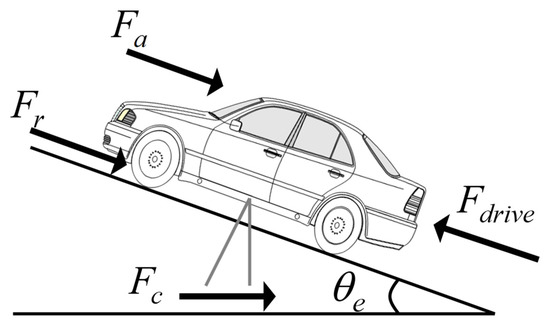
Figure 1.
Longitudinal dynamics of vehicle.
Figure 2 illustrates the machine profile that was transformed from the vehicle profile. When designing to minimize energy loss consumption, taking into account all operating points depicted by green dots in (b) is a complex task that demands considerable time and resources. Consequently, after partitioning the load point into several subregions, a representative point can be computed, where the sum of the energy of the load points in the subregion equals the energy value at a singular point [15]. The ten points, indicated by diamond shapes in (b), are the representative points calculated using Equations (8)–(10), where Ni denotes the quantity of points in the ith subregion, Emi signifies the energy of the ith region, and nmci and Tmci represent the speed and torque at the energy gravity center point, respectively. In this paper, with these ten representative points, the improved design is conducted and assessed.
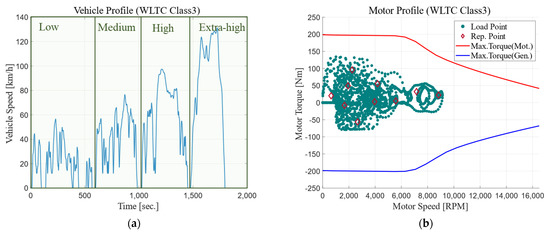
Figure 2.
WLTC class 3 driving cycle: (a) vehicle profile (time–speed); (b) traction drive profile (speed–torque); and representative operating points.
3. Design Improvements
A loss analysis was performed at ten representative operating points to calculate the total energy consumption and determine the optimal design using the cosimulation model depicted in Figure 3. Based on MATLAB Simulink R2022a, an inverter circuit analysis was conducted. For IPMSM design, a commercial FEA tool, JMAG, was employed. This tool facilitates the extraction of tabulated data such as copper loss, iron loss, magnet eddy current loss, as well as motor parameters like d-axis, q-axis inductance , and magnet flux , based on the phase current and phase angle . Employing these data, the and that minimize the combined loss of the inverter and motor could be calculated. Additionally, the desired voltage was computed by using the closed-loop feedback proportional–integral (PI) current control [16]. By implementing a PWM strategy, a gate signal that generates the corresponding voltage was created and applied to each power device. The JMAG-RT model was employed to reflect precise motor parameters according to the rotor position. This cosimulation model allows for the simultaneous consideration of inverter design variables, such as PWM strategy and switching frequency, as well as expanded machine design variables resulting from the utilization of WBG devices. The objective was to achieve a reduction in system energy consumption. Specifically, the use of WBG devices enables the utilization of higher switching frequencies, which in turn enables the design of machines with increased pole numbers, ultimately leading to the development of more efficient systems.
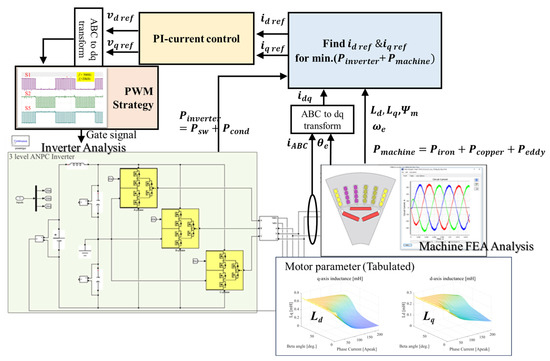
Figure 3.
Cosimulation model using MATLAB Simulink and JMAG FEA tool.
Figure 4 shows the process of design improvement. The initial design phase involves enhancing the motor design by increasing the number of poles, based on the inverter topology that utilizes WBG technology and a 3L-ANPC configuration. Subsequently, the optimization process employs the DOE method to achieve the optimal design. The detailed process is further elaborated on in Section 4.
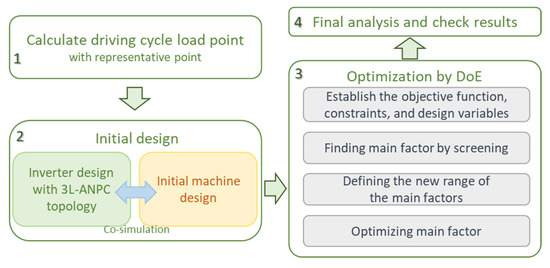
Figure 4.
Design process improvement with DOE.
3.1. Inverter Design with 3L-ANPC
By employing the 3L-ANPC topology, it is possible to reduce the voltage rating of the power device compared to the existing two-level inverter. Table 3 provides a brief specification of the power device used in this study. Among the various topologies of 3L-ANPC, this paper focuses on two specific configurations illustrated in Figure 5. In Figure 5a, an All-SiC topology is implemented where all cell elements are constructed using a SiC-metal-oxide-semiconductor field effect transistor (MOSFET) in one phase. On the other hand, Figure 5b represents a hybrid topology in which SiC is employed only in cells closer to the load, while the remaining cells utilize Si-IGBTs [17]. However, due to the multilevel structure, the Si-IGBT device utilized in this study has a voltage rating in the 600 V range. While an All-SiC topology could offer advantages in terms of overall efficiency, due to the SiC device’s low switching loss and high breakdown voltage characteristics, comparable performance can be achieved at a lower cost by employing a hybrid topology combined with a specific PWM strategy.
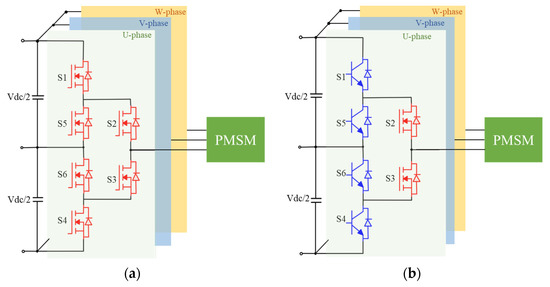
Figure 5.
Circuit schematic of 3L-ANPC inverter driving a 3-phase PMSM; (a) All-SiC topology (b) 4 Si-IGBT and 2 SiC-MOSFET hybrid topology.

Table 3.
Specifications of power device.
Table 3.
Specifications of power device.
| Topology | Device | Part No. | Vds (Vce)/Id (Ic) | Eon/Eoff |
|---|---|---|---|---|
| 2L-HB | Si-IGBT/Diode | Infineon-IKQ100N120CS7 [18] | 1200 V/126 A | 6.87 mJ/4.71 mJ |
| 3L-ANPC | Si-IGBT/Diode | Infineon-AIKQ120N60CT [19] | 600 V/120 A | 4.1 mJ/2.8 mJ |
| SiC-MOSFET | Wolfspeed-C3M0015065D [20] | 650 V/96 A | 1.5 mJ/0.7 mJ |
Among the various PWM strategies available, this paper focuses on two representative PWM strategies. Figure 6 illustrates the switching states and current flow when the power factor (PF) is 1, especially for the PWM1 strategies. As shown in Figure 6a, PWM1 involves current conduction being shared between the branches S5-S2 and S6-S3 during the zero-state. This sharing of conduction significantly reduces conduction losses, resulting in only one zero-state present during both the positive and negative half cycles. When conduction losses dominate, it leads to a reduction in total losses across the switching devices. However, during each half cycle, three out of the six switches operate at high switching frequencies. With high switching frequency, the PWM1 strategy is not well-suited for hybrid topology due to the high switching losses of Si-IGBTs. The corresponding switching sequences of the PWM1 strategy are presented in Table 4.
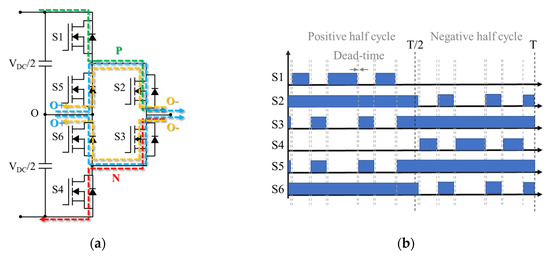
Figure 6.
All-SiC topology and PWM1 (a) schematics with current path and (b) switching state.

Table 4.
Switching sequence of PWM1 strategy.
In contrast, PWM2, shown in Figure 7, utilizes only two devices, S2 and S3, for high-frequency switching, while the remaining devices switch at the line frequency. However, during the zero-state, the current path is confined to one side, either S5-S2 or S6-S3, which may result in higher conduction losses compared to PWM1. As a result, PWM2 is suitable for reducing switching losses when switching losses are not dominant. The losses primarily concentrate on S2 and S3. Therefore, a hybrid topology that incorporates SiC exclusively for these two devices may be advantageous. Table 5 displays the switching sequence for the PWM2 strategy.
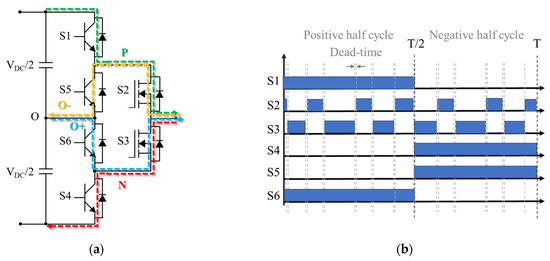
Figure 7.
Hybrid topology and PWM2 (a) schematics with current path and (b) switching state.

Table 5.
Switching sequence of PWM2 strategy.
To evaluate the losses, a cosimulation model is utilized, which integrates the machine FEA. The conduction loss is calculated based on the first quadrant voltage–current (V-I) characteristics of the device during the positive current phase, as described by Equations (11)–(13). Conversely, the negative phase follows the characteristics of the third quadrant or the body-diode or diode features. In Equations (11)–(13), I(θ) represents the current through the power devices, and Vce and Vf denote the initial saturation voltage drop in the IGBT and diode, respectively. Rce, Rf, and Rds refer to the on-state resistance of the IGBT, diode, and MOSFET, respectively.
The switching loss during turn-on and turn-off states is determined through simulation, considering external gate resistors and the voltage applied to the device, as expressed in Equations (15) and (16). Here, Eon,IGBT (I, T, VDC), Eoff,IGBT (I, T, VDC), Eon,MOS (I, T, VDC) and Eoff,MOS (I, T, VDC) represent the energy per unit in the switching on- and off-state of the IGBT and MOSFET. The data look-up table is employed to calculate the switching loss.
3.2. Machine Design with High Switching Frequency
The maximum permissible pole number is limited by the maximum speed and inverter switching frequency. To maintain control stability, particularly in extremely high-speed regions, the maximum feasible pole number np_max is defined in Equation (16). Here, Nmax represents the maximum operating speed, and mf denotes the frequency modulation index. With a high switching frequency, it becomes possible to design a greater number of poles, which can result in improved machine efficiency [21].
The number of series turns per phase, denoted as nT, can be determined using Equation (17). In this equation, Pmax represents the maximum power; is_max is the root-mean-square (rms) phase current at the base speed; kw1 signifies the fundamental harmonic winding factor; ωm denotes the mechanical base speed of the machine; and Bg, Dr, and lstk represent the air gap flux density, rotor outer diameter, and effective stack length, respectively. Hairpin winding technology offers several advantages, including increased power density and improved thermal performance, achieved through a high slot fill factor and reduced slot openings [22]. It is worth noting that in hairpin winding, the number of coils per slot must be even, which is one of its disadvantages. However, with higher inverter switching frequencies, it becomes possible to achieve a design with a greater pole number. Consequently, this expands the range of achievable turns per phase, as indicated by Equations (16) and (17).
4. Optimum Design with DOE
In the previous section, an initial improved design was developed, considering the mutual interaction between the inverter and the machine. By utilizing SiC-MOSFET, a high switching frequency can be achieved, enabling the creation of a 10-pole machine while maintaining controllability even at 16,500 rpm. With a combination of 10 poles and 60 slots, the number of series turns per phase is designed as 40 turns, as defined by Equation (17). The subsequent section focuses on the detailed optimization of the rotor and stator geometry. To optimize inverter and machine parameters simultaneously, the DOE method is employed. DOE serves as a robust statistical technique that enables researchers to evaluate the contribution of different parameters to the objective function. Its applicability for motor design optimization, particularly concerning geometric design, has been extensively studied [11,23].
4.1. Establish the Objective Function, Constraints, and Design Variables
The main objective function for optimization is minimizing 2 out of 10 representative points shown in Equation (18), exerting the most significant influence on the overall drive cycle loss:
- Load 1: 2185.2 rpm, 99.7 Nm for 106 s duration; low-speed, high-current.
- Load 2: 8537.4 rpm, 22.9 Nm for 136 s duration; high-speed, low-current.
The optimization process encompasses six geometric design variables for the machine and two variables for the inverter. Figure 8 presents the initial configuration and design variables for the machine. The design variables are initialized with a two-level range of low and high values, as specified in Table 6.
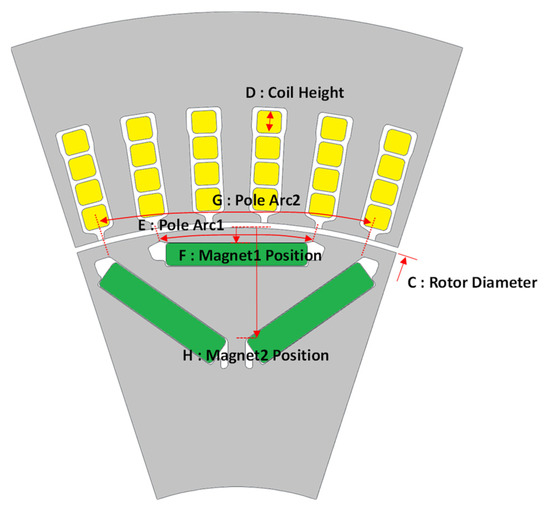
Figure 8.
Initial improved design of machine and design variables for machine geometry.

Table 6.
Design variables, initial value, and 2-level variation range.
The design constraints should not exceed the limitations imposed by the existing magnet usage and copper utilization, taking into account manufacturing constraints such as fill factor and cost considerations. Moreover, considering the thermal characteristics, the current density of the wire is kept within acceptable limits.
- Fixed pole/slot combination for noise and vibration characteristics.
- Fixed current density: the coil width is dependent on the coil height.
- Fixed slot fill factor (<58%) (defined by total bare copper area per slot area).
- Less weight of magnet and copper than the benchmark design (in Table 1).
4.2. Finding the Main Factor by Screening
Among the variables listed in Table 4, certain factors exhibit a substantial impact on the objective function, while others display minimal dependence. To minimize the number of experiments, a two-level, eight-factor fractional factorial design was employed in this study [24]. The objective function encompasses the total loss, comprising switching and conduction losses in the inverter, as well as copper, iron, and magnet eddy losses in the machine. By employing a 1/16 fractional factorial design, 2(8−4) experiments were conducted. The details of the fractional factorial design and the corresponding results are presented in Table 7. Figure 9 illustrates: (a) the effect of each factor on the loss at load1 and load2, and (b) Pareto charts for the loss at load1 and load2. The Pareto chart, shown in (b), combines the noneffective factors for analysis. For both load points, the most influential factors were identified as B: switching frequency, C: rotor diameter, and D: coil length as can be seen from the red box in Figure 9.

Table 7.
1/16 fractional factorial design and results.
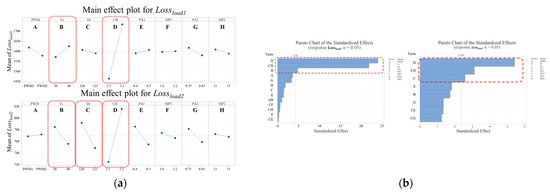
Figure 9.
(a) Main effect plot; (b) Pareto chart loss at load1 and load2.
4.3. Optimizing Main Factor
In this study, the optimization focuses on analyzing three key factors based on the results obtained from the fractional factorial design, while keeping the other factors fixed in a manner that minimizes the loss. Figure 10 illustrates the direction of optimization for factors B, C, and D by depicted red box. To further expand the range of the high level for factor C and the low level for factor D, the response surface method (RSM) was applied. A central composite design (CCD) was utilized, consisting of a total of 15 designs (23 + 1 + 3 × 2) [25]. The optimized values for the design parameters are presented in Table 8.
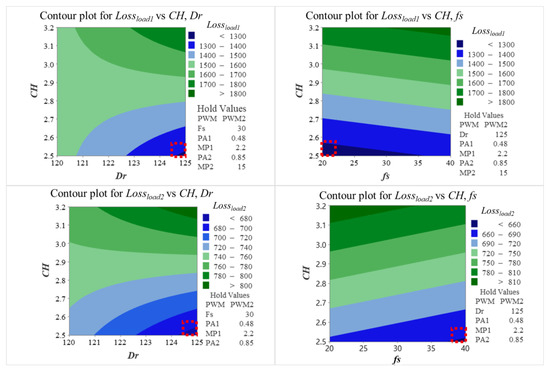
Figure 10.
Contour plot for loss at load1 and load3 vs. CH, Dr, fs; min. of CH, max. of Dr and another optimum point of fs indicates minimizing objective function.

Table 8.
Final optimized design value.
5. Experimental Work for Inverter
The experimental work aimed to compare the inverter losses and output current THD based on the PWM strategy and switching frequency using an equivalent R-L load. Figure 11 illustrates the configuration of a 3L-ANPC topology and control board, with tests conducted under varying operating conditions. Two load conditions were considered:
- High fundamental frequency and high voltage usage, representing the high-speed low-torque region: f1 = 800 Hz and a MI of 0.9;
- Another load condition representing relatively lower speed regions: f1 = 150 Hz and a MI of 0.5.
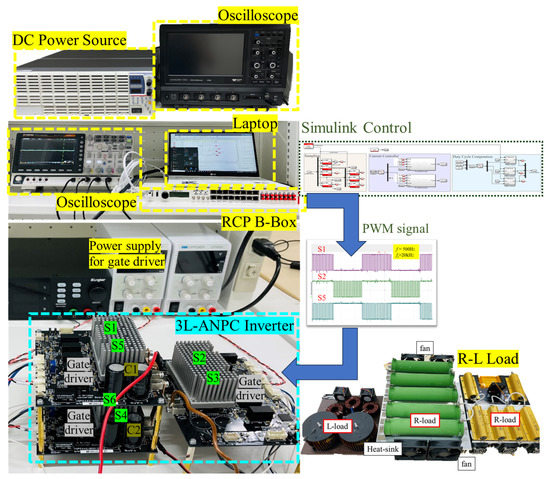
Figure 11.
Experimental set-up: 3L-ANPC with SiC-MOSFET module connected by rapid controller prototype; Imperix B-Box [26].
Figure 12a,b show the output voltage and current waveforms of the load at a switching frequency of 20 kHz. Additionally, Figure 13a presents the comparative results of inverter efficiency, considering the different PWM strategies at specific load points under two separate switching frequency conditions: 20 kHz and 40 kHz. From the illustration, it is observable that under the 800 Hz load condition, switching losses were predominantly higher, indicating an advantage for PWM2. Conversely, in the relatively high-current region of the low-speed condition, it is evident that the PWM1 strategy could reduce conduction losses, proving beneficial in this load condition. In Figure 13b, the current harmonics are depicted in the frequency domain using fast Fourier transform (FFT) for the high-speed region. This demonstrates that as the switching frequency increased, the harmonics associated with the switching component exhibited higher frequencies, resulting in a reduction in the overall THD. A high THD can lead to fluctuations in the current and flux flowing through the machine, particularly in the high-speed range. It is crucial to minimize the THD to mitigate losses and ensure stable operation in these conditions.
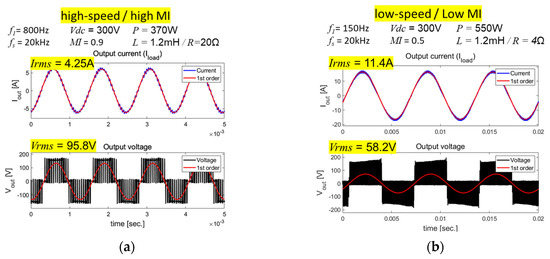
Figure 12.
Experimental results; output current and voltage waveform (a) at 800 Hz, 0.9 MI and (b) at 150 Hz, 0.5 MI.
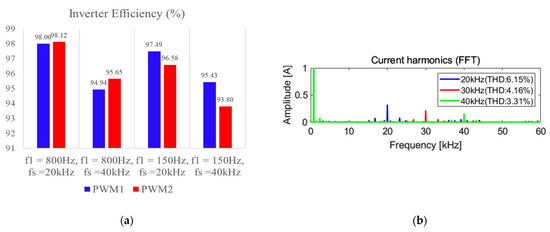
Figure 13.
Experimental results: (a) inverter efficiency depending on PWM strategy and switching frequency at both load points; (b) current harmonics analysis using FFT vs. switching frequency.
6. Total Energy Loss Improvement Results during Drive Cycle for Final Design
Using the optimized design, simulations are performed for 10 representative points. As can be seen in Table 9, by incorporating a hybrid topology 3L-ANPC with a combination of SiC-MOSFET and Si-IGBT, the total energy losses of the inverter can be reduced by 13.5%. Additionally, for the machine design, an energy improvement of 6.4% is attainable. As a result, a notable 7.7% reduction in total energy loss during the driving cycle is observed.

Table 9.
Comparison of energy loss consumption between original benchmark and improved design.
7. Conclusions
This paper presents a case study of an electric drive including an inverter and machine focused on a latest-generation 800 V EV traction system. Specifically, the study explores the impact of utilizing a 3L-ANPC topology and high switching frequency in the design of the 800 V system. These design choices significantly influence the machine design process, including parameters such as pole number and the number of series turns. Furthermore, the investigation delves into a hybrid topology and optimal PWM strategy, incorporating SiC-MOSFET and Si-IGBT as power devices. The design process takes into account both the inverter and machine parameters simultaneously, employing a cosimulation model. Additionally, a methodology for optimizing the geometry of the machine and inverter parameters is introduced. To establish a specific design objective, the WLTC class 3 cycle is utilized, enabling the transformation of the cycle into an electric drive profile based on the vehicle’s specifications. The simulation results showcase a notable 7.7% reduction in total energy loss, underscoring the effectiveness of the proposed approach. This approach holds promise for application in the design of various electric drives. In future studies, it is recommended to explore other optimization methods such as deep learning to enhance the design process further. Additionally, considering the influence of internal parasitic components can be beneficial for improving the accuracy of inverter loss prediction. Furthermore, it is worth noting that solutions involving another WBG material, GaN, can also be considered.
Author Contributions
Methodology, J.K. and A.C.; Formal analysis, J.K.; Data curation, J.K.; Writing—original draft, J.K.; Writing—review & editing, A.C.; Supervision, A.C.; Funding acquisition, A.C. All authors have read and agreed to the published version of the manuscript.
Funding
This research was funded by the Japanese Society for the Promotion of Science grant number Kakenhi (B) 20H02138.
Data Availability Statement
Not applicable.
Conflicts of Interest
The authors declare no conflict of interest.
References
- Aghabali, I.; Bauman, J.; Kollmeyer, P.J.; Wang, Y.; Bilgin, B.; Emadi, A. 800-V Electric Vehicle Powertrains: Review and Analysis of Benefits, Challenges, and Future Trends. IEEE Trans. Transp. Electrif. 2021, 7, 927–948. [Google Scholar] [CrossRef]
- Kumar, A.; Moradpour, M.; Losito, M.; Franke, W.-T.; Ramasamy, S.; Baccoli, R.; Gatto, G. Wide Band Gap Devices and Their Application in Power Electronics. Energies 2022, 15, 9172. [Google Scholar] [CrossRef]
- Umegami, H.; Harada, T.; Nakahara, K. Performance Comparison of Si IGBT and SiC MOSFET Power Module Driving IPMSM or IM under WLTC. World Electr. Veh. J. 2023, 14, 112. [Google Scholar] [CrossRef]
- Castellazzi, A.; Gurpinar, E.; Wang, Z.; Suliman Hussein, A.; Garcia Fernandez, P. Impact of Wide-Bandgap Technology on Renewable Energy and Smart-Grid Power Conversion Applications Including Storage. Energies 2019, 12, 4462. [Google Scholar] [CrossRef]
- Yunus, S.; Ming, W.; Ugalde-Loo, C.E. Efficiency Improvement Analysis of a SiC MOSFET-Based PMSM Drive System with Variable Switching Frequency. In Proceedings of the 2021 23rd European Conference on Power Electronics and Applications (EPE’21 ECCE Europe), Ghent, Belgium, 6–10 September 2021; pp. 1–9. [Google Scholar] [CrossRef]
- Schöner, C.; Derix, D.; Hensel, A. Comparison and Evaluation of Different Three-Level Inverter Topologies for PV Systems. In Proceedings of the 2014 16th European Conference on Power Electronics and Applications, Lappeenranta, Finland, 26–28 August 2014; pp. 1–10. [Google Scholar] [CrossRef]
- Jiao, Y.; Lee, F.C. New Modulation Scheme for Three-Level Active Neutral-Point-Clamped Converter with Loss and Stress Reduction. IEEE Trans. Ind. Electron. 2015, 62, 5468–5479. [Google Scholar] [CrossRef]
- Zhang, G.; Yang, Y.; Iannuzzo, F.; Li, K.; Blaabjerg, F.; Xu, H. Loss Distribution Analysis of Three-Level Active Neutral-Point-Clamped (3L-ANPC) Converter with Different PWM Strategies. In Proceedings of the 2016 IEEE 2nd Annual Southern Power Electronics Conference (SPEC), Auckland, New Zealand, 5–8 December 2016; pp. 1–6. [Google Scholar] [CrossRef]
- Shen, Q.; Zhou, Z.; Li, S.; Liao, X.; Wang, T.; He, X.; Zhang, J. Design and Analysis of the High-Speed Permanent Magnet Motors: A Review on the State of the Art. Machines 2022, 10, 549. [Google Scholar] [CrossRef]
- Tian, L.; Wu, L.; Huang, X.; Fang, Y. Driving Range Parametric Analysis of Electric Vehicles Driven by Interior Permanent Magnet Motors Considering Driving Cycles. CES Trans. Electr. Mach. Syst. 2019, 3, 377–381. [Google Scholar] [CrossRef]
- You, Y.-m.; Yoon, K.-y. Multi-Objective Optimization of Permanent Magnet Synchronous Motor for Electric Vehicle Considering Demagnetization. Appl. Sci. 2021, 11, 2159. [Google Scholar] [CrossRef]
- Kwak, J.; Castellazzi, A. Inverter-Machine Parametric Co-Design for Energy Efficient Electric Drives. In Proceedings of the 2022 24th European Conference on Power Electronics and Applications (EPE’22 ECCE Europe), Hanover, Germany, 5–9 September 2022; pp. 1–10. [Google Scholar]
- Park, H.-J.; Lim, M.-S. Design of High Power Density and High Efficiency Wound-Field Synchronous Motor for Electric Vehicle Traction. IEEE Access 2019, 7, 46677–46685. [Google Scholar] [CrossRef]
- Wei, D.; He, H.; Cao, J. Hybrid Electric Vehicle Electric Motors for Optimum Energy Efficiency: A Computationally Efficient Design. Energy 2020, 203, 117779. [Google Scholar] [CrossRef]
- United Nations: Economic and Social Council. Proposal for a New Global Technical Regulation on the Worldwide Harmonized Light Vehicles Test Procedure (WLTP). World Forum for Harmonization of Vehicle Regulations 162nd Session 2014. Available online: https://unece.org/DAM/trans/doc/2014/wp29/ECE-TRANS-WP29-2014-027e.pdf (accessed on 10 May 2023).
- Carpiuc, S.-C.; Lazar, C. Fast Real-Time Constrained Predictive Current Control in Permanent Magnet Synchronous Machine-Based Automotive Traction Drives. IEEE Trans. Transp. Electrif. 2015, 1, 326–335. [Google Scholar] [CrossRef]
- Feng, Z.; Zhang, X.; Yu, S.; Zhuang, J. Comparative Study of 2SiC&4Si Hybrid Configuration Schemes in ANPC Inverter. IEEE Access 2020, 8, 33934–33943. [Google Scholar] [CrossRef]
- Infineon Technology. IKQ100N120CS7 [Datasheet]. Available online: https://www.infineon.com/dgdl/Infineon-IKQ120N120CS7-DataSheet-v01_10-EN.pdf?fileId=8ac78c8c850f4bee0185a59a0dcd7867 (accessed on 15 June 2023).
- Infineon Technology. IKQ120N60T [Datasheet]. Available online: https://www.infineon.com/dgdl/Infineon-IKQ120N60T-DS-v02_03-EN.pdf?fileId=5546d46249cd10140149d230bd094df7 (accessed on 15 June 2023).
- Wolfspeed. C3M0015065D [Datasheet]. Available online: https://assets.wolfspeed.com/uploads/2020/12/C3M0015065D.pdf (accessed on 15 June 2023).
- Misu, D.; Matsushita, M.; Takeuchi, K.; Oishi, K.; Kawamura, M. Consideration of Optimal Number of Poles and Frequency for High-Efficiency Permanent Magnet Motor. In Proceedings of the 2014 International Power Electronics Conference (IPEC-Hiroshima 2014—ECCE ASIA), Hiroshima, Japan, 18–21 May 2014; pp. 3012–3017. [Google Scholar] [CrossRef]
- Berardi, G.; Nategh, S.; Bianchi, N.; Thioliere, Y. A Comparison Between Random and Hairpin Winding in E-Mobility Applications. In Proceedings of the IECON 2020 The 46th Annual Conference of the IEEE Industrial Electronics Society, Singapore, 18–21 October 2020; pp. 815–820. [Google Scholar] [CrossRef]
- Cui, J.; Xiao, W.; Zou, W.; Liu, S.; Liu, Q. Design Optimisation of Submersible Permanent Magnet Synchronous Motor by Combined DOE and Taguchi Approach. IET Electr. Power Appl. 2020, 14, 1060–1066. [Google Scholar] [CrossRef]
- NIST/SEMATECH. Fractional Factorial Designs. In e-Handbook of Statistical Methods. Available online: https://www.itl.nist.gov/div898/handbook/pri/section3/pri334.htm (accessed on 15 June 2023).
- Ait-Amir, B.; Pougnet, P.; El Hami, A. 6—Meta-Model Development. In Embedded Mechatronic Systems 2, 2nd ed.; El Hami, A., Pougnet, P., Eds.; ISTE: Washington, DC, USA, 2020; pp. 157–187. [Google Scholar] [CrossRef]
- Imperix. Rapid Control Prototyping System. Available online: https://imperix.com/doc/category/implementation (accessed on 15 June 2023).
Disclaimer/Publisher’s Note: The statements, opinions and data contained in all publications are solely those of the individual author(s) and contributor(s) and not of MDPI and/or the editor(s). MDPI and/or the editor(s) disclaim responsibility for any injury to people or property resulting from any ideas, methods, instructions or products referred to in the content. |
© 2023 by the authors. Licensee MDPI, Basel, Switzerland. This article is an open access article distributed under the terms and conditions of the Creative Commons Attribution (CC BY) license (https://creativecommons.org/licenses/by/4.0/).