Abstract
Compared with the previous generation of High Efficiency Video Coding (HEVC), Versatile Video Coding (VVC) introduces a quadtree and multi-type tree (QTMT) partition structure with nested multi-class trees so that the coding unit (CU) partition can better match the video texture features. This partition structure makes the compression efficiency of VVC significantly improved, but the computational complexity is also significantly increased, resulting in an increase in encoding time. Therefore, we propose a fast CU partition decision algorithm based on DenseNet network and decision tree (DT) classifier to reduce the coding complexity of VVC and save more coding time. We extract spatial feature vectors based on the DenseNet network model. Spatial feature vectors are constructed by predicting the boundary probabilities of 4 × 4 blocks in 64 × 64 coding units. Then, using the spatial features as the input of the DT classifier, through the classification function of the DT classifier model, the top N division modes with higher prediction probability are selected, and other division modes are skipped to reduce the computational complexity. Finally, the optimal partition mode is selected by comparing the RD cost. Our proposed algorithm achieves 47.6% encoding time savings on VTM10.0, while BDBR only increases by 0.91%.
1. Introduction
With the widespread use of 5G technology and increased network bandwidth, high resolution video has emerged, with video resolutions ranging from Standard Definition (SD) to High Definition (HD), Full High Definition (FHD) and even Ultra-High Definition (UHD). High resolution video is giving people a better viewing experience, but it poses a huge challenge to network transmission and network bandwidth. The current HEVC standard is inadequate to fulfill people’s evolving expectations. So, JVET developed VVC [1] in July 2020 as a successor to HEVC.
VVC has higher compression efficiency, higher video quality, and more advanced encoding technology, but VVC has much higher encoding complexity than HEVC. Structurally, VVC is the successor of HEVC, and the encoding techniques used are similar. In terms of functionality, VVC can adapt to various video scenarios with higher specifications. VVC not only inherits HEVC’s hybrid video coding structure, but also incorporates many advanced coding technologies. For example, the QTMT block division structure and the number of intra-frame prediction modes are increased to 67, which not only improves the coding efficiency, but also increases the computational complexity of the coding process. As described in [2], the coding complexity of VVC is about 18 times higher than that of HEVC when intra coding. The official team named VVC’s reference software Versatile Video Coding Test Model (VTM). VTM is the only software used for all VVC video coding complexity evaluation. With full intra (AI) and random access (RA) configurations, compared to HEVC, VVC significantly increases the coding complexity from 859% to 2630% while reducing the bit rate from 36.95% to 25.32% [3]. Therefore, it is necessary to reduce the complexity in video coding.
VVC adopts the QTMT block partitioning structure, which not only includes the Quadtree (QT) partitioning structure of HEVC but also introduces a new Multi-Type Tree (MTT) partitioning structure. The partitioning modes of MTT include Horizontal Binary Tree (HBT), Vertical Binary Tree (VBT), Horizontal Ternary Tree (HTT), and Vertical Ternary Tree (VTT). The splitting modes in the QTMT partitioning structure in VVC are shown in Figure 1a. Due to the adoption of the QTMT block partitioning structure in VVC, the CUs generated are not only square but also rectangular. The partitioning structure is illustrated as shown in Figure 1b. The partitioning method of QT in VVC is the same as that in HEVC. It divides the CU into four sub-CUs of equal area. When using the BT division structure, the CU is divided into two sub-CUs of equal size. It is worth noting that when using the TT division structure, the division of the CUs into 3 sub-CUs has an area ratio of 1:2:1 [4]. Among the many partition methods, only the partition mode with the smallest RD cost is optimal. The calculation formula of RD cost is as follows:
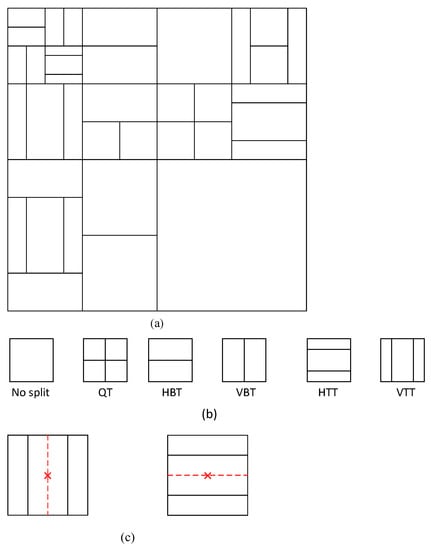
Figure 1.
QTMT partition structure. (a) Combined division of coding units. (b) Six division patterns. (c) Impermissible divisions.
Among these, SSE refers to the distortion of brightness and chrominance, represents the cost of intra-frame prediction, and is the Lagrange multiplier. There are also different combinations of splitting methods in the VVC splitting method, but there are also combinations of splitting methods that are not allowed, as in Figure 1c. VVC prohibits BT splitting in the same direction in the middle section after TT splitting [5]. It is precisely because of the QTMT block division structure adopted by VVC that the CU division process is more in line with the texture characteristics of the video, making the video picture look more delicate.
In order to determine the optimal partition result of CU, VVC uses brute force to calculate the RD cost of all CUs from top to bottom, then compares all RD costs from bottom to top, and selects the combination with the smallest RD cost as the optimal partition. In VVC, when a Coding Tree Unit (CTU) is partitioned into CUs of different sizes, it requires 5781 calculations of RD(Rate-Distortion) cost, which is significantly higher than the 85 calculations in HEVC [6]. Compared to HEVC, VVC is significantly more computationally intensive when calculating the RD cost. The main reason for the significant increase in coding time is the introduction of the MTT partition structure. Therefore, the current main research direction of VVC video coding is to increase the coding speed and save more coding time without causing a large increase in the Bjøntegaard Delta bit rate (BDBR).
With the development of deep learning, new methods are provided for video coding. Compared with traditional methods, neural network-based methods have the advantages of faster processing speed and higher accuracy when dealing with large amounts of data. Inspired by the neural network approach, in this study, we employ a DenseNet-based CNN model and a DT classifier for fast CU partitioning decisions.
In order to reduce the complexity of the encoding process, we increase the speed of the video encoding process. In this paper, we use a DenseNet-based CNN model and a DT classifier model to implement an early end of CU partitioning to speed up the coding process. The method we use can reduce the complexity of MTT segmentation to a large extent. First, a pixel luminance CU of size 64 × 64 is passed through the CNN model to output a vector of predicted probabilities that contains the probabilities of each boundary for all coding units of size 4 × 4. Subsequently, the probability vector is used as input and fed into the DT classifier model. The DT classifier predicts the most probable N partitioning modes based on the input, thereby providing the most likely partitioning options. Finally, the optimal division model is derived by comparing the RD cost. The division of the size 64 × 64 CU into a minimum of 4 × 4 CU has 16 different sizes of CUs that can continue down the division. Therefore, we designed and trained these 16 classifiers. A balance between reduced coding complexity and RD performance is achieved by tuning N. By controlling the size of N, a compromise between coding complexity and video performance is achieved. Although good video performance is guaranteed with N = 3, the coding complexity is reduced by 47.6%.; video coding speed is improved with N = 1, but BD-BR is lost by 2.53%. Our contributions are summarized as follows: (1) We use an improved DenseNet model, which can make full use of the global features of CU and further improve the accuracy of extracting spatial feature vectors. (2) We utilize the state-of-the-art LGBM classifier for classifier selection. LGBM demonstrates exceptional capability in processing large-scale data. We design specific LGBM classifiers for different CU sizes, enabling improved classifier accuracy. Instead of developing a single classifier to handle all CU sizes, our approach ensures effective classification accuracy. (3) We combine the DenseNet model and the LGBM classifier. This not only fully extracts the spatial features of CU but also ensures the accuracy of the classifier. Our combined model not only has high accuracy, but also has a shorter running time than traditional neural network models.
Section 2 reviews previous work using both traditional and neural network approaches to reduce the complexity of HEVC and VVC coding. Section 3 counts and analyzes the proportion of each division when different sizes of CU are divided in intra-frame coding. Section 4 gives a detailed explanation of our proposed algorithm. Section 5 analyzes and summarizes the experimental results.
2. Related Works
This section will be divided into two parts to introduce algorithms related to the latest video coding technology. We first introduce the use of traditional methods to predict CU partition patterns, and then introduce the use of deep learning methods to predict CU partition patterns.
In [7], pruning of the coding unit was achieved by SATD-based pattern decision and rate-distortion optimization in order to reduce the complexity of the coding process. In [8], more coding time was saved by checking the gradient of the CU and skipping unnecessary division methods in advance to achieve less complexity in the coding process. In [9], the gradient features were first extracted to determine whether QT division was performed, and then the specific division was selected by the variance of the CU. In [10], a balance between efficiency in the encoding process and complexity in the encoding process was achieved by modelling the difference between the predicted and true pixel values. In [11], the partitioning characteristics of the blocks were first analyzed, then a cascaded QT and MTT partitioning decision was developed, and finally, a gradient descent method was used to select the most appropriate pattern. In [12], the gradient features were first extracted by the Sobel operator to determine whether Q partitioning was performed. The most likely partition structure was then selected based on the variance early MTT. In [13], a reduction in computational complexity was achieved by first determining whether the code-current unit had a horizontal or vertical partition structure by using directional gradients to skip impossible partition structures in advance. In [14], multiple transformation selection was introduced to solve the optimal matrix by a sparse non-linear optimizer, with the ultimate goal of reducing computational effort. In [15], a new algorithm combining the Bayesian algorithm and deblocking filter was proposed. First, the cost of the decision evaluation model for the current CU was roughly determined, and then the most appropriate partition model was selected according to the texture complexity. In [16], the intra-frame CU division involved a two-step process. Firstly, the decision of whether to divide the CU based on the complexity of the texture was made. Subsequently, the optimal division mode was selected considering the texture orientation. In [17], the coding units were divided, and patterns were predicted based on random forests for fast classification by texture features for fast partitioning.
In [18], a CNN model that limits the height and width of the coding unit was proposed, and then the model was trained so that the RD cost was minimized to achieve a reduction in coding time. In [19], a completely new architecture was used, which consists mainly of four cascaded residual-dense blocks, improving the coding speed. In [20], a convolutional neural network approach was used to deal with video post-compression. In [21], a multi-scale convolutional neural network model was constructed, which contains multiple attention modules and multiple residual blocks. The model can fuse both luminance and chrominance components and use the residual blocks to improve the accuracy of the model prediction and achieve the final picture quality improvement. In [22], the spectral relationship with the image data was found in the convolutional neural network model, and this relationship was used to achieve an optimization of the model. In [23], a neural network with early termination of layering was utilized to achieve a reduction in coding complexity by ending unnecessary partitions early. In [24], a multi-information fusion neural network model was proposed, which skipped some time-consuming patterns by analyzing the residual information and then predicting the global information. In [25], a symmetric convolution and an asymmetric convolution were added to extract the corpora of CU blocks to achieve better predictive classification based on improvements to the residual network. In [26], a database was first created, and then a multi-stage exit neural network model was applied, discarding unnecessary pattern judgments and achieving savings in coding time. In [27], a neural network model plus a long short-term memory model were used to improve the probability of predicting CU partitioning by generating and predicting CU partition mapping maps.
Table 1 provides an overview of current state-of-the-art video coding algorithms, focusing on three main pieces of information: software version, TS, and BDBR. The first two articles listed in Table 1 follow the traditional approach of manual feature extraction followed by CU partitioning. On the other hand, the last three articles all improve the existing neural network models and reduce the complexity of neural network models by utilizing lightweight networks. Although these methods eliminate the process of manual feature extraction, they still achieve remarkable results in terms of video quality and performance metrics such as TS, BDBR, and TS/BDBR. Compared with state-of-the-art video coding techniques, our algorithm introduces an optimization of the DenseNet network model. Compared with other network models, the DenseNet network model stands out due to its small number of parameters. This results in smaller model sizes; it occupies less bandwidth and exhibits relatively low computational complexity. While most current state-of-the-art algorithms rely on threshold selection to determine the best mode, our proposed algorithm stands out by utilizing an LGBM classifier. This classifier can accurately and efficiently identify the most suitable N partition patterns, which is different from traditional threshold selection methods.

Table 1.
Key information about the five advanced algorithms.
3. Statistical Analysis
In this section, we compute the proportion of partition modes for CUs of different sizes in the dataset. Based on the analysis of partition mode ratios, we propose a DenseNet neural network model and an LGBM classifier model.
The selected video sequences include “Campfire,” “FourPeople”, “Cactus”, “CatRobot”, “BasketballPass”, and “RaceHorses”. Detailed information about these six video sequences can be found in Table 2. “Campfire” and “CatRobot” share the same resolution but differ in terms of video content. While the “Campfire” video clip features a large and static background, the “CatRobot” video clip includes intense object movement scenes. The remaining four video sequences were chosen from various resolutions to ensure unbiased analysis and statistics. We use VTM 10.0 with AI configuration and quantization parameter (QP) set to 22, 27, 32, and 37 for experiments. A total of 6,699,233 CUs were counted, ranging in size from 64 × 64 to 4 × 4. Table 3 provides the count for the 16 different CU sizes that can be further split, while Figure 2 illustrates the distribution of different splitting methods.

Table 2.
Resolution information for six video sequences.

Table 3.
Different CU division patterns.
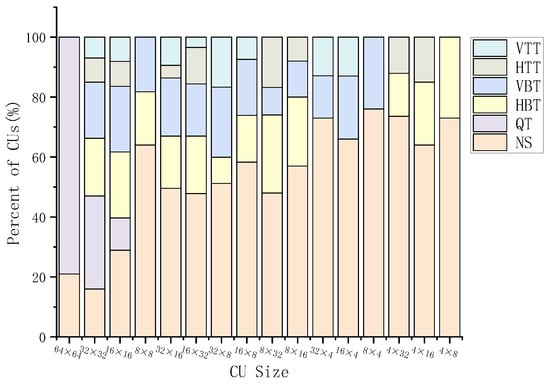
Figure 2.
Proportion of 16 different CU size division patterns.
- (1)
- From Table 3, it is evident that there are a total of 16 different CU sizes that can be further subdivided, and each CU size has a unique partitioning mode. For instance, the division methods for 4 × 8 and 8 × 4 CUs are VBT and HBT, respectively. Although both VBT and HBT fall under the category of BT (Binary Tree), they are completely distinct in the DT classifier. Through texture feature analysis, it becomes apparent that 4 × 8 and 8 × 4 CUs exhibit horizontal and vertical texture features, respectively, which are fundamentally different. Hence, it is crucial for us to separately consider 4 × 8 and 8 × 4 CUs. To enhance prediction accuracy, a deliberate design approach was employed to create 16 DT classifiers specifically tailored to the 16 distinct types of CUs.
- (2)
- Figure 2 shows the partition mode ratios for 16 differently sized CUs. As can be seen from the figure, the partition pattern among the 16 different CUs is highly unbalanced. For example, CUs of different sizes have non-split modes, but the ratio of non-split modes varies greatly. The highest proportion of 8 × 4 CU is 73%, and the lowest proportion of 32 × 32 CU is 17%, with a difference of 56%. Similarly, 16 × 16 CU and 32 × 32 CU also have six partition modes, but their mode ratios are completely different. To address this issue, we design specific classifiers for these 16 different CU sizes. To provide more accurate features to the classifier, we leverage the DenseNet neural network model.
4. Proposed Method
VVC adopts the quadtree division structure of nested multi-class trees, which greatly improves the compression efficiency, but the price is the increase of calculation and the increase of encoding time in the encoding process. Our algorithm actively selects segmentation patterns with low termination probability in advance, based on the segmentation pattern probability, to reduce the complexity of the coding process. Our algorithm consists of two main parts: feature extraction and the selection of segmentation patterns. The spatial feature extraction we use is a modified DenseNet network model. For the selection of the segmentation model, we use the LGBM classifier model. First, each frame is divided into a number of CTUs of size 128 × 128. In the encoder, the CTUs can only be QT-divided into four 64 × 64 CUs. Therefore, we pass the pixel luminance CU of size 64 × 64 through the CNN model of the modified DenseNet, which is processed by the CNN to produce the prediction probability vector , which contains the probability P for each boundary of all 4 × 4 blocks. The predicted probability vector is then processed through the decision tree LightGBM, and the probability of all division patterns is generated after passing the DT classifier. The top N division patterns with high probability are taken. Finally, by calculating the RD cost, we select the smallest RD cost combination to determine the optimal partitioning scheme. Figure 3 is a flow chart of our proposed algorithm.

Figure 3.
Algorithm flowchart.
4.1. Feature Extraction Based on DenseNet Model
During the coding process of VVC, the algorithm based on neural networks is primarily divided into two directions. The first direction involves designing a CNN network for a specific size of coding unit. However, this approach has a significant drawback: it requires designing multiple CNN network models, leading to increased computational complexity as the number of CNN models increases. Additionally, CU segmentation is a continuous process. In the CTU segmentation stage, different network models need to be continuously called for prediction, resulting in substantial time overhead. The second direction aims to design adaptive partitions for CUs of varying sizes. While this adaptive partitioning scheme is convenient, the model’s accuracy is not very high. Consequently, we employ a DenseNet-based CNN model to predict the probability of all 4 × 4 block boundaries within a 64 × 64 CU being partitioned. This approach enables us to achieve one-shot prediction for all partitioning methods within a 64 × 64 CU.
For spatial feature extraction, we use a CNN model based on DenseNet. In VVC, each frame is divided into a number of sizes 128 × 128 CTUs, and in the encoder’s encoding rules, a size 128 × 128 CTU can only be divided into four size 64 × 64 CUs by QT. Therefore, we passed the four batches of size 64 × 64 CUs through the CNN model in batches, and the predicted boundary probabilities P of all 4 × 4 blocks formed the predicted probability vector . The length of the predicted probability vector is calculated as follows:
where is in size CU. is the length of the predicted probability vector . For example: size 64 × 64 CU, is 64, and the length of is 480. The predicted probability vector contains the boundary probabilities for all 4 × 4 blocks, as shown in Figure 4, where the boundary probabilities in the predicted probability vector are ordered. is denoted as the lower boundary of the 4 × 4 blocks in the first column of the first row, is denoted as the lower boundary of the 4 × 4 blocks in the first column of the second row, is denoted as the right boundary of the 4 × 4 blocks in the first column of the first row, is denoted as the right boundary of the 4 × 4 blocks in the first column of the second row, and is denoted as the right boundary of the 4 × 4 blocks in the 16th row of the right border of the 4 × 4 block in the 15th column of the 16th row. For a deterministic division, the boundary probability value for each 4 × 4 block that lies on the division boundary is close to 1. After CNN, all 4 × 4 CU boundary probabilities form a spatial feature vector, which is input into the DT classifier.
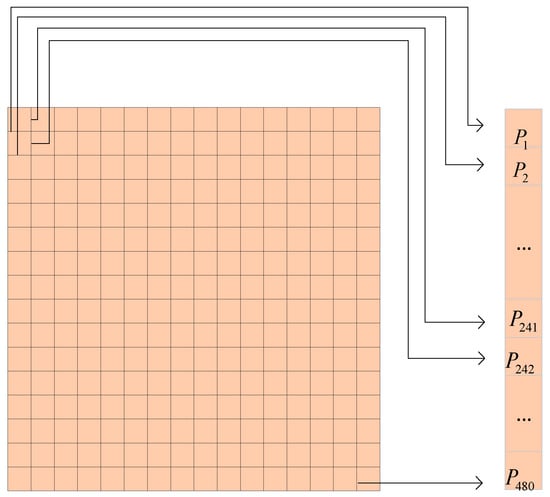
Figure 4.
All boundary probability distributions in a size 64 × 64 CU.
The architectural diagram of our CNN model is inspired by the DenseNet network model. Figure 5 shows the architecture of the DenseNet network model [28]. As can be seen from the diagram, the light green is the convolutional layer and activation function. The DenseNet block contains six convolutional layers, and the internal structure of the six convolutional layers is the same. Brown is the pooling layer, green is the convolution layer, brown and green form the Transition layer, and blue is the fully connected layer. There are three main reasons why we chose this network model architecture. DenseNet requires half as many parameters as the ResNet model for the same dataset and the same correct rate. DenseNet takes half the time than the ResNet model for the same correct rate. The DenseNet network model is also excellent in terms of overfitting resistance performance. DenseNet proposes a more radical dense connection mechanism than ResNet, which simply adds up the elements of the previous layer and the current layer, while DenseNet adds up the elements of the current layer and all the previous layers. This continuous jump connection alleviates, to some extent, the problem of disappearing features and gradients when the neural network is passed too deep. The reason why we choose to improve the DenseNet model is because of its excellent performance.

Figure 5.
DenseNet network architecture diagram.
Figure 6 is a diagram of our CNN model. The DenseNet network model is mainly composed of a Dense Block layer and a Transition layer. The Transition layer is used to connect two Dense Block layers. We will focus on the Transition layer and Dense Block layer of the CNN model. Our CNN model contains four Transition layers and three Transition layers, and the Dense Block layer contains six bottleneck layers. Since the convolution kernels used in the four Dense Blocks are the same, please refer to Table 4 for more information. Therefore, Dense Block 1 (D1) is described in detail. First, the size 64 × 64 CU goes through a 3 × 3 convolutional layer 1 (C1), with an output size of 64 × 64 × 16, and then through Dense Block 1 (D1), with an output size of 64 × 64 × 208. In particular, Dense Block 1 (D1) contains six convolutional layers, and the non-linear composition used in each convolutional layer ensures that the feature maps in each layer have the same size, as shown in Table 5. Each layer contains a 1 × 1 convolution and a 3 × 3 convolution, where the 1 × 1 convolution is used to quadruple the output channels. When the input is 64 × 64 × 16, the output is 64 × 64 × 48 after DenseNet bottleneck 1 (DL1), and the other six convolutional layers are the same as DL1. The Transition layer connects two Dense Blocks. Its main function is to down sample and compress the model. It is mainly composed of 3 × 3 Avgpool and 1 × 1 convolution.
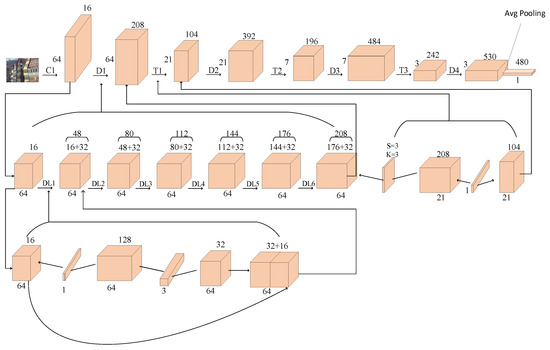
Figure 6.
CNN model architecture.

Table 4.
Parameters of 4 DenseNet Blocks.

Table 5.
Parameters of 4 Transition Blocks.
4.2. Multi-Class Classifier Based on Decision Tree Model
After extracting spatial feature vectors using CNN, we need to classify them using DT classifier based on their predicted probability vectors, selecting the optimal splitting pattern. Therefore, we have to select an appropriate classifier combining CUs of different sizes. LGBM (Light Gradient Boosting Machine) stands as a cutting-edge gradient boosting framework devised by Microsoft researchers, employing tree-based learning algorithms to achieve optimal performance [29]. Compared to other classifiers, our classifier has four main advantages: (i) high accuracy, (ii) fast speed, (iii) ability to handle large amounts of data, and (iv) ease of implementation [4]. In solving the classification problem, we tried to use different classifier models, which contain SVM, LGBM, and random forest models, and finally the LGBM model was used. There are two main reasons for this. First, the complexity of the training phase is low while maintaining excellent classification performance; second, the LGBM model can fully utilize the edge information of CU, while other models do not utilize the edge information sufficiently.
In previous studies on CU partition decision, usually only local information is considered. However, the decision tree we use can effectively utilize the global information for partitioning decision. The probability vector generated after passing a 64 × 64 CU through the CNN model is considered as the spatial feature during the CU partition process. After obtaining the probability vector, it is passed through our DT classifier model. The DT classifier analyzes the different features and determines the most suitable partition combination for the CU [30,31,32]. In VVC, it is statistically derived that there are a total of 16 different sizes of CUs that can continue to be divided downwards, and there are 2–6 division patterns for these sixteen CUs. The probability vectors of the six division patterns were obtained after the CU had been subjected to the DT classifier, but some CUs had less than six division patterns. As shown in Figure 7, after going through the CNN model to generate the feature vector , the DT classifier will select different combinations of feature vectors P according to different depths, and then select the most appropriate division pattern. The LGBM grows in a leafy (vertical) manner exactly in line with the top-to-bottom division of the CU, which also brings less loss to the forecasting process. For each different size of CU, we design separate multi-class classifiers. Compared to other algorithms that design one classifier, our individually designed classifier provides better analysis of features and can better improve the accuracy of predicting segmentation patterns. When the feature vector is used as input in the DT classifier, the output is a probability vector of six division patterns. In dividing different sizes of CU, the resulting probability vector is different, partly because of the different choices of division methods, and also partly because of the different kinds of division patterns. In the probability vector , the impossible division is treated directly as 0. Therefore, it is this method of training the models individually that improves the accuracy of the model predictions. When the probability vector is obtained, the encoder automatically selects the division model with the higher probability. Combining the division patterns of different depths gives us the optimal division pattern we want.

Figure 7.
DT classifier model.
4.3. Loss Function
There must be an error between the predicted value and the true value, so we introduce a loss function to train the model and improve its prediction accuracy. Our model’s prediction of the segmentation pattern first passes through the CNN model and then the DT classifier, which has the possibility of a large deviation from the real segmentation pattern. Also, since the feature probability vector generated after the CNN model is between [0, 1], during our training process, we used the cross-entropy function to improve the accuracy of our model. The cross-entropy function is expressed as:
where is the number of samples, is the number of elements in each sample, is the true value, and is the predicted value. denotes the th vector of the th sample in the true value, and denotes the th vector of the th sample in the predicted value.
For the selection of the classifier, it is found through experiments that the LGBM model has relatively high accuracy among all currently available decision trees and can better handle large-scale data. LGBM needs to combine classifiers that predict CUs of different sizes at the same depth with classifiers at different depths to improve the accuracy of model predictions. Although the accuracy of the LGBM model is high, there is still an error between the predicted value and the real value, mainly due to the high computational complexity of CUs of different depths and sizes. Therefore, we need to optimize each stage of the classifier. We used a loss function to train our model. The loss function we used is calculated as follows:
4.4. Performance of the Model
To improve the accuracy of model predictions, we use some video sequences from the training set to train our model. The video sequences in the training set are mainly selected from six different video sequences. The video sequence consists of 1000 images of different content, with subjects such as animals, plants, and people. During CU segmentation, we add DenseNet CNN model and DT classifier to the encoding process for optimization. With the addition of new algorithms, the encoding process is significantly shortened. Therefore, we will analyze the performance of our model using the following three aspects. The receiver operating characteristic curve is used to measure the performance of DenseNet; the accuracy of the N modes selected by the DT classifier is used to measure the accuracy of the DT classifier; and the ratio of the model running time to the running time of VTM10.0 is used to measure the performance of the model.
4.4.1. DenseNet Performance
We analyze the performance of our DenseNet model by comparing the 8 × 16 CU and 4 × 8 CU receiver operating characteristic curves, as shown in Figure 8. The abscissas of the two graphs represent the false positive rate, and the ordinate represents the true positive rate. The left picture is the ROC curve of 8 × 16 CU under the selection of VBT, and the right picture is the ROC curve of 4 × 8 CU under the selection of HBT. The areas enclosed by the two curves and their respective coordinate axes are 0.65 and 0.61, respectively, which is consistent with the BT split being less than 0.7. Figure 9 shows the real partition results of CU and the predicted partition results of CNN. When the QP value is 22, we find that the predicted partition results are most similar to the actual partition results. These two aspects are enough to prove the excellent performance of our DenseNet model.
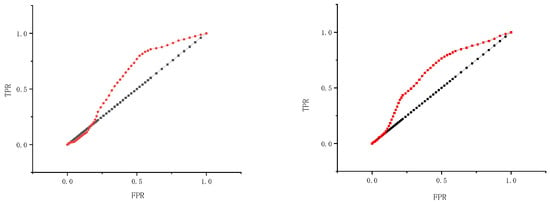
Figure 8.
ROC curves of 8 × 16 CU and 4 × 8 CU.
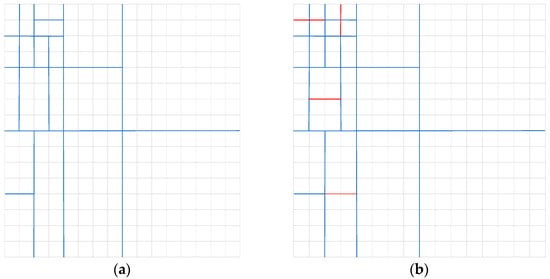
Figure 9.
CU’s real partition results and predicted partition results. (a) Real partitioning result chart of VTM10.0. (b) Partitioning results predicted by CNN model.
4.4.2. DT Performance
We train an LGBM classifier and calculate the prediction accuracy for different CU sizes. Figure 10 selects four CUs with representative sizes and counts the prediction accuracy under the three classifier schemes. For both 32 × 32 CU and 16 × 16 CU, there are six partition modes. When N = 1, N = 2, and N = 3 in 32 × 32 CU, the accuracy rates are 59.54%, 78.38%, and 88.87%, respectively. Obviously, the higher the value of N, the higher the accuracy of CU partitioning. Similarly, for 16 × 32 and 32 × 16 CU sizes, the larger the value of N, the higher the correct prediction rate. Since there are only five partition modes for 16 × 32 and 32 × 16 CUs, the predicted probabilities are 89.85% and 89.24%, respectively, which are higher than those of 32 × 32 and 16 × 16 CUs. Therefore, our approach of designing different classifiers based on CU shape is very successful, and because the average accuracy of our DT classifier exceeds 85%, this demonstrates the excellent performance of our classifier.
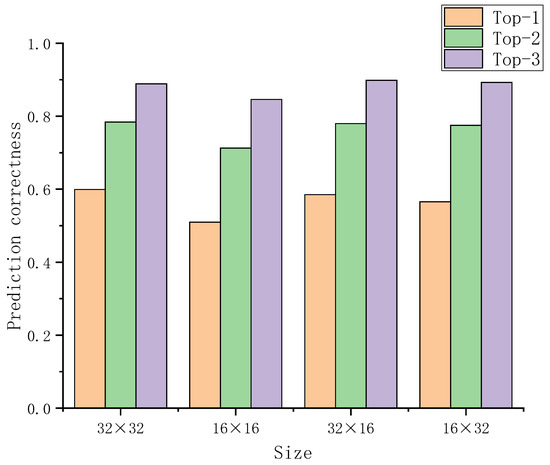
Figure 10.
Correct prediction rates for four different sizes of CUs under our model.
4.4.3. Overall Model Performance
Our proposed algorithm consists primarily of two components: the CNN prediction stage and the LGBM classifier decision stage. Among these, the CNN prediction stage requires significantly less time compared to the decision stage of the LGBM classifier. Therefore, we aggregate the running times of the CNN and DT models for statistical purposes. The prediction time for other CNN models typically comprises approximately 7% of the original VTM encoding time. Consequently, we compared the prediction time of our model with that of other models. Figure 11 illustrates the running time of our proposed model as a percentage of the total encoding processing time of the original VTM. We measured the model’s running time on six standard video training sets, with the average running time accounting for 6.1% of the overall duration of the original VTM encoding process. This further attests to the excellent performance of our model.
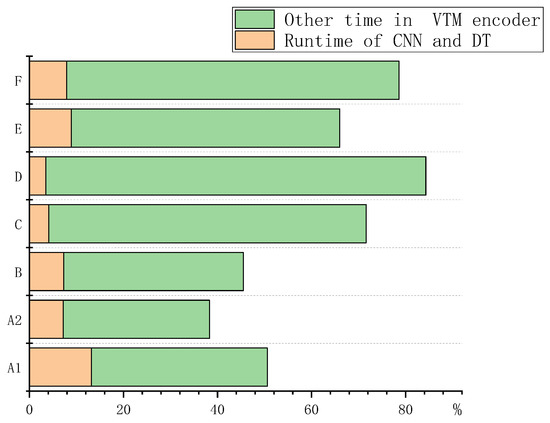
Figure 11.
Percentages of the proposed CNN model compared to the original coding time of VTM.
5. Experimental Results
We first introduce the pre-experimental preparations and experimental equipment. Subsequently, we present experimental results obtained from our algorithm. Finally, we analyze these results and compare them with those of other state-of-the-art algorithms. In this comparison, we focus on two key metrics, namely TS and BDBR, to highlight the advantages of our algorithm.
5.1. Experimental Setup
The algorithm proposed in this paper is tested on VTM10.0. The video sequences used in the experiments are 25 video sequences in the JVET test set. We divide the video sequences in the test set into six categories according to different resolution and texture features, as shown in Table 1. Video sequences are encoded at four QPs (22, 27, 32, 37) in the default encoding profile. Our experiments are performed on a computer system equipped with a 12th Generation Intel(R) Core (TM) i9-12900H 2.50 GHz processor, 16GB of RAM, and running the Windows operating system.
In the experimental session, the performance of the algorithm was judged by recording the BDBR and the coding time savings (TS), and finally we used the TS/BDBR as a judge of the overall performance of the algorithm. The TS was calculated as follows:
where is the coding time of the anchoring algorithm in VTM 10.0, and is the coding time of our proposed algorithm in VTM 10.0. From the formula for , when the value of is larger, the smaller the value of TS, and less coding time is saved. When the value of is smaller and the value of TS is larger, more coding time is saved and the better the performance of the model.
5.2. Results and Analysis
According to the different needs of users, we have designed two schemes: Top-1 and Top-3. Table 6 shows the experimental data of Top-1 and Top-3 schemes. Our Top-1 scheme achieves a 71.1% reduction in encoding time but a 2.53% increase in BDBR. This solution is especially suitable for users who prioritize fast coding needs. Compared with the VTM anchor algorithm, our algorithm significantly reduces the encoding time. Compared with other state-of-the-art algorithms, although BDBR has a large loss, it is very good in terms of encoding time. The Top-3 solution is mainly tailored for users who are looking for high video quality and do not place as much emphasis on encoding speed. Compared with VTM anchoring, our scheme has significant advantages in both encoding time and complexity. Compared with other state-of-the-art algorithms, although our scheme may not be outstanding in saving time, the final video quality is clearly superior. This result is mainly attributed to the fine CU partitioning of high-resolution video sequences. By dividing the coding unit into smaller units, our method better conforms to the texture characteristics of the video.

Table 6.
Experimental results obtained for both scenarios.
After conducting tests, it has been observed that our algorithm performs well across five different resolution video sequences. Although there is some degree of fluctuation, it remains within an acceptable range. A brief analysis of the Top-3 schemes reveals the following. Video sequences A1 and A2 have the same resolution, but they differ significantly in terms of subject matter and theme. The algorithm’s coding performance exhibits a similar behavior in both A1 and A2 sequences. The primary reason for the variation between the two groups, A1 and A2, lies in the fact that the visual intensity of the A2 video is higher compared to A1, as evident from the TS and BDBR indicators. Analyzing the TS and BDBR indicators, A2 demonstrates only a marginal increase of 0.2% in BDBR and a mere 0.08% decrease in average encoding time compared to A1. Across the five resolutions of the video sequences, our algorithm achieves average encoding time savings of 47.6%, with the highest savings of 51% in Group B and the lowest savings of 45.1% in Group C. The overall fluctuation is just 6.1%, highlighting the reliability of our encoding scheme.
In the literature [33], a state-of-the-art CNN model is used to implement CU partitioning by two-checking the correlated texture and limiting the depth, and this algorithm has a very high performance in video coding, with an average coding time reduction of 42.34% and a BDBR increase of only 0.71%. In the literature [34], although the TS is 47.82%, our model is lighter than their model, and the prediction size is larger than their model. More importantly, our BDBR loss is significantly less than their model. Based on the experience of comparing the experimental results in the literature [35,36], we selected three papers for comparison. The comparison between the data obtained in our experiment and the experimental data of other algorithms is shown in Table 7. The experimental data of other algorithms are found in the corresponding papers to ensure the authenticity of the data. Although the VTM versions used by Fu, Wang, Zhao, and us are different, the CU partition schemes of the four versions of VTM 4.0, VTM 5.0, VTM 10.0, and VTM 12.0 are the same, so experimental comparisons can be made. Moreover, the selected datasets are the same, which also ensures the authenticity and validity of the experimental comparison.

Table 7.
Comparison with three other advanced algorithms.
Our scheme achieves a significant 47.6% reduction in encoding time, while BDBR only increases 0.91%, which is negligible. When BDBR is considered, our scheme is significantly better than Zhao and Wang’s. In terms of time savings, our scheme significantly outperforms Zhao and Fu’s. The increase in BDBR is negligible, while the decrease in encoding time is considerable. Therefore, our encoding scheme exhibits excellent encoding performance. When evaluating video sequences of various resolutions, our algorithm outperforms three other state-of-the-art algorithms on high-resolution videos. It performs similarly to the other three algorithms on low-resolution videos. By incorporating our algorithm into VTM, we achieve a significant reduction in encoding time, and the CU partition is more in line with the texture characteristics of the video, making the video picture look more realistic.
To further evaluate the RD performance of our model, we analyze two video sequences “FourPeople” and “CatRobot”, as shown in Figure 12. The X-axis represents code rate, and the Y-axis represents Y-PSNR. When the QP value is 37, our proposed algorithm exhibits similar performance to the VTM10.0 anchored algorithm. Furthermore, at a QP value of 22, the performance of our algorithm is slightly lower than that of the VTM10.0 anchored algorithm. The main advantage of our algorithm is the ability to increase encoding speed and save encoding time while maintaining high video quality.
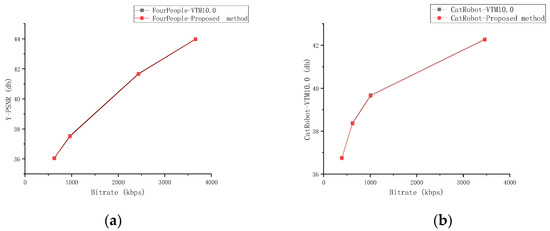
Figure 12.
RD curves for the two video sequences “FourPeople” and “CatRobot”. (a) RD curve for the video sequence “FourPeople”. (b) RD curve for the video sequence “CatRobot”.
6. Conclusions
In this paper, we propose a fast CU partition decision algorithm based on the DenseNet network and DT classifier, which reduces the complexity of the encoding process. First, each frame of an image is divided into coding units with a size of 64 × 64. Then, the CNN analyzes the texture features and pixels of the CU to obtain the boundary probability of the minimum size 4 × 4 CU. This process is repeated for all 4 × 4 coding units, and the resulting boundary probabilities are combined into a probability vector, enabling spatial feature extraction. The main function of a DT classifier is to classify feature vectors. By analyzing the feature vectors and ranking the probabilities of all partitioning modes, it selects the top N partition patterns with higher probability and skips the partition patterns with lower probability. Finally, we compare the RD costs of the first N division methods and select the division method with the smallest RD cost. Our algorithm strikes a balance between encoding performance and complexity. Compared with other advanced algorithms, we provide two encoding schemes, which satisfy users who pursue high-quality video and users who pursue encoding speed. Compared with VVC’s anchor algorithm, our Top-3 solution saves an average of 47.6% of encoding time, and BDBR improves by a minimum of 0.91%. The experimental data given prove the feasibility of the method. However, it should be noted that the dataset used for training is not large enough and the performance of the network model is not optimal, and further improvement is needed. In future work, we aim to enhance and optimize our models with larger datasets.
Author Contributions
Conceptualization, H.L. and P.Z.; methodology, Q.Z.; software, B.J.; validation, Q.Z., P.Z. and H.L.; formal analysis, P.Z.; investigation, H.L.; resources, Q.Z.; data curation, P.Z.; writing—original draft preparation, P.Z.; writing—review and editing, Q.Z.; visualization, B.J.; supervision, Q.Z.; project administration, Q.Z.; funding acquisition, Q.Z and H.L. All authors have read and agreed to the published version of the manuscript.
Funding
This work was supported in part by the National Natural Science Foundation of China No.61771432 and 61302118, the Basic Research Projects of Education Department of Henan No. 21zx003 and No. 20A880004, the Key projects Natural Science Foundation of Henan 232300421150, the Scientic and Technological Project of Henan Province 232102211014, and the Postgraduate Education Reform and Quality Improvement Project of Henan Province YJS2021KC12, YJS2023JC08, and YJS2022AL034.
Data Availability Statement
Not applicable.
Conflicts of Interest
The authors declare no conflict of interest.
References
- Bross, B.; Wang, Y.-K.; Ye, Y.; Liu, S.; Chen, J.; Sullivan, G.J.; Ohm, J.-R. Overview of the Versatile Video Coding (VVC) Standard and Its Applications. IEEE Trans. Circuits Syst. Video Technol. 2021, 31, 3736–3764. [Google Scholar] [CrossRef]
- Abdallah, B.; Ben Jdidia, S.; Belghith, F.; Ali Ben Ayed, M.; Masmoudi, N. A CNN-Based QTMT Partitioning Decision for the VVC Standard. In Proceedings of the 2022 IEEE International Conference on Design & Test of Integrated Micro & Nano-Systems (DTS), Cairo, Egypt, 6–9 June 2022; pp. 1–5. [Google Scholar]
- Dong, X.; Shen, L.; Yu, M.; Yang, H. Fast Intra Mode Decision Algorithm for Versatile Video Coding. IEEE Trans. Multimed. 2022, 24, 400–414. [Google Scholar] [CrossRef]
- Saldanha, M.; Sanchez, G.; Marcon, C.; Agostini, L. Configurable Fast Block Partitioning for VVC Intra Coding Using Light Gradient Boosting Machine. IEEE Trans. Circuits Syst. Video Technol. 2022, 32, 3947–3960. [Google Scholar] [CrossRef]
- Wu, S.; Shi, J.; Chen, Z. HG-FCN: Hierarchical Grid Fully Convolutional Network for Fast VVC Intra Coding. IEEE Trans. Circuits Syst. Video Technol. 2022, 32, 5638–5649. [Google Scholar] [CrossRef]
- Hao, Z.; Sun, H.; Xiang, G.; Zhang, P.; Zeng, X.; Fan, Y. A Reconfigurable Multiple Transform Selection Architecture for VVC. IEEE Trans. VLSI Syst. 2023, 31, 658–669. [Google Scholar] [CrossRef]
- Lei, M.; Luo, F.; Zhang, X.; Wang, S.; Ma, S. Look-Ahead Prediction Based Coding Unit Size Pruning for VVC Intra Coding. In Proceedings of the 2019 IEEE International Conference on Image Processing (ICIP), Taipei, Taiwan, 22–25 September 2019; pp. 4120–4124. [Google Scholar]
- Fan, Y.; Chen, J.; Sun, H.; Katto, J.; Jing, M. A Fast QTMT Partition Decision Strategy for VVC Intra Prediction. IEEE Access 2020, 8, 107900–107911. [Google Scholar] [CrossRef]
- Li, Y.; Yang, G.; Song, Y.; Zhang, H.; Ding, X.; Zhang, D. Early Intra CU Size Decision for Versatile Video Coding Based on a Tunable Decision Model. IEEE Trans. Broadcast. 2021, 67, 710–720. [Google Scholar] [CrossRef]
- Yang, H.; Shen, L.; Dong, X.; Ding, Q.; An, P.; Jiang, G. Low-Complexity CTU Partition Structure Decision and Fast Intra Mode Decision for Versatile Video Coding. IEEE Trans. Circuits Syst. Video Technol. 2020, 30, 1668–1682. [Google Scholar] [CrossRef]
- Zhang, C.; Yang, W.; Zhang, Q. Fast CU Division Pattern Decision Based on the Combination of Spatio-Temporal Information. Electronics 2023, 12, 1967. [Google Scholar] [CrossRef]
- Chen, J.; Sun, H.; Katto, J.; Zeng, X.; Fan, Y. Fast QTMT Partition Decision Algorithm in VVC Intra Coding Based on Variance and Gradient. In Proceedings of the 2019 IEEE Visual Communications and Image Processing (VCIP), Sydney, Australia, 1–4 December 2019; pp. 1–4. [Google Scholar]
- Shi, J.; Gao, C.; Chen, Z. Asymmetric-Kernel CNN Based Fast CTU Partition for HEVC Intra Coding. In Proceedings of the 2019 IEEE International Symposium on Circuits and Systems (ISCAS), Sapporo, Japan, 26–29 May 2019; pp. 1–5. [Google Scholar]
- Hamidouche, W.; Philippe, P.; Fezza, S.A.; Haddou, M.; Pescador, F.; Menard, D. Hardware-Friendly Multiple Transform Selection Module for the VVC Standard. IEEE Trans. Consum. Electron. 2022, 68, 96–106. [Google Scholar] [CrossRef]
- Zhang, Q.; Zhao, Y.; Jiang, B.; Huang, L.; Wei, T. Fast CU Partition Decision Method Based on Texture Characteristics for H.266/VVC. IEEE Access 2020, 8, 203516–203524. [Google Scholar] [CrossRef]
- Zhang, Q.; Zhao, Y.; Jiang, B.; Wu, Q. Fast CU Partition Decision Method Based on Bayes and Improved De-Blocking Filter for H.266/VVC. IEEE Access 2021, 9, 70382–70391. [Google Scholar] [CrossRef]
- Zhang, Q.; Wang, Y.; Huang, L.; Jiang, B. Fast CU Partition and Intra Mode Decision Method for H.266/VVC. IEEE Access 2020, 8, 117539–117550. [Google Scholar] [CrossRef]
- Tech, G.; Pfaff, J.; Schwarz, H.; Helle, P.; Wieckowski, A.; Marpe, D.; Wiegand, T. Fast Partitioning for VVC Intra-Picture Encoding with a CNN Minimizing the Rate-Distortion-Time Cost. In Proceedings of the 2021 Data Compression Conference (DCC), Snowbird, UT, USA, 23–26 March 2021; pp. 3–12. [Google Scholar]
- Ma, D.; Zhang, F.; Bull, D.R. MFRNet: A New CNN Architecture for Post-Processing and In-Loop Filtering. IEEE J. Sel. Top. Signal Process. 2021, 15, 378–387. [Google Scholar] [CrossRef]
- Zhang, F.; Feng, C.; Bull, D.R. Enhancing VVC Through Cnn-Based Post-Processing. In Proceedings of the 2020 IEEE International Conference on Multimedia and Expo (ICME), London, UK, 6–10 July 2020; pp. 1–6. [Google Scholar]
- Zhao, Y.; Lin, K.; Wang, S.; Ma, S. Joint Luma and Chroma Multi-Scale CNN In-Loop Filter for Versatile Video Coding. In Proceedings of the 2022 IEEE International Symposium on Circuits and Systems (ISCAS), Austin, TX, USA, 28 May 2022; pp. 3205–3209. [Google Scholar]
- Wang, H.; Wu, X.; Huang, Z.; Xing, E.P. High-Frequency Component Helps Explain the Generalization of Convolutional Neural Networks. In Proceedings of the 2020 IEEE/CVF Conference on Computer Vision and Pattern Recognition (CVPR), Seattle, WA, USA, 13–19 June 2020; pp. 8681–8691. [Google Scholar]
- HoangVan, X.; NguyenQuang, S.; DinhBao, M.; DoNgoc, M.; Trieu Duong, D. Fast QTMT for H.266/VVC Intra Prediction Using Early-Terminated Hierarchical CNN Model. In Proceedings of the 2021 International Conference on Advanced Technologies for Communications (ATC), Ho Chi Minh City, Vietnam, 14 October 2021; pp. 195–200. [Google Scholar]
- Pan, Z.; Zhang, P.; Peng, B.; Ling, N.; Lei, J. A CNN-Based Fast Inter Coding Method for VVC. IEEE Signal Process. Lett. 2021, 28, 1260–1264. [Google Scholar] [CrossRef]
- Zhao, J.; Wu, A.; Jiang, B.; Zhang, Q. ResNet-Based Fast CU Partition Decision Algorithm for VVC. IEEE Access 2022, 10, 100337–100347. [Google Scholar] [CrossRef]
- Li, T.; Xu, M.; Tang, R.; Chen, Y.; Xing, Q. DeepQTMT: A Deep Learning Approach for Fast QTMT-Based CU Partition of Intra-Mode VVC. IEEE Trans. Image Process. 2021, 30, 5377–5390. [Google Scholar] [CrossRef]
- Xu, M.; Li, T.; Wang, Z.; Deng, X.; Yang, R.; Guan, Z. Reducing Complexity of HEVC: A Deep Learning Approach. IEEE Trans. Image Process. 2018, 27, 5044–5059. [Google Scholar] [CrossRef]
- Bakshi, S.; Rajan, S. Fall Event Detection System Using Inception-Densenet Inspired Sparse Siamese Network. IEEE Sens. Lett. 2021, 5, 1–4. [Google Scholar] [CrossRef]
- Shen, H.; Wang, Y.; Guan, X.; Huang, W.; Chen, J.; Lin, D.; Gan, W. A Spatiotemporal Constrained Machine Learning Method for OCO-2 Solar-Induced Chlorophyll Fluorescence (SIF) Reconstruction. IEEE Trans. Geosci. Remote Sens. 2022, 60, 1–17. [Google Scholar] [CrossRef]
- Tang, Z.; Luo, L.; Xie, B.; Zhu, Y.; Zhao, R.; Bi, L.; Lu, C. Automatic Sparse Connectivity Learning for Neural Networks. IEEE Trans. Neural Netw. Learn. Syst. 2022, 1–15. [Google Scholar] [CrossRef] [PubMed]
- Hu, W.; Che, Z.; Liu, N.; Li, M.; Tang, J.; Zhang, C.; Wang, J. CATRO: Channel Pruning via Class-Aware Trace Ratio Optimization. IEEE Trans. Neural Netw. Learn. Syst. 2023, 1–13. [Google Scholar] [CrossRef] [PubMed]
- Kulkarni, U.; Hosamani, A.S.; Masur, A.S.; Hegde, S.; Vernekar, G.R.; Chandana, K.S. A Survey on Quantization Methods for Optimization of Deep Neural Networks. In Proceedings of the 2022 International Conference on Automation, Computing and Renewable Systems (ICACRS), Pudukkottai, India, 13–15 December 2022; pp. 827–834. [Google Scholar]
- Fu, P.-C.; Yen, C.-C.; Yang, N.-C.; Wang, J.-S. Two-Phase Scheme for Trimming QTMT CU Partition Using Multi-Branch Convolutional Neural Networks. In Proceedings of the 2021 IEEE 3rd International Conference on Artificial Intelligence Circuits and Systems (AICAS), Washington, DC, USA, 6 June 2021; pp. 1–6. [Google Scholar]
- Wang, Y.; Dai, P.; Zhao, J.; Zhang, Q. Fast CU Partition Decision Algorithm for VVC Intra Coding Using an MET-CNN. Electronics 2022, 11, 3090. [Google Scholar] [CrossRef]
- Pastuszak, G.; Abramowski, A. Algorithm and Architecture Design of the H.265/HEVC Intra Encoder. IEEE Trans. Circuits Syst. Video Technol. 2016, 26, 210–222. [Google Scholar] [CrossRef]
- Zhang, Y.; Lu, C. Efficient Algorithm Adaptations and Fully Parallel Hardware Architecture of H.265/HEVC Intra Encoder. IEEE Trans. Circuits Syst. Video Technol. 2019, 29, 3415–3429. [Google Scholar] [CrossRef]
Disclaimer/Publisher’s Note: The statements, opinions and data contained in all publications are solely those of the individual author(s) and contributor(s) and not of MDPI and/or the editor(s). MDPI and/or the editor(s) disclaim responsibility for any injury to people or property resulting from any ideas, methods, instructions or products referred to in the content. |
© 2023 by the authors. Licensee MDPI, Basel, Switzerland. This article is an open access article distributed under the terms and conditions of the Creative Commons Attribution (CC BY) license (https://creativecommons.org/licenses/by/4.0/).