Article

Content Caching and Distribution Policies for Vehicular Ad-Hoc Networks (VANETs): Modeling and Simulation

by
Irene Kilanioti
*,
Nikolaos Astrinakis
and
Symeon Papavassiliou
*
School of Electrical and Computer Engineering, National Technical University of Athens, 157 80 Athens, Greece
*
Authors to whom correspondence should be addressed.
Electronics 2023, 12(13), 2901; https://doi.org/10.3390/electronics12132901
Submission received: 23 May 2023 / Revised: 23 June 2023 / Accepted: 26 June 2023 / Published: 1 July 2023
(This article belongs to the Special Issue Intelligent Technologies for Vehicular Networks)

Abstract

:
The paper studies the application of various content distribution policies for vehicular ad hoc networks (VANETs) and compares their effectiveness under various simulation scenarios. Our implementation augments the existing Veins tool, an open source framework for vehicular network simulations based on the discrete event simulator OMNET++ and SUMO, a tool that simulates traffic on road networks. The proposed solution integrates various additional features into the pre-existing Veins realizations and expands them to include the modeling and implementation of proposed caching and content distribution policies and the measurement of respective metrics. Moreover, we integrate machine learning algorithms for distribution policies into the simulation framework in order to efficiently study distribution of content to the network nodes. These algorithms are pre-trained neural network models adapted for VANETs. Using these new functions, we can specify the simulation parameters, run a plethora of experiments and proceed to evaluate metrics and policies for content distribution.

1. Introduction

Wireless vehicular ad hoc networks (VANETs) are multi-hop networks of vehicles equipped with various sensors and technologies, that enable them to communicate with each other within their transmission bandwidth. The VANET topology is dynamic and constantly changes as the nodes of the network move. This results in the frequent creation and destruction of links between network nodes, and, thus, several routing algorithms used for mobile ad hoc networks are not applicable for road ad hoc networks. The path that the nodes take is, moreover, affected by the road network. Vehicles send and receive content and conduct wireless routing. Vehicle-to-Vehicle (V2V), Vehicle-to-Infrastructure (V2I) and Vehicle-to-Everything (V2X) communication technologies cover these functionalities [1].
The nodes that comprise VANETs are [2]:
  • Vehicles. Vehicles can be either private or public transport vehicles.
  • Servers/Origin server. Servers act as data repositories for content that exists in the network and they communicate directly and exclusively with Roadside Units (RSUs).
  • Roadside Units (RSUs). Static or mobile RSUs function as an intermediary between servers and vehicles and may also contain stored network information that vehicles can access.
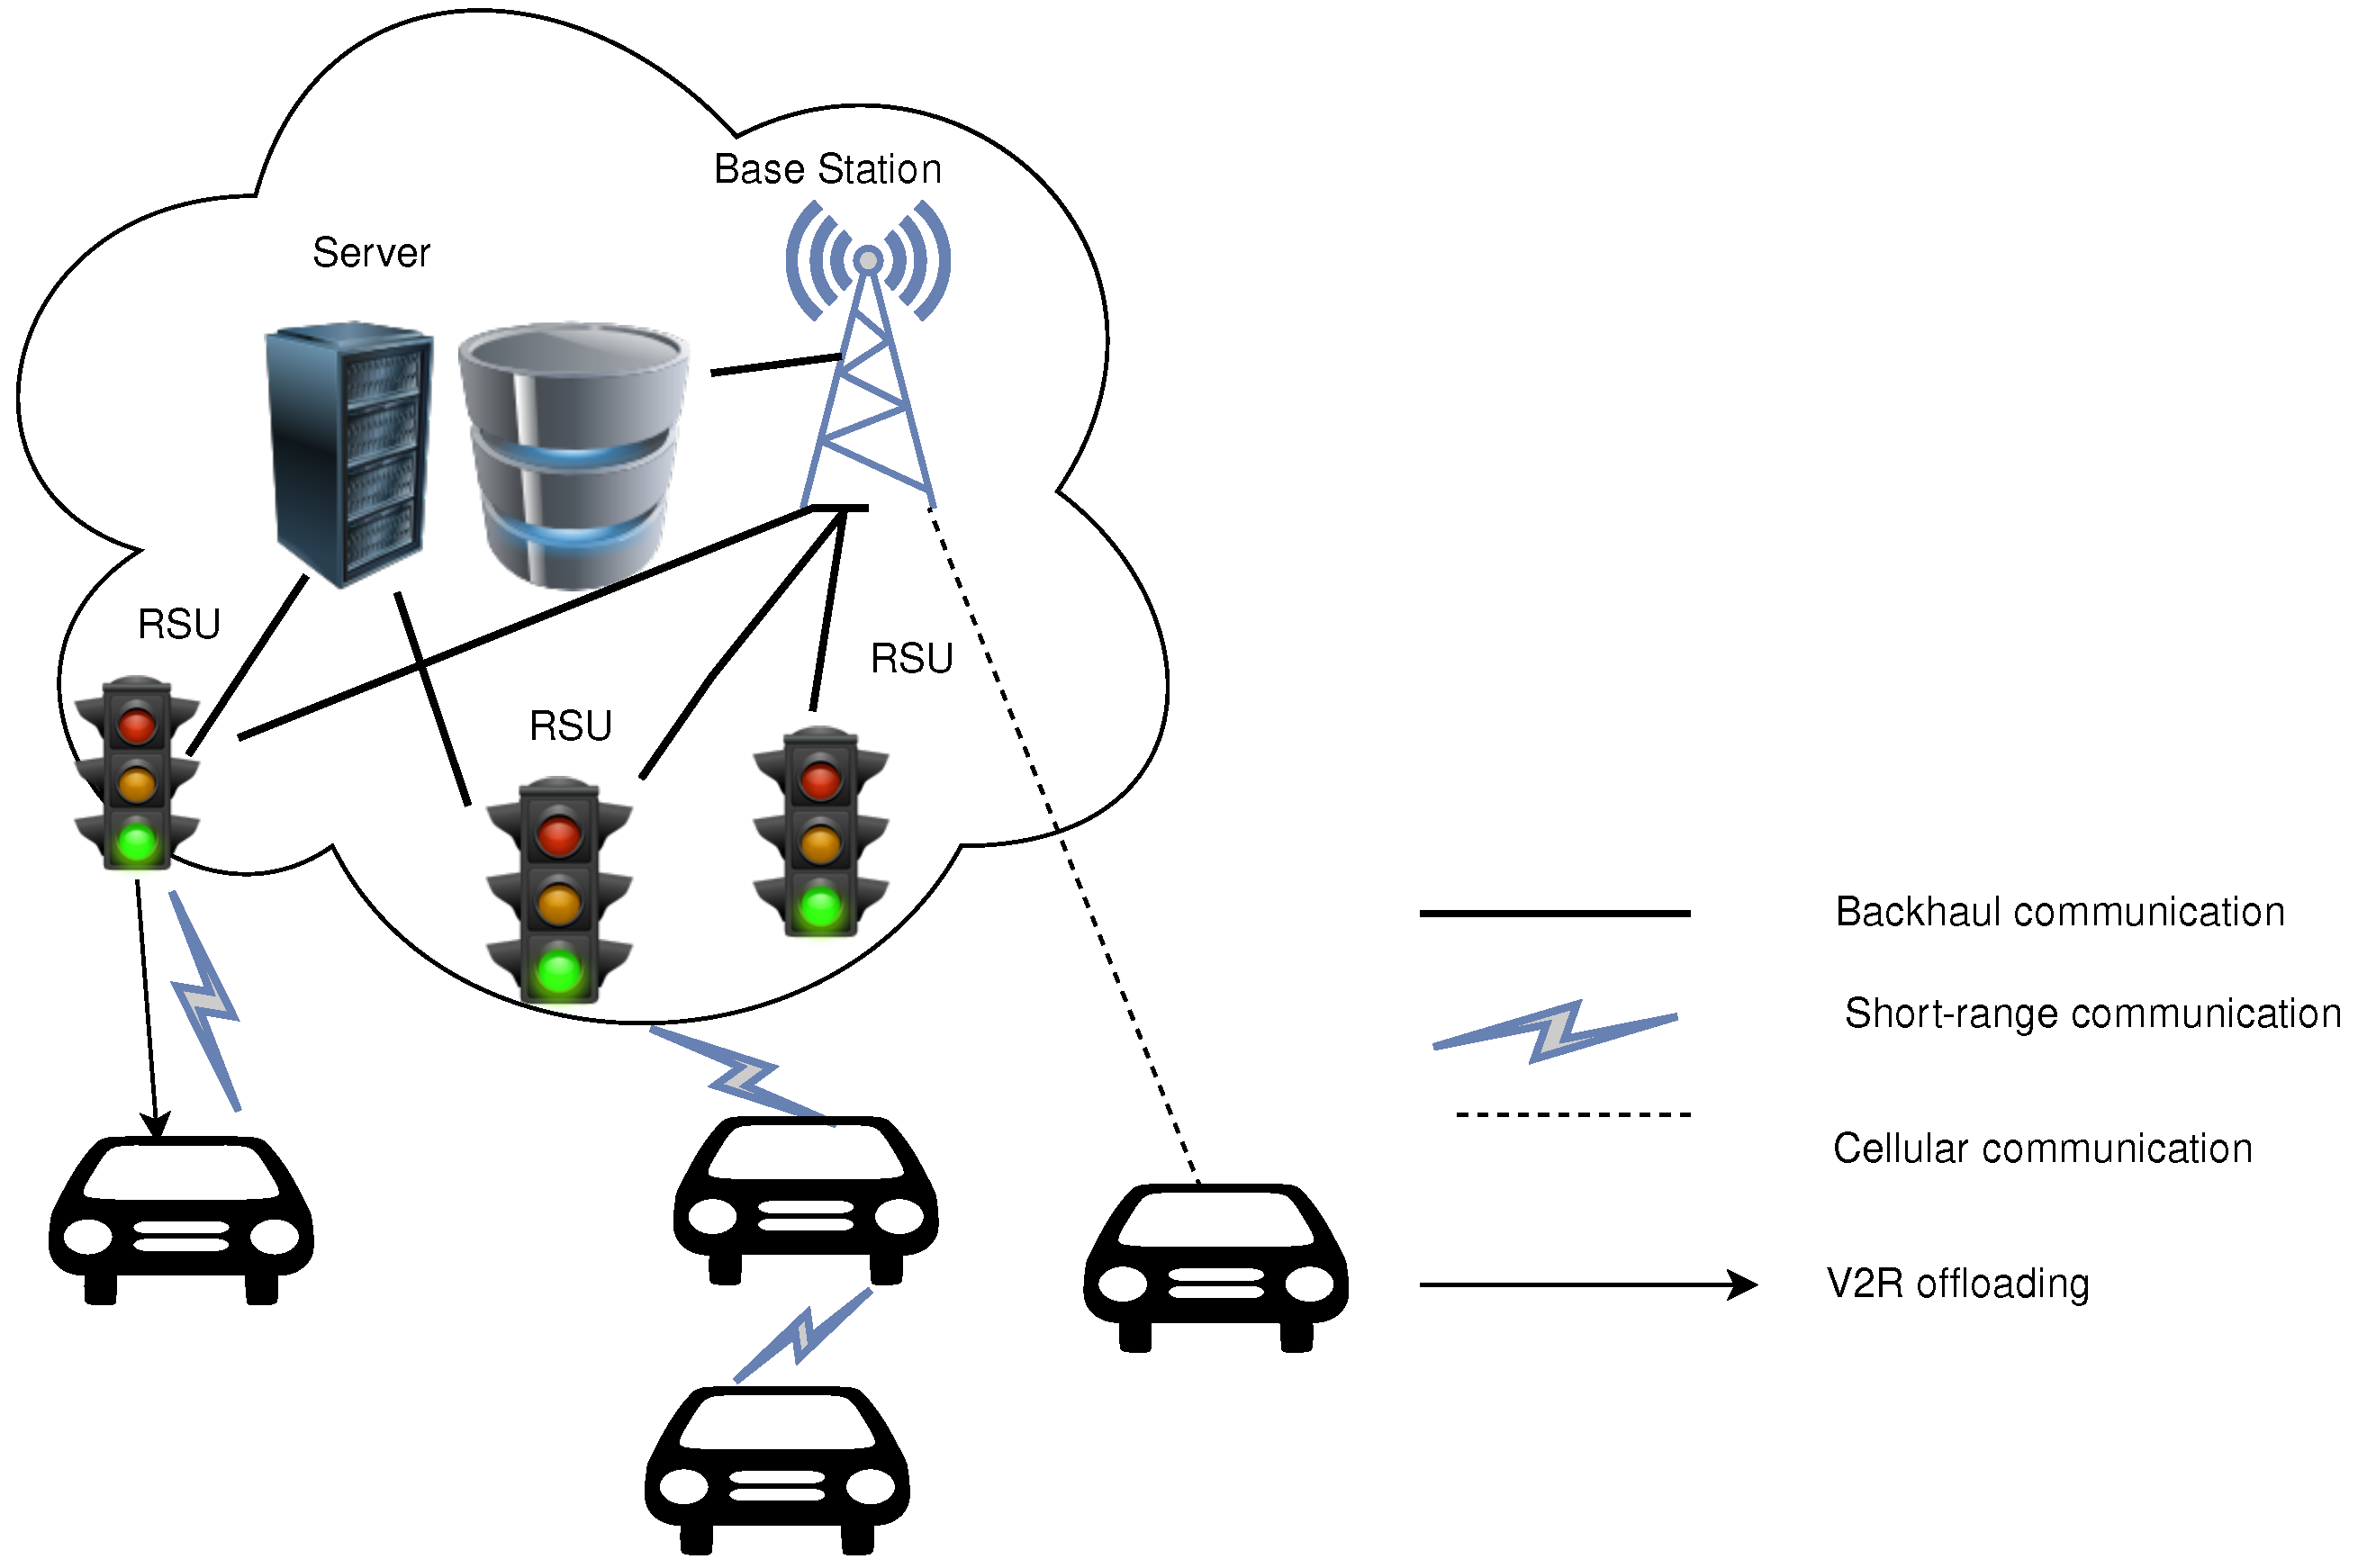
The paradigm shown in Figure 1 handles bandwidth-demanding content for real-time automotive applications with offloading for computation and content delivery. Current policies in V2X communications leverage Dedicated Short-Range Communications (DSRC), that employ the IEEE 802.11p standard, or alternatively Cellular V2X (C-V2X), based on the Long Term Evolution (LTE) and New Radio (NR) standards [3].
High mobility, lack of fixed infrastructure in the form of RSUs, scalability issues, intermittent communication due to the dynamically changing network, shadowing because of the existence of obstacles, signal path loss and restricted communication window among vehicles make IP-based communication inappropriate for handling multi-modal and time-varying content of high-definition maps, dynamic planning information, infotainment multimedia, etc.
The content exchanged among vehicles and between vehicles and fixed infrastructure is delay-constrained, and often critical for traffic management and the safety of driver and passengers. Practical applications of Intelligent Transportation Systems (ITS) with VANETs include also solutions for environment monitoring, infotainment and healthcare of passengers [4]. Ad hoc network study may lead to improved road safety, because efficient content delivery and in-time driver update can lead to avoidance of accidents. Collisions are avoided as routes dynamically change, leveraging timely updates about hazardous road conditions and on-going accidents. Furthermore, VANETs are used to monitor traffic congestion and suggest alternative routes, and various applications include information about the nearest gas station, automatic toll payment, etc.
Figure 1. Diagram of an ad hoc road network.
Electronics 12 02901 g001
Lack of real 5G vehicular datasets make a simulator appropriate for evaluating the performance of our scenarios for real-time automotive applications. Veins [5,6] employs IEEE 802.11p standard, which precisely captures frame timing, modulation, coding, and channel models [7]. Veins is also based on an optimized physical layer implementation that can carry out short-circuit evaluation of loss models for tasks like determining if received power surpasses a specified threshold, thus accelerating simulations by up to an order of magnitude [7]. Moreover, our implementation within Veins was not tailored to specific video codecs and packetizers. In our work, we integrate novel features into the pre-existing Veins realizations that model the proposed caching and content distribution policies. We also incorporate machine learning algorithms for distribution policies into the simulation framework, which, to the best of our knowledge, have not been integrated before, and use the respective metrics that we introduce for measurements.
Section 2 describes related research work. Section 3 models content caching and distribution policies for VANETs and describes the respective algorithms that we propose. Section 4 presents a case study of simulations. Section 5 presents and discusses the measurements associated with simulations. Section 6 concludes and mentions potential future extensions. The framework structure and instructions for installation of required programs are described in the Appendix A.

2. Related Work

Content delivery optimization refers to fixed [8] and self-organizing infrastructure [9,10]. A wide range of work addresses data collection, content caching and distribution especially for VANETs, e.g., in [11] Chaves et al. use an emulator to compare their system and the obtained results depict similar performance to Sprinkler V2V protocol and substantially better than BitTorrent. In [12], Luo et al. observe that an increase in the packet sending rate beyond a certain value results in a sharp increase in the average delay, and when the average length of vehicle buffer queues on a road segment surpasses a threshold value, they use alternate road segments to balance the network load. The decision about which content needs to be cached can be taken collectively, e.g., Kuo et al. [13] jointly optimize caching, computing and communication among vehicles and RSUs of the vehicular network to ensure quality of delivered videos.
Data homogeneity over the whole vehicular network along with increased copy costs suggest that the so-called ALWAYS caching in VANETs, where all incoming packets are cached in all nodes by default, is not the most effective strategy. Works that have proposed deviations from this strategy include the Leave Copy Everywhere (LCE) strategy [14] in V2V communication, where vehicles are treated as subscribers that consume data or nodes for caching, the PeRCeIVE approach [15], where proactive caching takes place near the consumer, and Information-Centric Network solutions that combine social collaboration mechanisms with improved media services [16]. An extensive comparison among various V2V protocols and our approach is not feasible, since the protocols were tested under different times, mobility and connectivity scenarios, and due to the presence of loading mechanism and existence of specific multimedia content codecs/packetizers in many cases.
Lack of real 5G vehicular datasets make a simulator appropriate for evaluating the performance of our scenarios for real-time automotive applications. Veins [5,6] employs IEEE 802.11p standard, which precisely captures frame timing, modulation, coding, and channel models [7].
Implemented simulators for evaluation of content distribution over VANETs include [17,18,19] and are often tailored to specific video codecs and packetizers, e.g., the simulator proposed in [20] compares the quality of MPEG4 video transmissions in terms of the peak signal-to-noise ratio (PSNR), jitter, loss rate, etc.
Veins is also based on an optimized physical layer implementation that can carry out short-circuit evaluation of loss models for tasks like determining if received power surpasses a specified threshold, thus accelerating simulations by up to an order of magnitude [7]. Moreover, our implementation within Veins was not tailored to specific video codecs and packetizers.
We augmented Veins simulation framework for VANETs with functions that efficiently implement various policies for content delivery over vehicular networks, so that network resilience and efficient content management are achieved. There is no mechanism for integrating multimedia content policies into Veins. The suggested extension includes the implementation of content sharing policies and mechanisms for sending and receiving multimedia content. Metrics were implemented to detect the most central nodes. Machine learning (ML) algorithms were implemented for selecting the most efficient content distribution. Use of ML approaches is corroborated by network softwarization advances, high dimensionality of vehicular raw data, and impediments during their collection. We conducted simulations and compared the results in terms of response times for different policies and centrality metrics.

3. Modeling and Algorithms

3.1. Simple Message Handling

Our simulations include two types of messages: Content messages and simple messages, the management of which differs significantly. Initially, for each simple incoming message a MessageData structure containing the message information is created and saved. For brevity, lists will still be referred to as message lists. There are two simple message storage lists: storedMessages and candidateMessages, the capacity of which depends on the network. Recent messages are stored in storedMessages and transferred to candidateMessages, when these messages are considered stale. The process of transferring old messages is carried out periodically. Data stored in storedMessages are sorted based on creation time (Figure 2). The Caching Policy defines which messages will be deleted, when new messages arrive and the maximum capacity is reached:
  • First In First Out (FIFO) sorts the list to delete based on the receivedAt field of the stored MessageData.
  • Least Recently Used (LRU). Every time we receive a message, we set that time to the last used time (field lastUsed of the MessageData structure) and if we are asked for this message again, the used time is refreshed. The list is sorted and we delete the specified number of messages with the smallest lastUsed value.
  • Least Frequently Used (LFU) determines which messages will be deleted based on their usage frequency (usedFrequency field of the MessageData structure).
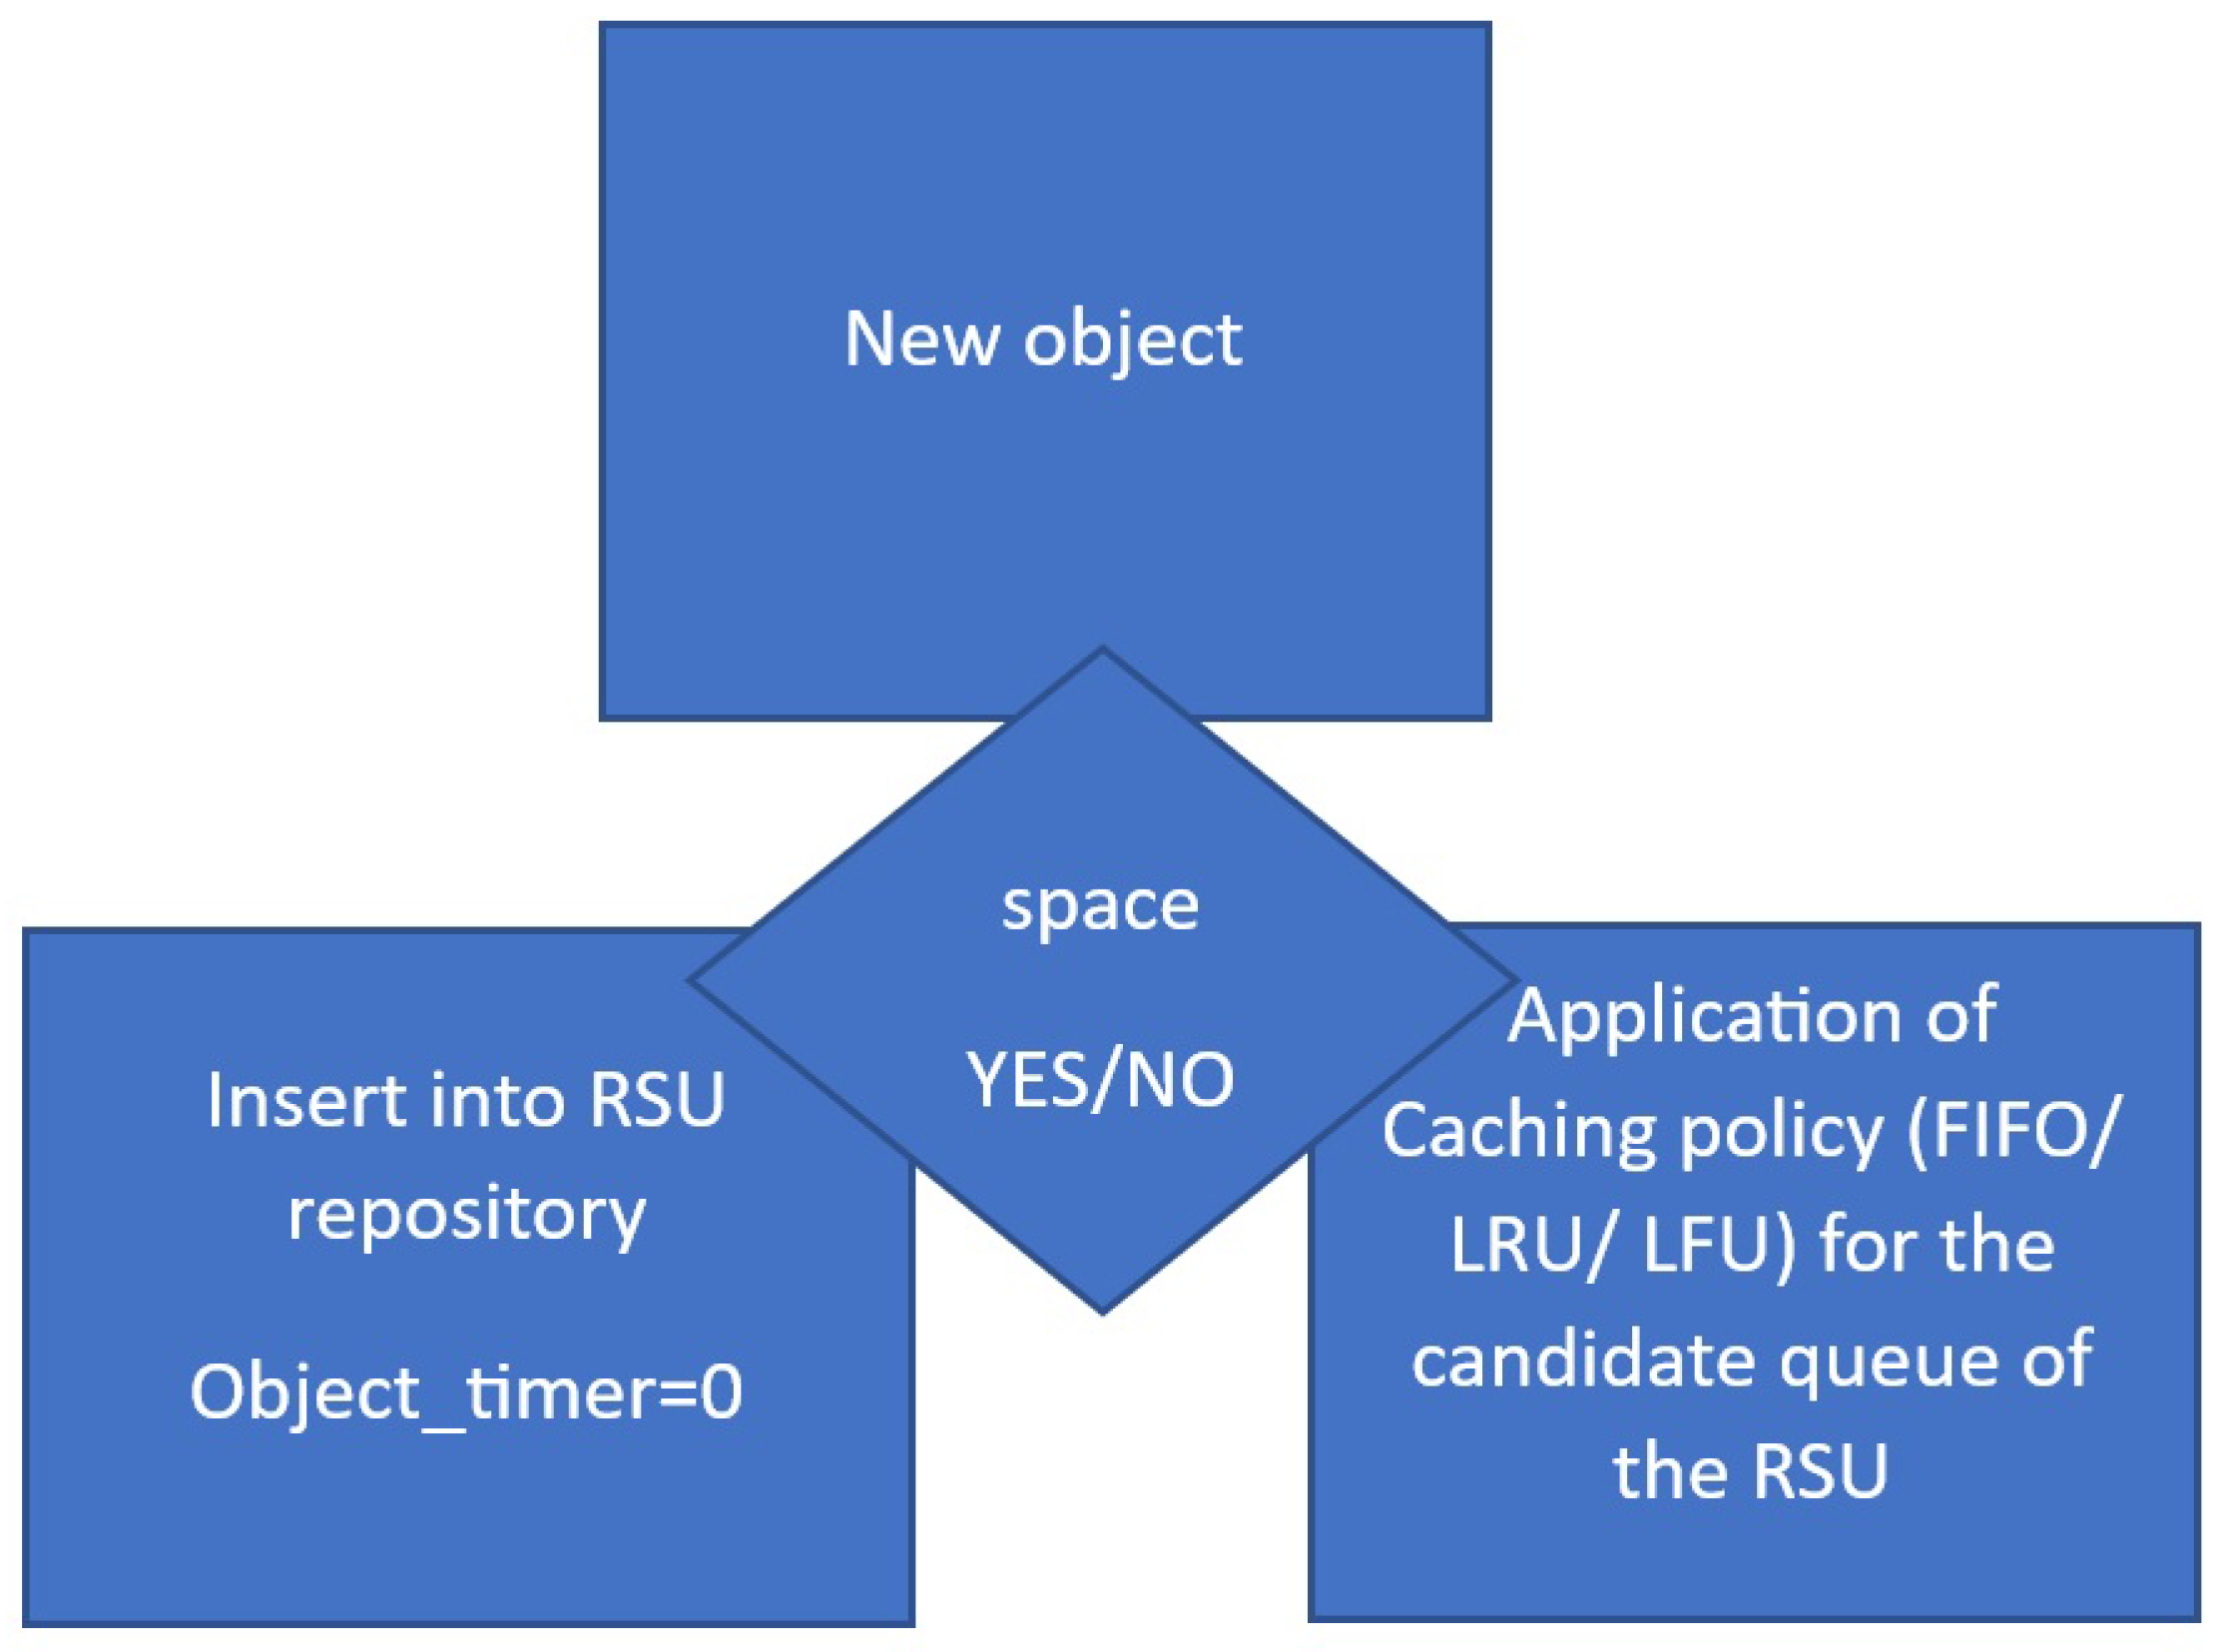
In case messages exist in candidateMessages and maximum capacity is reached, the size of candidateMessages is checked. If it is smaller than the selected number of messages we want to delete, we simply empty this list. Otherwise, the specified caching policy is applied. If candidateMessages has no messages and there is no more space to store, the algorithms are applied to storedMessages. So again, if the size of storedMessages is less than the number of messages to delete, we empty storedMessages list. Otherwise, we apply the selected caching policy and then, we resort storedMessages based on the timestamp field of the MessageData data stored in the list.
Figure 2. Simple and content message handling pipeline.
Electronics 12 02901 g002

3.2. Content Message Handling

The segmentedMessages list holds all accepted and stored content messages in such a way that all segments of the same message are located one after the other, from the message with the smallest segment number to the one with the largest. Also, this list does not have a maximum capacity, so we do not need to apply a caching policy.
After inserting the message into this list, a function is called to reconstruct the original message from the individual parts present in the list. From the received content message (fields Content ID, Segments, SegmentNumber and Multimedia), we extract the number of segments the overall message consists of and whether it is multimedia content or not. We then search segmentedMessages for the first occurrence of a message with the same Content ID, Segments and Multimedia as our message. Then we keep traversing the list, and, because of its structure, all parts of the same message must be contiguous.
When we have all the segments, we create a ContentWrapper. The Segments field within the ContentWrapper has the same value as the original message. The Content field of ContentWrapper is the recomposed string we constructed. We insert this message into a dictionary. The entry key is the ContentId of the original message and the entry value is the ContentWrapper. There are two dictionaries for storing content: In multimediaData we enter multimedia data content, and in roadData all the rest data entries. Finally, we delete all the segments that are still in the segmentedContent list, since we have now reconstructed the original content.

3.3. Shortest Paths

First, we define a dictionary as the routing table of a node A with keys other nodes’ addresses and values the minimum paths from node A to the node in the key. We take the path to examine and the address that exists in the last position of the path, assuming it is the address of node B. We then examine if that address exists in our routing table. If it exists, we compare the length of the path that is stored with the length of the path that exists in the path we examine, counting from the end of the path to the location where the address of node B exists. In the event that the length of the path we have stored in the routing table is shorter than the length of the path present in the message path, the function terminates. If the path we have stored in the routing table is greater than or equal to that of the message, we simply define the segment from the last position of the path to B as the minimum distance to the node B. We repeat this process until we reach the beginning of the path. For each update of the routing table we set a variable for each node with value equal to the time of the update.
Due to the nature of VANETs, the network topology changes rapidly and when a message arrives, old data in the table are emptied. However, the minimum paths between RSUs and the Origin are fixed. For this reason, there is a separate routing table for these routes. At the beginning of each simulation the Origin sends a special routing request to the RSUs and they in turn send other special routing requests. At the end of this process RSUs and Origin know all the optimal routes between them and these routes are used to quickly send messages.

3.4. Calculation of Network Metrics

VANETs can be simulated using the synthetic topology of random geometric graphs (RGGs): wireless ad hoc networks form links based on the geographical distance between nodes and in the case of VANETs this distance represents the range of the signal. In order to analyze an ad hoc network, snapshots of the network are captured at specific time points (Figure 3). These snapshots allow us to ignore the temporal variability of ad hoc networks and to apply social network analysis methods to these snapshots and investigate the VANETs, since we can construct the network graph from the snapshot, creating links according to signal range [2].
Initially, at specific time intervals, the Origin node, sends a request to the RSUs to start calculation. The RSUs forward this request to other RSUs and simultaneously send a centrality calculation request to the RSUs and vehicles in the network. They also schedule a message to be sent to themselves 10 s after receiving the request to start computation. The value of the State field of the message is Collecting. Messages with such State are used to finally compute the data we obtained from other nodes during the request and send that computation to the Origin. Additionally, the Centrality field of the launch request contains the type of centrality we want to calculate.
Figure 3. Topology snapshots of the VANET network at various time points. The content request for each screenshot was made at a different time, in order for us to obtain more varied measurements of the performance of each content sharing policy. The three request times with 20 RSUs were at time points: (a) t = 130 s, (b) t = 210 s and (c) t = 290 s.
Electronics 12 02901 g003

3.4.1. Degree Centrality

For degree centrality calculation (Algorithm 1), the requesting RSU sets the maximum number of hops of the message to 1, ensuring that the request will only reach the immediate neighbors of the node. Neighbor nodes in turn send a degree centrality response and the respective counter increases.
Algorithm 1 Degree Centrality Calculation
  • d e g r e e _ c e n t r a l i t y 0
  • RSU sends request with m a x H o p s = 1
  • Other nodes receive request and answer
  • d e g r e e number of answers received
  • RSU sends d e g r e e _ c e n t r a l i t y to Origin

3.4.2. Closeness Centrality

For closeness centrality calculation (Algorithm 2), the RSU that made the routing request sums the length of all paths present in its routing table and sends to the Origin the length of the routing table divided by this sum.
Algorithm 2 Closeness Centrality Calculation
  • c l o s e n e s s _ c e n t r a l i t y 0
  • RSU sends request with m a x H o p s n u m b e r _ o f _ n o d e s _ i n _ t h e _ n e t w o r k
  • Other nodes receive request and answer
  • Nodes forward the request to other nodes, updating traversed path
  • if traversed path is longer than path in the routing table then
  •     discard message
  • else
  •     update routing table with new shortest path
  • end if
  • c l o s e n e s s _ c e n t r a l i t y ( s u m _ o f _ a l l _ s h o r t e s t _ p a t h s ) / ( s i z e _ o f _ r o u t i n g _ t a b l e )
  • RSU sends c l o s e n e s s _ c e n t r a l i t y to Origin

3.4.3. Betweenness Centrality

For betweenness centrality calculation (Algorithm 3), each node that receives a calculation request forwards the request to each node in the network and then generates a routing request. Thus, each node in the network calculates its own routing table. The receivers of a betweenness centrality calculation request call the collection. This time, however, the Dest field of the collection message is not the address of the calling node itself, but, instead, that of the node that made the request for the centrality calculation. The function of this is twofold. First, this way the node knows which RSU made the request to send it the results. Second, RSUs are nodes that can both receive betweenness calculation requests and make such requests themselves. Thus, when the collection is called, if their address is different from the dest of the collection message, the function behaves differently. The way vehicles and RSUs are collected in the event that they are not collecting for a calculation request they themselves made is described: We loop through the routing table, and for each minimal path that contains the node listed in the Dest field of the collection message, we add 1 to a counter. At the end of this process we send a message with the result to the Dest node. Whenever the Dest node receives such a response to its request, it increments the value of a counter by the value of the message and in the collection, which takes place after a few seconds, sends this counter to Origin, while simultaneously clearing its routing table.
When the Origin receives the results, the Origin notifies the RSUs about the most central RSU in the network.
Algorithm 3: Betweenness Centrality Calculation
  • b e t w e e n n e s s _ c e n t r a l i t y 0
  • RSU sends request with m a x H o p s n u m b e r _ o f _ n o d e s _ i n _ t h e _ n e t w o r k
  • Other nodes receive request and begin calculating the shortest paths to other nodes
  • Nodes that receive the request also forward it to other nodes
  • if a node has calculated their routing table then
  •      r e s u l t ← number of times that requested RSU appears in a shortest path
  •     Send r e s u l t to the RSU
  •      b e t w e e n n e s s _ c e n t r a l i t y b e t w e e n n e s s _ c e n t r a l i t y + r e s u l t
  •     RSU sends b e t w e e n n e s s _ c e n t r a l i t y to Origin
  • end if

3.5. Machine Learning

We determine the most crucial RSUs for content dissemination introducing machine learning algorithms for VANETs. The main advantage of this method is the fact that it does not burden the network, as centrality calculation does, because there is no need to detect paths.
The algorithms detect clusters of vehicles taking as input their position on the x-axis, their position on the y-axis, their speed and direction. Each algorithm takes this data and creates 3 clusters. The algorithms used in this paper are K-Means (Algorithm 4) and Agglomerative Clustering (Algorithm 5). Agglomerative Clustering for VANETs belongs to the category of hierarchical clustering algorithms (Hierarchical Clustering). We start with n clusters, one for each point in our data set. Then, depending on the parameters set, we successively join clusters of elements with the shortest distance, gradually forming a tree from bottom to top. Its main difference from K-Means is that the distance between two points calculated by K-Means is always their Euclidean distance, whereas this is not the case in Agglomerative Clustering, where we can we choose in advance which metric will be used.
In order to apply the selected machine learning algorithm, we have to extract at certain time intervals the characteristics of the vehicles we are interested in. Therefore, a vehicle connected to TraCIMobility module of SUMO undertakes to write in the form (PosX, PosY, Speed, Direction) the coordinates, speed and direction of all vehicles located in the network (vehicles.csv file).
The machine learning algorithm writes its results to cluster_centers.csv and deletes vehicles.csv. The results written by the machine learning algorithm form a list, each node of which contains a pair of coordinates x and y corresponding to the center of each cluster created. Once the machine learning algorithm terminates, we resume the simulation. Origin periodically checks if the file cluster_centers.csv exists and if it does, it extracts the data. Then, it compares the coordinates of each cluster with the coordinates of the RSUs present in the network, and the RSUs with the shortest distance from each cluster are the most central ones. Once this calculation of the most important RSUs is done, the network is updated with the same procedure described in the centrality calculation section.
Algorithm 4: K-Means for VANETs
  • The algorithm reads the v e h i c l e s . c s v file
  • A dataframe is created with the columns P o s i t i o n X , P o s i t i o n Y , S p e e d , D i r e c t i o n
  • The data from the dataframe is fitted to the K-Means model
  • The model clusters the data based on the four-dimensional distance between objects
  • The centroids of the clusters are extracted
  • These centroids are inserted in the new dataframe r e s u l t
  • The results are written in the new c l u s t e r _ c e n t e r s . c s v file
Algorithm 5: Agglomerative Clustering for VANETs
  • The algorithm reads the v e h i c l e s . c s v file
  • A dataframe is created with the columns P o s i t i o n X , P o s i t i o n Y , S p e e d , D i r e c t i o n
  • m e t r i c c o s i n e
  • l i n k a g e a v e r a g e
  • The data from the dataframe is fitted to the Agglomerate Clustering model
  • Each node from the original dataframe gets labeled
  • We calculate each centroid by finding the average coordinates of the vehicles in each cluster
  • The results are written in the new c l u s t e r _ c e n t e r s . c s v file

4. Case Study–Simulations

4.1. Content Sharing Policies

There are two content sharing policies in our simulations:
  • Pull: When a resource is requested from the RSU, the RSU checks if it has it and if it does not, it forwards the request to the Origin and copies content to its cache as well. Therefore, the object is copied to the RSU the first time it is requested.
  • Push: Push policy copies content from Origin to RSUs proactively, before even the content is requested.
Case study includes simulations for various time points (Figure 3) and increasing number of RSUs. All possible combinations of content sharing policies, machine learning algorithms and centralities are taken into account for the produced simulation scenarios. For the purposes of this work, 120 simulations (240 in total) were performed for each of the 2 data sharing policies. More specifically, requests were sent at 3 different times from different vehicles, so that we obtained different topologies and, consequently, different metric results. Simulations were also performed for both Push and Pull content sharing policies and for each of the 3 centralities and 2 machine learning algorithms implemented. The caching policy FIFO was used. In our simulations, there are up to 100 vehicles that periodically enter the network and at time 83 accidents start to occur in the network. These accidents change the routes followed by the vehicles in the network, changing their topology. It is worth adding that in each message sending there is a random delay, that follows a uniform distribution and is in the field (0.01, 0.5) seconds, along with other fixed delays. Still, there is a case of rejecting a message, which is influenced by various factors that fall within the scope of this paper.

4.2. Content Message Storage

For each message segment that we obtain, we traverse the segmentedContent list. If we find a segment from the same original message, i.e., it has the same ContentId, Segments and Multimedia, we check its SegmentNumber. If we have a smaller segment number, we insert our message in that position, and return a message about successful insertion. But if we have the same segment number, the function terminates. If our message has a higher segment number, we proceed to the next position and compare again. The next message we compare may not be from the same original message, so we stop the search and place it there. If no other segment of the original message is found, we place our message at the end of segmentedMessages.

4.3. Message Acceptance

An important function, called every time a node receives a message, is a function that checks whether a message will be accepted or not. First, we check if the creator of the message we received is the sender. In this case the message is rejected directly. Then there is a check for the Recipient field, namely, if a direct recipient has been specified and its address is not the same as the address of the node that received the message, the message is ignored. We also define two variables, insertion and update with an initial value set as false. As a first step, we obtain the value of the OriginMessage field. If it is false and the routing table was last updated at least 20 s ago, the table is flushed.
Next, we check the UpdatePaths value of the message. If its value is true, we extract Route and PreviousNodes from the message. If Route is not empty and contains the address of the node that received the message, it means that the message went round, which we do not want in minimum path finding functions, so we discard the message. Next, we call the function that updates the minimal paths. It is first called for Route, if it is not empty, and if it returns false, the message is discarded. Otherwise, we make the variable update equal to true. The same procedure is followed for PreviousNodes.
We check next the capacity of simple messages. If the total number of messages in storedMessages and candidateMessages equals or exceeds the maximum capacity, the message delete function is called.
Finally, depending on whether it is a content message or not, the corresponding insertion function is called, the result of which (false or true) is inserted into the insertion variable. A message is therefore accepted provided that one of the variables update, insertion is true. This happens because two messages with different Route may have the same other elements, so they will not be accepted by the import function. But they might have a better path than what already exists, so the update variable will be true and we want the message to be accepted. Accordingly, the variable update is initially set to false, and in the event that either Route, PreviousNodes is empty, or UpdatePaths is false, it will remain so until the end of the function, but we may have a message that should be inserted into the message list.

4.4. Transmission Confirmation

For content messages, it is important to have a way for the node sending the content to know that its messages have successfully reached their destination. When a node wants to send a content message, the following procedure takes place: First, we insert into pendingAck vector the content message to be sent in the form of MessageData. We then send a self-message after 5 s, which has in the field State the value Repeating and in the fields ContentId, Segments, SegmentId and Multimedia the values of the content message we are going to send. When a node receives an auto-message with this value in the State field, it looks for pendingAck and if it finds a message there that has the same content characteristics as the auto-message, it resends it and reschedules same self-message 5 s later. Every time it resends a pendingAck message, it increments the attempts field by 1. When it exceeds the limit we have set, this message is automatically deleted.
At the same time, when a node receives a content message, it sends a confirmation message with the characteristics of this message. When the node that sent the content receives an acknowledgment message, it deletes the content message described by the acknowledgment from the pendingAck table.

5. Measurements of Simulations

The results are categorised based on the number of involved most central RSUs and the time points of the content requests. There are two broad categories of measurements, including transmission of single segment and of multiple segment multimedia content.

5.1. Single Segment Multimedia Content
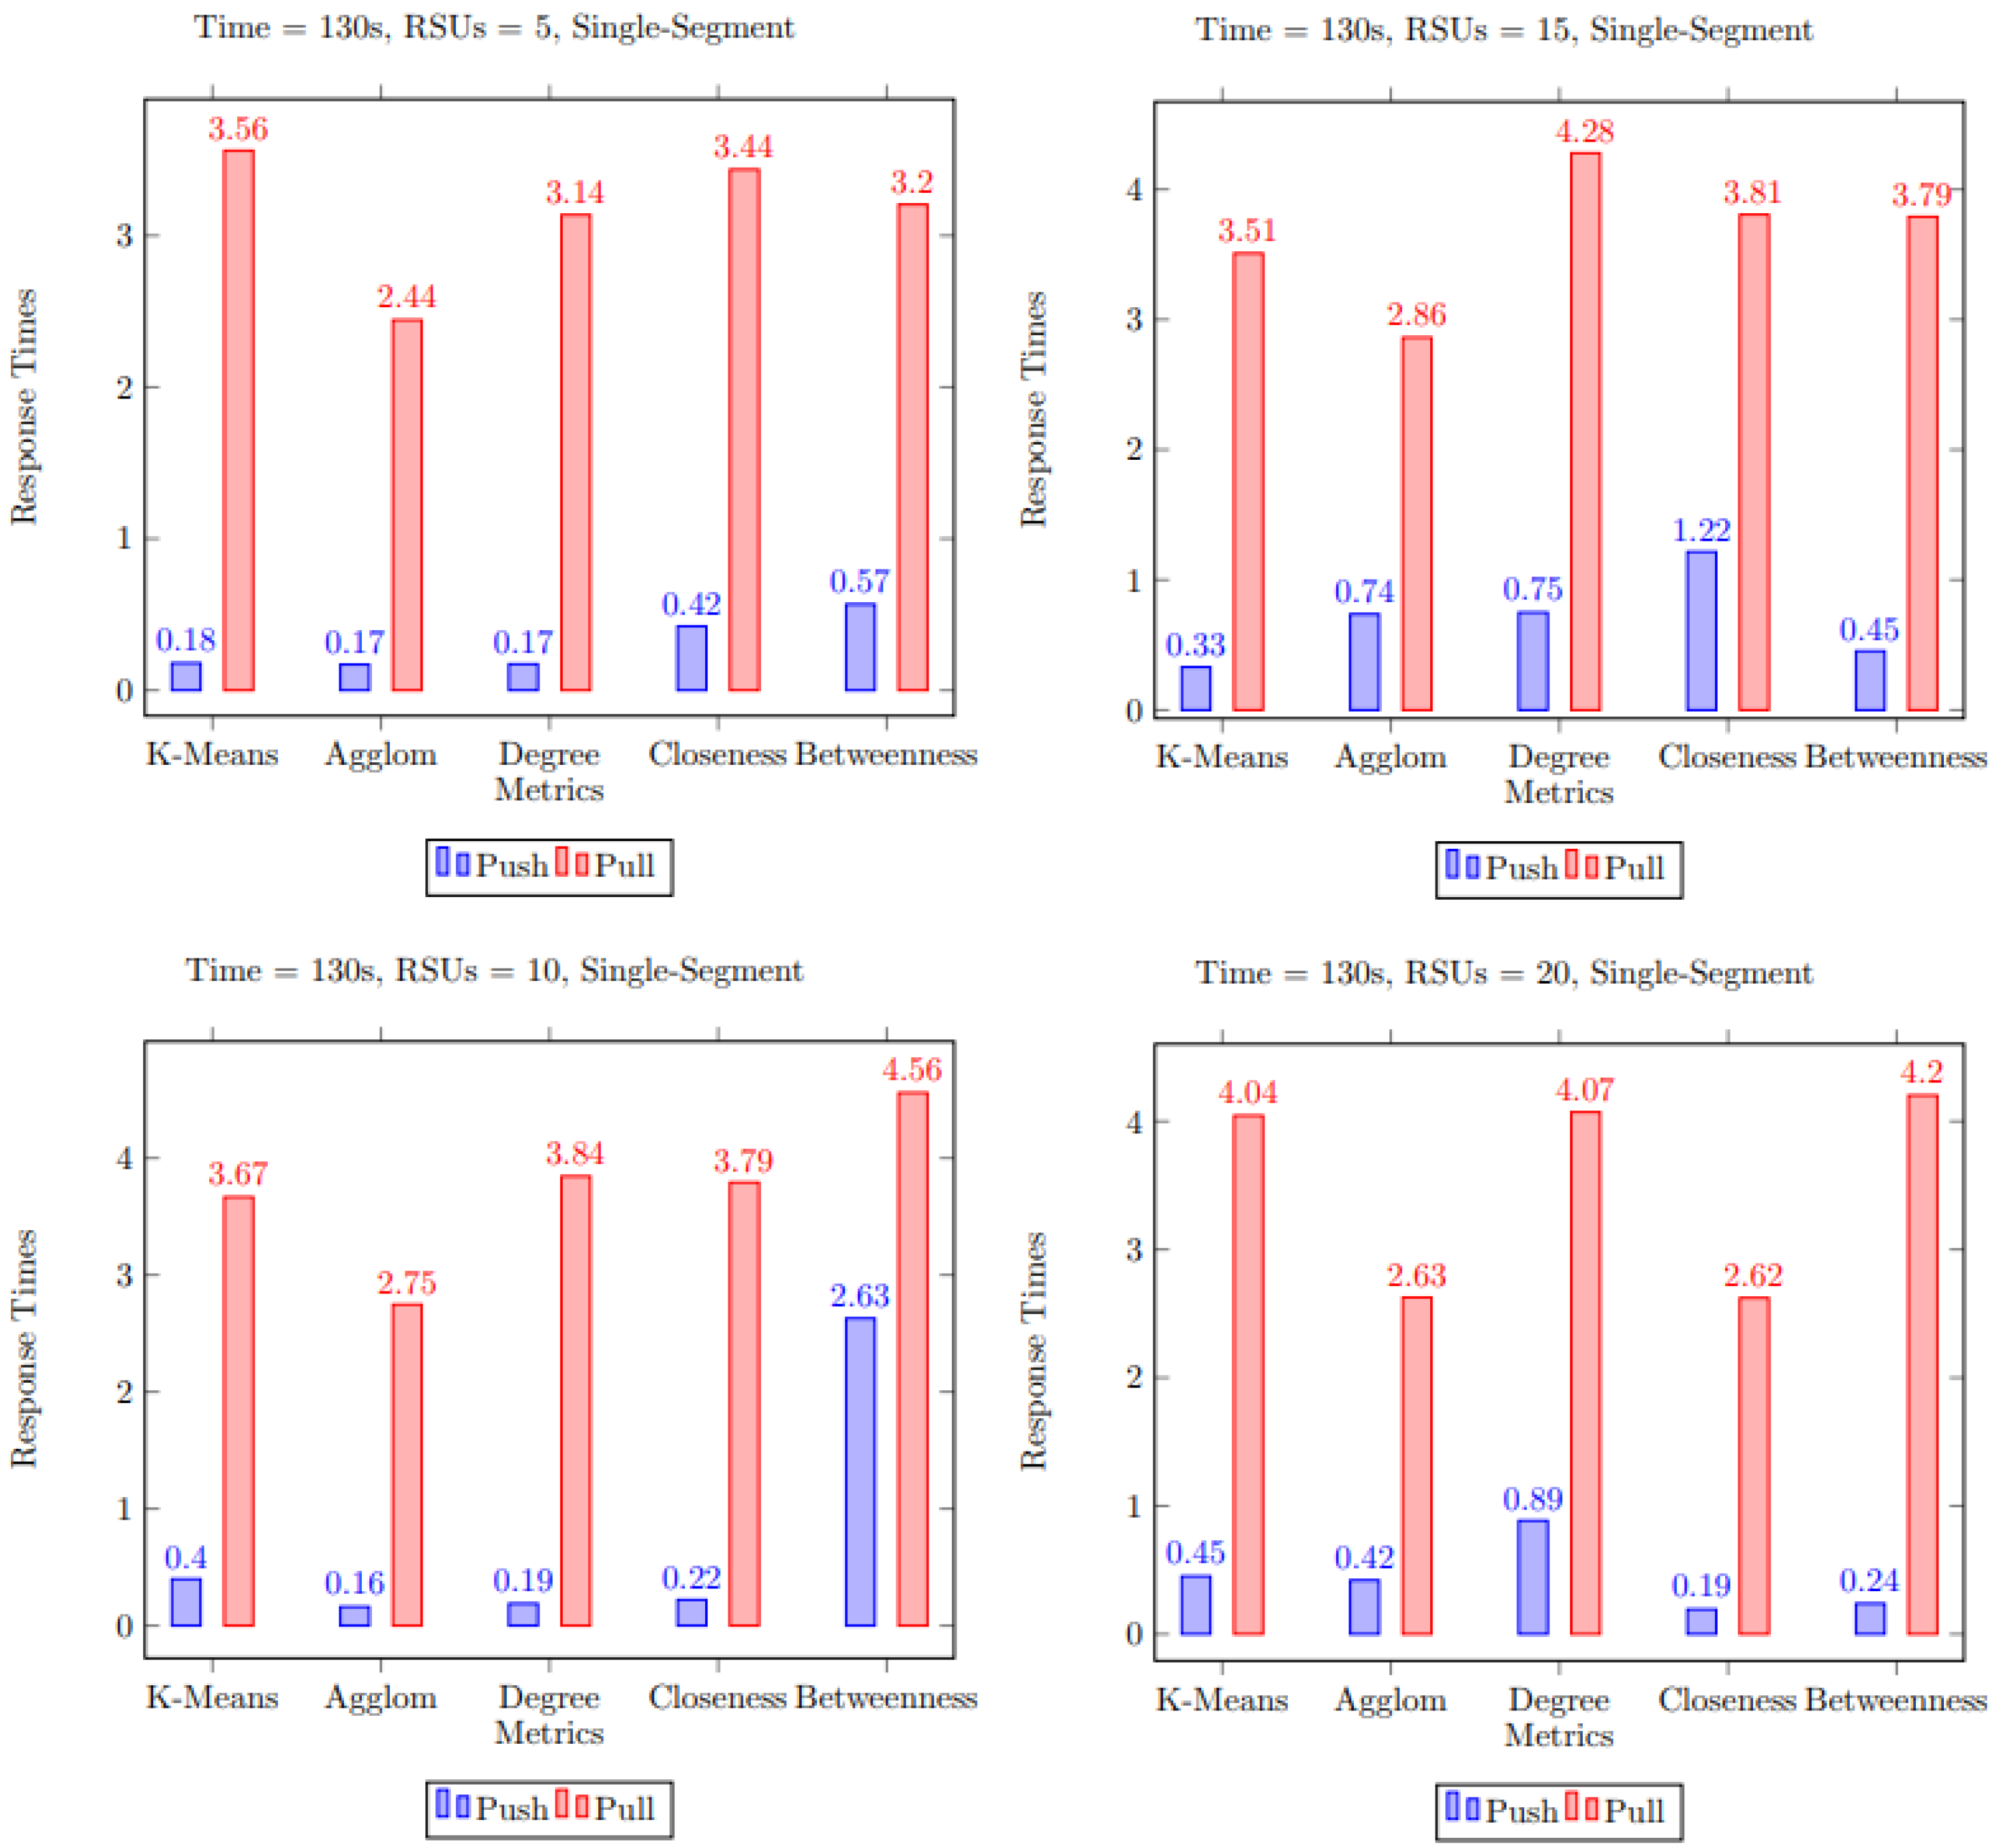
We notice in Figure 4 that for a number of RSUs equal to 5, the machine learning algorithm Agglomerative Clustering has a better response for both policies. Here, for RSU Count = 10, we see that Agglomerative Clustering again outperforms both Push and Pull policies. This time, for RSU number equal to 15, K-Means performs better in Push policy, while Agglomerative Clustering performs in Pull. In the case where we have 20 RSUs, the Closeness Centrality metric has a better overall performance.
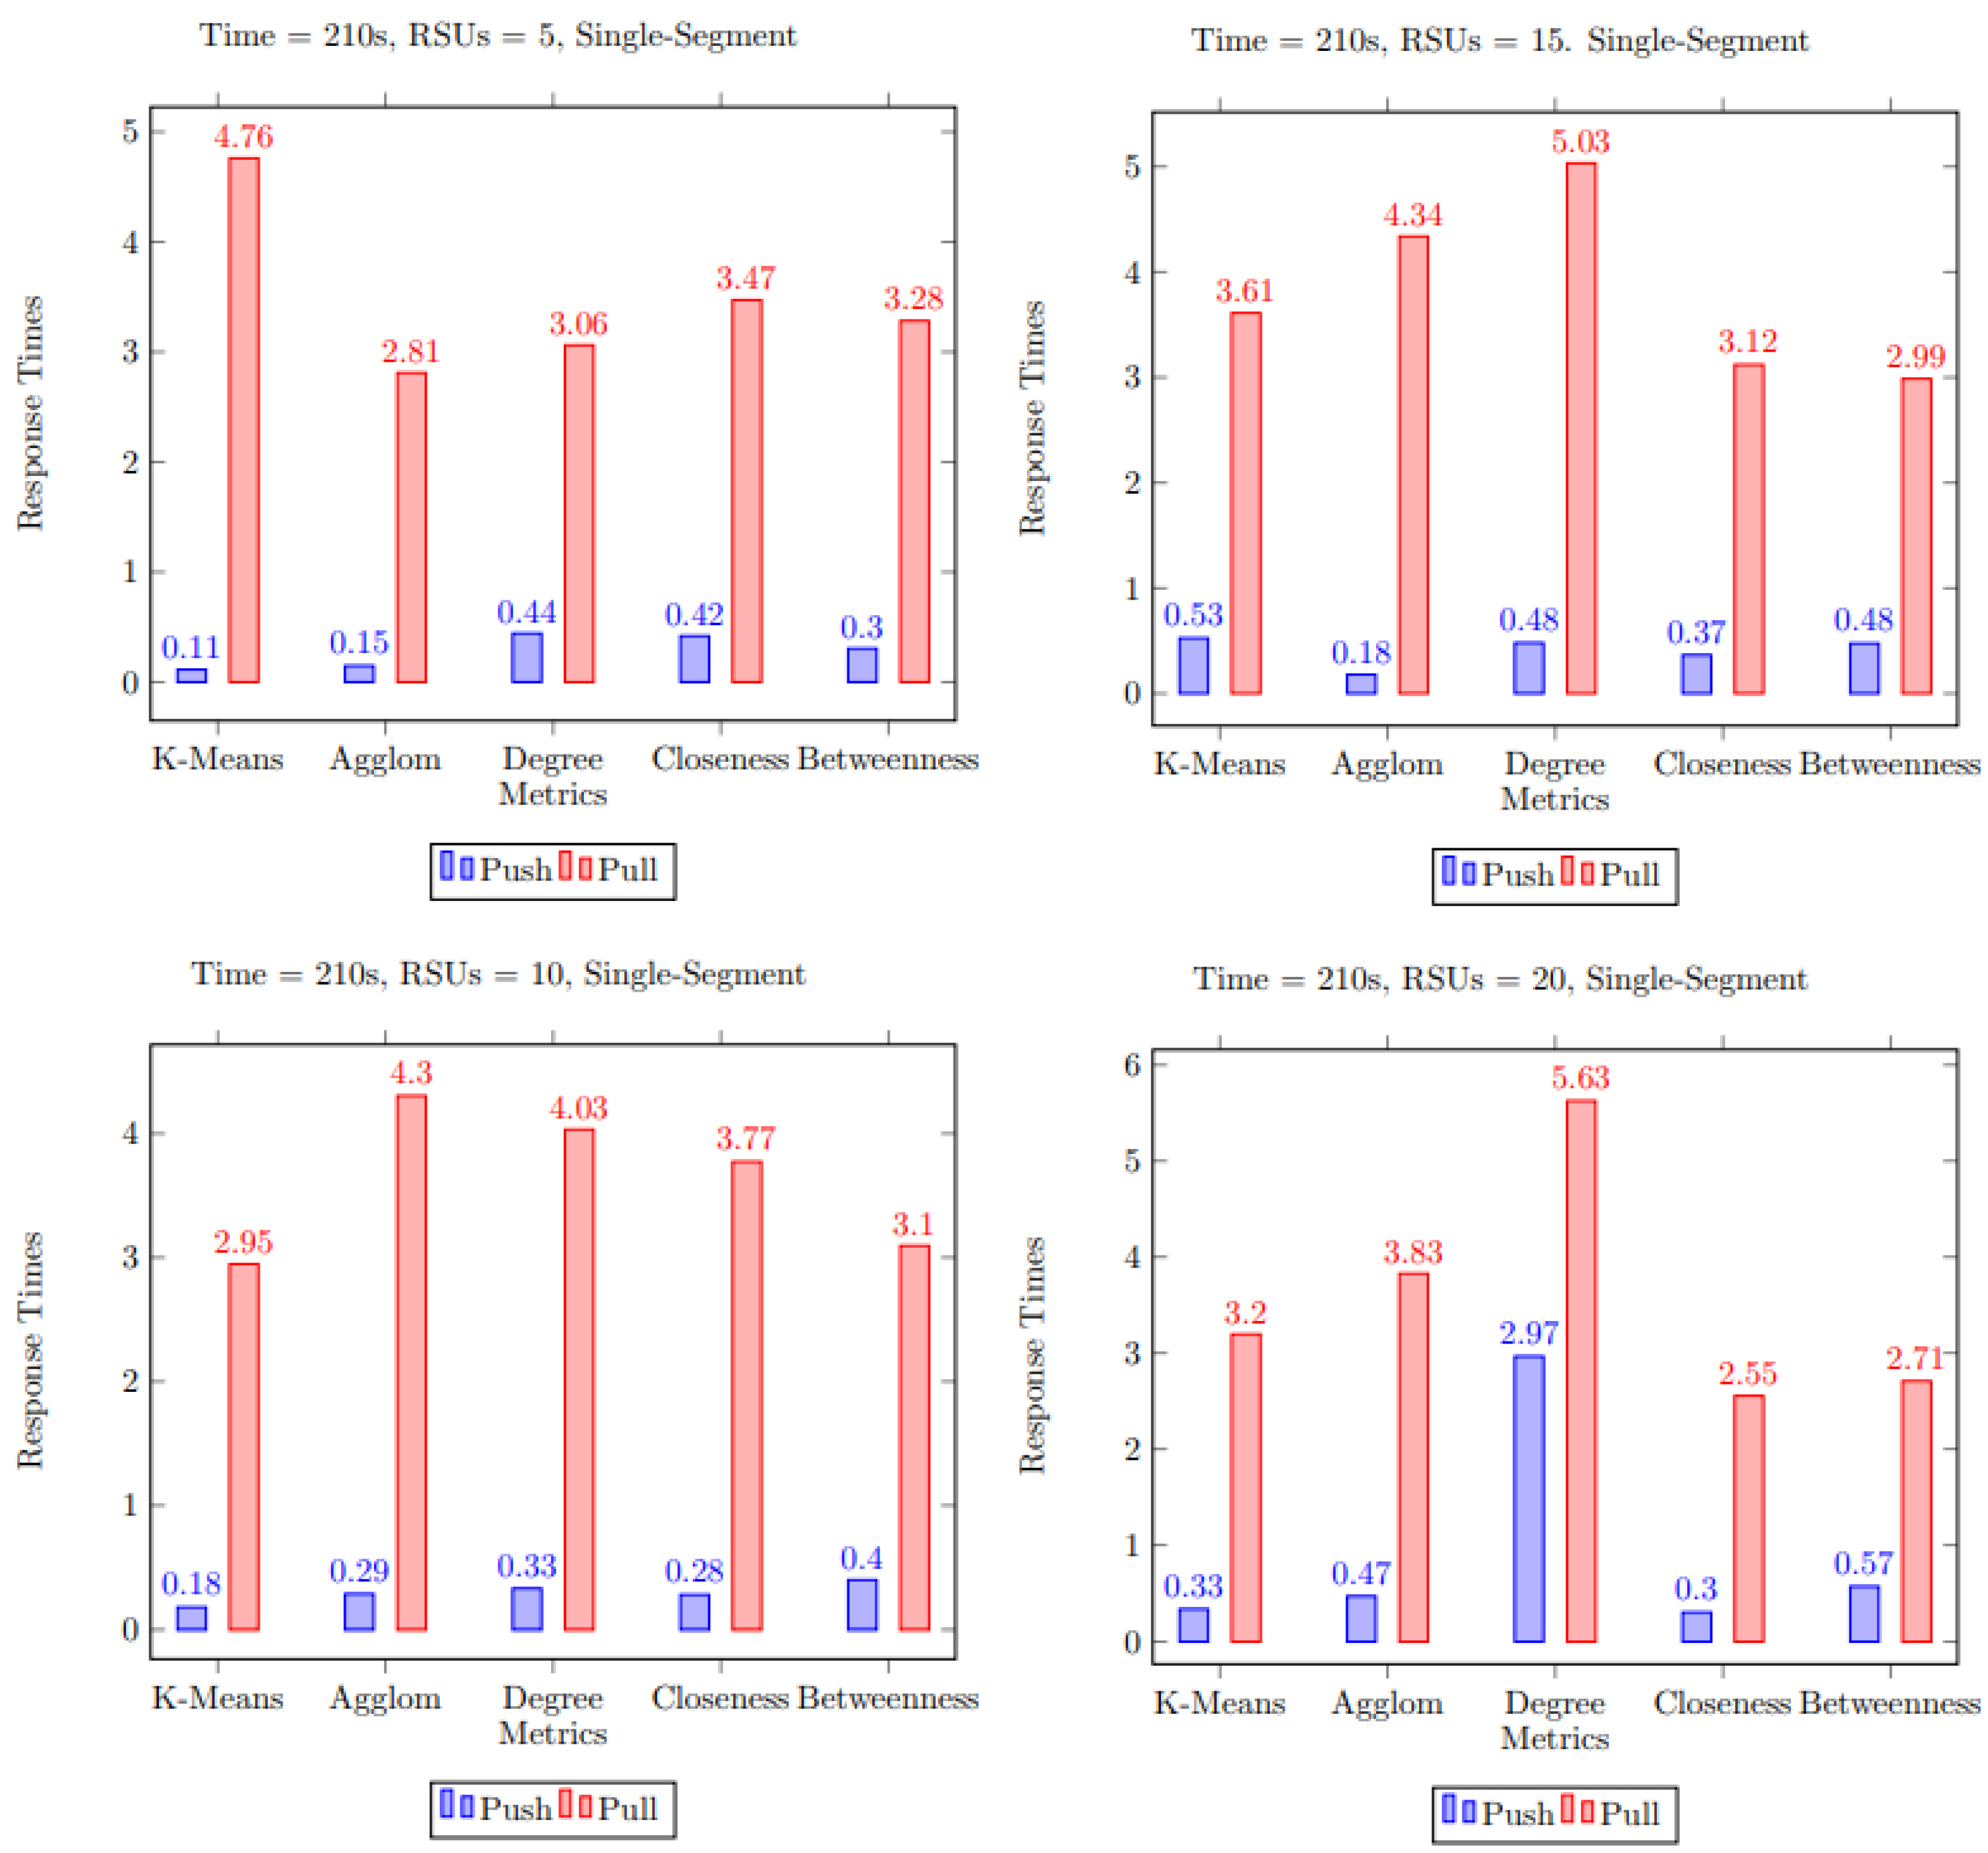
For request time point 210 (Figure 5) and 5 most central RSUs the best performance in the Push policy is given by the machine learning algorithm K-Means, while for the Pull policy Agglomerative Clustering for VANETs performs best. For 10 RSUs K-Means performs better for both policies. For 15 RSUs Agglomerative Clustering depicts a better performance in Push Policy and Betweenness Centrality in Pull. For 20 RSUs the Closeness Centrality metric performs better.
Figure 4. Response times for 5, 10, 15 and 20 most central RSUs, where copying of single segment multimedia content takes place for both content sharing policies and all ML and centrality calculation algorithms, and for request timestamp = 130.
Electronics 12 02901 g004
For request time point 290 (Figure 6) in the case of 5 most central RSUs for copying, we observe that K-Means for VANETs has the best performance in the case of Push policy and Agglomerative Clustering for VANETs performs best in the case of Pull policy. For 10 RSUs we notice that K-Means performs better for both content sharing policies and Degree Centrality depicts delays. For 15 RSUs we observe that Betweenness Centrality performs best in the Push policy, while Agglomerative Clustering performs best in the Pull policy. For 20 RSUs we observe that Agglomerative Clustering has the best performance for the Push policy, while Closeness Centrality performs best for the Pull policy. We notice again that Degree Centrality performs poorly when the Push policy is applied.

5.2. Multiple Segment Multimedia Content
It should be noted that due to the random delays that exist when sending parts of the content, various algorithms may depict best response times for the first segment, but not for the entire message. Also, for the sake of variety of measurements, the fixed delay with which the request is sent differs from the case of the single segment multimedia content.
For time point 130 (Figure 7) and copying of content in the 5 most central RSUs we see that for the first segment, Closeness Centrality depicts best performance time for Push policy, while Betweenness Centrality performs best in the case of Pull content sharing policy. For message completion Agglomerative Clustering has better performance time for Push policy and Betweenness Centrality for Pull. For 10 RSUs we observe that for the first segment K-Means depicts the best performance time for Push policy and Closeness Centrality for Pull policy. For message completion Agglomerative Clustering performs best in terms of time for the Push policy and Closeness Centrality for Pull. In the case of 15 RSUs, for the first segment Betweenness Centrality depicts the best performance for the Push policy and K-Means for Pull. For message completion, Agglomerative Clustering shows best performance for Push policy and Betweenness Centrality for Pull policy. For 20 RSUs we observe that for the first part, the best performance time in Push policy is depicted by K-Means, while in the Pull approach by Closeness Centrality. For message completion, K-Means has the best performance for the Push policy and Closeness Centrality performs again best for Pull policy.
Figure 5. Response times for 5, 10, 15 and 20 most central RSUs, where copying of single segment multimedia content takes place for both content sharing policies and all ML and centrality calculation algorithms, and for request timestamp = 210.
Electronics 12 02901 g005
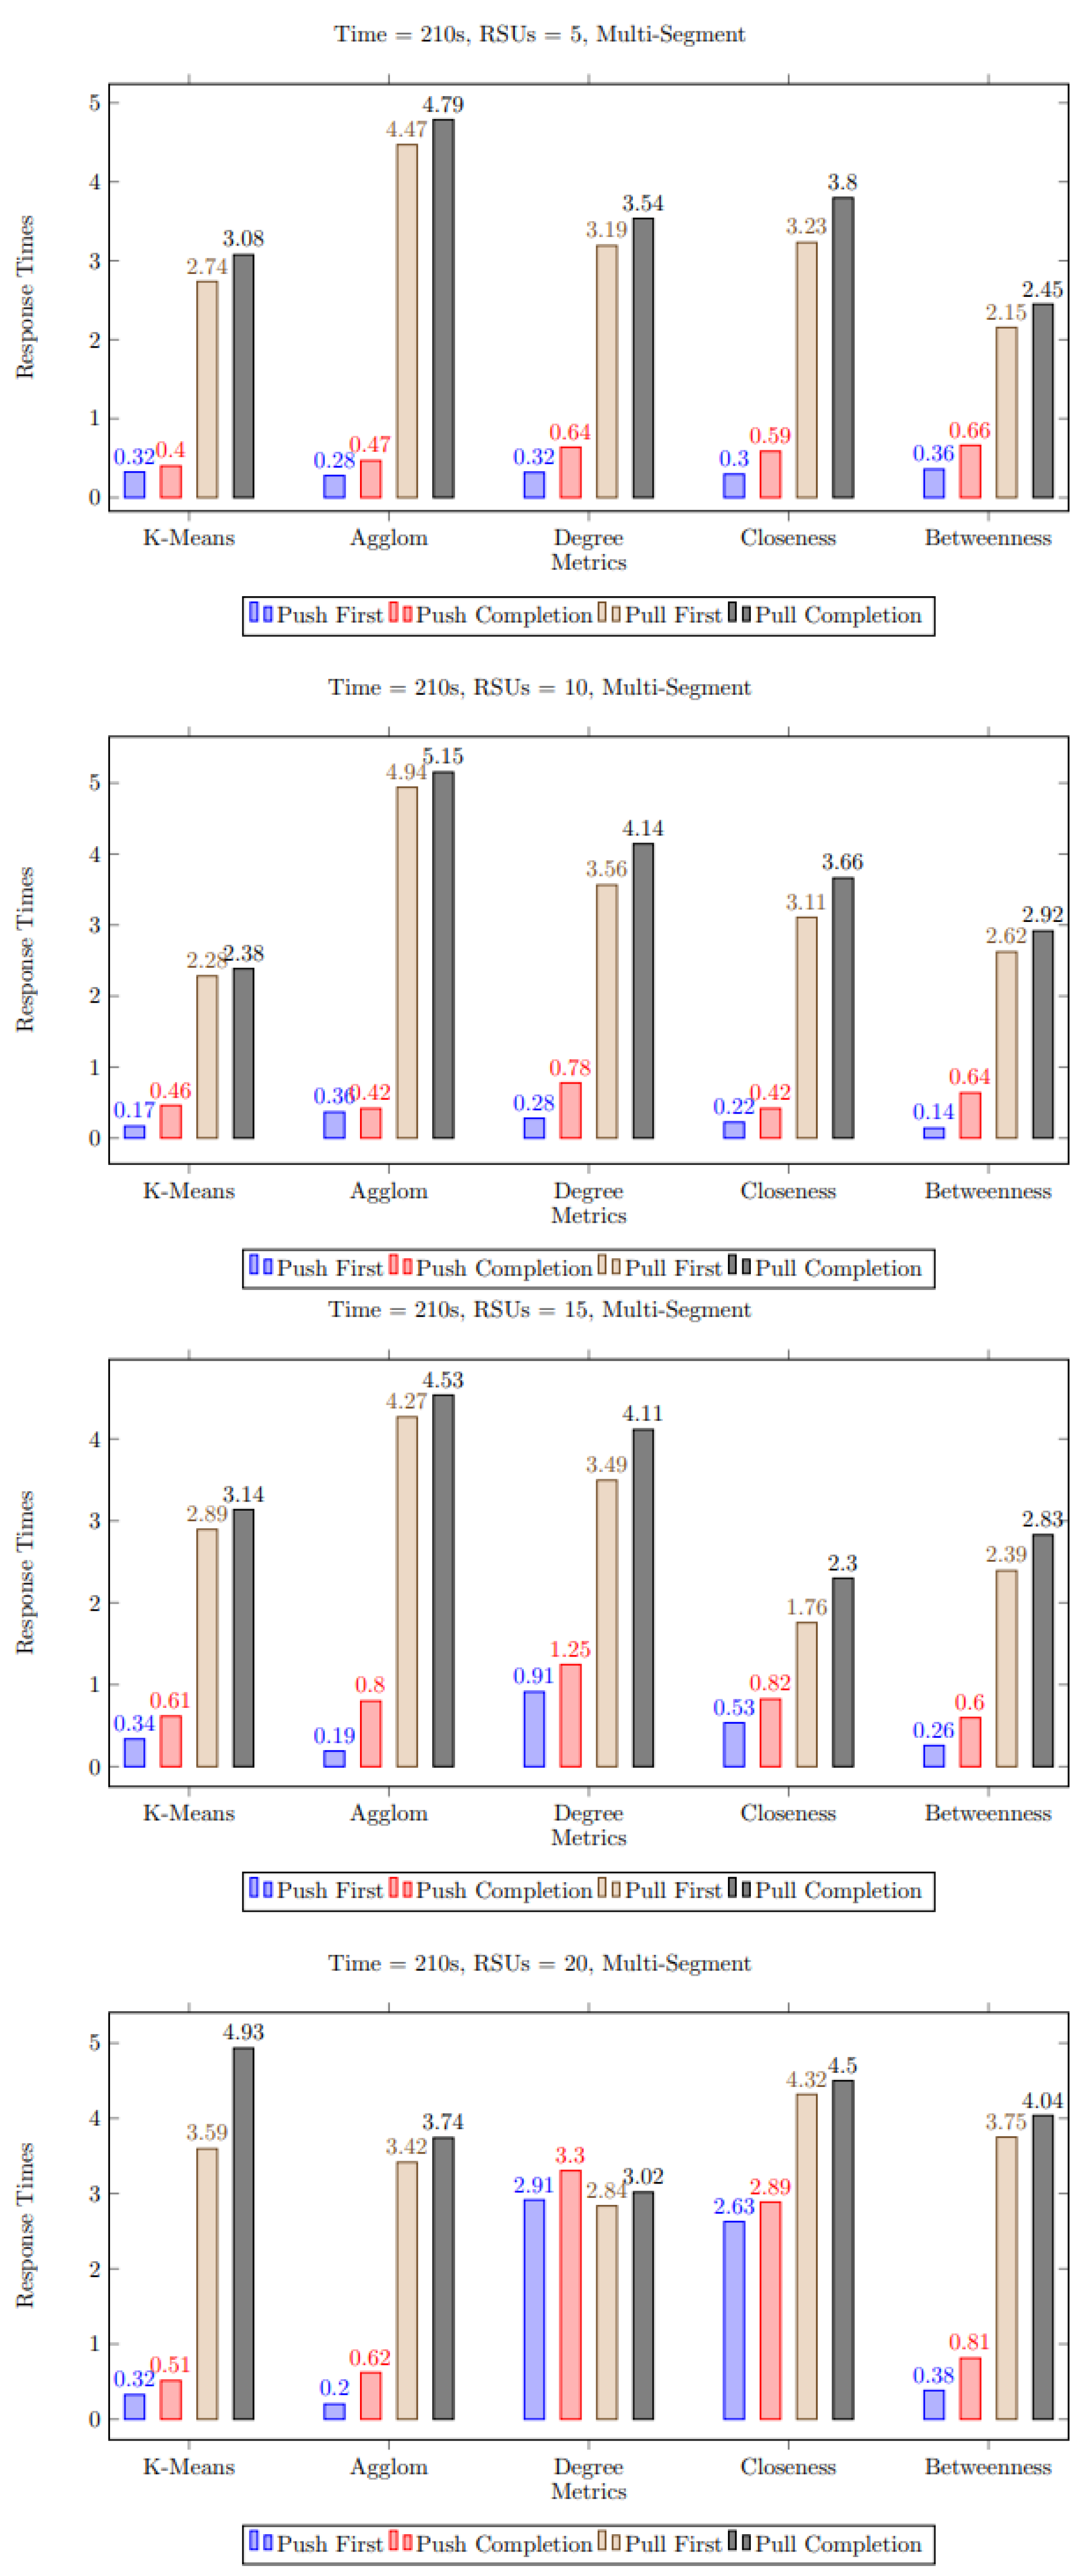
For request time point 210 (Figure 8) and for 5 RSUs, Agglomerative Clustering has the best performance for the first segment for Push and Betweenness Centrality performs best for Pull content sharing policy. For message completion, K-Means has the best performance time for Push policy, while Betweenness Centrality performs best for Push. For 10 RSUs we observe that for the first segment Betweenness Centrality has the best performance time for both policies. For message completion Agglomerative Clustering has best performance time for Push policy and K-means performs best for Pull policy. For 15 RSUs we notice that for the first segment Betweenness Centrality depicts the best performance time for the Push policy and Closeness Centrality performs best for Pull. For message completion K-Means has the best performance time for Push policy, while Closeness Centrality has again best response time for Pull. Regarding the case of 20 RSU at time 210, for the first segment, the best performance time in the Push policy is given by Agglomerative Clustering for VANETs and by it is enDegree Centrality for Pull. To complete the message, K-Means has the best performance time for the Push policy and Degree Centrality performs best for Pull. It is worth noting, that at this point we can observe a rare case when the response times of Push policy surpass that of Pull for Degree Centrality. This can happen due to a variety of reasons, e.g., random delays, message discardings, or choosing a host RSU too far away from the node that requested the message.
For request time point 290 (Figure 9) and for 5 RSUs, the best performance time for the Push policy is depicted by Agglomerative Clustering for VANETs, while Betweenness Centrality outperforms other approaches for Pull. For message completion, K-Means has the best performance time for Push policy and Betweenness Centrality performs again best for Pull. For 10 RSUs at time 290, the best performance time in the Push policy appears in the case of Agglomerative Clustering, while Closeness Centrality gives best response time for Pull. For message completion, Agglomerative Clustering has the best performance time in the case of Push policy, while Closeness Centrality performs best again forPull. In the case of 15 RSUs, Agglomerative Clustering has the best performance time for Push policy and Betweenness Centrality for Pull. To complete the message, Betwenness Centrality has best performance time in both policies. In the last case, Betweenness Centrality has the best performance time in the Push policy scenario, while K-Means for VANETs outperforms other approaches for Pull. For message completion, K-Means has better throughput time in both policies.
Figure 6. Response times for 5, 10, 15 and 20 most central RSUs, where copying of single segment multimedia content takes place for both content sharing policies and all ML and centrality calculation algorithms, and for request timestamp = 290.
Electronics 12 02901 g006
Figure 7. Response times for 5, 10, 15 and 20 most central RSUs, where copying of multiple segment multimedia content takes place for both content sharing policies and all ML and centrality calculation algorithms, and for request timestamp = 130.
Electronics 12 02901 g007
Figure 8. Response times for 5, 10, 15 and 20 most central RSUs, where copying of multiple segment multimedia content takes place for both content sharing policies and all ML and centrality calculation algorithms, and for request timestamp = 210.
Electronics 12 02901 g008
Figure 9. Response times for 5, 10, 15 and 20 most central RSUs, where copying of multiple segment multimedia content takes place for both content sharing policies and all ML and centrality calculation algorithms, and for request timestamp = 290.
Electronics 12 02901 g009

5.3. Discussion of Simulation Results

The presented aforementioned measurements concern the response time, i.e., the time from the creation of the request to the receipt of the response. Simulations were based on single segment and multiple segment multimedia content requests. For multi-part data, additionally to the response time, the time when the requesting vehicle received the first part of the response is recorded.
There is no generic conclusion derived about the most feasible metric due to a number of parameters. Some of these parameters include: random delay while sending the message, the position of the vehicle requesting content and the message rejection possibility. We can say, though, that when we use the machine learning algorithms we adapted for VANETs, we obtain better response times compared to centrality measurement schemes. Moreover, the reduced times for implementation of machine learning algorithms and the reduced network congestion as there is no need to calculate shortest paths (as in closeness and betweenness centrality) make the proposed algorithms appear as a good solution for finding the most central RSUs.
We notice also that, regarding Push and Pull content delivery policies, Push is much quicker, but leads to network congestion, since content is proactively sent to the most central RSUs and may not be finally consumed.

6. Conclusions

To sum up, we focused on aforementioned measurements and their comparison. The functions of the simulator were extended, so that multimedia content could be sent and various metrics were calculated. We implemented machine learning algorithms adapted to VANETs and compared their performance.
We observe that the machine learning algorithms we adapted for VANETs perform better than centrality measurement schemes in terms of request times. Moreover, the reduced times for implementation of machine learning algorithms and the reduced network congestion make the proposed algorithms appear as a good solution for finding the most central RSUs. Concerning Push and Pull content sharing policies, Push is much quicker, but leads to network congestion, since content is proactively sent to the most central RSUs and may not be finally consumed.
The code extension of Veins allows for easy execution of a simulation scenario with the introduction of the required parameters. Future improvements include a GUI development for the efficient batch execution of simulations. Concurrently, this GUI could provide choices that modify certain simulation features (such as the stored content at the simulation start or the node that originally makes the request). Future extension includes augmentation of multimedia files with additional specific multimedia features, e.g., additionally to ID and its segments, information adapted to its specific type (video or map), fps, etc.

Author Contributions

Conceptualization, methodology, validation and formal analysis: I.K.; software and data curation, N.A.; writing—original draft, I.K.; review and editing, S.P. and I.K.; visualization, I.K. and N.A.; supervision, S.P. and I.K. All authors have read and agreed to the published version of the manuscript.

Funding

This research received no external funding.

Data Availability Statement

Code and data are available at: https://github.com/nickastrin/VANETs-Project (accessed on 25 May 2023).

Conflicts of Interest

The authors declare no conflict of interest.

Appendix A. Veins

Veins is an open-source framework for road network simulations. Veins extends OMNET++, a modular C++ based library, and Simulation of Urban MObility (SUMO), an open-source program, which allows the simulation of road network traffic with various vehicles and pedestrians and importing networks in a plethora of file formats.
In this context many simulation models are provided. The choice of models to be used in each simulation is determined by the user depending on his/her needs [7]. To use Veins properly, the network simulator built with OMNET++ and the road traffic simulator SUMO [21] must be running. These two simulators communicate with one TCP socket and the TraCI protocol is used. In this way, OMNET++ and SUMO combination matches the movement of vehicles in the road traffic simulator with the movement of nodes in the [7] network simulation.
At this point, our implementation will be presented. It is worth noting that the code written extends the example that comes with Veins, an example that uses the map of the university of Erlangen in Nuremberg to simulate road traffic through SUMO.
The nodes of our network are vehicles (cars), static RSUs and an Origin.

Appendix A.1. Simulation Files

Starting with code written in C++, there are four main files and their corresponding headers. Note that for each of them, there is also a corresponding NED file used to declare the class in OMNET++. There follow the files:
  • UnitHandler. This file is the “parent” class used by every node in the network. It contains mostly basic functions used by all child classes, such as the function that handles how to send messages. The UnitHandler class definition is a subclass from the DemoBaseApplLayer class, which is present in the example that comes with Veins.
  • OriginHandler. OriginHandler is the class that defines the behavior of Origin nodes and adds some functions exclusively for them, e.g., the function that instructs the RSUs to calculate the centrality requested by the Origin.
  • RsuHandler. This class, in turn, contains functions that describe how RSUs handle various scenarios. An example of this is handling requests from vehicles for some content stored in an RSU or the Origin of the simulation.
  • CarHandler. Finally, CarHandler also has functions that deal with handling and creating requests. The vehicles in the network are constantly moving, so there is also a function that is called at each moment of the simulation for purposes such as accident detection.
Additionally, KMeansML.py and AgglomML.py are two files used in the simulation. They are written in Python and run a machine learning algorithm for VANETs, that writes the results of the algorithm to a .csv file. KMeansML.py runs the K-Means algorithm, while AgglmoML.py runs Agglomerate Clustering adapted for VANETs.

Appendix A.2. Message Archive

The Message.msg file is also important to describe. .msg files have a special syntax and when the code is compiled, OMNET++ constructs the corresponding files and their header in C++ (Message_m.cc and Message_m.h).
Message defines a packet type that describes the information contained in the messages sent by the network nodes during the simulation. Each node that sends a message first schedules the sending time and then the message is sent to itself (self-message). Then, depending on certain information of the message, it is determined whether it will be sent to other nodes or used for other purposes.
We will divide the information contained in a message according to the type of information and state their function. The information related to the sending details of the message includes:
  • SenderAddress. The address of the last node that sent the message. It is used so that we can obtain an indication of the path of the message.
  • Recipient. The address of the node that will receive the message. Any node whose address is different from the one listed in this field receives the message and ignores it.
  • Source. The address of the node that generated the message. It is used for various purposes, mainly to know which node to respond to when a request comes to us.
  • Dest. The address of the node to which we want the message to arrive. If a node with an address other than the one in Dest receives this message, it forwards the message to reach its destination.
  • SenderPosition. The coordinates of the latter.
Also, the information concerning the characteristics of the message includes:
  • MaxHops. It is the maximum number of bounces the message can make before it is deleted.
  • Hops. It is the number of bounces the message has made so far. If it exceeds MaxHops, the message is deleted.
  • Type. This field specifies the type of message being sent. There are 18 different message types, each for a different occasion and function.
  • State. As mentioned at the beginning of this subsection, each message is first sent as a “self-message”. State defines which operating state this message corresponds to. For example, Sending, which is the default state, sends the message to the specified nodes. In contrast, the Caching state does not send a message to other nodes, and, instead, starts the process of managing content storage. There are a total of 7 different message intents.
  • Centrality. This field is only used for centrality calculation requests and their responses. It specifies the kind of centrality we want to calculate.
Additionally, information used to store numerical and simulation time data includes:
  • MsgInfo. In this field we store numerical information that we want to send, e.g., centrality results.
  • AckInfo. Information of type simtime_t, i.e., simulation time, is stored here. The field is used to send acknowledgments and ensure that received acknowledgment corresponds to content.
Another type of message fields are fields used to find an optimal path or to traverse paths that do not change as time passes (e.g., paths between RSUs).
  • Route. A vector storing the path taken so far. Mainly used for best path finding messages. Another use is for messages between Origin and RSU. Since Origin and RSU are static, if the optimal path between them is calculated, we can use that path to send a message faster.
  • PreviousNodes. A vector that stores the path taken by a message reply while we are traversing a path in reverse, removing nodes from Route and adding nodes to PreviousNodes.
In a message, there are also some fields which are used to change how messages should be treated:
  • OriginMessage. This field, if set to true, indicates that this is a message between RSUs and Origin. Therefore, all vehicles that receive this message ignore it. Accordingly, if it is false then it is ignored by Origin.
  • UpdatePaths. A message that has Route is subject to a routing check. If this variable is false, we can ignore this check.
The last category of information present in a message is the information used to convey content.
  • ContentId. It is used to identify the content we request or send.
  • Content. In this field we store the content we want to send.
  • Segments. Here we define how many segments the content has. The content requester does not know how many segments the content has in the first place.
  • SegmentNumber. In the case of sending multipart content this variable is used to define which part we are sending.
  • Multimedia. Again for content transmission, this field specifies whether the content we request or send is multimedia content, i.e., a video or an image, or content that contains road information.

Appendix A.3. Data Structures

For the needs of this simulation framework, it was necessary to create data structures tailored to the messages received by each node.
The first of these is called MessageData and has similar information to that found in a message. More specifically, it includes the SenderAddress, Source, Dest, Type, ContentId, Content, Segments, SegmentNumber and Multimedia fields of a message. It also includes the creation time (timestamp) of the message, the last time the message was used (lastUsed) and the time point, when the message was received (receivedAt) by the node that wants to save it. Finally, it contains the frequency of use of the message (usedFrequency) and the retransmission attempts that have been made (attempts).
In this structure, functions have been implemented that compare two MessageData data structures depending on various parameters.
The second structure created is called ContentWrapper. This structure stores the data contained in a message. This means that this structure contains the Content, Segments and SegmentNumber fields of a message.

Appendix A.4. Installing and Running a Simulation

We start by installing the prerequisite programs. The installation guide followed for this purpose can be found on the Veins [22] page. The installation took place in a Windows 64-bit environment.
First, we download the SUMO version 1.8 files [23] and extract them to the location we will use for the project. We navigate to the respective folder, open the bin subfolder and check if the file sumo.exe exists.
Continuing with the installation of OMNET++, we download version 5.6.2, for the operating system used from the official page of [24]. We unzip the file again to the same folder we unzipped SUMO and open the created folder. There we run mingwenv.cmd file. Next, we type the command ./configure and then make. If a problem occurs during either of these two commands because a package is missing, we make sure that the package is installed (it will be listed along with the error message). When this process is finished, we type the command omnetpp and its IDE opens.
Continuing with the prerequisite installation, we download the Veins 5.2 files from the official [25] page and unpack them, again, into the folder where the other two programs are located. Make sure not to download the Instant Veins version. At the same time, we download the files written in paper, and place them in the Veins folder, replacing the old files with the new paper files. We open the IDE of OMNET++, if it is not already open, select File > Import > General: Existing Projects into Workspace and the folder where Veins is located.
Now that all the files are installed, we open the MinGW command line by running the file mingwenv.cmd. In this line we type (dir)/sumo-1.8.0/bin/sumo.exe-c erlangen.sumo.cfg, where (dir) is the address of the folder, in which the folder of SUMO is extracted. Then, in the graphical interface of OMNET++, we right-click on the project that we imported and click on the option Build Project. Once this process is finished, right-click again and this time select Run As > OMNET++ Simulation.
If installed correctly, the simulation window will open. There, in the first pop-up window that will appear, we press “OK”. In the next window that appears, we insert a number from 1 to 24. Each number corresponds to a different simulation scenario, including all possible implemented simulations. Then, another window appears, in which the value we will put determines the ID of the multimedia information that will be requested by the RSUs during the simulation. Media content already stored in Origin has ID equal to 4 and 5. Content with ID 4 has a single part, while content with ID 5 has 3 sections. In the last window that will appear, we put the number of RSUs we want the simulation to have. There are ready-made coordinates for up to 20 RSUs, but if we want more, the coordinates of the extra RSUs will be requested in a pop-up.
Ready-made scripts define the following parameters: Request time, Metric type and Content allocation policy. With this array of parameters, we will then match the script number to the parameter values. It is noted here that for the metric ML (Machine Learning) one of the two machine learning algorithms found in the files KMeansML.py and AgglomML.py must run.

References

  1. Fourati, L.; Kilanioti, I. Radio Aspects for the Internet of Vehicles (IoV) in High Mobility Environments. In Proceedings of the URSI General Assembly and Scientific Symposium, URSI GASS 2023, Sapporo, Japan, 19–26 August 2023. [Google Scholar]
  2. Do, Y. Centrality Analysis in Vehicular Ad Hoc Networks; Technical Report; EPFL: Lausanne, Switzerland, 2008. [Google Scholar]
  3. Vukadinovic, V.; Bakowski, K.; Marsch, P.; Garcia, I.D.; Xu, H.; Sybis, M.; Sroka, P.; Wesolowski, K.; Lister, D.; Thibault, I. 3GPP C-V2X and IEEE 802.11 p for Vehicle-to-Vehicle communications in highway platooning scenarios. Ad Hoc Netw. 2018, 74, 17–29. [Google Scholar] [CrossRef]
  4. Kilanioti, I.; Rizzo, G.; Masini, B.M.; Bazzi, A.; Osorio, D.P.M.; Linsalata, F.; Magarini, M.; Löschenbrand, D.; Zemen, T.; Kliks, A. Intelligent Transportation Systems in the Context of 5G-Beyond and 6G Networks. In Proceedings of the IEEE Conference on Standards for Communications and Networking, CSCN 2022, Thessaloniki, Greece, 28–30 November 2022; IEEE: Piscataway, NJ, USA, 2022; pp. 82–88. [Google Scholar] [CrossRef]
  5. Bronner, F.; Sommer, C. Efficient Multi-Channel Simulation of Wireless Communications. In Proceedings of the 2018 IEEE Vehicular Networking Conference (VNC), Taipei, Taiwan, 5–7 December 2018; pp. 1–8. [Google Scholar] [CrossRef]
  6. Eckhoff, D.; Sommer, C. A multi-channel IEEE 1609.4 and 802.11 p EDCA model for the veins framework. In Proceedings of the 5th ACM/ICST International Conference on Simulation Tools and Techniques for Communications, Networks and Systems: 5th ACM/ICST International Workshop on OMNet++, Desenzano, Italy, 19–23 March 2012. [Google Scholar]
  7. Veins Documentation. Available online: https://veins.car2x.org/documentation/ (accessed on 22 May 2023).
  8. Kilanioti, I. Improving multimedia content delivery via augmentation with social information: The social prefetcher approach. IEEE Trans. Multimed. 2015, 17, 1460–1470. [Google Scholar] [CrossRef]
  9. Elsayed, S.A.; Abdelhamid, S.; Hassanein, H.S. Predictive Proactive Caching in VANETs for Social Networking. IEEE Trans. Veh. Technol. 2022, 71, 5298–5313. [Google Scholar] [CrossRef]
  10. Brik, B.; Lagraa, N.; Yagoubi, M.B.; Lakas, A. An efficient and robust clustered data gathering protocol (CDGP) for vehicular networks. In Proceedings of the Second ACM International Symposium on Design and Analysis of Intelligent Vehicular Networks and Applications, Paphos, Cyprus, 21–25 October 2012; pp. 69–74. [Google Scholar]
  11. Chaves, R.; Senna, C.; Luis, M.; Sargento, S.; Matos, R.; Recharte, D. Content distribution in a VANET using InterPlanetary file system. Wirel. Netw. 2023, 29, 129–146. [Google Scholar] [CrossRef]
  12. Luo, L.; Sheng, L.; Yu, H.; Sun, G. Intersection-based V2X routing via reinforcement learning in vehicular ad hoc networks. IEEE Trans. Intell. Transp. Syst. 2021, 23, 5446–5459. [Google Scholar] [CrossRef]
  13. Kuo, T.Y.; Lee, M.C.; Lee, T.S. Quality-aware caching, computing and communication design for video delivery in vehicular networks. In Proceedings of the ICC 2022-IEEE International Conference on Communications, Seoul, Republic of Korea, 16–20 May 2022; IEEE: Piscataway, NJ, USA, 2022; pp. 261–266. [Google Scholar]
  14. Tian, H.; Otsuka, Y.; Mohri, M.; Shiraishi, Y.; Morii, M. Leveraging in-network caching in vehicular network for content distribution. Int. J. Distrib. Sens. Netw. 2016, 12, 8972950. [Google Scholar] [CrossRef] [Green Version]
  15. Grewe, D.; Wagner, M.; Frey, H. PeRCeIVE: Proactive caching in ICN-based VANETs. In Proceedings of the 2016 IEEE Vehicular Networking Conference (VNC), Columbus, OH, USA, 8–10 December 2016; IEEE: Piscataway, NJ, USA, 2016; pp. 1–8. [Google Scholar]
  16. Doan Van, D.; Ai, Q. In-network caching in information-centric networks for different applications: A survey. Cogent Eng. 2023, 10, 2210000. [Google Scholar] [CrossRef]
  17. Cislaghi, V.; Quadri, C.; Mancuso, V.; Marsan, M.A. Simulation of Tele-Operated Driving over 5G Using CARLA and OMNeT++. In Proceedings of the 2023 IEEE Vehicular Networking Conference (VNC), Istanbul, Türkiye, 26–28 April 2023; IEEE: Piscataway, NJ, USA, 2023; pp. 81–88. [Google Scholar]
  18. Pusapati, S.; Selim, B.; Nie, Y.; Lin, H.; Peng, W. Simulation of NR-V2X in a 5G Environment using OMNeT++. In Proceedings of the 2022 IEEE Future Networks World Forum (FNWF), Montreal, QC, Canada, 10–14 October 2022; pp. 634–638. [Google Scholar] [CrossRef]
  19. Garrido Abenza, P.P.; Malumbres, M.P.; Piñol, P.; López Granado, O. A simulation tool for evaluating video streaming architectures in vehicular network scenarios. Electronics 2020, 9, 1970. [Google Scholar] [CrossRef]
  20. Klaue, J.; Rathke, B.; Wolisz, A. Evalvid–a framework for video transmission and quality evaluation. In Proceedings of the Computer Performance Evaluation. Modelling Techniques and Tools: 13th International Conference, TOOLS 2003, Urbana, IL, USA, 2–5 September 2003; Proceedings 13. Springer: Berlin/Heidelberg, Germany, 2003; pp. 255–272. [Google Scholar]
  21. Sommer, C.; German, R.; Dressler, F. Bidirectionally Coupled Network and Road Traffic Simulation for Improved IVC Analysis. IEEE Trans. Mob. Comput. 2011, 10, 3–15. [Google Scholar] [CrossRef] [Green Version]
  22. Veins Tutorial. Available online: https://veins.car2x.org/tutorial/ (accessed on 22 May 2023).
  23. Simulation of Urban MObility Files. Available online: https://sourceforge.net/projects/sumo/files/sumo/ (accessed on 22 May 2023).
  24. OMNeT++ Older Versions. Available online: https://omnetpp.org/download/old (accessed on 22 May 2023).
  25. Veins Download. Available online: https://veins.car2x.org/download/ (accessed on 22 May 2023).
Disclaimer/Publisher’s Note: The statements, opinions and data contained in all publications are solely those of the individual author(s) and contributor(s) and not of MDPI and/or the editor(s). MDPI and/or the editor(s) disclaim responsibility for any injury to people or property resulting from any ideas, methods, instructions or products referred to in the content.