Abstract
With the development of power switches and processor performance in recent years, the control frequency of inverters has been significantly improved. However, limited by technology and price, the sensor sampling frequency in large-scale industrial applications is much lower than the inverter control frequency that can be realized. This frequency mismatch limits the performance improvement of the inverter. In this article, the current and voltage at the non-sampling time are reconstructed using the current prediction control principle and the input observer theory, allowing a single-phase inverter to implement multi-sampling rate control with a low sampling frequency and high control frequency. In addition, an improved adaptive controller is designed to solve the effect of incorrect model parameters, which realizes adaptive control when the sampling frequency and control frequency are mismatched. Finally, the effectiveness of the method is verified through a simulation and experiments. The proposed method can solve the problem of high-speed switching for inverters under low-sampling-frequency conditions, improving the inverter’s adaptive performance and robustness.
1. Introduction
In recent years, the depletion of fossil energy sources has become more pronounced. The extensive utilization of fossil energy has led to heightened environmental problems. Hence, there is an urgent need to develop cleaner and more environmentally friendly alternative sources of energy [1]. As the “hub” to which new energy-generating units, loads, and electric networks are connected, the performance of a grid-connected inverter directly affects the efficiency of power generation and the quality of grid-connected power [2].
The inverter’s control strategy has a direct impact on its operating conditions and performance variations. Intricate application scenarios and conditions have compelled researchers to investigate and enhance the control technology. The main control methods for inverters are proportional integral (PI) control [3,4,5], proportional resonant (PR) control [6,7], fuzzy control (FC) [8,9], sliding mode control (SMC) [10,11], neural network control (NNC) [12,13,14] and model predictive control (MPC) [15]. MPC is a frequently used control technique in industrial process control. Depending on how many switching vectors are controlled in one sample period, it can be divided into continuous control set model predictive control (CCS-MPC) and finite control set model predictive control (FCS-MPC) [16]. FCS-MPC has a straightforward process, no pulse width modulation, a fast response, and good steady-state performance. It is easy to realize multi-objective cooperative control. This technique has been widely used for inverter control [17]. The conventional FCS-MPC algorithm is based on the system model and using voltage and current sampling values to predict the possible future behavior of the inverter, to select the optimal switching state; thus, the control process requires sampling of the circuit state.
The use of GaN-based IGBTs in recent years has dramatically increased the operating frequency of switching tubes. At the same time, the computing power of processors has also been significantly improved, with the rapid development of DSP and FPGA technologies. As a result, the control frequency of inverters has grown from the conventional maximum of 20 kHz to more than 100 kHz, and even up to 100 MHz, potentially enhancing their performance significantly. However, in large-scale industrial applications, the sampling frequency of the sensors used is often lower than the control frequency achievable by the inverter, due to technical and price limitations. This mismatch in frequency limits the performance of the inverter. Additional research is required to address this frequency mismatch issue. Conducting research on implementing high-speed switching control of inverters at low sampling frequencies is of significant value for industrial applications.
Additionally, changes in temperature and other environmental factors, as well as the saturation level of the magnetic circuit, can affect the values of inductance and resistance in the circuit, leading to parameter mismatch. Parameter mismatch can result in deviations from the predicted values, influencing the best switching vector choice. The study in [18] concluded that the effect of inductor mismatch on the prediction error is greater than the effect of resistance mismatch. The study in [19] took the deviation caused by the parameter mismatch as a disturbance, estimated the disturbance using a Luenberger observer, and then compensated the deviation back into the original model. However, this control strategy was designed under the fixed-frequency MPC algorithm and cannot be directly used in FCS-MPC. The study in [20] introduced an inductance disturbance observer into the current prediction process, enhancing the robustness against system parameter mismatch. The study in [21] took the deviation caused by parameter mismatch as a sinusoidal signal. Two different observer design methods were used to estimate the circuit’s actual resistance and inductance, by observing the signal’s instantaneous value, amplitude, and phase angle. In addition to using an observer-based method to compensate for disturbances, the online parameter identification method can also be used to eliminate the influence of parameter mismatches. The study in [22] proposed an adaptive online parameter identification method based on gradient descent optimization, which achieved a high precision and fast estimation of filter parameters. The study in [23] proposed a data-driven real-time recursive least squares estimation method, to obtain accurate parameters of the circuit, taking into account the dependency of FCS-MPC on precise modeling.
There are many corresponding methods for parameter mismatch. All these control methods have their corresponding advantages and disadvantages. However, one thing worth noting is that these methods are dependent on the current input and output for parameter identification, and the control frequency is equal to the sampling frequency at this time. However, when the sampling frequency is lower than the control frequency, it is impossible to perform parameter identification at the non-sampling moment. A significant identification error will exist if the original parameter identification method is used. When the mismatch between the sampling frequency and control frequency becomes more serious, the current tracking error becomes larger and the current THD is higher. When the sampling frequency is mismatched with the control frequency, the advantages of high-speed switching of switching tubes cannot be fully exploited. Therefore, further research is required to determine how to achieve parameter identification when the frequency mismatch remains a concern.
In summary, the research focus of this paper is primarily on two aspects. One is to improve the conventional FCS-MPC using the current prediction control principle and input observer theory. The current and voltage are reconstructed at non-sampling moments, to eliminate the effect of frequency mismatch, to allow high-speed switching control with a low sampling frequency. The other aspect is to extend the study of parameter mismatch for the improved FCS-MPC, to enhance its parameter adaptiveness and improve control stability.
2. Conventional Unidirectional Inverter FCS-MPC Control Strategy
2.1. Single-Phase Inverter System Model
In this paper, a single-phase inverter is selected as the control object of FCS-MPC, as shown in Figure 1. Where is the equivalent DC-regulated power supply, L is the filter inductor, R is the circuit line equivalent resistance, i is the output current, is the inverter output voltage, and is the power grid voltage as the simulated load.
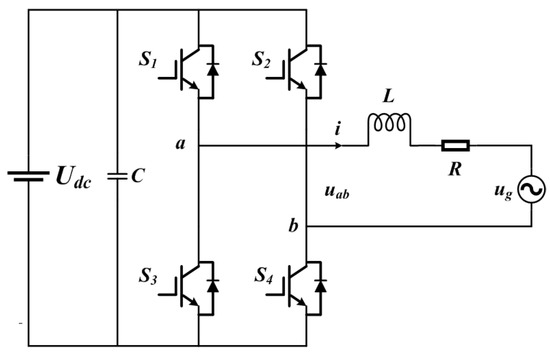
Figure 1.
Single-phase inverter topology.
According to Kirchhoff’s law, the load current can be described as
Using first-order forward Euler approximation, the predicted current for the next control cycle can be obtained as
2.2. Introduction to the Conventional FCS-MPC Strategy
The control strategy of the conventional FCS-MPC is shown in Figure 2, where is the reference current and is the predicted current. In order to achieve the same frequency and phase for the output current and the power grid voltage, the voltage can be used as the input signal, and the phase of the voltage can be locked in real time through a phase-locked loop and then used as the phase of the reference current; therefore, the reference current can be expressed as
where represents the amplitude of the reference current. There are four different switching state combinations in the single-phase inverter. Each switching state combination corresponds to a , where there are two types of switch state that correspond to the same . Then, they are combined with Equation (2) to obtain three different current prediction values. The value function is defined as follows:
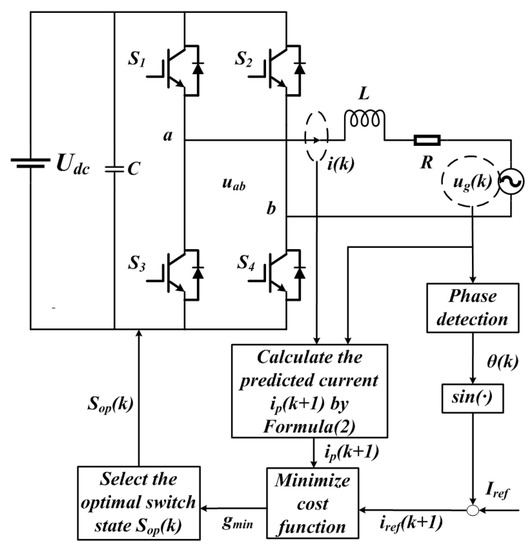
Figure 2.
Schematic diagram of conventional FCS-MPC.
The output current tracks the reference current by minimizing the value function, to obtain the optimal switching state for control in the next moment.
In summary, the controlling idea of FCS-MPC is as follows:
- Predicting the future situation of control variables under different control behaviors according to the system model;
- Calculating the value of the value function under different control behaviors, according to the definition of the value function;
- Determining the optimal control behavior by minimizing the value function.
3. Improved FCS-MPC Strategy for High-Speed Switching Control at Low Sampling Frequency
First, the effect of the conventional FCS-MPC control at low sampling frequency is analyzed. Second, a method based on the current prediction principle is proposed, to solve the current low sampling frequency problem. Finally, an input observer prediction method is used to solve the voltage low sampling frequency problem.
3.1. Analysis of the Effect of Low Sampling Frequency
Implementing FCS-MPC control requires the real-time acquisition of the sampled values of power grid voltage and output current. The control period needs to be consistent with the sampling period. When the sampling frequency is lower than the control frequency, assume that the mismatch ratio between the control frequency and the sampling frequency is N, and the relationship between the two frequencies is as follows:
where represents the maximum switching control frequency, and represents the sampling frequency of the sensor. Figure 3a,b show the maximum output current tracking error and THD variation for different mismatch ratios between the sampling frequency and control frequency (the control frequency is 40 kHz, and the sampling frequency varies), respectively.
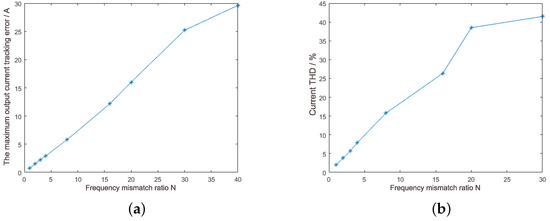
Figure 3.
Situation of output current when the frequency mismatch ratio changes: (a) Tracking error variation of output current; (b) THD value variation of output current.
As seen from Figure 3, when the frequency mismatch ratio increases, the sampling frequency decreases, the output current’s tracking error and THD variation become more extensive, and the single-phase inverter’s current tracking effect progressively worsens. The sampling frequency limits the control effect, and the high switching frequency of the new material switching tube and the processor’s computing power cannot be exploited. Therefore, the FCS-MPC control method needs to be improved to achieve high-speed switching control at a low sampling frequency, significantly lower hardware costs, and to fully utilize the switching controller’s superior performance. The key to solving the low sampling frequency problem is estimating the output current and power grid voltage at non-sampling moments, so that the circuit can still achieve high-speed switching control.
An improved FCS-MPC control method is proposed to overcome the low sample frequency issue, and its schematic diagram is shown in Figure 4. This primarily includes two parts to solve the low current sampling frequency and low voltage sampling frequency.
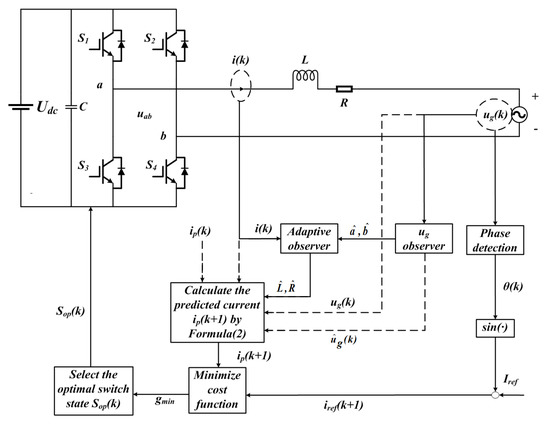
Figure 4.
Schematic diagram of adaptive control for improved FCS-MPC current and voltage sampling.
3.2. Solving Current Low Sampling Frequency
In the improved FCS-MPC control, the predicted value , closest to the reference current, is found by minimizing the value function at the time of , to obtain the best switching state combination to control the switching tube on/off state.Therefore, during the control period of , when the circuit switching tube operates according to the corresponding state of , ideally, the output current value at the moment can be approximated as
Therefore, the output current is estimated at the non-sampling moment using the current prediction value obtained in the last moment based on the value function closest to the reference current, thus solving the current undersampling problem.
To improve the FCS-MPC control strategy such that it continues to work according to the traditional FCS-MPC at sampling time, but at the non-sampling time, it can first use the predicted current value obtained from the previous control time step, which is closest to the reference current, to estimate the current output, and then input this into the model current prediction control module to implement subsequent control processes.
3.3. Solving Low-Voltage Sampling Frequency
As for the output current, it is necessary to collect the reverse electric potential in each control cycle for model prediction. This paper uses an observer to obtain the reverse electric potential in the non-sampling moments.The basic principle of the observer is as follows: For a system with output variable y and state variable x, the estimated value of the state can be directly measured. Based on this, the estimation model of the state is corrected using the output error , so that the estimated value of the state tends towards the true state of the system.
Denote as
where is the phase of the power grid voltage obtained by the phase-locked loop. a and b are the grid voltage wave fundamental parameters, respectively. As long as the coefficients a and b are observed, the back electromotive force value at any given time can be calculated. Take the state variable as
Establish the following dynamic system
where
According to Equation (9), the following observer is constructed:
where l is the error feedback matrix, and is the error feedback coefficient to be set. The error feedback coefficient is selected empirically in this study. If approaches x as time t approaches infinity, this means that the state x of the system can be estimated in real time by using the observer, which means that the information of the grid voltage can be estimated in real time.
At the sampling moment, the observer can obtain the power grid voltage information and , combined with the phase-locked loop output and , the voltage information at the non-sampling moment can be expressed as
where , the reverse electric potential at the non-sampling moment can be observed at .
The overall process is as follows:
- Derive the iteration equations for each state variable of the observer;
- Initialize the state variables and set the iteration period, observer parameters, and the initial phase during the simulation;
- Use sensors to collect the reverse electromotive force values at sampling moments and input them into the integration section, to calculate the state variables for each period, thereby obtaining the output of the real system model;
- Continuously iterate to make the state variables of the observer approach the values of the real system;
- Use the sampling values as input to the observer and calculate the observed value of the reverse electromotive force at non-sampling moments.
The problem of under-sampling the output current i and grid voltage at non-sampling moments has been solved in the improved FCS-MPC to achieve high-speed switching control at a low sampling frequency.
4. Study on Improved FCS-MPC Strategy Model Parameter Mismatch
Due to complex applications and environmental factors, a single-phase inverter’s grid-connected operation is susceptible to parameter changes. As a result, the single-phase inverter’s control performance may be negatively impacted by the model’s inaccuracy and reduced prediction accuracy when performing current model prediction control. Therefore, a prediction observer for the actual parameters of the circuit is added to the improved FCS-MPC in the case of frequency mismatch, to achieve adaptive control, and a control schematic diagram is shown in Figure 4. Where and are the actual inductor-resistance estimates of the circuit. How to design an observer based on the proposed improved FCS-MPC algorithm, to estimate the circuit’s actual inductor resistance when the sampling frequency is different from the control frequency, will be the focus of the work in this section.
4.1. Impact of Inaccurate Parameters
Assuming that the nominal values of the model inductor resistance are and , and the values of the inductor resistance in the actual circuit are L and R, the error in defining the model parameters is
According to Equation (2), the current prediction equation after the parameter correction is
Therefore, the current prediction error arising from the parameter mismatch is
From Equation (17), it can be seen that the current prediction error is closely related to the parameter error of the inductor-resistor and also proportional to the control period of the circuit. Hence, the parameter adaption of the model is better when the control frequency is higher. Defining the deviation as d due to parameter mismatch [21], the system model is described as follows:
Since an outstanding advantage of the MPC algorithm is its superior robustness, the output current can track the reference current well; then, Equation (19) can be written as
From Equation (20), the deviation d is also a sinusoidal quantity, the deviation d can also be expressed in the generic form of a sinusoidal signal, as follows:
Comparing Equations (20) and (21), the actual parameters of the circuit L and R can be expressed as follows:
By estimating the coefficients A and B of the bias d by designing an observer, we can obtain the actual inductance and resistance values of the circuit through Equation (22).
4.2. Conventional Adaptive Control Observer
Define the state quantity and combine it with Equation (23) to create the following dynamic system:
Among them
According to the state space equations, a time-varying observer can be constructed as follows:
where l is the weighted coefficient matrix of the error signal,
where , , and are constants. If approaches x as time t approaches infinity, this means that the state x of the system can be estimated in real time by using the observer; that is, to be able to estimate in real time the relevant information that represents the bias d caused by parameter mismatches .
The observer is discretized using Euler’s method, to make it easier to implement on a digital processor, and the results are as follows:
where is the prediction period of the observer, which coincides with the circuit sampling period and control period, i.e., . Combining Equation (22), the actual inductor-resistance estimates of the circuit and are obtained as follows:
4.3. Adaptive Control Strategy in Case of Frequency Mismatch
This subsection deals with the design of an adaptive observer, when the sampling frequency is lower than the control frequency. The estimated value of the output current is related to the output voltage and the grid voltage of the inverter. We find that the observer at frequency mismatch is not only the change of the iteration period . More importantly, the control variable uab-ug varies within the sampling period. If the observer using frequency matching operates iteratively according to the sampling period, it assumes that and are constant throughout the entire sampling period. In this case, the observed state variable error will be relatively large. Therefore, we need to establish a new estimation model for the parameter mismatch problem when there is a frequency mismatch. Thus, the effect of the state change of the state variable at the non-sampling point on the state variable at the sampling moment point is the key to constructing the observer.
When the frequencies do not match, if the moment is the sampling moment, the following sampling moment is the moment. From the system state space Equation (24), the expression of the system state quantity i at the first non-sampling moment can be obtained.
Denote , and . Then Equation (32) can be written as
From Equation (33), it can be seen that the output current i is related to the inverter AC side output voltage and the reverse electric potential , while the control vector is varied within each control cycle , then the expression of the state variable i at the second non-sampling moment is
For the non-sampling moment , the state variable is denoted as
where the state of the control variable at each non-sampling moment point can be obtained using Equation (1), and the state of the control variable at non-sampling moment points needs to be obtained using the method presented in Section 3. When both the frequency mismatch and model parameters are not accurate, an observer is used to simultaneously estimate the values of and deviation d. Define the sinusoidal quantity as
is the output voltage that can store data during each control cycle. This assumes that
Based on the above system state equation, the discrete form of the improved observer can be expressed as follows:
where are constants and is the control period. Combining Equation (36) with the non-sampling points obtained from Equation (14), the actual inductor-resistance estimates and of the circuit can be obtained.
The improved FCS-MPC control strategy with the addition of the parameter observer is shown in Figure 5. The implementation steps for identifying the observer parameters in the case of a frequency mismatch and parameter mismatch are as follows:
- Initialize the various state variables of the observer; and set the iteration period, observer parameters, and the initial phase in the simulation. The phase is locked by a phase-locked loop to ;
- Using sensors to collect the output current from the AC side of the circuit, compare it with the estimated current value of the model, and provide real-time feedback of the error to the estimation model;
- Iterate according to Equation (38), to make the estimated model’s state variable approach the true coefficient ;
- Obtain the coefficient of the deviation d;
Finally, according to the relationship between the true parameters of the model and the coefficient of the deviation d, the true parameters of the system model are calculated. After obtaining the true parameters of the model, the original model can be corrected in real time, thereby improving the parameter adaptive performance of the improved FCS-MPC.


Figure 5.
Schematic diagram of adaptive control for improved FCS-MPC in the case of frequency mismatch and parameter mismatch.
Figure 5.
Schematic diagram of adaptive control for improved FCS-MPC in the case of frequency mismatch and parameter mismatch.
5. Simulation
5.1. Improved Low Current Sampling Simulation Results
This modified FCS-MPC that solves the problem of low current sampling and predicts the current at non-sampling moments based on the current prediction control principle is called single multi-rate sampling improved FCS-MPC. The simulation of the single multi-rate sampling improved FCS-MPC was divided into two parts. The first part controlled the single-phase inverter with the conventional FCS-MPC and the improved FCS-MPC at the frequency mismatch ratio N = 4.
Total harmonic distortion(THD) is the ratio of the root mean square value of each harmonic (2nd, 3rd to nth) of the signal to the root mean square value of the fundamental waveform and is an important indicator of the quality of a sine waveform. The current THD is an important performance parameter, as grid-tie converters must follow legislation limits to be connected to the grid [24,25]. The output current waveform and THD are shown in Figure 6.
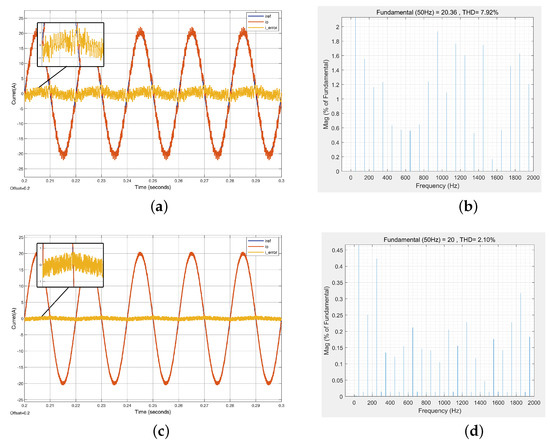
Figure 6.
Results of the output current when the frequency mismatch ratio N = 4: (a,b) Output current waveform and FFT analysis of conventional FCS-MPC; (c,d) output current waveform and FFT analysis of single multi-rate sampling improved FCS-MPC.
Compared with Figure 6a,c, when the single multi-rate sampling improved FCS-MPC was used, the waveform of the tracking current was significantly improved, the current tracking error was reduced by about 60%, and the current ripple was also reduced. Comparing with Figure 6b,d, it can also be seen that the current THD was reduced by 5.82%, the tracking performance was greatly increased, and the waveform quality of the output current was enhanced using the improved FCS-MPC.
In the second part of the simulation, the ideal FCS-MPC, the conventional FCS-MPC, and the modified FCS-MPC were used to control the single-phase inverter under different frequency mismatches, and then the current tracking error and current THD were compared. The results are displayed in Figure 7.
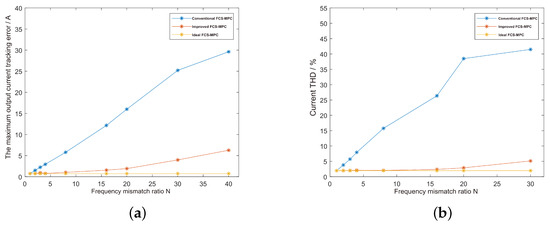
Figure 7.
Conventional, improved, and ideal FCS-MPC control effect simulation results when the frequency mismatch ratio changed: (a) tracking error comparison result of output current; (b) THD comparison result of output current.
As shown in Figure 7, the improved FCS-MPC could significantly improve the effect of low sampling frequency compared with the conventional FCS-MPC algorithm. It could also achieve high-speed switching control by predicting the current at non-sampling moments at a low sampling frequency, which could improve the effect of different degrees of frequency mismatch. The more serious the frequency mismatch, the more pronounced the improvement effect.
However, when comparing the curves using the improved FCS-MPC with the ideal case, it can be seen that when the frequency mismatch was more severe, the gap between the tracking effect of the current and the ideal case became bigger and bigger. The low sampling frequency problem of reverse electric potential is one of the main influencing factors, so it is also essential to resolve this issue.
5.2. Improved Low-Voltage Sampling Simulation Results
Dual multi-rate sampling improved FCS-MPC is like the single multi-rate sampling improved FCS-MPC, adding one observer, which can solve the problem of both low-current sampling and low-voltage sampling. In order to verify the effect of the dual multi-rate sampling improved FCS-MPC, a simulation of single-phase inverter control was performed and compared with the single multi-rate sampling improved FCS-MPC. This simulation was also divided into two parts. The first part was a simulation comparing the output current waveform and THD under single multi-rate sampling improved FCS-MPC and dual multi-rate sampling improved FCS-MPC control at a frequency mismatch ratio N = 4. First, the observation of the observer is shown in Figure 8.
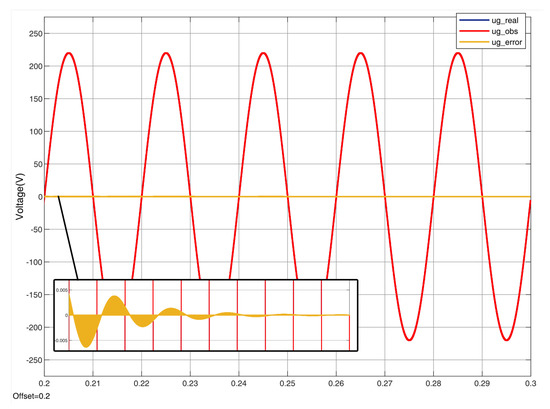
Figure 8.
Simulation result of observation with frequency mismatch ratio N = 4.
From Figure 8, it can be seen that the observation curve and the actual value curve coincide entirely. The relative error was small, as seen from the enlarged plot of the observation error. It gradually converged to zero with the increase in the iteration period, indicating that the observer’s observation of the reverse electric potential with this method is accurate and that the non-sampling point voltage information was better reconstructed. Next, the output current waveforms and FFT analysis under single multi-rate sampling improved FCS-MPC and dual multi-rate sampling improved FCS-MPC control are shown in Figure 9.
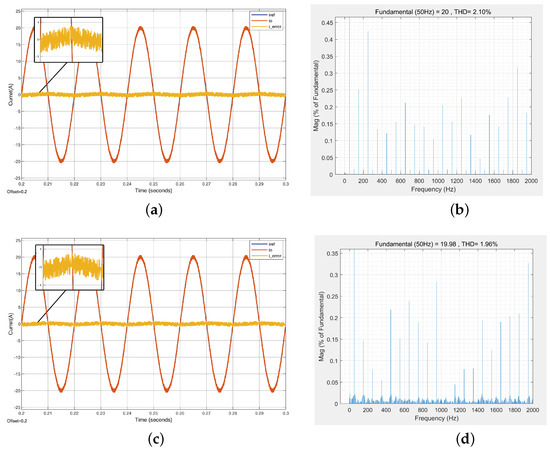
Figure 9.
Results of output current with the frequency mismatch ratio N = 4: (a,b) Output current waveform and FFT analysis of single multi-rate sampling improved FCS-MPC; (c,d) output current waveform and FFT analysis of current and voltage dual multi-rate sampling improved FCS-MPC.
Figure 9 shows that the current tracking effect was improved with the dual multi-rate sampling improved FCS-MPC control at the frequency mismatch ratio N = 4. The current THD was reduced by 0.14% compared with the single multi-rate sampling improved FCS-MPC control, which achieved the ideal control effect only when the control frequency was 40 kHz, and the frequency had to be matched.
The second part was a simulation comparing the current tracking error and THD under the control of conventional FCS-MPC, the single multi-rate sampling improved FCS-MPC, the dual multi-rate sampling improved FCS-MPC, and ideal FCS-MPC at varying frequency mismatches. The results are shown in Figure 10.
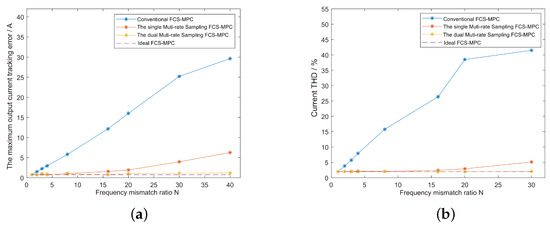
Figure 10.
Conventional, single multi-rate sampling, dual multi-rate sampling, and ideal FCS-MPC control simulation results when the frequency mismatch ratio changed: (a) tracking error comparison result for output current; (b) THD comparison result for output current.
Comparing the current tracking error and THD of the dual multi-rate sampling improved FCS-MPC and the single multi-rate sampling improved FCS-MPC in Figure 10, the former had a specific improvement effect for the low sampling of . The more severe the frequency mismatch, the more pronounced the improvement effect. Comparing the control effect of dual multi-rate sampling improved FCS-MPC with the ideal case, we can see that the current tracking error and THD curves under the dual multi-rate sampling improved FCS-MPC basically coincided with the ideal curves and that the sampling frequency matched the control frequency. The dual multi-rate sampling improved FCS-MPC could eliminate the low sampling frequency of voltage and current and achieved the effect of high-speed switching control at a low sampling frequency.
5.3. Simulation Results of Adaptive Control during Frequency Mismatch
In order to verify the parameter identification results of the observer, as well as the adaptivity and control effect of the improved FCS-MPC when the sampling frequency is lower than the control frequency, a corresponding simulation was conducted, which was divided into three main parts.
The first part of the simulation was to verify the effectiveness of the observer in recognizing parameters when the circuit parameters L and R were dynamically changing, including rising and falling, abruptly from 4.5 mH, 0.5 to 6 mH, and then back to 4.5 mH, 0.5 after the circuit had stabilized.
Figure 11 shows that the observer’s dynamic response time to identify the parameters was between 65 ms and 71 ms, which is fast. The accuracy of the observer in identifying the parameters under the condition that the sampling frequency was lower than the control frequency could be confirmed by the overlap of the actual parameter curve and the observed parameter curve.
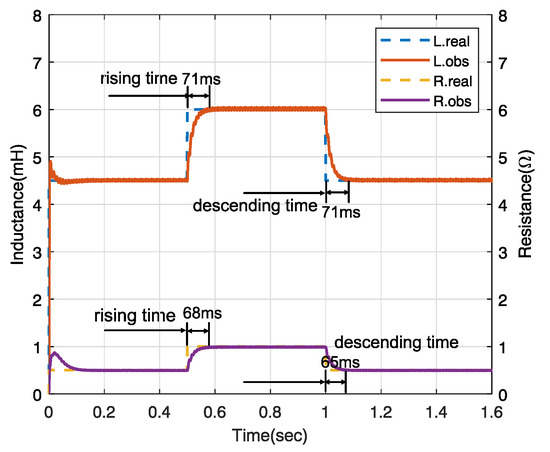
Figure 11.
Schematic diagram of adaptive control for improved FCS-MPC current and voltage sampling.
The second part of the simulation was to compare the control effect of the improved FCS-MPC with and without the parameter observer and to verify the adaptive capability of the controller when the sampling frequency was lower than the control frequency. The circuit inductor resistance parameter was changed from 6 mH, 0.5 to 10 mH, 2 at 0.06 s, and the parameter observer was added at 0.4 s, to realize the adaptive control when the sampling frequency was lower than the control frequency, and the simulation results are shown in Figure 12.
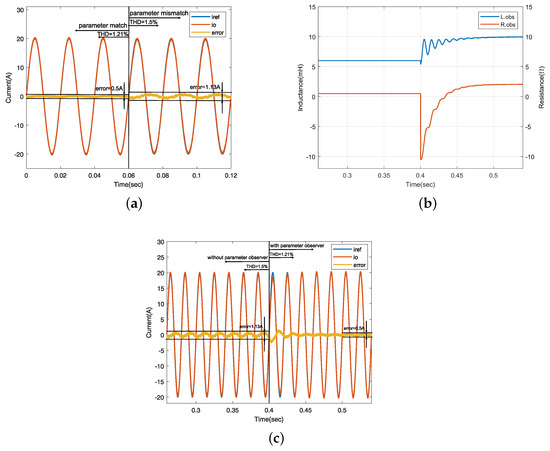
Figure 12.
Adaptive simulation result for improved FCS-MPC: (a) the effect of parameter mismatch on output current; (b) parameter observation result; (c) adaptive control effect with parameter observer.
The observed values of in Figure 12b are consistent with the actual values. From Figure 12c, it can be seen that after adding the parameter observer, the current tracking error and THD of the circuit were reduced when the circuit was stable. Comparing Figure 12a,b, it can be seen that, after adding the parameter observer when the parameters were not matched, the current tracking effect was consistent with the ideal situation when the parameters were matched. The effect caused by the parameter change was successfully resolved, and the improved FCS-MPC’s adaptive capability was verified when the sampling frequency was lower than the control frequency.
6. Experiment
In order to further verify the effectiveness of the proposed control scheme, an experimental hardware platform was built, as shown in Figure 13. The power level single-phase inverter used a silicon carbide power MOSFET C2M0080120 for the selection of the switching transistor, NI CompactRIO 9033 embedded Xilinx Kintex-7 160T FPGA as the controller, and an electric grid simulator Tewerd TPV7003T as the load. The current and voltage signals were collected by sensors LAH 50P, CHV-25P/50, and CHV-25P/200. The sensor signals were received by the analog input module NI9025, and the control signals were sent by the digital I/O module NI9401. When the sampling frequency was not mismatched with the control frequency, the sampling frequency was also 40 kHz. A buck experiment was performed to ensure safety, and the system parameters are shown in Table 1.
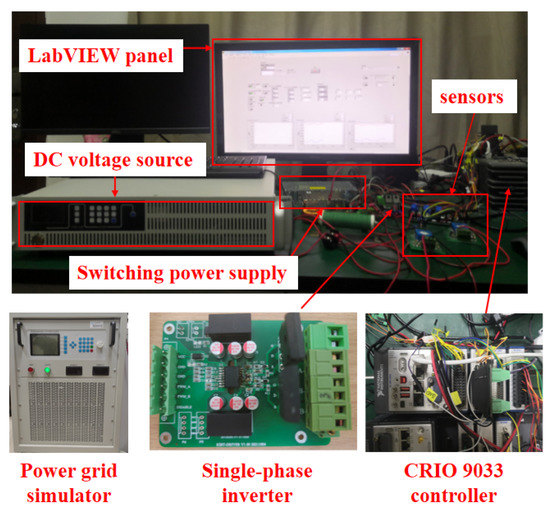
Figure 13.
Schematic diagram of adaptive control for improved FCS-MPC current and voltage sampling.

Table 1.
Experimental parameter table.
6.1. Experimental Verification of the Improved FCS-MPC
The current tracking waveform and FFT analysis were compared at the frequency mismatch ratio N = 4 under the control of the conventional FCS-MPC, the single multi-rate sampling improved FCS-MPC, and the dual multi-rate sampling improved FCS-MPC. As seen in Figure 14, the improved FCS-MPC current tracking error was significantly reduced. The current THD was decreased by 76% under the single multi-rate sampling improved FCS-MPC and by 3.19% under the dual multi-rate sampling improved FCS-MPC, respectively. The control effect was significantly enhanced.
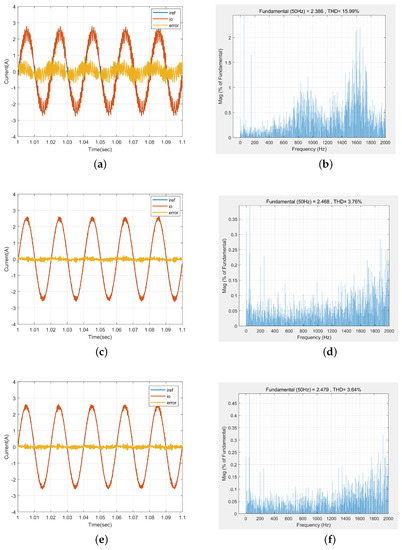
Figure 14.
Experimental results of the output current with the frequency mismatch ratio N = 4: (a,b) Output current waveform and FFT analysis of conventional FCS-MPC; (c,d) output current waveform and FFT analysis of single multi-rate sampling improved FCS-MPC; (e,f) output current waveform and FFT analysis of current and voltage dual multi-rate sampling improved FCS-MPC.
A comparison of the control effects under the conventional FCS-MPC, the single multi-rate sampling improved FCS-MPC, and the dual multi-rate sampling improved FCS-MPC at varying frequency mismatch ratios is shown in Figure 15.
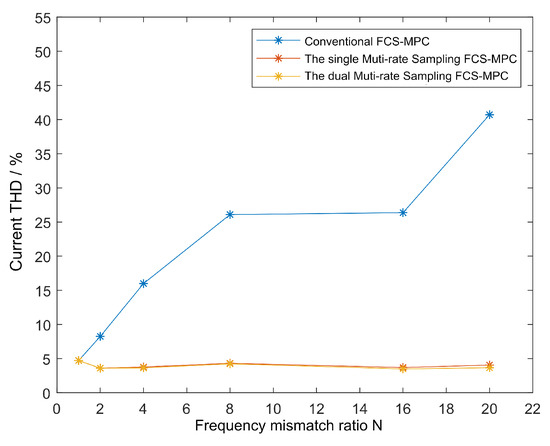
Figure 15.
Comparison of current THD under the conventional FCS-MPC, single multi-rate sampling improved FCS-MPC, and dual multi-rate sampling improved FCS-MPC when the frequency mismatch ratio was changed.
Similarly to the simulation, the improved FCS-MPC effectively improved the current tracking effect compared to the conventional FCS-MPC. The curve of the dual multi-rate sampling improved FCS-MPC coincided with the curve of the ideal case where the sampling frequency matched the control frequency. This shows that the proposed control method could achieve high-speed switching control at a low sampling frequency under different frequency mismatches.
6.2. Experimental Verification of Adaptive Control Effect at Low Sampling Frequency
In order to verify the observation effect of the parameter observer under low sampling frequency conditions, a sudden change of the circuit operating parameters was realized by switching a 10 mH inductor in parallel. The observation results of the adaptive observer are shown in Figure 16. The dynamic response time of the observed parameters was 43 ms and 60 ms when the inductor value was suddenly increased and decreased, respectively, which is a fast response. However, due to the sensor accuracy, calculation delay, and complexity of the actual circuit, there was an observation error of 4.5% in the experimental observation results, which is within the error allowance.
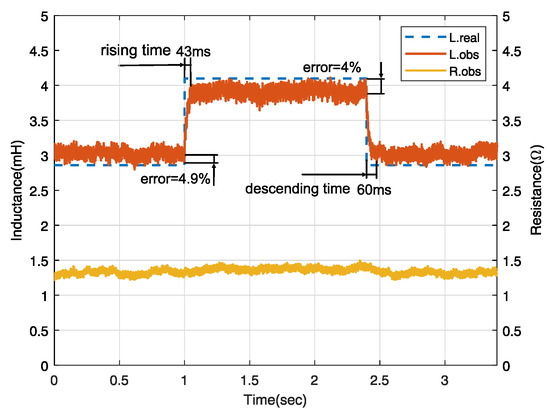
Figure 16.
Traditional, single multi-rate sampling improved, current and voltage dual multi-rate sampling improved FCS-MPC control output current THD comparison results when the frequency mismatch ratio changed.
In order to verify the adaptive control effect of the improved control strategy at a low sampling rate, the experimental results with and without the parameter observer are shown in Figure 17. The controller could quickly respond to the parameter changes after the circuit parameters were changed. The current tracking error and current THD were better reduced after stabilization than without the parameter observer. This indicates that the proposed method enhanced the control effect and realized the adaptive control of the dual multi-rate sampling improved FCS-MPC at a low sampling frequency.
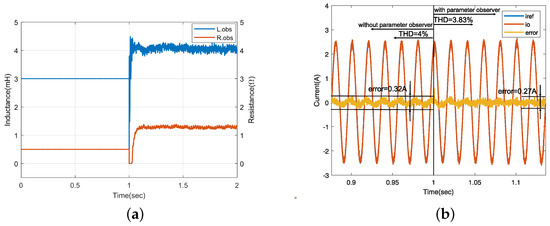
Figure 17.
Experimental result with the parameter observer: (a) parameter observation result; (b) output current result.
7. Discussion
FCS-MPC requires frequent sampling, and the control performance of the traditional FCS-MPC under different frequency mismatch situations was simulated. The results showed that the tracking error and THD of the current increase continuously as the sampling frequency decreases, indicating a decrease in control performance. However, the current sensor’s sampling frequency improvement lagged behind the increase in the controller’s control frequency. To eliminate the adverse effects caused by the frequency mismatch and enable the inverter to achieve high-speed switching control, even at low sampling frequencies, we proposed an improved FCS-MPC with multi-rate sampling. The key to solving the low sampling frequency problem lies in predicting the values at non-sampling moments.
This research initially used MATLAB/Simulink for simulation verification. By comparing it with the current tracking situation of traditional FCS-MPC, the results show that the improved FCS-MPC had a significant improvement effect on current tracking. It achieved the control effect of frequency matching (i.e., both the sampling frequency and the control frequency were relatively high), showing that the improved FCS-MPC eliminated the influence caused by the frequency mismatch. Afterward, the program was loaded into an NI CompactRIO 9033 controller using LabVIEW to perform physical switching control. By comparing the current tracking situation under the three control methods: the traditional FCS-MPC, single multi-rate sampling improved FCS-MPC, and double multi-rate sampling improved FCS-MPC, it was seen that the low-sampling-frequency effect on current was significantly improved under different mismatch conditions, and the calculation did not increase the computational burden too much, as shown in Table 2. In comparison, the effect of the double multi-rate sampling improved FCS-MPC was not obvious, which was due to the experimental conditions and other factors, leading to some errors in the input observer.
Table 2.
Comparison table of computational resources required by the three different methods.
When comparing the tracking performance of the current before and after the introduction of the parameter observer, it was observed that there was a dip in the identification of model parameters at the moment the observer was introduced. This was because the observer estimation of the model required a certain convergence time, and further research is required to resolve this issue. Moreover, the effectiveness of the observer was affected when encountering interharmonics or when there were unmodeled parts in the system.
The results of this study can be applied to an FCS-MPC with high control frequency and low sampling frequency, solving the problem of the decreased control performance caused by frequency mismatch. In this study, the effectiveness of the improved FCS-MPC was demonstrated by comparing it with the traditional FCS-MPC. However, due to limited research on frequency mismatch conditions, it was not compared with other solutions, which would provide a more comprehensive understanding of its effectiveness.
8. Conclusions
This article first proposed an improved FCS-MPC strategy based on the principle of current model predictive control. By using the current prediction value closest to the reference current obtained from the previous time step’s value function, the current at the non-sampling time is estimated. An integral input observer is used to estimate the voltage at the non-sampling time, allowing the inverter to achieve high-speed switching control, even at low sampling frequencies. The effectiveness of the improved FCS-MPC strategy was verified through simulations and experiments. Additionally, considering the mismatch of the inductance and resistance parameters, a sine signal observer was designed, to identify the true circuit parameters under frequency mismatch conditions. The experimental results showed that the observer identification results were accurate and could improve the control effectiveness of the improved FCS-MPC.
The proposed method overcomes the limitations of traditional research on parameter mismatch issues and improves the FCS-MPC from the perspective of frequency mismatch. It can be applied to inverter control with high control frequency and low sampling frequency, solving the problem of the decreased control performance caused by frequency mismatch.
Author Contributions
Conceptualization, Y.S. and X.H.; methodology, X.H. and X.T.; software, C.W.; validation, C.W. and X.T.; investigation, Y.S. and K.F.; writing, X.H. and C.W.; funding support, K.F. All authors have read and agreed to the published version of the manuscript.
Funding
This research received no external funding.
Data Availability Statement
Not applicable.
Conflicts of Interest
The authors declare no conflict of interest.
References
- Blaabjerg, F.; Yang, Y.; Yang, D.; Wang, X. Distributed power-generation systems and protection. Proc. IEEE 2017, 105, 1311–1331. [Google Scholar] [CrossRef]
- Lin, Z.; Ruan, X.; Wu, L.; Zhang, H.; Li, W. Multi-Resonant-Component Based Grid Voltage Weighted Feedforward Scheme for Grid-Connected Inverter to Suppress the Injected Grid Current Harmonics Under Weak Grid. IEEE Trans. Power Electron. 2020, 35, 9784–9793. [Google Scholar] [CrossRef]
- Yang, H.; Eggers, M.; Teske, P.; Dieckerhoff, S. Comparative Stability Analysis and Improvement of Grid-Following Converters Using Novel Interpretation of Linear Time-Periodic Theory. IEEE J. Emerg. Sel. Top. Power Electron. 2022, 10, 7049–7061. [Google Scholar] [CrossRef]
- Roy, S.; Pico, H.N.V. Transient Stability and Active Protection of Power Systems With Grid-Forming PV Power Plants. IEEE Trans. Power Syst. 2023, 38, 897–911. [Google Scholar] [CrossRef]
- Khosravi, N.; Echalih, S.; Hekss, Z.; Baghbanzadeh, R.; Messaoudi, M.; Shahideipour, M. A New Approach to Enhance the Operation of M-UPQC Proportional-Integral Multiresonant Controller Based on the Optimization Methods for a Stand-Alone AC Microgrid. IEEE Trans. Power Electron. 2023, 38, 3765–3774. [Google Scholar] [CrossRef]
- Gangavarapu, S.; Verma, M.; Rathore, A.K. A Novel Transformerless Single-Stage Grid-Connected Solar Inverter. IEEE J. Emerg. Sel. Top. Power Electron. 2023, 11, 970–980. [Google Scholar] [CrossRef]
- Mattos, E.; Borin, L.C.; Osorio, C.R.D.; Koch, G.G.; Oliveira, R.C.L.F.; Montagner, V.F. Robust Optimized Current Controller Based on a Two-Step Procedure for Grid-Connected Converters. IEEE Trans. Ind. Appl. 2023, 59, 1024–1034. [Google Scholar] [CrossRef]
- Khan, M.Y.A.; Liu, H.; Shang, J.; Wang, J. Distributed hierarchal control strategy for multi-bus AC microgrid to achieve seamless synchronization. Electr. Power Syst. Res. 2023, 214, 108910. [Google Scholar] [CrossRef]
- Long, B.; Lu, P.; Zhan, D.; Lu, X.; Rodriguez, J.; Guerrero, J.M.; Chong, K.T. Adaptive fuzzy fractional-order sliding-mode control of LCL-interfaced grid-connected converter with reduced-order. Isa Trans. 2023, 132, 557–572. [Google Scholar] [CrossRef]
- Guler, N. Multi-objective cost function based finite control set-sliding mode control strategy for single-phase split source inverters. Control. Eng. Pract. 2022, 122, 105114. [Google Scholar] [CrossRef]
- Roy, T.K.; Ghosh, S.K.; Saha, S. Robust backstepping global integral terminal sliding mode controller to enhance dynamic stability of hybrid AC/DC microgrids. Prot. Control. Mod. Power Syst. 2023, 8, 8. [Google Scholar] [CrossRef]
- Zhang, M.; Xu, Q.; Wang, X. Physics-Informed Neural Network Based Online Impedance Identification of Voltage Source Converters. IEEE Trans. Ind. Electron. 2023, 70, 3717–3728. [Google Scholar] [CrossRef]
- Jasim, A.M.; Jasim, B.H.; Bures, V.; Mikulecky, P. A New Decentralized Robust Secondary Control for Smart Islanded Microgrids. Sensors 2022, 22, 8709. [Google Scholar] [CrossRef]
- Ayyagari, K.S.; Gonzalez, R.; Yufang, J.; Alamaniotis, M.; Ahmed, S.; Gatsis, N. Learning Reactive Power Control Polices in Distribution Networks Using Conditional Value-at-Risk and Artificial Neural Networks. J. Mod. Power Syst. Clean Energy 2023, 11, 201–211. [Google Scholar] [CrossRef]
- Diaz-Bustos, M.; Baier, C.R.; Torres, M.A.; Melin, P.E.; Acuna, P. Application of a Control Scheme Based on Predictive and Linear Strategy for Improved Transient State and Steady-State Performance in a Single-Phase Quasi-Z-Source Inverter. Sensors 2022, 22, 2485. [Google Scholar] [CrossRef] [PubMed]
- Dong, Q.; Wang, B.; Xia, L.; Yu, Y.; Tian, M.; Xu, D. A Virtual Voltage Field-Weakening Scheme of Trajectory Correction for PMSM Model Predictive Control. IEEE Trans. Power Electron. 2023, 38, 3044–3056. [Google Scholar] [CrossRef]
- Harbi, I.; Ahmed, M.; Rodriguez, J.; Kennel, R.; Abdelrahem, M. Low-Complexity Finite Set Model Predictive Control for Split-Capacitor ANPC Inverter With Different Levels Modes and Online Model Update. IEEE J. Emerg. Sel. Top. Power Electron. 2023, 11, 506–522. [Google Scholar] [CrossRef]
- Young, H.A.; Perez, M.A.; Rodriguez, J. Analysis of finite-control-set model predictive current control with model parameter mismatch in a three-phase inverter. IEEE Trans. Ind. Electron. 2016, 63, 3100–3107. [Google Scholar] [CrossRef]
- Ke, D.; Wang, F.; Li, J. Predictive Current Control of Permanent Magnet Synchronous Motor Based on an Adaptive High-gain Observer. Zhongguo Dianji Gongcheng Xuebao/Proc. Chin. Soc. Electr. Eng. 2021, 41, 728–737. [Google Scholar]
- Niu, S.; Luo, Y.; Fu, W.; Zhang, X. Robust Model Predictive Control for a Three-Phase PMSM Motor With Improved Control Precision. IEEE Trans. Ind. Electron. 2021, 68, 838–849. [Google Scholar] [CrossRef]
- Li, P.; Li, R.; Feng, H.; He, Y.; Zhang, J. Improvement of model predictive control for single-phase inverters by using sinusoidal signal observers. IET Power Electron. 2020, 13, 3841–3850. [Google Scholar] [CrossRef]
- Long, B.; Zhu, Z.; Yang, W.; Chong, K.T.; Rodriguez, J.; Guerrero, J.M. Gradient Descent Optimization Based Parameter Identification for FCS-MPC Control of LCL-Type Grid Connected Converter. IEEE Trans. Ind. Electron. 2022, 69, 2631–2643. [Google Scholar] [CrossRef]
- Brosch, A.; Hanke, S.; Wallscheid, O.; Bocker, J. Data-Driven Recursive Least Squares Estimation for Model Predictive Current Control of Permanent Magnet Synchronous Motors. IEEE Trans. Power Electron. 2021, 36, 2179–2190. [Google Scholar] [CrossRef]
- Comarella, B.V.; Carletti, D.; Yahyaoui, I.; Encarnacao, L.F. Theoretical and Experimental Comparative Analysis of Finite Control Set Model Predictive Control Strategies. Electronics 2023, 12, 1482. [Google Scholar] [CrossRef]
- Saavedra, J.L.; Baier, C.R.; Marciel, E.I.; Rivera, M.; Carreno, A.; Hernandez, J.C.; Melin, P.E. Comparison of FCS-MPC Strategies in a Grid-Connected Single-Phase Quasi-Z Source Inverter. Electronics 2023, 12, 2052. [Google Scholar] [CrossRef]


Disclaimer/Publisher’s Note: The statements, opinions and data contained in all publications are solely those of the individual author(s) and contributor(s) and not of MDPI and/or the editor(s). MDPI and/or the editor(s) disclaim responsibility for any injury to people or property resulting from any ideas, methods, instructions or products referred to in the content. |
© 2023 by the authors. Licensee MDPI, Basel, Switzerland. This article is an open access article distributed under the terms and conditions of the Creative Commons Attribution (CC BY) license (https://creativecommons.org/licenses/by/4.0/).