Article

A Fault Diagnosis Method for Power Battery Based on Multiple Model Fusion

1
College of Quality & Safety Engineering, China Jiliang University, Hangzhou 310018, China
2
China Automotive Engineering Research Institute Co., Ltd., Chongqing 401120, China
*
Author to whom correspondence should be addressed.
Electronics 2023, 12(12), 2724; https://doi.org/10.3390/electronics12122724
Submission received: 8 May 2023 / Revised: 7 June 2023 / Accepted: 13 June 2023 / Published: 19 June 2023

Abstract

:
The widespread adoption and utilization of electric vehicles has been constrained by power battery performance. We proposed a fault diagnosis method for power batteries based on multiple-model fusion. The method effectively fused the advantages of various classification models and avoided the bias of a single model towards certain fault types. Firstly, we collected and sorted parameter information of the power battery during operation. Three common neural networks: back propagation (BP) neural network, convolution neural network (CNN), and long short-term memory (LSTM) neural network, were applied to battery fault diagnosis to output the fault types. Secondly, the fusion algorithm proposed in this paper determined the accurate fault type. Based on the improved voting method, the proposed fusion algorithm, named the multi-level decision algorithm, calculated the voting factors of the diagnostic results of each classification model. According to the set decision thresholds, multi-level decision voting was conducted to avoid neglecting effective classification information from minority models, which can occur with traditional voting methods. Finally, the accuracy and effectiveness of the proposed method were verified by comparing the accuracy of each classification model with the multiple model fusion algorithm.

Graphical Abstract

1. Introduction

Driven by environmental protection and energy conservation, the transportation sector has extensively implemented the low-carbon economy. Electric vehicle (EV) plays a crucial role in new green and environmentally friendly transportation due to clean energy and low energy consumption [1]. The power battery system is the main energy source of electric vehicles [2]. The power battery system usually consists of several battery cells connected in series and parallel [3,4]. The inevitable performance degradation during the operation of the battery can lead to a decrease in the driving range, deterioration of power performance, shortened service life, and increased hazards. Moreover, a failure of a single battery cell will impact the entire power battery [5]. Therefore, research on fault diagnosis of power battery systems is of important practical significance and application value. Diagnosing the power battery can provide timely warnings and detect battery failures, which is beneficial for maintaining faulty batteries hence improving the safety and service life of the power battery.
Some faults are obvious and easily diagnosed, such as overvoltage, overcharge, abnormal SOC, etc. However, some insignificant faults exist, such as reduced battery capacity and high internal resistance. Multiple factors cause these faults, and there is uncertainty and ambiguity between the fault symptoms and the cause. At present, the research direction for battery fault diagnosis mainly focuses on signal processing and neural networks [6,7]. Signal processing-based methods mainly analyze the waveform and amplitude of the measured signal in the time or frequency domain. Commonly measured signals include voltage signals, current signals, and temperature signals [8,9,10]. Liu et al. [11] constructed a fault diagnosis model based on voltage data of a single battery cell and proposed a method for diagnosing voltage inconsistency of a power battery using a fast Fourier transform and anomaly coefficient evaluation. This method is suitable for diagnosing a single fault type, but not for multiple types. Wang et al. [12] proposed a voltage anomaly diagnosis method based on improved Shannon entropy and Z-score, effectively detecting voltage anomalies and predicting the time and location of voltage faults, preliminarily achieving thermal runaway warning. This method can effectively detect and locate battery faults, but the computational complexity will increase with the improvement of diagnostic accuracy. Zhao et al. [13] combined the advantages of fuzzy logic and neural networks to describe fault symptoms through fuzzy logic and learn battery faults through neural networks, achieving an accurate diagnosis of battery faults. Gu et al. [14] designed a battery fault diagnosis system based on the RBF neural network, which can accurately diagnose the type and level of battery faults. Hong et al. [15] applied LSTM to diagnose abnormal voltage states of the battery system, and Deng et al. [16] proposed a battery fault diagnosis method based on a multi-classification support vector machine (SVM). Qiu et al. [17] proposed a diagnosis method based on non-linear autoregressive exogenous neural networks and boxplots. The NARX neural network predicted the future battery voltage based on the collected voltage and current data. The boxplot is then used to diagnose battery faults based on the predicted voltage.
Non-neural techniques also have great potential in prediction and fault diagnosis. Taylor et al. [18] proposed a modular regression model with interpretable parameters, the model can predict the time series effectively and reliably. Thiyagarajan et al. [19] presented a sensor failure detection and faulty data accommodation (SFDFDA) approach that embraces a seasonal autoregressive integrated moving average model with a statistical hypothesis testing technique for enabling temporal forecasting of sensor variables. Thiyagarajan et al. [20] incorporated a forecasting technique based on the past time series of sparse data using an autoregressive integrated moving average (ARIMA) model, they set a criterion for detecting anomalies and issued a warning for sensor failure based on the 95% forecast interval and continuity of faulty data. The above non-neural technologies are all used to predict and detect anomalies in time series and do not apply to the data types in this paper and cannot identify multiple fault types. Therefore, this paper chooses a neural network model for fault diagnosis.
Different neural network models have varying recognition performances. One neural network model may only have good diagnostic performance for a certain fault type, but a single model is difficult to cover all fault types with high accuracy. Therefore, the fusion of multiple models’ output results is more reliable and also achieves information complementarity among different neural network models [21]. The main methods of model fusion include the maximum value, product, summation, mean, and voting methods [22,23]. The first four fusion methods require the output of the classification model to be in the form of probability values and are not suitable for classification models where the output is the type of the sample [24]. The arbitration principle of the voting method is “Majority rule”, and a strictly enforced majority rule is likely to neglect the effective classification information of the minority model [25]. At the same time, it is a major challenge for multiple model fusion when the difference in the confidence level of the classification model outputs is small.
Considering the above issues, we proposed a fault diagnosis method for electric vehicle power batteries based on multiple model fusion. Three common neural networks: back propagation (BP) neural network, convolutional neural network (CNN), and long short-term memory (LSTM) neural network were selected as the classification models. The preprocessed battery monitoring data was input into the three classification models for training, and the optimal model structure was obtained. Three classification models diagnosed battery faults and output the fault type. The most accurate fault type among multiple fault types was determined by fusion algorithms. Based on the improved voting method, the fusion algorithm, named the multi-level decision algorithm, calculated the voting factors of the diagnostic results of each classification model. According to the set decision thresholds, multi-level decision voting was conducted to assign voting weights to each classification model (which made different decisions in different situations). The ultimate diagnostic result was determined by selecting the highest voting weight. The multi-level decision algorithm can effectively fuse the advantages of various classification models, while also considering the comprehensive diagnostic capability of each classification model.

2. Multiple Model Fusion Diagnostic Method

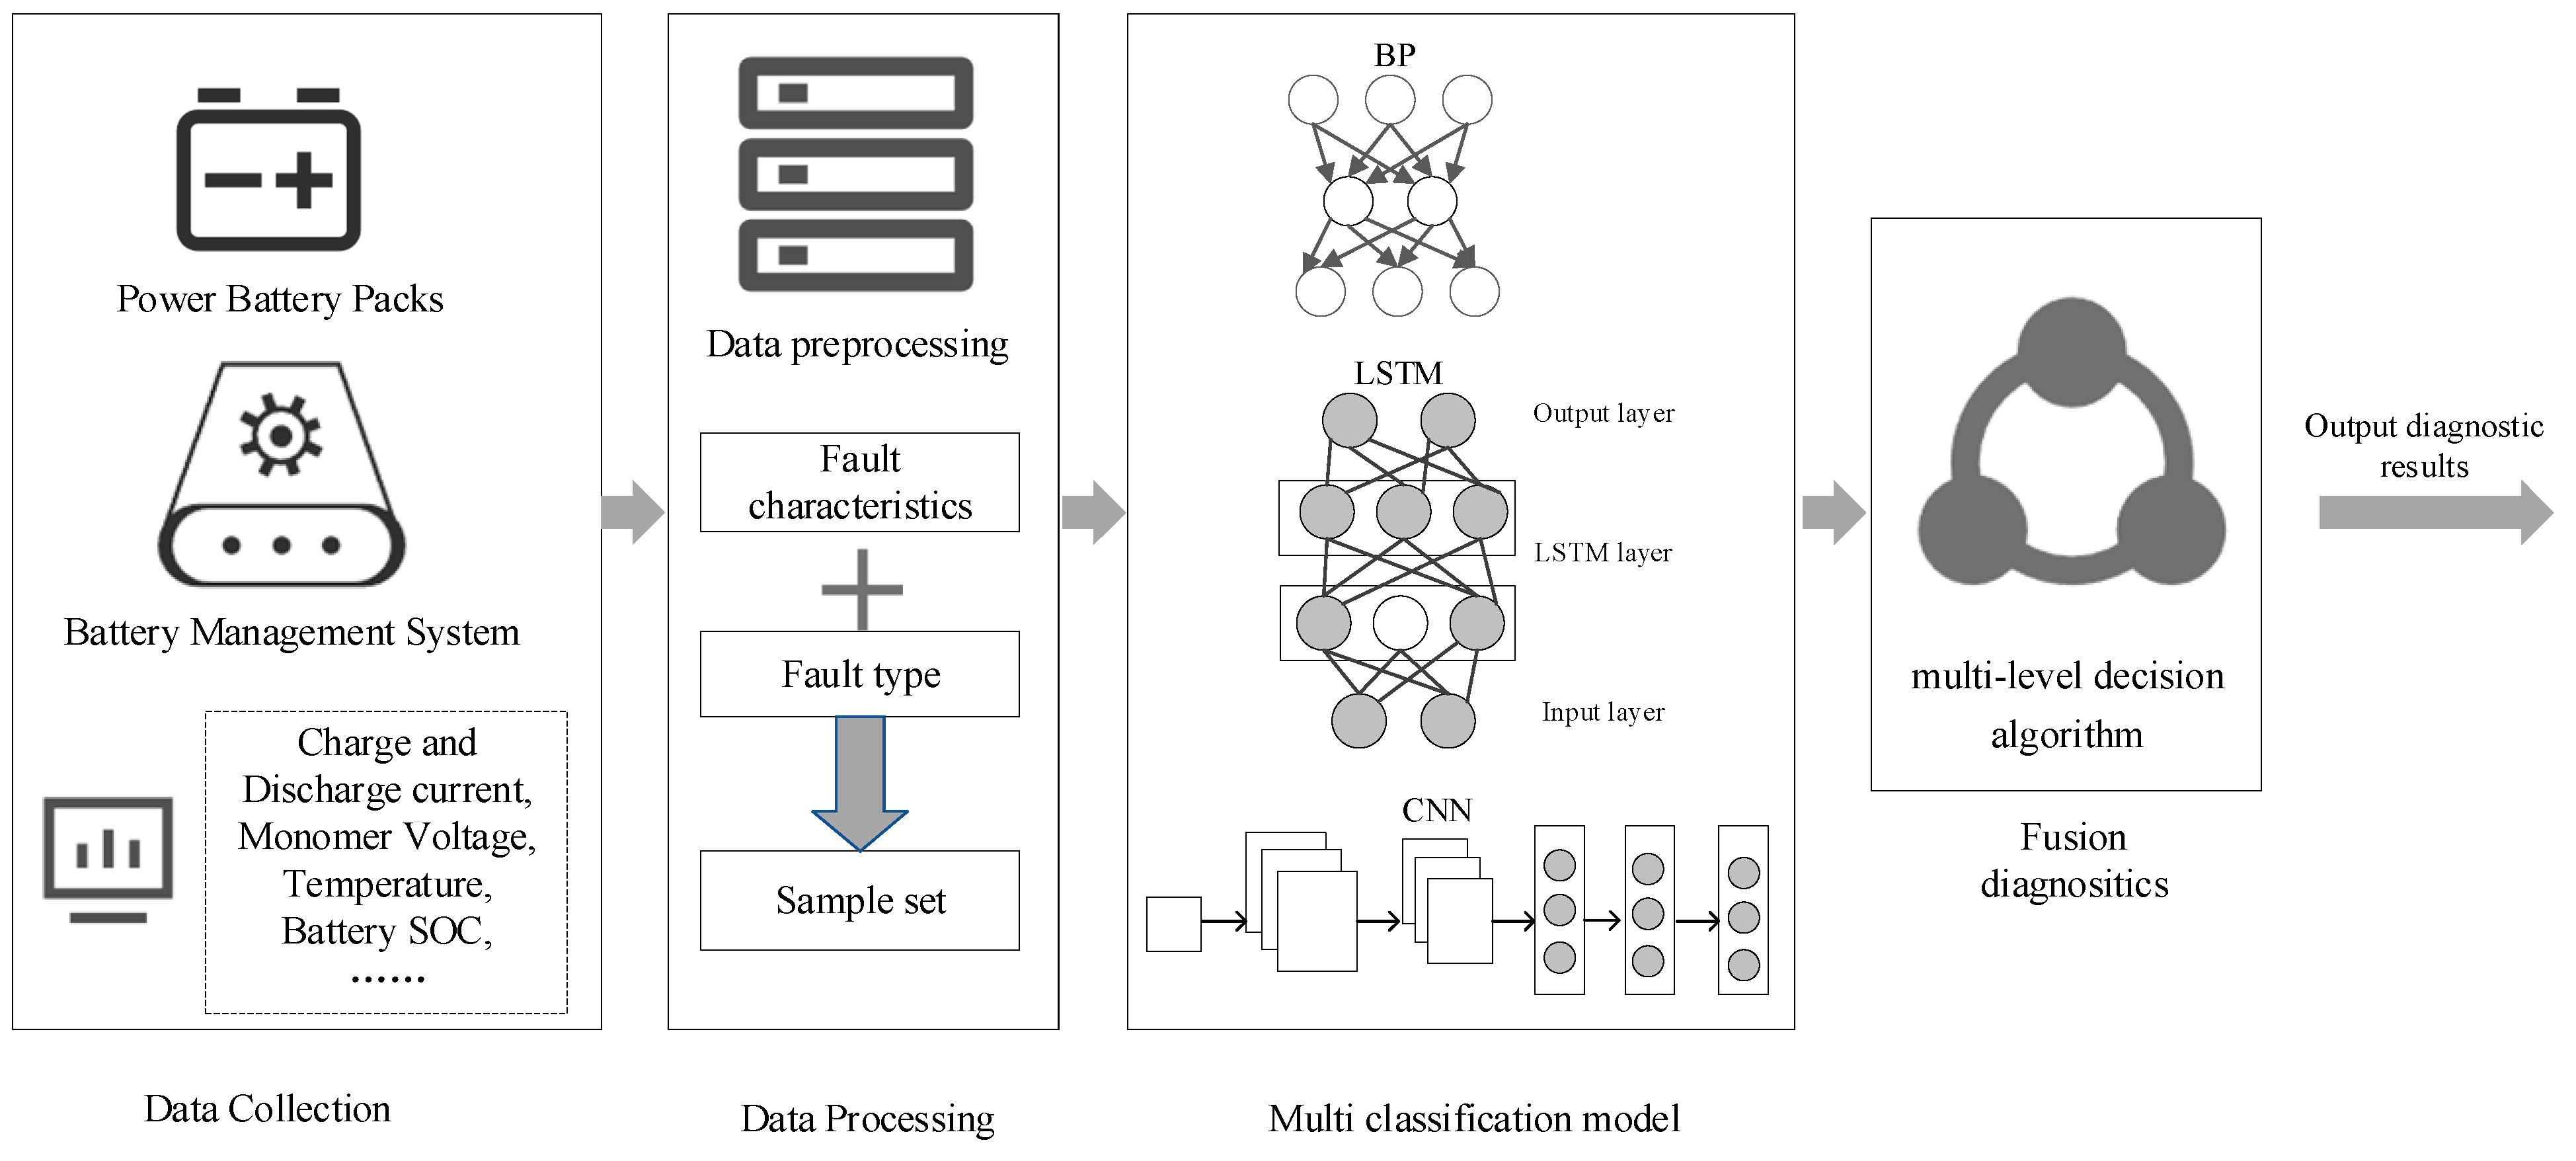
2.1. Multiple Model Fusion Architecture

Series and parallel modes are two types of architectures for multi-classification model fusion. In series mode, multiple classification models are connected in series, and the former classification model provides classification information for the subsequent classification model. In parallel mode, each classification model is designed independently, and each classification model outputs classification information. Then, the results of each classification model are fused according to the fusion algorithm to obtain the final classification results.
The multiple model fusion diagnostic in this paper adopted a parallel mode. The multi-level decision algorithm fused the classification results of BP, CNN, and LSTM, and determined the final fault type. The framework of multiple model fusion diagnostic is shown in Figure 1.

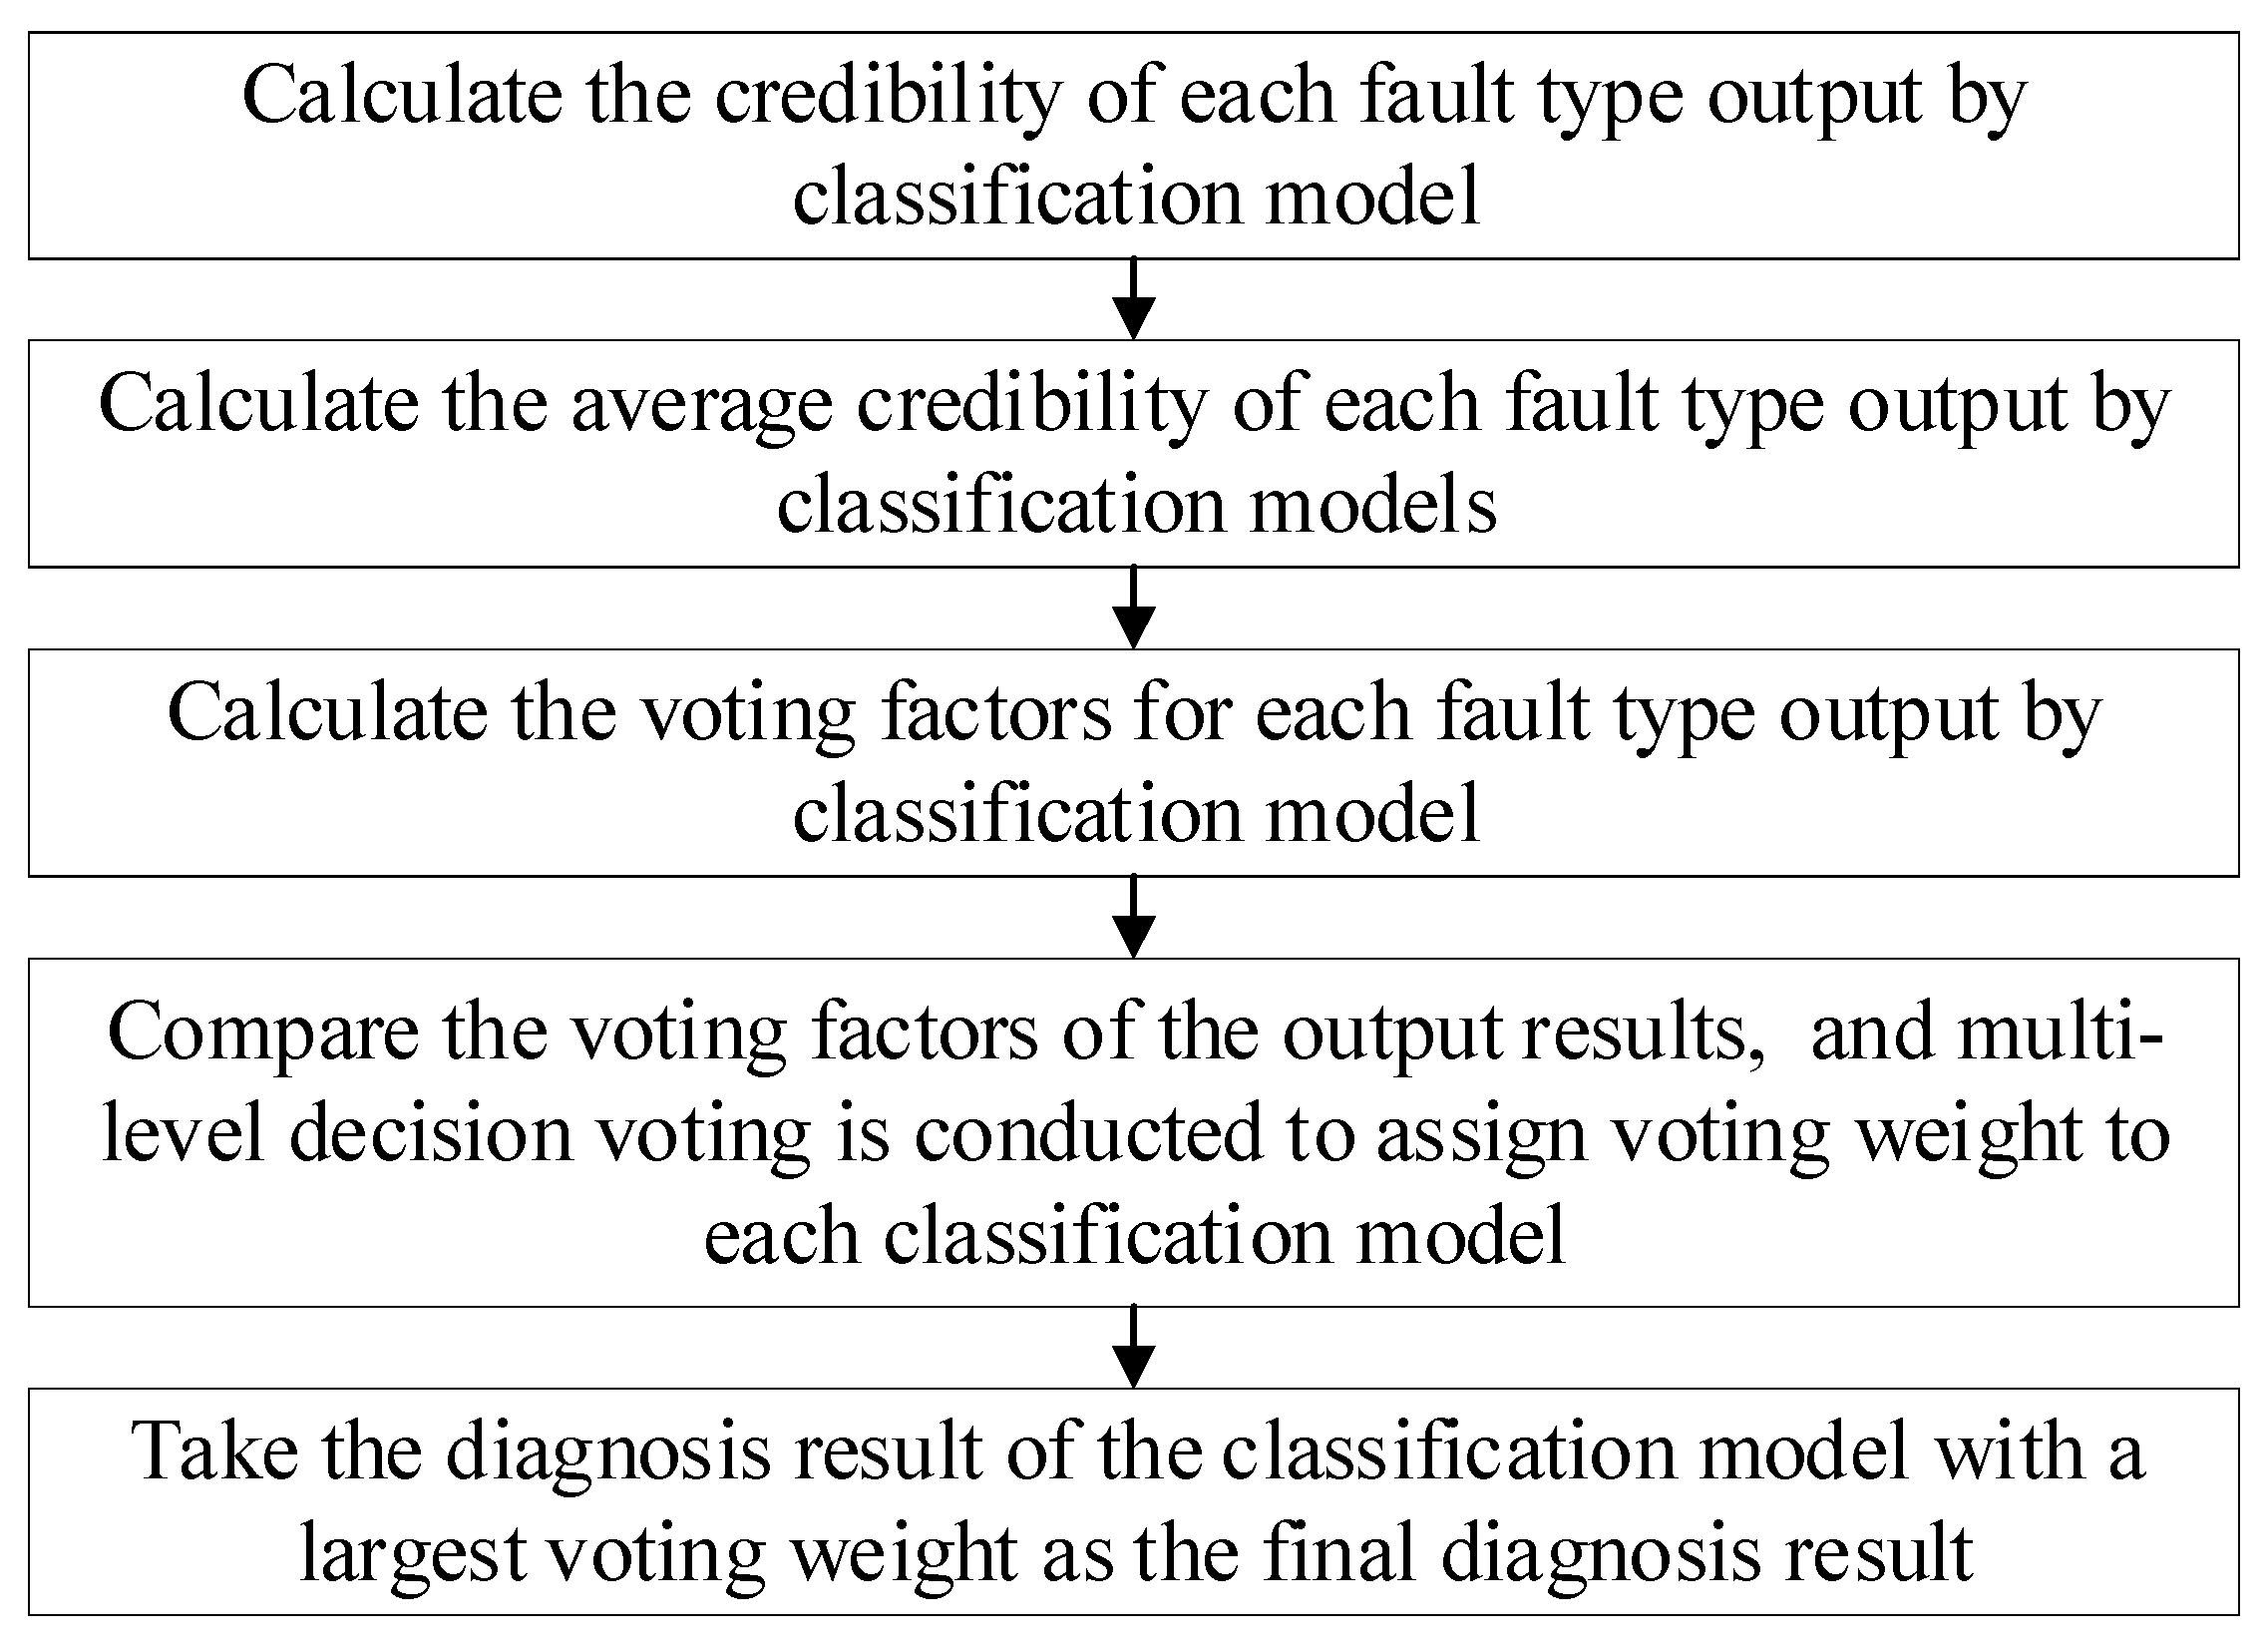
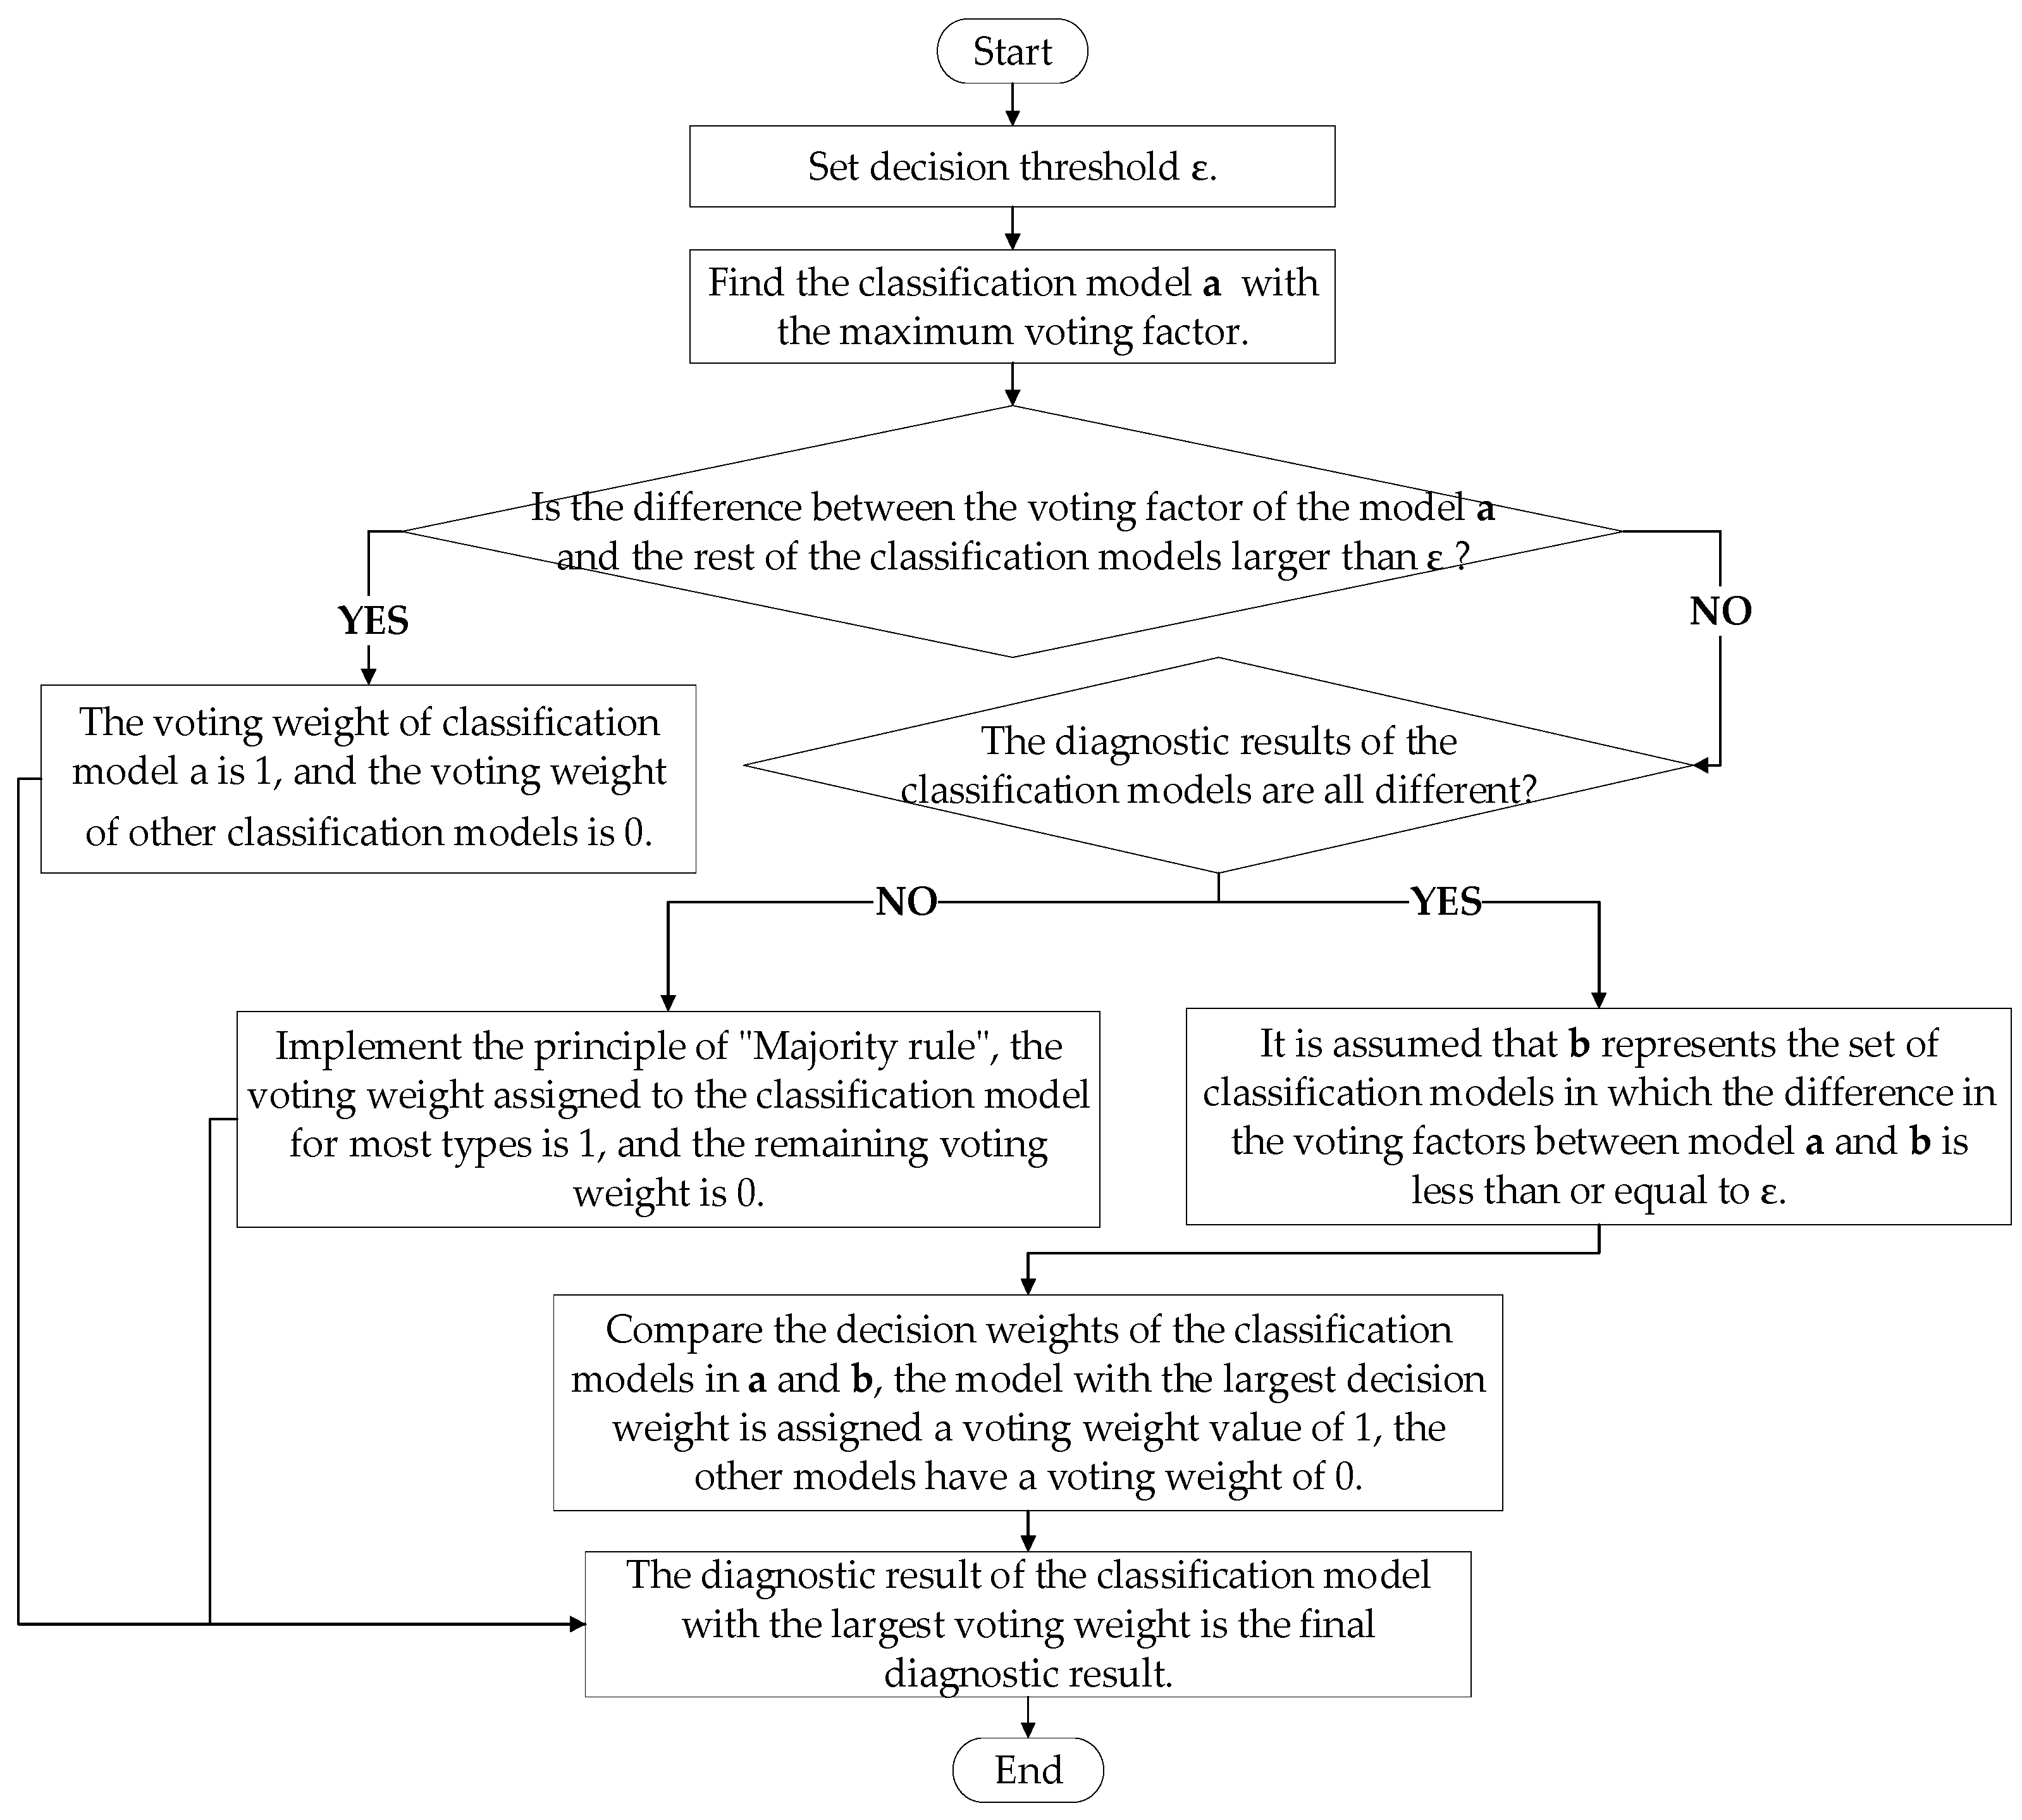
2.2. Multi-Level Decision Algorithm

The fusion algorithm plays a crucial role in multiple-model fusion diagnostics. The multi-level decision algorithm proposed in this paper comprehensively utilized the effective classification information provided by each classification model, fused the advantages of each classification model, and outputs reliable and accurate diagnostic results. The process of multiple model fusion is shown in Figure 2.
Step 1: Calculate the credibility of fault type (including normal state) output by each classification model, x i represents the actual number of samples in type i , and x j i represents the number of samples input into the j -th classification model that are classified into type i .
β j i = { x i / x j i   , x j i   x i   x j i / x i   ,   x j i < x i
In Equation (1), β j i represents the credibility of the j -th classification model output type i , in Equation (2), β i ¯ represents the average credibility of the m classification models output type i , there are k + 1 fault types, i = 0 , 1 , 2 , k .
β i ¯ = j = 1 m β j i / m
Step 2: Calculate the voting factor for fault type output by each classification model, n i s j represents the number of samples for which the j -th classification model diagnoses type i as type   s .
P i j = n i i j / s = 0 k n s i j
R i j = n i i j / s = 0 k n i s j
In Equations (3) and (4), P i j represents the prediction precision rate of the j -th classification model for type i , which measures the accuracy of the classification model’s diagnostic results for a certain type, R i j represents the prediction recall rate of the j -th classification model for type i , which measures the coverage of the classification model for a certain type, and E j i represents the voting factor of the j -th classification model output type i , as shown in Equation (5).
E j i = β i ¯ P i j R i j
Step 3: During fault diagnosis, the voting factors of the diagnostic results of each classification model were compared, and multi-level decision voting was conducted to assign voting weights to each classification model. Take the diagnostic result of the classification model with the largest voting weight as the final diagnostic result.
The multi-level decision algorithm proposed is an improved voting method. The voting method is a common algorithm for multi-classification model fusion, with the basic voting principle of “one person, one vote” and the arbitration principle of “Majority rule” [26]. The performance of each classification model is different, and the recognition performance for each classification is also different. We improved the voting principles in conjunction with arbitration principles and set decision thresholds to make different decisions in different situations. The method can effectively consider the classification information of minority types. At the same time, when the differences between voting factors in the output results of the classification model are not significant, further judgments are made to reach a more accurate and reasonable conclusion. The steps for multi-level decision voting are shown in Figure 3:
(1)
Set a decision threshold ε , when there is no significant difference in the voting factors between the two classification models, it is necessary to make the next level judgment on the results of the classification model to determine the final diagnostic result.
ε = λ × max ( e 1 , e 2 , e m )
In Equation (6), λ is the decision threshold coefficient, take λ times the maximum voting factor from m classification models as the decision threshold, λ [ 0 ,   1 ] , e m represents the set of voting factors for each fault type output by the m -th classification model. Observe the difference between each voting factor and suggest a value of ε between the minimum difference and the maximum difference.
(2)
Classification model a with the maximum voting factor is identified. When the difference between the voting factors of the model a and other classification models is larger than ε , assign a voting weight of 1 to the classification model a , and 0 to the other classification models. Otherwise, skip to the next level of decision—step 3.
V j = { 1   ,   E j = max ( E 1 , E 2 , E m ) 0   ,   E j max ( E 1 , E 2 , E m )  
In Equation (7), V j represents the voting weight of the j -th classification model, and E j represents the voting factor of the diagnostic result of the j -th classification model during the actual diagnosis process. For example, if the output result of the first classification model is type 1, then E 1 = E 11 .
(3)
When the same diagnostic results exist in the classification models, the principle of majority rule is implemented to identify the majority T in the output results.
V j = { 1   ,   T j = T   0   ,   T j T  
In Equation (8), T j represents the fault type diagnosed by the j -th classification model. When the diagnostic results of m -th classification model are different, skip to the next level of decision—step 4.
(4)
Assuming b represents the set of base class models whose difference in voting factors of classification model a is less than or equal to ε , compare the decision weight A j of model a and the models in set b as is shown in Equation (9).
A j = i = 0 k n i i j / i = 0 k s = 0 k n i s j
A j represents the decision weight of the j -th classification model, also represents the accuracy rate of model diagnosis, and the voting weight at this time is shown in Equation (10).
V j = { 1   ,   A j = max ( A a , A b )   0   ,   A j max ( A a , A b )  
(5)
Based on the above multi-level decision algorithm, the diagnostic results of the classification models with the maximum voting weight are selected.
This paper has no limit on the number of classification models and fault types. When the number of classification models and types increases, this paper’s multiple model fusion diagnosis method is also applicable and can be modified and used according to actual application situations.

3. Experimental Design and Result Analysis

3.1. Preparation and Processing of Experimental Data

3.1.1. Data Introduction

To ensure the safe operation of new energy vehicles and promote the development of the new energy vehicle industry in a better direction, China has established a national regulatory platform for new energy vehicles (hereinafter referred to as the platform), electric vehicle belongs to new energy vehicle. The data collection process of the platform mainly includes obtaining vehicle operation data based on multiple sensors and collecting the data into the Telematics BOX (T-Box), then transmitting it to the platform’s storage server through a wireless network. the platform currently includes 61 data items, including vehicle, power battery system, drive motor, and vehicle position data. Common data items include vehicle speed, cumulative mileage, SOC, the total voltage of the power battery system, cell voltage, current, probe temperature, etc. The battery fault data used in this paper is collected on this platform, the extraction requirements of in-vehicle data can be specifically referred to GA/T 1998–2022 Technical Specification for Extraction of Automotive In-Vehicle Electronic Data. Data are collected every 10 s with a sampling accuracy of 1 millivolt.
We collected the parameter information of a certain electric vehicle’s power battery under normal and fault conditions, including battery current, SOC, total voltage, cell voltage, cell temperature, highest voltage cell number, lowest voltage cell number, highest temperature cell number, and lowest temperature cell number. Each parameter information corresponds to the battery fault type. The battery type studied is ternary material battery, which contains 174 cells. The standard working voltage of a single cell is 3.6 V, the upper limit voltage of charge is 4.15 V, and the lower limit voltage of discharge is 2.8 V, the continuous discharge current shall not exceed 480 A in 10 s and 300 A in 60 s.
There is a total of 15 fault alarm information related to the power battery system in the “Technical Specification for Remote Service and Management System of Electric Vehicles” (GB/T3296-2016), which are classified according to the type of fault alarm, including temperature fault, voltage fault, capacity abnormal fault, serious inconsistency fault of the cell, battery management system fault, and other electrical faults. Among them, temperature and voltage faults are the most common fault types, which may cause serious consequences. The selected fault types commonly occur in actual operation, the fault types include excessive temperature difference, battery overheating, battery overvoltage, and battery undervoltage. To represent all the states of the battery in actual diagnosis, the normal state of the battery was added, with a total of 5 fault types numbered 0, 1, 2, 3, and 4 in sequence. Below are explanations for the four types of faults:
(1)
Excessive temperature difference: It refers to the uneven temperature inside the battery system, which affects the performance and lifespan of the battery. When the temperature difference inside the battery system is too large, it will lead to battery capacity reduction, slow charging speed, and may lead to battery fire and other safety issues. Long-term use of the battery in high- or low-temperature environments, and uneven heat dissipation of the system, may lead to excessive battery temperature difference.
(2)
Battery overheating: It refers to the internal temperature of the battery being too high, exceeding the rated temperature of the battery system. The charging and discharging process of the power battery is accompanied by the violent motion of the electrons, which brings about the thermal effect, Overheating may cause the battery to rapidly lose capacity, slow down charging speed, or in more severe cases, cause the battery to catch fire and explode, resulting in serious safety issues. Frequent charging and discharging may lead to battery overheating, especially in high-temperature environments, external short-circuit, internal short-circuit, and insufficient cooling system cooling capacity.
(3)
Battery overvoltage: It refers to the working voltage of the battery exceeding the rated voltage value of the battery system. Overvoltage in batteries usually leads to a sharp decrease in energy density, slower charging speed, and reduced capacity. In more severe cases, the battery may catch fire or even explode due to internal heating, causing harm to personnel and property. Long-term overcharging, high charging voltage, especially when using non-standard battery chargers or unreliable power sources, and failure to follow the charging time, charging voltage, and charging current limits provided in the battery instructions during battery charging, may lead to battery overvoltage.
(4)
Battery undervoltage: It refers to the working voltage of the battery is lower than the rated voltage value of the battery system, especially during continuous use. Undervoltage of the battery can lead to a decrease in battery performance, reduced capacity, and slower charging speeds, which may affect the battery’s lifespan. Using the battery when the battery level is low, frequent excessive discharge, and failure to follow the charging time, voltage, and current limits in the battery instructions may lead to battery undervoltage.

3.1.2. Data Processing

The fault characteristics were determined by the parameter information of the power battery in normal and fault conditions. The sample set consisted of fault characteristics and fault types. There are many interference factors in the process of platform data collection, such as vehicle sensors, signal cables, transmission network signals, etc., and there are many invalid values, duplicate values, and missing values, we regard these as the first kind of outlier. The second kind of outlier is an effective representation of our fault diagnosis. The classification model constantly learns the relationship between these outliers and fault types to improve the ability of fault diagnosis. Before fault diagnosis, data processing was required. First, delete the first kind of outliers, including invalid, duplicate, and missing values. Then, the total voltage was divided by the total number of battery cells, and the highest temperature among the battery cell temperatures was considered the battery temperature. The highest and lowest voltage battery cell numbers and the highest and lowest temperature battery cell numbers were divided by the total number of battery cells. The processed sample set consisted of 4000 pieces, each with 182 dimensions, the complete data can be found in Table S1 in the Supplementary Materials. The sample set was randomly divided into training, testing, and validation sets. The training and testing sets were used to train and optimize the classification model. The validation set compared the diagnostic performance of the three classification models and the multiple model fusion. The testing and validation sets each contained 200 pieces of data, with the remaining data allocated to the training set.

3.2. Battery Fault Diagnosis Based on Three Classification Models

3.2.1. Settings for Classification Model

BP, CNN, and LSTM were applied as classification models. The training and testing sets were continuously used to train and optimize these classification models. The final classification model’s structure and parameter settings are as follows:
BP: The input layer includes 182 nodes. There is a hidden layer with 10 neurons, and the output layer includes 5 neurons. The hidden layer applies the ReLU function, and the output layer applies the Softmax function. The Adam optimizer is used. The learning rate is set to 0.02. The cross-entropy loss function is set as the loss function. The training iterations are set to 200.
CNN: The shape of the input data is 182 × 1, a 6-layer one-dimensional convolution network is set, and the number of convolution cores are 8, 8, 16, 16, 24, and 24. The size of the convolution cores is 3. The activation function is the Tanh function, with a max-pooling layer between every two convolution layers. The optimizer is Adam, the cross-entropy loss function is implemented, the number of iterations is set to 100, and the batch size is 50.
LSTM: The first layer is the LSTM layer with 30 neurons and an input data shape of 182 × 1, the second layer is SpatialDropout1D with a dropout rate of 0.2. The third layer is the LSTM layer with 50 neurons, a dropout rate of 0.2, and a current dropout rate of 0.2. The optimizer is Adam, the cross-entropy loss function is implemented, the number of iterations is set to 100, and the batch size is 50.

3.2.2. Fault Diagnostic Results of Classification Models

Conduct fault diagnosis on the data of the test set based on the trained classification model and the confusion matrix of the diagnostic results is shown in Figure 4.
The diagnostic accuracy rate of the BP is 0.955, the CNN is 0.97, and the LSTM is 0.88. The precision rate P and recall rate R of each classification model were calculated according to the confusion matrix.
Table 1 reveals that the BP exhibited commendable diagnostic efficacy for types 0, 1, and 2, but demonstrates a higher misjudgment rate for types 3 and 4. The CNN demonstrates proficient diagnosis for types 1, 3, and 4, but exhibits a higher misjudgment rate for types 0 and 2. The LSTM demonstrates proficiency in diagnosing types 1 and 4 but exhibits a higher misjudgment rate for types 0, 2, and 3. The CNN exhibits the highest level of diagnostic accuracy when compared to the other two neural network types, albeit with certain limitations. Specifically, it is prone to misidentifying type 0 and type 2. Nevertheless, each classification model possesses unique strengths in the context of fault diagnosis. Consequently, the fusion of multiple model fusion diagnostics serves to amalgamate these strengths and enhance the diagnostic process’s accuracy.

3.3. Multiple Model Fusion Diagnosis

3.3.1. Parameters of Multiple Model Fusion Algorithm

According to the multiple model fusion diagnostic method introduced in Section 2.2, the credibility of each fault type output by each classification model and the average credibility of each fault type were calculated and shown in Table 2.
According to the average credibility, precision rate and recall rate in Table 1, the voting factors for each fault type are calculated, and the results are shown in Table 3.
According to the voting factors in Table 3, the decision threshold ε of the multiple model fusion algorithm is set to 0.1, and the decision weight of each classification model is the corresponding accuracy rate. The BP, CNN, and LSTM decision weights are 0.955, 0.97, and 0.88, respectively.

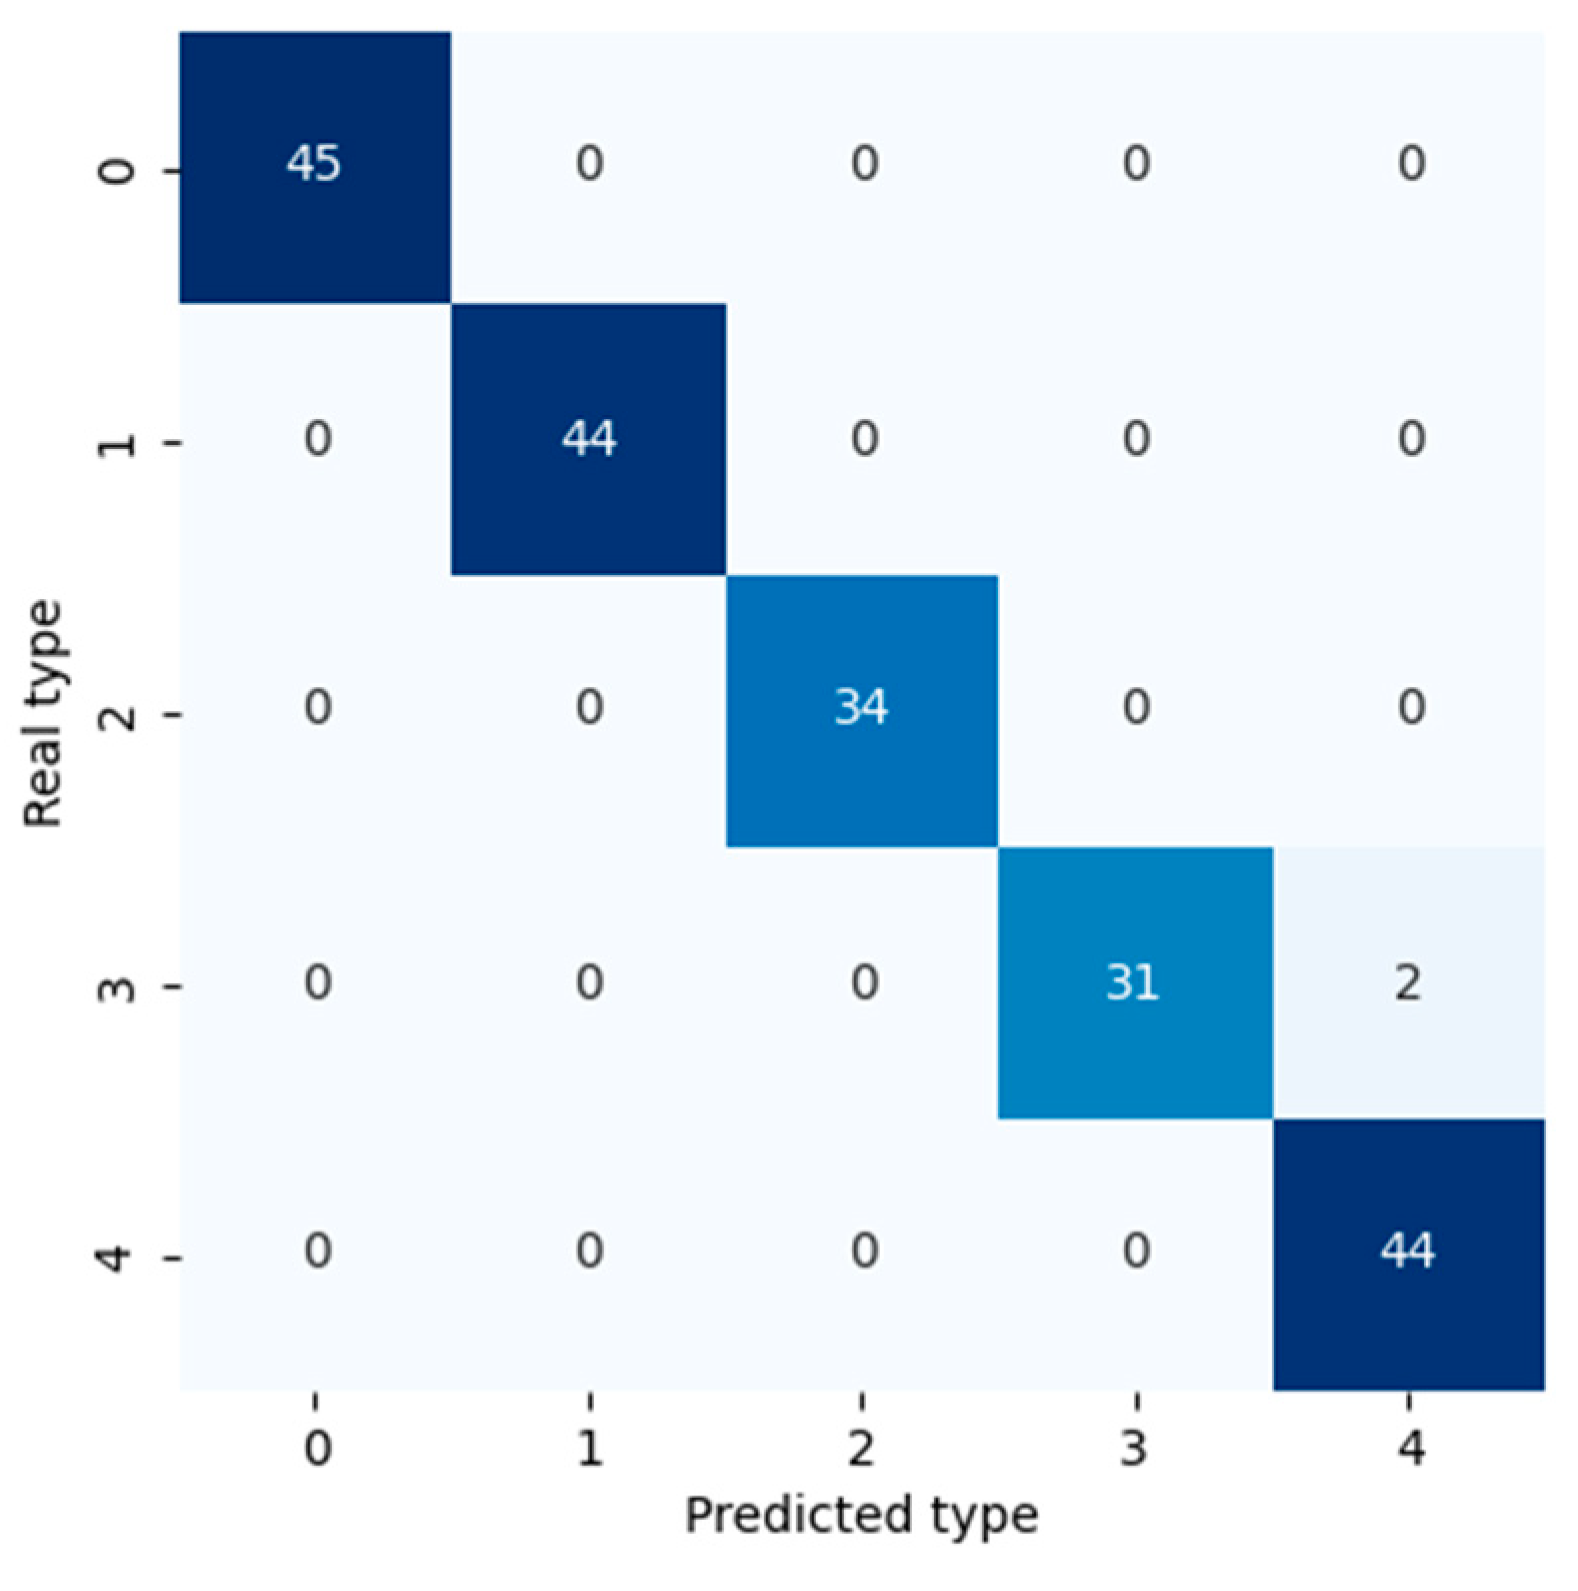
3.3.2. Results and Analysis of Multiple Model Fusion Diagnostic

This paper’s battery data corresponds to the battery’s state, including the normal and four fault states. Input the data from the validation set into each classification model for fault diagnosis, and perform fusion diagnosis based on the fault types output by each classification model, parameters, and the multi-level decision algorithm. Part of the diagnostic results is shown in Table 4.
In Table 4, E represents the voting factor, V represents voting weight, the real fault type corresponding to Data 1 is 0, the type predicted by BP is 0, and its corresponding voting factor is 0.7989. The type predicted by CNN is 2, and its corresponding voting factor is 0.8688. The type predicted by LSTM is 0, and its corresponding voting factor is 0.5948. The difference between the maximum and second largest voting factors is 0.0699, less than the decision threshold of 0.1. Therefore, the next level of decision needs to be made. Both BP and LSTM prediction types are 0, and according to the principle of the minority following the majority, the voting weight of BP and LSTM is 1. The final fusion diagnosis fault type is 0, consistent with the real fault type. The real fault type corresponding to Data 5 is 2, the type predicted by BP is 0, and its corresponding voting factor is 0.7989. The type predicted by CNN is 2, and its corresponding voting factor is 0.8688. The type predicted by LSTM is 3, and its corresponding voting factor is 0.6013. The difference between the maximum and second largest voting factors is 0.0699, less than the decision threshold of 0.1. Therefore, the next level of decision needs to be made. It was found that the three models have different prediction types and cannot implement the principle of minority obeying the majority. The next decision is made by comparing the decision weights of each model, the decision weight of CNN is 0.97, which is the highest. Taking CNN’s voting weight as 1, the final fusion diagnosis fault type is 2, which is consistent with the real fault type. It can be seen from Table 4 that the diagnostic results output by each classification model slightly differs. The BP and CNN have the highest coincidence rate with fusion diagnosis, but they cannot be completely accurate. At this time, it is hard to rely on a certain model. However, the accuracy of fusion diagnosis of battery fault types can be improved by the multi-level decision algorithm.
Due to limited space, it is not possible to present all fusion diagnosis results in detail. The above detailed the process and analysis of fusion diagnosis for some data, while the rest of the data are similar and will not be repeated here.
The confusion matrix of multiple model fusion diagnostic results is shown in Figure 5.
The results depicted in Figure 5 demonstrate that the multiple model fusion diagnostic exhibits a high level of accuracy, with a value of 0.99. The fusion model displays commendable diagnostic capabilities for types 0, 1, and 2, achieving diagnostic accuracy rates of 100%. However, there is a slight degree of ambiguity between type 3 and 4, with diagnostic accuracy rates of 93.94% and 95.65% for types 3 and 4, respectively.
The diagnostic performance of three classification models and multiple model fusion is compared and shown in Figure 6. In Figure 6a, the F1 score measures the accuracy and coverage of the classification model’s diagnostic results for a certain type. It is the harmonic average of precision rate and recall rate, and its expression is shown in Equation (11):
F i = 2 P i R i / ( P i + R i )
In Equation (11), P i ,   R i represents the diagnostic precision rate and recall rate of the model for type i , F i represents the F1 score of the model for type i , it will give a combined understanding of the precision rate and recall rate.
It can be seen from Figure 6 that the F1 score of the fusion model is generally higher than those of the other three classification models. The diagnostic accuracy rate of the fusion model is improved by 3.5%, 2%, and 1.1% compared to BP, CNN, and LSTM. The fusion model combines the advantages of various classification models, comprehensively improving the effectiveness of battery fault diagnosis.
The multi-level decision algorithm in this paper is an improvement on the traditional fusion algorithm voting method. The comparison of fusion diagnosis results between the multi-level decision algorithm, traditional voting method, and maximum value method is shown in Table 5.
The simple voting method adopts the principle of the minority obeying the majority, selecting the majority type as the final diagnostic result. The maximum value method takes the type corresponding to the maximum voting factor as the final diagnosis result. As can be seen from Table 5, a simple voting method cannot be used when the diagnostic results of the three classification models are different, so it cannot make accurate and effective judgments. In Data 1, the type 2 corresponding to the maximum voting factor 0.8688 was taken as the result of fusion diagnosis, which was not consistent with the true type, indicating that the type corresponding to the maximum voting factor was not necessarily the true type, the simple maximum value is one-sided and covers up other effective classification information. In the entire validation set, the accuracy rate of fusion diagnosis using the voting method was 0.985, and the accuracy rate of fusion diagnosis using the maximum value method was 0.950, the accuracy rate of the proposed multi-level decision algorithm is 0.99, which proves the validity and accuracy of the proposed fusion algorithm.

4. Conclusions

We proposed a multiple-model fusion method for power battery fault diagnosis in this work. Based on common neural network models—BP, CNN, and LSTM, the battery fault dataset of electric vehicles was analyzed and studied. A multiple-model fusion fault diagnosis model was constructed to solve the problem of battery fault classification in electric vehicles, thereby improving the maintenance efficiency of power batteries. By improving the voting principles in conjunction with arbitration principles, we proposed a multi-level decision algorithm and set decision thresholds to make different decisions in different situations. The method can effectively consider the classification information of minority types. At the same time, when the differences between voting factors in the output results of the classification model were not significant, further judgments were made to reach a more accurate and reasonable conclusion. The experimental results showed that the accuracy rate of the fusion model was improved by 3.5%, 2%, and 1.1% compared to the BP, CNN, and LSTM, respectively. At the same time, it was proved that the fusion diagnosis accuracy of the proposed multi-level decision algorithm is higher than the traditional voting and the maximum value methods and has better diagnosis performance. The fusion model comprehensively considered the diagnostic results of various classification models and obtained more reliable judgments, which comprehensively improved the performance of battery fault diagnosis.

Supplementary Materials

The following supporting information can be downloaded at: https://www.mdpi.com/article/10.3390/electronics12122724/s1, Table S1: Fault data of power battery.

Author Contributions

Data curation, Z.W.; formal analysis, J.Z.; investigation, Z.W.; methodology, J.Z., Z.W., S.Z., and P.W.; software, Z.W.; supervision, P.W. and S.Z.; writing—original draft, J.Z. All authors have read and agreed to the published version of the manuscript.

Funding

This research was funded by the project Out of Control Accidents’ Scenario Reconstruction and In-depth Investigation Technology for New Energy Vehicle (Grant No. 2021YFF0601102).

Data Availability Statement

No new data were created or analyzed in this study. Data sharing is not applicable to this article.

Conflicts of Interest

The authors declare no conflict of interest.

References

  1. Abada, S.; Marlair, G.; Lecocq, A.; Petit, M.; Sauvant-Moynot, V.; Huet, F. Safety focused modeling of lithium-ion batteries: A review. J. Power Sources 2016, 306, 178–192. [Google Scholar] [CrossRef]
  2. Duan, J.; Tang, X.; Dai, H.; Yang, Y.; Wu, W.; Wei, X.; Huang, Y. Building safe lithium-ion batteries for electric vehicles: A review. Electrochem. Energy Rev. 2020, 3, 1–42. [Google Scholar] [CrossRef] [Green Version]
  3. Zou, C.; Klintberg, A.; Wei, Z.; Fridholm, B.; Wik, T.; Egardt, B. Power capability prediction for lithium-ion batteries using economic nonlinear model predictive control. J. Power Sources 2018, 396, 580–589. [Google Scholar] [CrossRef]
  4. Tang, X.; Zou, C.; Wik, T.; Yao, K.; Xia, Y.; Wang, Y.; Yang, D.; Gao, F. Run-to-run control for active balancing of lithium iron phosphate battery packs. IEEE Trans. Power Electron. 2020, 35, 1499–1512. [Google Scholar] [CrossRef] [Green Version]
  5. Deng, J.; Bae, C.; Marcicki, J.; Masias, A.; Miller, T. Safety modelling and testing of lithium-ion batteries in electrified vehicles. Nat. Energy 2018, 3, 261–266. [Google Scholar] [CrossRef]
  6. Zhao, Y.; Liu, P.; Wang, Z.; Zhang, L.; Hong, J. Fault and defect diagnosis of battery for electric vehicles based on big data analysis methods. Appl. Energy 2017, 207, 354–362. [Google Scholar] [CrossRef]
  7. Xia, K.; Guo, H.; He, S.; Yu, W.; Xu, J.; Dong, H. Binary classification model based on machine learning algorithm for the DC serial arc detection in electric vehicle battery system. IET Power Electron. 2019, 12, 112–119. [Google Scholar] [CrossRef]
  8. Xia, B.; Mi, C. A fault-tolerant voltage measurement method for series connected battery packs. J. Power Sources 2016, 308, 83–96. [Google Scholar] [CrossRef]
  9. Li, Y.; Wang, L.; Liao, C.; Wang, L.; Xu, D. Recursive modeling and online identification of lithium-ion batteries for electric vehicle applications. Sci. China Technol. Sci. 2014, 57, 403–413. [Google Scholar] [CrossRef]
  10. Panchal, S.; Mathew, M.; Dincer, I.; Agelin-Chaab, M.; Fraser, R.; Fowler, M. Thermal and electrical performance assessments of lithium-ion battery modules for an electric vehicle under actual drive cycles. Electr. Power Syst. Res. 2018, 163, 18–27. [Google Scholar] [CrossRef]
  11. Liu, P.; Wu, Z.; Zhang, Z.; Sun, Z. Fault Diagnosis for Battery Systems Based on Voltage Frequency-domain Indicator and Abnormal Coefficient. China J. Highw. Transp. 2022, 35, 89–104. [Google Scholar] [CrossRef]
  12. Wang, Z.; Hong, J.; Liu, P.; Zhang, L. Voltage fault diagnosis and prognosis of battery system based on entropy and Z-score for electronic vehicles. Appl. Energy 2017, 196, 289–302. [Google Scholar] [CrossRef]
  13. Zhao, S.B.; Shen, C.Y.; Guo, Z.J. Research on Fault Diagnosis of Power Battery Based on Fuzzy Neural Network. Automob. Appl. Technol. 2020, 45, 7–8, 11. [Google Scholar] [CrossRef]
  14. Gu, A.; Zhang, X.W. Fault diagnosis system for power battery based on RBF neural network. Chin. J. Power Sources 2016, 40, 1943–1945. [Google Scholar] [CrossRef]
  15. Hong, J.C.; Wang, Z.P. Fault prognosis of battery system based on accurate voltage abnormity prognosis using long short-term memory neural networks. Appl. Energy 2019, 251, 113381. [Google Scholar] [CrossRef]
  16. Deng, F.X.; Bian, Y.D.; Zheng, H.R. Fault diagnosis for electric vehicle lithium batteries using a multi-classification support vector machine. Electr. Eng. 2021, 104, 1831–1837. [Google Scholar] [CrossRef]
  17. Qiu, Y.; Sun, J.; Shang, Y.L. A Fault Diagnosis and Prognosis Method for Lithium-Ion Batteries Based on a Nonlinear Autoregressive Exogenous Neural Network and Boxplot. Symmetry 2021, 13, 1714. [Google Scholar] [CrossRef]
  18. Taylor, S.J.; Letham, B. Forecasting at scale. Am. Stat. 2018, 72, 37–45. [Google Scholar] [CrossRef]
  19. Thiyagarajan, K.; Kodagoda, S.; Van Nguyen, L.; Ranasinghe, R. Sensor Failure Detection and Faulty Data Accommodation Approach for Instrumented Wastewater Infrastructures. IEEE Access 2018, 6, 56562–56574. [Google Scholar] [CrossRef]
  20. Thiyagarajan, K.; Kodagoda, S.; Van Nguyen, L. Predictive analytics for detecting sensor failure using autoregressive integrated moving average model. In Proceedings of the 2017 12th IEEE Conference on Industrial Electronics and Applications (ICIEA), Siem Reap, Cambodia, 18–20 June 2017; pp. 1926–1931. [Google Scholar]
  21. Xia, F.; Ma, X.; Luo, Z.; Zhang, H.; Sun, P. Application of improved D-S evidence theory in fault diagnosis of lithium batteries in electric vehicles. CAAI Trans. Intell. Syst. 2017, 12, 526–537. [Google Scholar] [CrossRef]
  22. Xu, Y.; Lu, Y.W. Adaptive weighted fusion: A novel fusion approach for image classification. Neurocomputing 2016, 168, 566–574. [Google Scholar] [CrossRef]
  23. Mazher, A.; Li, P.; Moughal, T.A.; Xu, H. A decision fusion method using an algorithm for fusion of correlated probabilities. Int. J. Remote Sens. 2016, 37, 14–25. [Google Scholar] [CrossRef]
  24. Gao, X.; Diao, X.P.; Liu, J.; Zhang, M.; Yang, H. A Multi-classification Method of Smart Meter Fault Type Based on Model Adaptive Selection Fusion. Power Syst. Technol. 2019, 43, 1955–1961. [Google Scholar] [CrossRef]
  25. Wang, Z.M.; Wang, K.; He, Y. Multiple classifier fusion model for activity recognition based on high reliability weighted. J. Comput. Appl. 2016, 36, 3353–3357. [Google Scholar] [CrossRef]
  26. Rokach, L.; Maimon, O. Arbel. Selective voting-getting more for less in sensor fusion. Int. J. Pattern Recognit. Artif. Intell. 2006, 20, 329–350. [Google Scholar] [CrossRef]
Figure 1. Multiple model fusion diagnostic framework.
Electronics 12 02724 g001
Figure 2. The process of multiple model fusion.
Electronics 12 02724 g002
Figure 3. Multi-level decision algorithm flow chart.
Electronics 12 02724 g003
Figure 4. Confusion matrix of the diagnostic results of the classification model, (a) BP, (b) CNN, (c) LSTM.
Electronics 12 02724 g004aElectronics 12 02724 g004b
Figure 5. Confusion matrix for fusion diagnostic results.
Electronics 12 02724 g005
Figure 6. Comparison of diagnostic results, (a) F1 score, (b) Accuracy rate.
Electronics 12 02724 g006
Table 1. Precision rate and recall rate of each classification model.
TypeBPCNNLSTM
PRPRPR
00.91841.00000.97370.90240.96670.7073
11.00001.00001.00001.00001.00001.0000
21.00000.94440.91840.97830.66180.9783
31.00000.82051.00000.97441.00000.7179
40.91231.00000.97061.00001.00001.0000
Table 2. Credibility and average credibility.
TypeCredibilityAverage Credibility
BPCNNLSTM
01.00000.90240.70730.8699
11.00001.00001.00001.0000
20.94440.97830.97830.9670
30.82050.97440.71790.8376
41.00001.00001.00001.0000
Table 3. Voting factors.
TypeBPCNNLSTM
00.79890.76440.5948
11.00001.00001.0000
20.91320.86880.6261
30.68730.81620.6013
40.91230.97061.0000
Table 4. The result of multiple model fusion diagnostic.
Data NumberReal TypePredicted Type
BPCNNLSTMFusion Model
Type E V Type E V Type E V Type
1000.7989120.8688000.594810
2330.6873030.8162120.626103
3000.7989100.7644120.626100
4111.0000111.0000111.000011
5200.7989020.8688130.601302
Table 5. Diagnosis results of different fusion algorithms.
Data NumberReal TypePredicted Type
BPCNNLSTMMulti-Level DecisionVotingMaximum
TypeETypeETypeETypeTypeType
1000.798920.868800.5948002
2330.687330.816220.6261333
3000.798900.764420.6261000
4111.000011.000011.0000111
5200.798920.868830.60132/2
Disclaimer/Publisher’s Note: The statements, opinions and data contained in all publications are solely those of the individual author(s) and contributor(s) and not of MDPI and/or the editor(s). MDPI and/or the editor(s) disclaim responsibility for any injury to people or property resulting from any ideas, methods, instructions or products referred to in the content.

