Article

Knowledge Discovery in Databases for a Football Match Result

1
Department of Machine Learning, University of Economics in Katowice, 1 Maja 50, 40-287 Katowice, Poland
2
Łukasiewicz Research Network—Institute of Innovative Technologies EMAG, Leopolda 31, 40-189 Katowice, Poland
*
Author to whom correspondence should be addressed.
Electronics 2023, 12(12), 2712; https://doi.org/10.3390/electronics12122712
Submission received: 13 May 2023 / Revised: 12 June 2023 / Accepted: 15 June 2023 / Published: 17 June 2023
(This article belongs to the Special Issue Knowledge Engineering and Data Mining Volume II)

Abstract

:
The analysis of sports data and the possibility of using machine learning in the prediction of sports results is an increasingly popular topic of research and application. The main problem, apart from choosing the right algorithm, is to obtain data that allow for effective prediction. The article presents a comprehensive KDD (Knowledge Discovery in Databases) approach that allows for the appropriate preparation of data for sports prediction on sports data. The first part of the article covers the subject of KDD and sports data. The next section presents an approach to developing a dataset on top football leagues. The developed datasets are the main purpose of the article and have been made publicly available to the research community. In the latter part of the article, an experiment with the results based on heterogeneous groups of classifiers and the developed datasets is presented.

1. Introduction

Dynamic social and technical development causes the need for continuous professionalization of individual aspects of life. The business environment strives to meet the new needs of consumers with the use of developing technology, and scientists devote more and more time to research related to these aspects. One of the most popular directions of development of current tools and approaches is the application of artificial intelligence in various aspects of human life. Machine learning has many different applications, including in ecology [1], medicine [2] or security [3]. More and more often in our professional or private life we use various artificial intelligence algorithms. In these solutions, due to the ever-growing data sets, machine learning is gaining popularity and applicability. You can find a number of business applications related to sport on the market. This aspect of our lives is very important to many people, and at the same time, it is becoming a huge market in which machine learning is increasingly used.
The business use of sports data requires the availability of ever-larger data sets with a wide time horizon and high universality. These reasons contributed to the creation of specialized companies that provide the necessary data for both business entities, i.e., bookmakers, sports clubs, leagues, and individual recipients. This issue also leaves a lot of scope for scientific research, both related to the specificity of the data and the possibility of using or constructing new algorithms. In these approaches, the quality of the data and their suitability to the problem being solved are as important as the amount of data used. Researchers point out that choosing the right list and the number of features can be crucial [4].
Some sports have found opportunities to apply machine learning, from predicting sports results to planning team lineups [5,6]. In the literature, articles can be found that present issues related to monitoring fitness and injuries in sports such as basketball or speedway [7,8]. Football is the second most popular sport in terms of the number of articles dealing with the subject of prediction of elements related to it. The most analyzed league is the English Premier League, which accounts for over half of all article [4].
Invariably, the most popular and most effective algorithms used in sports prediction are artificial neural networks, logistic regression, support vector machine, random forests and naive Bayes classifiers. In the current research, artificial neural networks have shown great potential [9], along with random forests [10] and heterogeneous ensembles of classifiers [5]. The last of the mentioned solutions have only recently been considered for use in sports-related prediction, but the results provided are very promising.
In football publications, the prevailing approach for predicting match outcomes is classification-based prediction. The match result is categorized into one of three predefined classes: home team win (visiting team lose), draw, and visiting team win (home team lose). The analysis of publications focuses on the top-rated European leagues. The experiments involved the use of both individual and team-based machine learning algorithms.
The problem often observed in the data is related to the unbalanced number of objects in the decision class. However, in this particular case, we observe a different issue, where the prediction quality for the specific decision class is visibly lower than for the remaining cases. Our main idea in this paper is to derive the data strictly related to the problem and use the well-known approaches from the literature to identify the observed struggle. To do so, a large set of real world data covering various leagues across Europe was selected. A test environment covering different classifiers as well as different sets of attributes, was proposed. Below we summarize all novelties presented in the paper:
  • present the comprehensive approach based on different algorithms adapted to different sets of attributes enabling us to estimate the quality of algorithms existing in the literature;
  • select and test the number of algorithms available in the literature and present the test benchmark;
  • prepare and make available a set of real data that would enable us to conduct experiments and research on classifiers in football;
  • indicate the best-fitting algorithms from the literature, considering measures like accuracy, macro precision, macro recall, and the cover for the set.
The presented research is the first step in the problem of deriving the ensemble of heterogenous classifiers based on the voting schema. Our further steps will be focused on the problem of selecting the number of best-fitting attributes and deriving the voting schema. The whole idea can be considered as the review of classification methods existing in the sports field and the comparison of these methods in the test environment, including real world data. Section 2 of the article relates to the theoretical background of KDD and outlines the problem related to sports data. The next Section 3 is dedicated to the preparation dataset. Then, Section 4 describes the execution of sports prediction experiments and results. The Section 5 provides information about data access to prepare the dataset. The last Section 5 briefly summarizes the results and presents further visions of the work.

2. Background

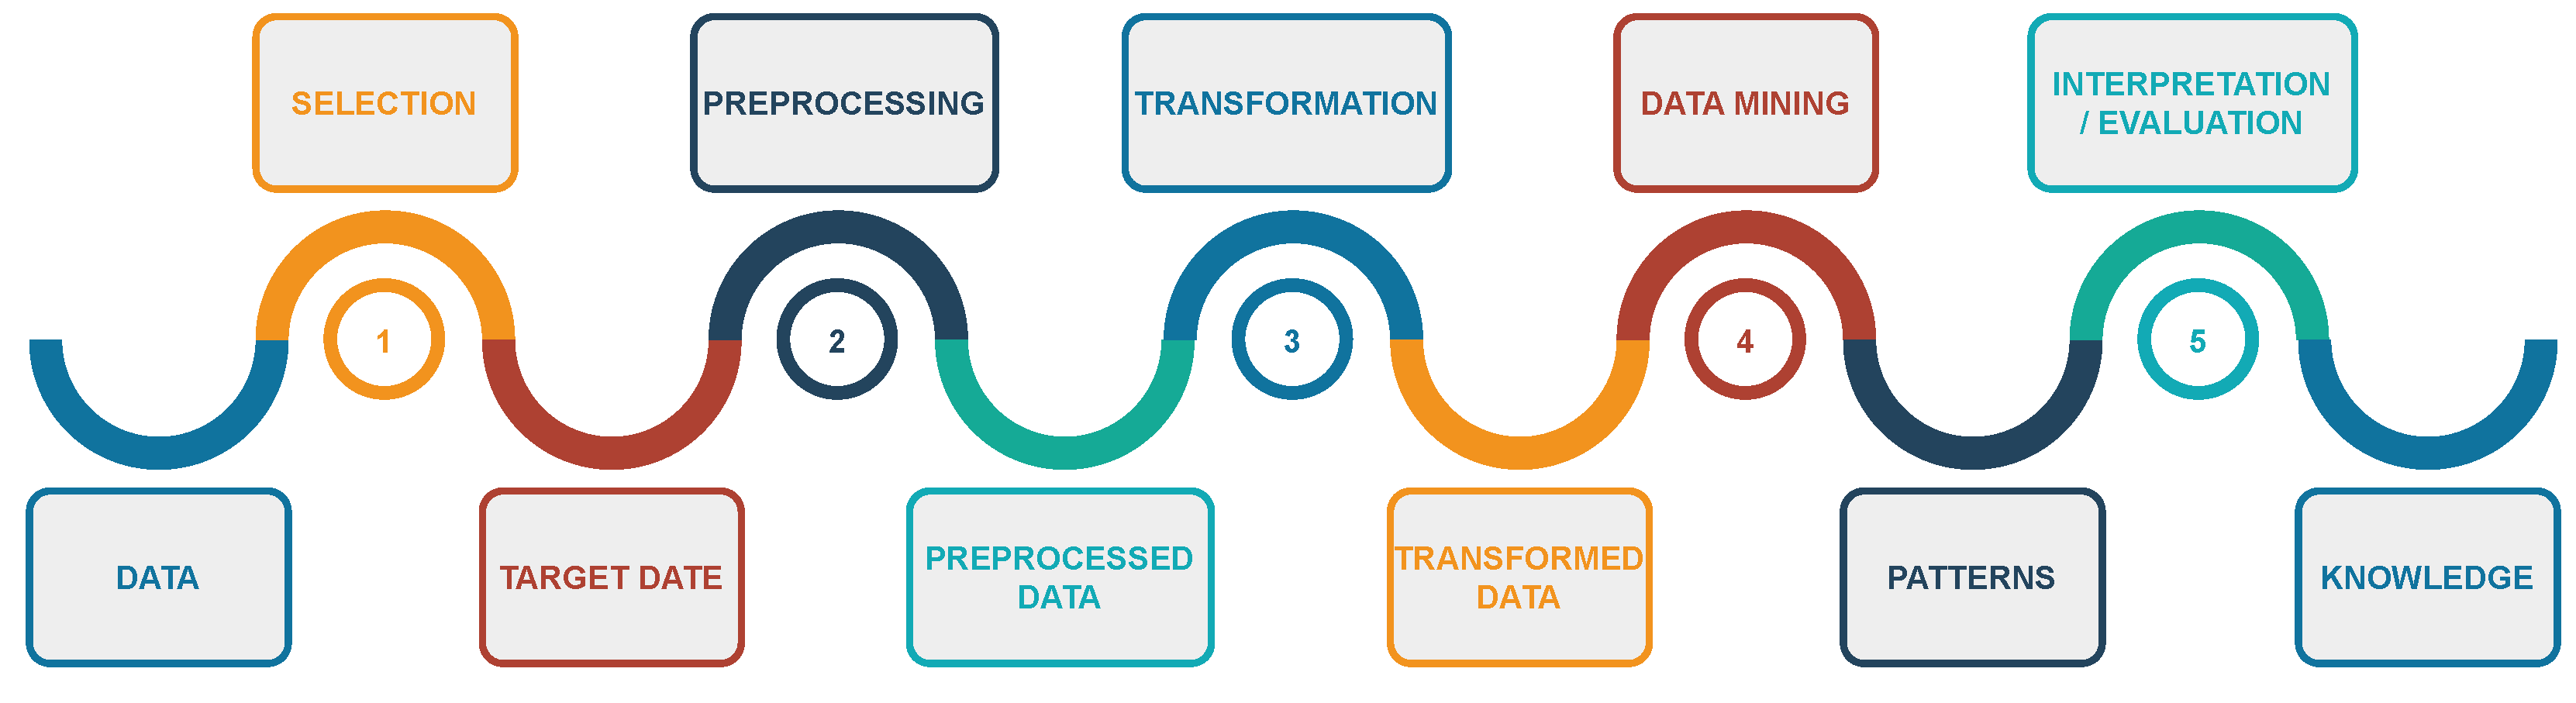
2.1. Knowledge Discovery in Databases

The KDD approach (Knowledge Discovery in Databases) is a process that allows for a comprehensive approach to data processing, from their acquisition to obtaining results. In this approach, it is possible to detect previously unknown relationships and rules in data sets. This approach assumes the implementation of the task in separate stages; however, these stages are strongly dependent on each other [11].
The approach to KDD proposed in [12] involves five key steps and is presented in Figure 1. The first of them—data selection—includes the identification of appropriate data sets, the selection of key variables, and the elimination of redundant ones. The next stage focuses on data preprocessing, which involves handling missing values, errors and removing noisy data. Data transformation and integration of data from different sources is also carried out in this stage. Stage three is data reduction. The main approaches that can be used are feature selection, aggregation or sampling. Data analysis is the fourth stage. In this stage, various machine learning algorithms are used to explore and discover relationships in the data. The final stage is the interpretation and evaluation of the obtained results and discovered patterns.

2.2. Sports Data

The use of data is currently a key factor determining the feasibility of solving a given problem. Thanks to the Internet and automated systems, data are collected on an ongoing basis about every aspect of our lives, and the amount of data is growing at a surprising pace. The main problem, therefore, was not the lack of data, but its excess and significant dispersion. The need to integrate data from various sources and their appropriate preparation is still an important element of research.
In the case of sports data, encountered difficulties influence the need for an easily accessible, complete and free source. The first problem with sports data is league fragmentation. The available sources often provide data for the English Premier League (which also contributes to the popularity of analyzing this league) or data for individual European leagues. Before using such sources, there is a need to integrate them, which is not always fully possible because they provide different attributes for the analyzed leagues. Another difficulty is the limited features available in the collections, which typically range from 8–10 features. Another element to pay attention to is the time horizon of the available data. Collections usually provide several years of data, but without current data of the most recent seasons; therefore, they are mostly archival data. On the other hand, current data is often made available without data for previous seasons or with a very short time horizon. It is also possible to find more extensive data sources on the Internet, where substantial amounts of information on individual leagues are available, but accessing such sources often requires payment for temporary access.

2.3. Machine Learning Algorithms in Sports Data

A significant development of research on artificial intelligence can be observed, which results in its increasingly wider and more common use. Both the scientific and business communities are applying ever more different algorithms for prediction in sports. From the football perspective, the English Premier League remains the main analyzed league, but more and more studies focusing on the German or Turkish leagues can be found. The basic approach is prediction using classification and predicting the outcome of the match: home team win, visiting team win or draw.
The list of sports disciplines was selected based on the top ten most watched sports in the world according to the ranking prepared by sportforbusiness.com and presented on the page  [13].
In the literature, works based on the use of the various algorithms can be found. The most popular approaches are as follows: Support Vector Machine [10]; Artificial Neural Network [14]; Random Forest [5]; Decision Tree [15]; Logistic Regression [16]. In Table 1 has been presented a comparison of the approaches used in individual sports disciplines.

3. Preparing Dataset

In the literature, the use of various types of data for sports prediction can be found. Some of them are limited to simple data related to basic league table statistics so that they gain versatility and applicability, while others are based on detailed statistics on individual matches [31] and can achieve satisfactory results but in a narrower scope. This section will address the problem of sports data dispersion and highlight the need to acquire and integrate data from online sources.
The following publication focuses on the initial three stages, as illustrated in the Figure 2, and its goal is to create a dataset that can be used in machine learning models.

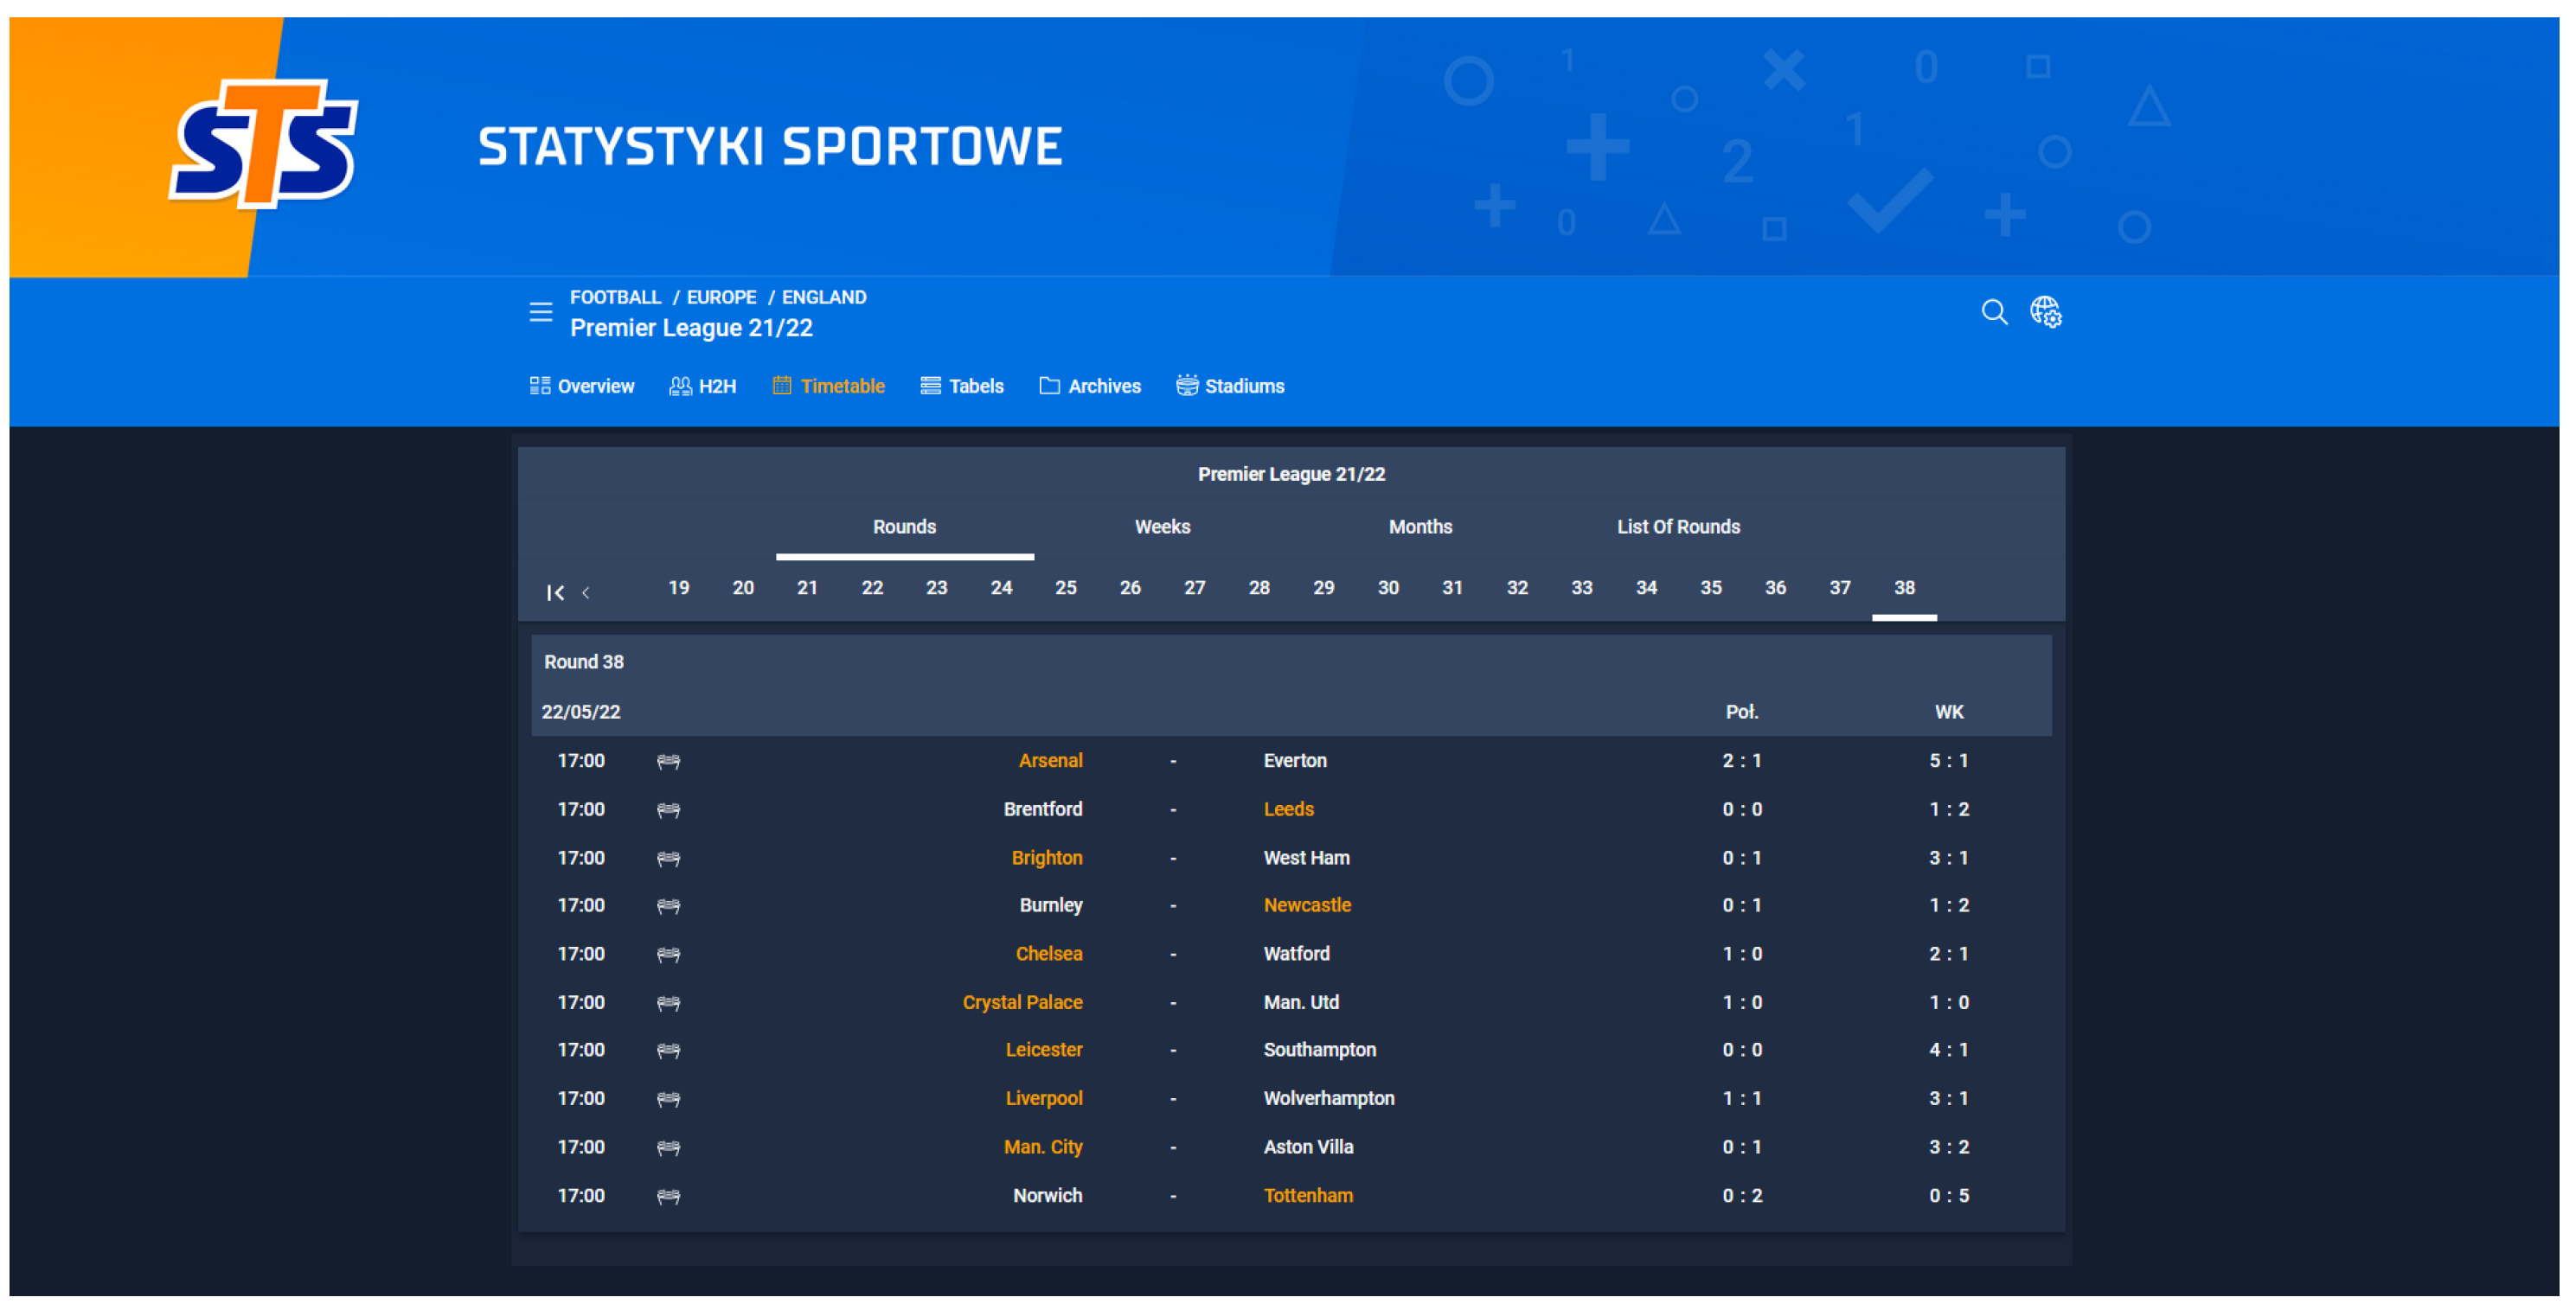
3.1. Data Identification and Download

Various types of studies containing ready-to-import data are available on the Internet. Such solutions usually contain data for one league and concern only the main information from the league table. Often, the time range is also a significant limitation due to lack of current data or historical data covering a period that is too short. The main disadvantage of the above approach is low diversity of attributes which can lead to low-quality results or overtraining of algorithms and, consequently, too little universality of the solution.
Another approach to data acquisition may be usage of an external data provider. The data provided in such a way is characterized by high accuracy, timeliness, and the availability of numerous attributes (meeting statistics) and additional attributes. Providers have appropriate APIs, so it is possible to quickly obtain the necessary data. The main drawbacks of this type of approach are the solution’s affordability and low flexibility. Despite the availability of a significant number of attributes, there is no possibility to quickly expand with additional attributes. When choosing a solution of this class, the fixed costs associated with the provider’s fee should be taken into account. The availability of data is long-term and stable, as the providers provide services not only to individual entities, but also to large companies dealing with sports, journalism, analysis of competitions or bookmakers.
The final approach is to develop custom software to download and prepare the data set. This approach allows resource customization, usage of a variety of data sources, and acquisition of a preferred and customized dataset. In the presented solution, the authors decided to use this particular approach because of its benefits. The way the created system works is presented in Figure 1.
The website [45] was used as the main data source for the prepared downloading software. The structure of the data available on the website is presented in Figure 3 and Figure 4.
In order to download the required data, proprietary Python scripts were written. The way the scripts work is presented in Algorithm 1. The first data to be downloaded were the tables for individual matches (Figure 4). In the next step, the program downloaded league tables with summaries of subsequent rounds (Figure 2).
Algorithm 1 Web Scraping Football Match Data
Input: seasons—number of seasons to collect
Input: www_list—list of addresses
Output: output_file_matches_table—flat file containing collected matches data
Output: output_file_league_table—flat file containing collected league data
1 
Initialize variables;
2 
Retrieve number of seasons;
3 
Retrieve list of addresses;
4 
for each adres in www_list do
5 
  Scrape table data;
6 
  for each tabela in table do
7 
    for each row in table do
8 
      Extract address from row;
9 
      Add address to the list_season_and_league;
10 
    endfor
11 
  endfor
12 
endfor
13 
for each adres in list_season_and_league do
14 
  Scrape table data;
15 
  for each tabela in table do
16 
    for each row in table do
17 
      Extract data from row;
18 
      Add data to the matches_table;
19 
    endfor
20 
  endfor
21 
endfor
22 
Save the list to a flat file_matches_table;
23 
result Flat file containing collected matches table for each adres in list_season_and_league do
24 
  Scrape table data;
25 
  for each tabela in table do
26 
    for each row in table do
27 
      Extract data from row;
28 
      Add data to the league_table;
29 
    endfor
30 
  endfor
31 
endfor
32 
Save the list to a flat file_league_table;
33 
result Flat file containing collected league table

3.2. Selection of Attributes and Creation of a Database

The next step was the preparation of a database environment enabling the verification of the correctness of the data, its storage and the calculation of additional attributes. Once the database was created, the previously downloaded data were loaded from flat files into database tables using the Python script.
The available data are presented in Table 2 and Table 3.
Values for columns: ‘OddsHT’, ‘OddsX’, ‘OddsVT’ were only available for a limited number of current games due to the restrictions applied by the owner of the source page.
The developed solution can be used to download data on various leagues available on the website. However, the list presented by UEFA for the 2022–2023 season in [46] was used as the criterion for selecting leagues. The top seven leagues of the following countries were selected from the presented ranking: England, Spain, Germany, Italy, France, Netherlands, Portugal. Using the scripts described, the data were downloaded and loaded into the database. The scope of downloaded data was limited to 11 seasons. Therefore the analysis includes data from the 2011–2021 season to the 2021–2022 season.
In the described approach, due to the goal—to create a source of real data for further research—all attributes available in the source were selected for the set.
After importing the data to the database, the data from the league table (Table 2) and the matches table (Table 3) were combined. The join was made for the corresponding values: ‘Country’, ‘League’, ‘Round’, and ‘TeamHT’/‘TeamVT’ with ‘Team’. After joining the tables, the following set of attributes was obtained: ‘Country’, ‘League’, ‘Round’, ‘TeamHT’, ‘PositionHT’, ‘MatchesHT’, ‘WinsHT’, ‘DrawsHT’, ‘LossesHT’, ‘GoalsScoredHT’, ‘GoalsConcededHT’, ‘GoalDifferenceHT’, ‘PointsHT’, ‘TeamVT’, ‘PositionVT’, ‘MatchesVT’, ‘WinsVT’, ‘DrawsVT’, ‘LossesVT’, ‘GoalsScoredVT’, ‘GoalsConcededVT’, ‘GoalDifferenceVT’, ‘PointsVT’, ‘ScoreHalf’, ‘ScoreFull’, ‘OddsHT’, ‘OddsX’, ‘OddsVT’.

3.3. Data Cleaning and Preparation

The data verification process was divided into two steps: verification of the number of competition records against the assumed number for the league, and verification of the correctness of the data.
In the first step, the values for each league were checked against the number of scheduled games for the combined data. In this step, missing data were identified and then completed or omitted, depending on the reason. In the case of data missing from the source, the gaps were completed manually from other available sources. This situation occurred when matches were terminated by walkover and the result was reported by the federation. For example, in the 16/17 season of France, the Bastia-Lyon game was reported as 0:3 by the federation due to a walkover. If a match was rescheduled, it was included in the calculation at the time of play, not the original queue schedule. The situation related to the spread of the covid-19 pandemic, which also affected the schedule and the number of games. In this case, when the matches were cancelled and the leagues ended earlier, it was not possible to complete the data (e.g., season 19/20, France round 27 and Italy round 29).
In the next step, attribute values were checked and missing data were marked. Depending on the specificity of the field, the data were marked with a value that does not naturally occur in them (the whole thing is available in the dictionary of each table). Then, data from individual tables were combined into a coherent set with a complete set of information. The completeness of data for leagues, seasons, and rounds was checked again. Any deficiencies found were analyzed and supplemented if the required data were available in the source used. Deficiencies at this stage may be caused by different ways of writing information integrated from different sources (e.g., the way the name of a team or league is written).

3.4. Data Transformation and Creation of Sets for Analysis

After verifying the data, additional attributes were calculated. First, the ‘Target’ column, containing information about the score of a specific match between two teams, was determined based on the ‘ScireFull’. This attribute can take the following values
  • 0—draw,
  • 1—home team win (visiting team loss),
  • 2—visiting team win (home team loss),
  • 9—information about an error in the data or formula.
Due to the lack of atomicity of the attribute ‘League’ (’Premier League 22/23’), the value responsible for the season of the competition was excluded and added to the new attribute ‘Season’. This value was saved in a shortened form—the beginning of the season year (e.g., change from ‘20/21’ to ‘20’, which corresponds to the year 2020).
Another of the calculated attributes was ‘Difference’. This attribute was based on the difference in the number of points of both teams and was calculated according to the formula [ P o i n t s H T ] [ P o i n t s V T ] .
The created dataset was saved to the database and flat file. The prepared data are available at [47].

4. Experiments

The Experimental part is conducted according to the KDD approach. First, the process of experiment preparation will be described. Next, the results of sports prediction experiments and the evaluation of classification quality will be presented. The purpose of the experiment is to test available approaches to sports performance prediction on the created real data set.

4.1. Experimental Design

After carrying out the data preparation process presented in Section 3, a set of data that could be used in various studies was obtained. A few additional changes were made for the current experiment:
  • A separate data file was prepared for each league because each of the analyzed leagues will be trained and tested separately.
  • The following columns were removed from the data set: ‘Country’, ‘League’, ‘TeamHT’, ‘TeamVT’, ‘ScoreHalf’, ‘ScoreFull’, ‘OddsHT’, ‘OddsX’.
  • According to the conclusions of the literature review and our own research, records for the first five rounds of each season ( S e a s o n ≤ 5) were deleted from the dataset.
All the top leagues for the following countries were used for the experiment: England, Spain, Germany, Italy, France, Netherlands, and Portugal (Table 4). Each of the selected leagues has the same set of data in terms of structure and type. Significant differences between individual leagues were the number of teams participating in a given competition and, consequently, the number of rounds during the season. During the analyzed period, there was also a change in the number of teams/rounds within one league, e.g., for the games in Portugal in the 2013–2014 season, 16 teams participated, while from 2014–2015 there were already 18 teams.
For the indicated leagues, data from the last 11 years of the competition, i.e., from the 2010/2011 to 2021/2022 season, were downloaded. Each set had an identical set of attributes presented in the Table 5. Attributes marked with ‘HT’ apply to the host team of the match (the team playing the match on its home field). Those marked by ‘VT’ shall be understood as the team playing at their opponent’s home field (the visiting team).
In order to verify the given approach, to prepare the dataset and to check its usefulness in the application of different algorithms and the limited feature space, the algorithms previously used in this problem and presented in [5] were selected as a base. On the other hand, in terms of specific implementations of the algorithms, solutions from [48] were selected; the exact machine learning algorithms used were the following:
  • Decision tree (DT)-maximum depth 3; algorithm CART, implementation in line with [49,50];
  • Support vector machine (SVM)-linear classifier; implementation in line with [51];
  • AdaBoost (AB)-implementation in line with [52,53];
  • Bagging-implementation in line with [54];
  • Random forest (RF)-maximum depth of tree 3; 100 estimators; implementation in line with [55].
Transformed measures of classification quality assessment determined on the training set were used as weights:
a 2 = a c c u r a c y ( d j , t r a i n s e t ) 2
p 2 = p r e c i s i o n ( d j , t r a i n s e t ) 2
r 3 = r e c a l l ( d j , t r a i n s e t ) 3
a _ p _ r _ f = a c c u r a c y ( d j , t r a i n s e t ) · p r e c i s i o n ( d j , t r a i n s e t ) · r e c a l l ( d j , t r a i n s e t ) · f 1 s c o r e ( d j , t r a i n s e t )
Heterogeneous ensembles of classifiers were used in accordance with the publication [5] and selected voting methods in accordance with [37]: simple, majority, unanimous, weighted (relative to the Equations (1)–(4)).
Two sets of attributes were selected for the experiment:
  • df_short—‘Round’, ‘PositionHT’, ‘PositionVT’, ‘PointsHT’, ‘PointsVT’, ‘Difference’—based on [37],
  • df_long—‘Round’, ‘PositionHT’, ‘MatchesHT’, ‘WinsHT’, ‘DrawsHT’, ‘LossesHT’, ‘GoalsScoredHT’, ‘GoalsConcededHT’, ‘GoalDifferenceHT’, ‘PointsHT’, ‘PositionVT’, ‘MatchesVT’, ‘WinsVT’, ‘DrawsVT’, ‘LossesVT’, ‘GoalsScoredVT’, ‘GoalsConcededVT’, ‘GoalDifferenceVT’, ‘PointsVT’.
A heterogeneous set of classifiers, presented earlier, was trained on each set of attributes, and their description is presented in the Table 6.
The data was divided into a training and test set against ‘Round’ and ‘League’ (’League’ is not used as an attribute in the prediction, but is only used to divide the set). The division was made with the chronology of the data in mind, which allows the tests to represent real conditions. The training set contains data from the sixth round of the 2010–2011 season to the seventeenth round (inclusive) of the 2021–2022 season. The test set consisted of records for matches from the eighteenth round of the 2021–2022 season to the end of that season. The experiments were carried out using the train and test method.
The distribution among decision classes is presented in Table 7. The trend for the distribution between classes in all leagues is similar. An outstanding case is the English league, for which, in the test set, the number of cases for class two is higher than for the other classes. A similar situation took place in the case of the French League. These disproportions between the participation of individual classes in training and testing introduce additional difficulty in prediction. For other leagues, class one is always the most numerous, both in the training and test sets, and the percentages for each class are similar.

4.2. Results of the Computational Experiments

Choosing the right measure of classification quality evaluation depends very much on what the classifier is to be used for. In some cases, precision (of one class or micro/macro) is important; other times, recall; and sometimes, an attempt to balance the two measures. Therefore, in this work we present comprehensive results for popular measures of classification quality evaluation—this will allow us to assess whether the prepared datasets are well prepared for further analysis. All selected measures can be derived from a confusion matrix, and an example of such a matrix is shown in Table 8. The measures were calculated for each of the available decision classes and presented in Table 9, Table 10, Table 11 and Table 12. The measures were calculated according to the formulas: accuracy (Equation (5)), precision (Equation (6)), recall (Equation (7)) and f1–score (Equation (8)), where i is the decision class for which the measure is calculated, c is the number of all classes and s is the number of classified cases.
a c c u r a c y = i = 1 c T P i s
m a c r o _ p r e c i s i o n = 1 c i = 1 c T P i T P i + F P i
m a c r o _ r e c a l l = 1 c i = 1 c T P i T P i + F N i
F 1 - s c o r e = 2 · m a c r o _ p r e c i s i o n · m a c r o _ r e c a l l m a c r o _ p r e c i s i o n + m a c r o _ r e c a l l
For adequate representativeness of the results, all experiments were conducted 30 times. The average results for all leagues are presented in the Table 9 and for the top three leagues, in turn: England in Table 10, Spain in Table 11 and Germany in Table 12. The obtained results exceed the random approach = 33% (three decision classes).
For each of the analyzed leagues, unanimous approaches score the highest in terms of accuracy. The best approach is approach12 with a full list of attributes, followed by approach07 with a short list of attributes. Expanding the list of attributes results in an additional increase in the prediction accuracy for these solutions; however, it results in a further decrease in the coverage of the results. Decisions are therefore more accurate, but for fewer cases. For the English Premier League, the original approach02 turned out to be better than approach12. For all other leagues, the order (descending) of the best attempts is approach12 and approach07. Given the need for full coverage, the unanimous voting approach cannot compete with the others in terms of accuracy.
When full coverage of the response set is required, the best results are achieved by weighted voting approaches:
  • approach07-full list of attributes-df_long with simple voting and heterogeneous set of classifiers;
  • approach04-original list of attributes-df_short with heterogeneous set of classifiers and weighting based on ‘r3’
  • approach05-original list of attributes-df_short with applied heterogeneous set of classifiers and weighting based on ‘a_p_r_f’
  • approach06-original list of attributes-df_short with heterogeneous set of classifiers and weighting based on ‘a2’
The obtained results are 0.5179, 0.5174, 0.5174 and 0.5154, respectively.
In the case of the macro precision measure, a variation in the best approach for individual leagues can be observed, while considering only approaches that guarantee full coverage. For all leagues in the average value, the highest score is achieved by approach04, while in individual leagues, approach05 (England), approach01 (Spain) and approach06 (Germany). When analyzing the frequency of occurrence of individual approaches in the best-performing leagues, the most frequent results can be observed: approach05, approach04, approach06.
The results obtained for the analyzed approaches in terms of the recall measure are very close to the accuracy measure (with incomplete coverage) where the best solution is approach02. Taking into account the need for full coverage of the case list in the average for all leagues and for the English league, the highest score was obtained by approach05. Good results were also achieved by approach09 for Spain and approach11 for Germany. The most common approach among the top five results is approach02, which was found in each of the analyzed leagues. In addition, it is worth mentioning approach12, which appeared in six out of the seven leagues in the top results.
The last of the analyzed measures is the F1-score. Due to the method of its determination, among the best results are the approaches that were the best in previous measures. The most common model in the top five of all leagues was approach02. Approach12 has been ranked in six out of seven leagues on the top scores. In terms of average values, approach02 and approach12 were the best.

5. Conclusions and Future Works

This paper presented the approach based on the heterogenous set of classifiers (where a set of single classifiers covering different parts of the solution space can be developed, depending on the problem under analysis) and a different set of attributes describing the sports data. The decision class includes three different values, each related to a team’s win or a draw. Thus, our goals were to identify the best-fitting algorithms capable of deriving valuable results for the ensemble of classifiers, including various methods available in the literature. To do so, we analyzed and prepared the implementations of selected methods and further tested these methods in the prepared test benchmark, including the acquired real-world data. The problem related to the quality of results for the selected decision class that was identified during the experiments. However, at this research stage, we could not derive a straightforward solution for this problem. However, this particular case should be investigated in further research.
An additional goal of the article was to prepare and share a set of real data that would allow conducting experiments and research on classifiers in football. This goal was achieved, and the prepared data are available at [47]. The created dataset was also used to predict the results of matches, and the obtained results allowed to improve previous approaches and were presented in the Section 4.
In addition, the proposed approach presents a comprehensive KDD approach for classifier teams in sports data. The proposed approach is also characterized by adaptability to less popular leagues, which may be one of the next development directions. After initial experiments on the Polish volleyball league, further work on prediction in other sports in European leagues is planned, including volleyball and basketball.
Further development of the approach based on heterogeneous classifier ensembles with consideration of new ensemble construction approaches and voting methods is being considered in future work. In particular, our goal will be twofold. The first problem is related to the identification of the most important attributes, which should be used to derive the classifier. The initial experiments indicate that the classical approach based on the correlation analysis and removing the attributes with the high correlation among the decision attribute was not sufficient. Based on initial experiments built on importance [56], we observe the most significant attributes: ‘DrawsHT’ (0.0424), ‘DrawsVT’ (0.0365) and ‘LossesHT’ (0.0269). During the next step in our research, we plan to check it in different approaches and measures. The second problem is related to the effective use of the ensemble of classifiers based on the voting schema. During the research, authors, identified potential gaps related to the very straightforward approach related to these elements of the ensemble of classifiers. Our further goals will also be focused on extending the idea of voting schemas.
Moreover, future works should also compare the proposed methods’ results with bookmakers’ predictions. At the present research stage, classification quality is measured with the classical measures known from the literature. However, the sports data allow for easy deployment of the proposed approach on online betting systems. This could lead to a solution in which the ensemble of classifiers is evaluated not only based on measures such as accuracy but also could include the results for the system in the particular time interval measured in dollars.

Access to the Dataset

Currently, machine learning methods are used to predict sports results and determine betting odds, but access to relevant datasets is limited. The set we have developed will be widely available and will enable the use of such approaches also for the community of researchers and players, and not only bookmakers and people with significant resources. The created and shared collection will correct the information imbalance from the ethical and practical point of view.
According to the goal of the work, all datasets described have been saved in CSV format and made publicly available on the website. To access these data, simply go to [47], where they can be downloaded and used in other studies, citing this paper as a source. The release of these data is intended to make the research more accessible and transparent, and to facilitate the reproducibility of the results obtained by the authors.

Author Contributions

Conceptualization, S.G., J.K. and P.J.; methodology, S.G., J.K. and P.J.; software, S.G.; validation, S.G. and J.K.; formal analysis, J.K. and P.J.; investigation, S.G.; resources, S.G.; data curation, S.G.; writing—original draft preparation, S.G., J.K. and P.J.; writing—review and editing, S.G., J.K. and P.J.; visualization, S.G.; supervision, J.K. and P.J.; project administration, S.G., J.K. and P.J. All authors have read and agreed to the published version of the manuscript.

Funding

This research received no external funding.

Data Availability Statement

The classification results obtained in Python language. All source data can be found on the website of the Department of Machine Learning of the University of Economics in Katowice: https://www.ue.katowice.pl/index.php?id=25091 (accessed on 14 June 2023).

Conflicts of Interest

The authors declare no conflict of interest.

References

  1. Yu, J.; Wen, Y.; Yang, L.; Zhao, Z.; Guo, Y.; Guo, X. Monitoring on triboelectric nanogenerator and deep learning method. Nano Energy 2022, 92, 106698. [Google Scholar] [CrossRef]
  2. Flesia, L.; Monaro, M.; Mazza, C.; Fietta, V.; Colicino, E.; Segatto, B.; Roma, P. Predicting perceived stress related to the COVID-19 outbreak through stable psychological traits and machine learning models. J. Clin. Med. 2020, 9, 3350. [Google Scholar] [CrossRef]
  3. Liu, H.; Lang, B. Machine learning and deep learning methods for intrusion detection systems: A survey. Appl. Sci. 2019, 9, 4396. [Google Scholar] [CrossRef] [Green Version]
  4. Horvat, T.; Job, J. The use of machine learning in sport outcome prediction: A review. Wiley Interdiscip. Rev. Data Min. Knowl. Discov. 2020, 10, e1380. [Google Scholar] [CrossRef]
  5. Kozak, J.; Głowania, S. Heterogeneous ensembles of classifiers in predicting Bundesliga football results. Procedia Comput. Sci. 2021, 192, 1573–1582. [Google Scholar] [CrossRef]
  6. Kapadiya, C.; Shah, A.; Adhvaryu, K.; Barot, P. Intelligent cricket team selection by predicting individual players’ performance using efficient machine learning technique. Int. J. Eng. Adv. Technol. 2020, 9, 3406–3409. [Google Scholar] [CrossRef]
  7. Van Eetvelde, H.; Mendonça, L.D.; Ley, C.; Seil, R.; Tischer, T. Machine learning methods in sport injury prediction and prevention: A systematic review. J. Exp. Orthop. 2021, 8, 1–15. [Google Scholar] [CrossRef]
  8. Chowdhury, A.K.; Tjondronegoro, D.; Chandran, V.; Trost, S. Ensemble methods for classification of physical activities from wrist accelerometry. Med. Sci. Sport. Exerc. 2017, 49, 1965–1973. [Google Scholar] [CrossRef] [Green Version]
  9. Bunker, R.P.; Thabtah, F. A machine learning framework for sport result prediction. Appl. Comput. Inform. 2019, 15, 27–33. [Google Scholar] [CrossRef]
  10. Eryarsoy, E.; Delen, D. Predicting the Outcome of a Football Game: A Comparative Analysis of Single and Ensemble Analytics Methods. In Proceedings of the 52nd Hawaii International Conference on System Sciences, Maui, HI, USA, 8–11 January 2019. [Google Scholar] [CrossRef] [Green Version]
  11. Maimon, O.; Rokach, L. Data Mining and Knowledge Discovery Handbook; Springer: Berlin/Heidelberg, Germany, 2005. [Google Scholar]
  12. Fayyad, U.; Piatetsky-Shapiro, G.; Smyth, P. From data mining to knowledge discovery in databases. AI Mag. 1996, 17, 37. [Google Scholar]
  13. Sport For Business. The World’s Most Watched Sports. 2023. Available online: https://sportforbusiness.com/the-worlds-most-watched-sports/ (accessed on 5 June 2023).
  14. Leung, C.K.; Joseph, K.W. Sports data mining: Predicting results for the college football games. Procedia Comput. Sci. 2014, 35, 710–719. [Google Scholar] [CrossRef] [Green Version]
  15. Joseph, A.; Fenton, N.E.; Neil, M. Predicting football results using Bayesian nets and other machine learning techniques. Knowl.-Based Syst. 2006, 19, 544–553. [Google Scholar] [CrossRef]
  16. Cornman, A.; Spellman, G.; Wright, D. Machine Learning for Professional Tennis Match Prediction and Betting; Stanford Unverisity: Stanford, CA, USA, 2017; Volume 1, p. 4. [Google Scholar]
  17. Delen, D.; Cogdell, D.; Kasap, N. A comparative analysis of data mining methods in predicting NCAA bowl outcomes. Int. J. Forecast. 2012, 28, 543–552. [Google Scholar] [CrossRef]
  18. Kahn, J. Neural Network Prediction of NFL Football Games; World Wide Web Electronic Publication: Burlington, MA, USA, 2003; pp. 9–15. [Google Scholar]
  19. McCabe, A.; Trevathan, J. Artificial intelligence in sports prediction. In Proceedings of the Fifth International Conference on Information Technology: New Generations (itng 2008), Las Vegas, NV, USA, 7–8 April 2008; pp. 1194–1197. [Google Scholar] [CrossRef]
  20. Valero, C.S. Predicting Win-Loss outcomes in MLB regular season games—A comparative study using data mining methods. Int. J. Comput. Sci. Sport 2016, 15, 91–112. [Google Scholar] [CrossRef] [Green Version]
  21. Huang, M.L.; Li, Y.Z. Use of machine learning and deep learning to predict the outcomes of major league baseball matches. Appl. Sci. 2021, 11, 4499. [Google Scholar] [CrossRef]
  22. Cai, W.; Yu, D.; Wu, Z.; Du, X.; Zhou, T. A hybrid ensemble learning framework for basketball outcomes prediction. Phys. A Stat. Mech. Its Appl. 2019, 528, 121461. [Google Scholar] [CrossRef]
  23. Zdravevski, E.; Kulakov, A. System for Prediction of the Winner in a Sports Game. In International Conference on ICT Innovations; Springer: Berlin/Heidelberg, Germany, 2009; pp. 55–63. [Google Scholar] [CrossRef]
  24. Lin, J.; Short, L.; Sundaresan, V. Predicting National Basketball Association Winners; CS 229 Final Project; Stanford University: Stanford, CA, USA, 2014; pp. 1–5. [Google Scholar]
  25. Kapadia, K.; Abdel-Jaber, H.; Thabtah, F.; Hadi, W. Sport analytics for cricket game results using machine learning: An experimental study. Appl. Comput. Inform. 2020; ahead-of-print. [Google Scholar] [CrossRef]
  26. Passi, K.; Pandey, N. Increased prediction accuracy in the game of cricket using machine learning. arXiv 2018, arXiv:1804.04226. [Google Scholar] [CrossRef]
  27. Gu, W.; Foster, K.; Shang, J.; Wei, L. A game-predicting expert system using big data and machine learning. Expert Syst. Appl. 2019, 130, 293–305. [Google Scholar] [CrossRef]
  28. Luu, B.C.; Wright, A.L.; Haeberle, H.S.; Karnuta, J.M.; Schickendantz, M.S.; Makhni, E.C.; Nwachukwu, B.U.; Williams, R.J., III; Ramkumar, P.N. Machine learning outperforms logistic regression analysis to predict next-season NHL player injury: An analysis of 2322 players from 2007 to 2017. Orthop. J. Sport. Med. 2020, 8, 2325967120953404. [Google Scholar] [CrossRef]
  29. Baboota, R.; Kaur, H. Predictive analysis and modelling football results using machine learning approach for English Premier League. Int. J. Forecast. 2019, 35, 741–755. [Google Scholar] [CrossRef]
  30. Razali, N.; Mustapha, A.; Yatim, F.A.; Ab Aziz, R. Predicting football matches results using Bayesian networks for English Premier League (EPL). In Iop Conference Series: Materials Science and Engineering; IOP Publishing: Bristol, UK, 2017; Volume 226, p. 012099. [Google Scholar] [CrossRef]
  31. Schauberger, G.; Groll, A.; Tutz, G. Modeling Football Results in the German Bundesliga Using Match-Specific Covariates; Technical Report; Department of Statistics: New York, NY, USA, 2016. [Google Scholar] [CrossRef]
  32. Zaveri, N.; Shah, U.; Tiwari, S.; Shinde, P.; Teli, L.K. Prediction of football match score and decision making process. Int. J. Recent Innov. Trends Comput. Commun. 2018, 6, 162–165. [Google Scholar]
  33. Sujatha, K.; Godhavari, T.; Bhavani, N.P. Football match statistics prediction using artificial neural networks. Int. J. Math. Comput. Methods 2018, 3, 1–7. [Google Scholar]
  34. Rue, H.; Salvesen, O. Prediction and retrospective analysis of soccer matches in a league. J. R. Stat. Soc. Ser. D 2000, 49, 399–418. [Google Scholar] [CrossRef]
  35. Rotshtein, A.P.; Posner, M.; Rakityanskaya, A. Football predictions based on a fuzzy model with genetic and neural tuning. Cybern. Syst. Anal. 2005, 41, 619–630. [Google Scholar] [CrossRef]
  36. Juszczuk, P.; Kozak, J.; Dziczkowski, G.; Głowania, S.; Jach, T.; Probierz, B. Real-World Data Difficulty Estimation with the Use of Entropy. Entropy 2021, 23, 1621. [Google Scholar] [CrossRef] [PubMed]
  37. Głowania, S.; Kozak, J.; Juszczuk, P. New Voting Schemas for Heterogeneous Ensemble of Classifiers in the Problem of Football Results Prediction. Procedia Comput. Sci. 2022, 207, 3393–3402. [Google Scholar] [CrossRef]
  38. Wiseman, O. Using Machine Learning to Predict the Winning Score of Professional Golf Events on the PGA Tour. Ph.D. Thesis, National College of Ireland, Dublin, Ireland, 2016. [Google Scholar]
  39. Upal, M. Predicting Hole by Hole Golf Scores on the PGA Tour Ron Richardson; Mercyhurst University: Erie, PA, USA, 2019; p. 10. [Google Scholar]
  40. Chiang, S. Machine Learning for Table Tennis Match Prediction. arXiv 2023, arXiv:2303.16776v1. [Google Scholar]
  41. Lennartz, J.; Groll, A.; van der Wurp, H. Predicting Table Tennis Tournaments: A comparison of statistical modelling techniques. Int. J. Racket Sport. Sci. 2021, 3, 39–48. [Google Scholar] [CrossRef]
  42. Wilkens, S. Sports prediction and betting models in the machine learning age: The case of tennis. J. Sport. Anal. 2021, 7, 99–117. [Google Scholar] [CrossRef]
  43. Lalwani, A.; Saraiya, A.; Singh, A.; Jain, A.; Dash, T. Machine Learning in Sports: A Case Study on Using Explainable Models for Predicting Outcomes of Volleyball Matches. arXiv 2022, arXiv:2206.09258. [Google Scholar]
  44. Sanghvi, D.; Deshpande, P.; Shanbhogue, S.; Shah, V. Analyzing and Predicting NCAA Volleyball Match Outcome Using Machine Learning Techniques. 2021. Available online: https://ceur-ws.org/Vol-2992/icaiw_wdea_2.pdf (accessed on 1 June 2023).
  45. S.A.S. STS. 2022. Available online: https://stats.sts.pl/ (accessed on 1 January 2023).
  46. UEFA. Union of European Football Associations Country Ranking. 2023. Available online: https://www.uefa.com/nationalassociations/uefarankings/country/#/yr/2023 (accessed on 19 April 2023).
  47. Głowania, S.; Kozak, J.; Juszczuk, P. Source Data of Top European Football Leagues. 2023. Available online: https://www.ue.katowice.pl/index.php?id=25091 (accessed on 1 June 2023).
  48. Pedregosa, F.; Varoquaux, G.; Gramfort, A.; Michel, V.; Thirion, B.; Grisel, O.; Blondel, M.; Prettenhofer, P.; Weiss, R.; Dubourg, V.; et al. Scikit-learn: Machine Learning in Python. J. Mach. Learn. Res. 2011, 12, 2825–2830. [Google Scholar]
  49. Breiman, L.; Friedman, J.; Stone, C.; Olshen, R. Classification and Regression Trees Chapman & Hall; Wadsworth International Group: New York, NY, USA, 1984. [Google Scholar]
  50. Hastie, T.; Tibshirani, R.; Friedman, J.H.; Friedman, J.H. The Elements of Statistical Learning: Data Mining, Inference, and Prediction; Springer: Berlin/Heidelberg, Germany, 2009; Volume 2. [Google Scholar] [CrossRef]
  51. Fan, R.E.; Chang, K.W.; Hsieh, C.J.; Wang, X.R.; Lin, C.J. LIBLINEAR: A library for large linear classification. J. Mach. Learn. Res. 2008, 9, 1871–1874. [Google Scholar] [CrossRef] [Green Version]
  52. Freund, Y.; Schapire, R.E. A decision-theoretic generalization of on-line learning and an application to boosting. J. Comput. Syst. Sci. 1997, 55, 119–139. [Google Scholar] [CrossRef] [Green Version]
  53. Freund, Y.; Schapire, R.E. Experiments with a new boosting algorithm. In Proceedings of the Icml, Citeseer, Bari, Italy, 3–6 July 1996; Volume 96, pp. 148–156. [Google Scholar]
  54. Breiman, L. Bagging predictors. Mach. Learn. 1996, 24, 123–140. [Google Scholar] [CrossRef] [Green Version]
  55. Breiman, L. Random forests. Mach. Learn. 2001, 45, 5–32. [Google Scholar] [CrossRef] [Green Version]
  56. Rifkin, R.M.; Lippert, R.A. Notes on Regularized Least Squares. 2007. Available online: https://dspace.mit.edu/handle/1721.1/37318 (accessed on 1 January 2023).
Figure 1. Knowledge discovery in databases approach diagram.
Electronics 12 02712 g001
Figure 2. KDD approach diagram for the data preparation process.
Electronics 12 02712 g002
Figure 3. League table for the English Premier League.
Electronics 12 02712 g003
Figure 4. Matches table for the English Premier League.
Electronics 12 02712 g004
Table 1. Sports prediction articles.
SportArticle and Algorithms
American Football
  • [17]—Decision Tree; Support Vector Machine;
  • [18]—Artificial Neural Network;
  • [19]—Artificial Neural Network;
Baseball
  • [20]—Artificial Neural Network; Decision Tree; Support Vector Machine; K-Nearest Neighbour;
  • [21]—Artificial Neural Network; Support Vector Machine;
Basketball
  • [22]—Artificial Neural Network; Marcov model; Support Vector Machine; Logistic Regression; Naive Bayes; AdaBoost;
  • [23]—Logistic Regression;
  • [24]—AdaBoost; Gaussian Naive Bayes; Random Forest; Support Vector Machine; Logistic Regression;
Cricket
  • [25]—Decision Tree; K-Nearest Neighbour; Random Forest; Naive Bayes;
  • [26]—Decision Tree; K-Nearest Neighbour; Random Forest; Support Vector Machine; Naive Bayes;
Field Hockey
  • [27]—AdaBoost; Artificial Neural Network; Bagging; Boosting; Naive Bayes; RobustBoost; Support Vector Machine; Decision Tree;
  • [28]—K-Nearest Neighbour; Naive Bayes; XGBoost; Random Forest;
Football
  • [5]—AdaBoost; Bagging; Heterogeneous Ensemble Method; Random Forest; Support Vector Machine; Decision Tree;
  • [9]—Artificial Neural Network;
  • [10]—Artificial Neural Network; Decision Tree; Ensemble Method; K-Nearest Neighbour; Naive Bayes; Support Vector Machine; Random Forest;
  • [15]—Bayesian Networks; Decision Tree; K-Nearest Neighbour; Naive Bayesian;
  • [29]—Ranked Probability Score; Gradient Boosting;
  • [30]—Decision Tree; Naive Bayesian; Bayesian Networks;
  • [31]—Bradley-Terry model
  • [32]—Artificial Neural Network; Naïve Bayes; Random Forest; Support Vector Machine; Logistic Regression;
  • [33]— Artificial Neural Network; FRES (Football Result Expert System);
  • [34]—Markov chain Monte Carlo;
  • [35]—Naive Bayesian;
  • [36]—AdaBoost; Bagging; Random Forest; Decision Tree;
  • [37]—AdaBoost; Bagging; Decision Tree; Random Forest; Support Vector Machine; Heterogeneous Ensemble Method;
Golf
  • [38]—Bayesian Linear Regression; Linear Regression;
  • [39]—Random Forest;
Table Tennis
  • [40]—Artificial Neural Network; Random Forest; Support Vector Machine; Logistic Regression;
  • [41]—Lasso; Rank-Based Reference; Random Forest;
Tennis
  • [42]—Artificial Neural Network; Gradient Boosting Machine; Random Forest; Support Vector Machine; Logistic Regression;
  • [16]—Artificial Neural Network; Logistic Regression; Support Vector Machine; Random Forest;
Volleyball
  • [43]—Artificial Neural Network; Boolean decision Rule via Column Generation; Linear Discriminant Analysis; Logistic Regression; Support Vector Machine;
  • [44]—Artificial Neural Network; Decision Tree; Logistic Regression;
Table 2. League table.
AttributeDescription
Roundround number for which the summary was prepared,
Positionteam position in the league table,
Teamteam name,
Matchesnumber of matches played,
Winsnumber of matches played in the season ended in a win,
Drawsnumber of games played in the season ended in a draw,
Lossesnumber of matches played in the season ended in a loss,
GoalsScorednumber of goals scored during the season,
GoalsConcedednumber of goals conceded during the season,
GoalDifferencethe difference between the number of goals scored and conceded during the season,
Pointsnumber of points scored,
Countrycountry of competition,
Leaguename of the league along with the season.
Table 3. Matches table.
AttributeDescription
Roundround number with gameplay,
Hourmatch start time,
TeamHThome team name,
TeamVTvisiting team name,
ScoreHalfhalftime score,
ScoreFullmatch result,
OddsHThome team win odds,
OddsXdraw odds,
OddsVTvisiting team win odds,
Countrycountry of competition,
Leaguename of the league along with the season.
Table 4. Characteristics of test and training datasets for individual countries.
CountryNumber of RecordsData Gaps *Training SetTest Set
England418003762363
Spain418003762363
Germany336603022289
Italy418003762363
France41801013661363
Netherlands3366772945289
Portugal316812823289
* Gaps in the data result from not playing matches, which is related to, among others, with the early end of league games due to the Covid-19 pandemic.
Table 5. Table of attributes.
‘Country’‘League’‘Round’
‘TeamHT’‘PositionHT’‘MatchesHT’
‘WinsHT’‘DrawsHT’‘LossesHT’
‘GoalsScoredHT’‘GoalsConcededHT’‘GoalDifferenceHT’
‘PointsHT’‘TeamVT’‘PositionVT’
‘MatchesVT’‘WinsVT’‘DrawsVT’
‘LossesVT’‘GoalsScoredVT’‘GoalsConcededVT’
‘GoalDifferenceVT’‘PointsVT’‘ScoreHalf’
‘ScoreFull’‘OddsHT’‘OddsX’
‘OddsVT’‘Season’‘Difference’
‘Target’
Table 6. List of approaches used in the experiment.
ApproachA Set of AttributesVoting TypeImplementation
approach01df_shortsimple[5]
approach02df_shortunanimous[5]
approach03df_shortmajority[37]
approach04df_shortweighted (Equation (3))[37]
approach05df_shortweighted (Equation (4))[37]
approach06df_shortweighted (Equation (1))[37]
approach07df_longsimple[5]
approach08df_longweighted (Equation (1))[37]
approach09df_longweighted (Equation (3))[37]
approach10df_longweighted (Equation (4))[37]
approach11df_longmajority[37]
approach12df_longunanimous[5]
Table 7. Division of cases for individual decision classes between training and test sets in individual leagues.
Class 0 (Draw)Class 1 (Home Team Win)Class 2 (Visiting Team Win)
CountryTraining SetTest SetTraining SetTest SetTraining SetTest Set
England0.23820.19520.46080.38570.30100.4190
Spain0.24270.27140.47610.42380.28120.3048
Germany0.24790.22220.44360.49670.30850.2810
Italy0.25790.24290.44370.44290.29840.3143
France0.26830.26190.45370.35710.27800.3810
Netherlands0.23160.23530.47550.45100.29290.3137
Portugal0.23610.24840.45870.40520.30520.3464
Table 8. Confusion matrix for multiple classes.
Predicted
Actual Class 1 Class 2 Class iClass C
T P 1 F P 2 F P i F P C
class 1 T N \ { 1 } T N \ { 1 , 2 } T N \ { 1 , i } T N \ { 1 , C }
F N 1 F N 1 F N 1
F P 1 T P 2 F P i F P C
class 2 T N \ { 1 , 2 } T N \ { 2 } T N \ { 2 , i } T N \ { 2 , C }
F N 2 F N 2 F N 2
F P 1 F P 2 T P i F P C
class i T N \ { 1 , i } T N \ { 2 , i } T N \ { i } T N \ { i , C }
F N i F N i F N i
F P 1 F P 2 F P i T P C
class C T N \ { 1 , C } T N \ { 2 , C } T N \ { i , C } T N \ { C }
F N C F N C F N C
Table 9. Quality of classification of results for all leagues.
ApproachAccuracyAccuracy All CaseCoverMacro PrecisionMacro RecallMacro F1–Score
approach010.51060.51061.00000.37330.44230.3760
approach020.59830.31510.53000.40830.48300.4291
approach030.51430.50750.99000.35260.44430.3777
approach040.51740.51741.00000.47150.45340.4075
approach050.51740.51741.00000.46680.45680.4189
approach060.51540.51541.00000.46370.44950.3983
approach070.51790.51791.00000.40910.44720.3842
approach080.51350.51351.00000.40730.44450.3845
approach090.51200.51201.00000.41710.44440.3885
approach100.50920.50921.00000.42090.44380.3940
approach110.52040.50720.97000.36110.44870.3819
approach120.59350.31790.54000.40990.47870.4239
Table 10. Quality of classification of results for English Premier League.
ApproachAccuracyAccuracy All CaseCoverMacro PrecisionMacro RecallMacro F1–Score
approach010.49290.49291.00000.33310.41460.3539
approach020.57930.30870.53000.38520.43790.3949
approach030.49520.48970.99000.33420.41590.3558
approach040.50320.50321.00000.39980.42580.3775
approach050.50400.50401.00000.40380.42970.3881
approach060.50160.50161.00000.37880.42250.3688
approach070.49520.49521.00000.33570.41580.3584
approach080.48970.48971.00000.33140.41060.3566
approach090.48570.48571.00000.33120.40760.3543
approach100.48650.48651.00000.36710.41170.3664
approach110.49670.48500.98000.33620.41770.3606
approach120.55760.31110.56000.37910.43060.3823
Table 11. Quality of classification of results for Spain LaLiga.
ApproachAccuracyAccuracy All CaseCoverMacro PrecisionMacro RecallMacro F1–Score
approach010.52860.52861.00000.55350.45760.3977
approach020.59770.32440.54000.41080.48470.4294
approach030.53430.52440.98000.40290.45810.3934
approach040.52800.52801.00000.42380.46140.3998
approach050.52680.52681.00000.42170.45990.3979
approach060.52920.52921.00000.41490.46210.3993
approach070.52620.52621.00000.38530.45650.3932
approach080.53160.53161.00000.42330.46200.3976
approach090.53210.53211.00000.42370.46270.3983
approach100.53150.53151.00000.42270.46240.3981
approach110.53100.52500.99000.38650.46100.3964
approach120.56850.33930.60000.40670.46400.4088
Table 12. Quality of classification of results for German Bundesliga.
ApproachAccuracyAccuracy All CaseCoverMacro PrecisionMacro RecallMacro F1–Score
approach010.53050.53051.00000.34540.43060.3813
approach020.60300.29960.50000.39930.49190.4355
approach030.53520.52940.99000.34780.43390.3845
approach040.51850.51851.00000.51350.41850.3835
approach050.50980.50981.00000.44150.41620.3892
approach060.52070.52071.00000.52850.41920.3790
approach070.53050.53051.00000.34540.42560.3779
approach080.52620.52621.00000.34430.42490.3778
approach090.53050.53051.00000.34870.42840.3817
approach100.52400.52401.00000.36890.42470.3829
approach110.53100.51200.96000.34510.43080.3807
approach120.54920.29740.54000.34370.44070.3831
Disclaimer/Publisher’s Note: The statements, opinions and data contained in all publications are solely those of the individual author(s) and contributor(s) and not of MDPI and/or the editor(s). MDPI and/or the editor(s) disclaim responsibility for any injury to people or property resulting from any ideas, methods, instructions or products referred to in the content.

