Article

An Explainable Artificial Intelligence-Based Robustness Optimization Approach for Age-Related Macular Degeneration Detection Based on Medical IOT Systems

1
Department of Ophthalmology & Visual Sciences, Faculty of Medicine, The Chinese University of Hong Kong, Hong Kong 999077, China
2
The Faculty of Data Science, City University of Macau, Macau 999078, China
3
The Department of Artificial Intelligence and Big Data Applications, Zhuhai Institute of Advanced Technology Chinese Academy of Sciences, Zhuhai 519600, China
4
Zhuhai People’s Hospital (Zhuhai Hospital Affiliated with Jinan University), Zhuhai 519600, China
5
Shenzhen Key Laboratory of Intelligent Bioinformatics, Shenzhen Institute of Advanced Technology, Shenzhen 518055, China
*
Authors to whom correspondence should be addressed.
Electronics 2023, 12(12), 2697; https://doi.org/10.3390/electronics12122697
Submission received: 9 May 2023 / Revised: 4 June 2023 / Accepted: 14 June 2023 / Published: 16 June 2023
(This article belongs to the Section Artificial Intelligence)

Abstract

:
AI-based models have shown promising results in diagnosing eye diseases based on multi-sources of data collected from medical IOT systems. However, there are concerns regarding their generalization and robustness, as these methods are prone to overfitting specific datasets. The development of Explainable Artificial Intelligence (XAI) techniques has addressed the black-box problem of machine learning and deep learning models, which can enhance interpretability and trustworthiness and optimize their performance in the real world. Age-related macular degeneration (AMD) is currently the primary cause of vision loss among elderly individuals. In this study, XAI methods were applied to detect AMD using various ophthalmic imaging modalities collected from medical IOT systems, such as colorful fundus photography (CFP), optical coherence tomography (OCT), ultra-wide fundus (UWF) images, and fluorescein angiography fundus (FAF). An optimized deep learning (DL) model and novel AMD identification systems were proposed based on the insights extracted by XAI. The findings of this study demonstrate that XAI not only has the potential to improve the transparency, reliability, and trustworthiness of AI models for ophthalmic applications, but it also has significant advantages for enhancing the robustness performance of these models. XAI could play a crucial role in promoting intelligent ophthalmology and be one of the most important techniques for evaluating and enhancing ophthalmic AI systems.

1. Introduction

Age-related macular degeneration (AMD) is a complex eye disease that affects the macula, the central part of the retina responsible for detailed central vision. It is a common eye disease, especially among people over the age of 50 [1]. According to the World Health Organization (WHO), AMD is the leading cause of vision loss and blindness in people over 60 years of age [2]. It is estimated that over 200 million people worldwide have AMD or are at risk of developing it [3]; there were 196 million people worldwide with AMD in 2020, and this number could increase to 288 million by 2040 [4].
The development of AI-based detection methods delivers a potential opportunity for AMD detection and treatment [5]. AMD is a complex and multifactorial eye disease that requires accurate and timely diagnosis and treatment to prevent vision loss and maintain quality of life for affected individuals [6,7]. Traditional methods of AMD diagnosis, such as manual grading of fundus images, are time-consuming and can be prone to inter-observer variability [8]. The increasing prevalence of AMD, coupled with the aging population, creates a growing need for more effective and accessible screening and diagnosis methods. AI-based detection methods have the potential to address this need by providing cost-effective and scalable approaches to AMD diagnosis and monitoring [9], enabling earlier detection and intervention [10]. CNN-based deep learning methods have been proven to have a great performance for AMD detection [11,12], scoring [13], classification (wet and dry) [14], biomarker extraction [15,16], and the relationship analysis of AMD and other organs (such as the liver) [17].
However, there are several challenges that concern the development of this field. Limited generalizability with a low level of robustness is one of the most significant issues for AMD detection. AI-based models may not be as accurate or effective when applied to different populations or datasets, which limits model generalizability [18]. A model with high accuracy but low robustness may perform well on the training dataset but may not generalize well to new and unseen data. The model may be overfitting to the training data and not learning the underlying patterns that are present in the data. As a result, when the model is applied to new data that are different from the training data, its performance may be significantly worse. This can lead to inaccurate or unreliable predictions in real-world applications. Therefore, it is important to ensure that AI models have both high accuracy and high robustness to be useful and reliable for practical applications.
Detecting AMD using AI algorithms can be challenging for several reasons, leading to low robustness [19]. The first reason is a limited dataset. One of the biggest challenges in developing AI algorithms for AMD detection is the limited availability of high-quality datasets. Obtaining large datasets of high-quality images is challenging. As a result, the datasets used to train AI algorithms for AMD detection may be small or biased, leading to poor generalization performance. The second reason is the variability in imaging techniques. AMD detection is required for imaging and comprehensively analyzing with a variety of IOT techniques [20], where image type includes colorful fundus photography (CFP) [1,21], optical coherence tomography (OCT) [22,23], ultra-wide fundus (UWF) images [24,25,26], and fluorescein angiography fundus (FAF) [23]. Each imaging modality has its strengths and limitations, and different techniques may be better suited to different stages of AMD detection. Developing an AI algorithm that can accurately detect AMD across different imaging techniques is challenging. The other reason is that the disease manifestation is variable. AMD is a heterogeneous disease, and its clinical manifestation can vary widely. AMD can present as either dry or wet form, and its severity can vary from mild to severe. Developing AI algorithms that can accurately detect AMD across its different manifestations and stages is challenging. Finally, the low level of result interpretation is another significant reason. Interpreting the results of AI algorithms for AMD detection can be challenging. The output of AI algorithms is often a probability score or a heat map highlighting regions of interest. Clinicians need to be able to interpret these outputs accurately to make informed decisions about patient care. Without an explanation and interpretation, it is challenging to identify and correct errors or biases in the model’s training. This could lead to poor performances on new datasets, reducing the robustness of the model [27,28].
The robustness of an AI model for AMD detection is an AI model’s capacity to maintain a high level of accuracy and consistency across diverse datasets, as well as variations in input data and different scenarios [29,30,31]. A robust AI model is resilient to minor variations or noise in the data and is capable of generalizing well to novel data [32,33]. Specifically, a robust AI model can accurately detect AMD in a range of retinal images, including fundus and OCT images, while also accounting for variations in imaging conditions, such as lighting, image quality, and patient variability. Moreover, a robust AI model should be capable of handling instances of uncertainty or missing data and make dependable predictions, even in challenging situations [29,33].
Explainable Artificial Intelligence (XAI) has the potential to improve the accuracy of AI models for AMD detection by providing insights into the decision-making process of the model and identifying areas for improvement [34]. The concept of XAI pertains to the development of AI models and techniques that can be easily comprehended and interpreted by human experts [35]. XAI addresses the “black box” problem of AI, which refers to the difficulty in comprehending how AI systems reach their decisions or predictions [36]. In fields such as healthcare, where decisions made by AI systems can significantly impact patients’ lives, XAI aims to make AI systems more transparent and interpretable by providing explanations for their outputs or predictions. This involves visualizing the decision-making process of an AI model, identifying the key factors that influenced its decision, and highlighting areas of uncertainty or potential bias. By enhancing the interpretability of AI systems, XAI helps to improve trust in AI and facilitates collaboration between AI systems and human experts [34]. With an explainable AI algorithm, ophthalmologists and researchers can understand the features that the model is using to make its predictions and can identify cases where the model may be making incorrect or inconsistent predictions. This information can be used to refine the model and improve its accuracy. Moreover, XAI can help engineers to identify and mitigate biases in datasets and models that may be impacting their accuracy. Therefore, while explainable AI may not directly enhance the accuracy of AI models, it can provide valuable insights and tools for improving and refining these models for better performance in AMD detection.
Thus, this study proposed that explainable AI (XAI) can enhance the robustness of algorithms. To verify this hypothesis, this study uses a typical deep learning (DL) algorithm of VGG16 for AMD detection based on OCT, regular CFP (less than 50°), UWF (200°), and FAF, and it measures and explores the interpretability of this model with the XAI method of class activation mapping (CAM) techniques. Based on the results of XAI, improved VGG16-based architectures are proposed based on skip, attention, and transfer mechanisms. Three main goals are included in this study: (1) Detect AMD applying the DL model based on three different datasets of OCT, regular CFP (less than 50°), UWF (200°), and FAF. (2) Propose an explainability evaluation method based on the CAM mechanism. (3) Perform a retrospective XAI analysis on the DL model based on CAM mechanism. (4) Propose a model architecture-optimizing method by adding skip, attention, and transfer mechanisms. (5) Test the optimizing method by comparing the performances of accuracy, robustness, and XAI of the former and improved models. (6) Finally, recognize and discuss the pattern of model bias from the perspective of XAI. The source code is available on the GitHub platform https://github.com/MiniHanWang/xai-amd-1.git (accessed on 7 June 2023).

2. Materials and Methodologies

2.1. Materials

The authors of the study on AMD detection collected data from multiple sources. They obtained OCT and FAF data from open-source platforms, while regular CFP (45°) datasets were obtained from both an open-source platform and real-world scenarios in Zhuhai People’s Hospital. The UWF (200°) dataset was collected from an in-house dataset at Aier Hospital in China. Specifically, the OCT images were obtained from two datasets on Kaggle websites [37,38], with a total of 32,347 images of AMD and normal cases. The FAF photos were obtained from a dataset on the Kaggle platform [39], with 1947 AMD images and 2874 normal images. The regular CFP dataset consisted of one real-world dataset and two open-source datasets [40,41], with a total of 4445 AMD images (445 from the open-source platform and 4000 from real-world scenarios) and 4874 normal images (2000 from the open-source platform and 2874 from real-world scenarios). The UWF dataset included 2300 images obtained from the Optos device at Shenzhen Aier Hospital, with 1100 AMD and 1200 normal subjects. Ethical approval documents were obtained from the ethics group at both Shenzhen Aier Hospital and Zhuhai People’s Hospital.

2.2. Methodologies

2.2.1. Preprocessing of the Images

In this study, a total of 150 robustness measure testing images, comprising 75 AMD images and 75 normal images, were randomly selected from the original dataset and annotated for testing purposes. The remaining images were preprocessed and split into training, validation, and testing sets as 3:2:1 for VGG16-based AMD detection.
The original OCT dataset used in this study included 3000 AMD images and 29,347 normal images in PNG format. However, due to the imbalance between the number of negative and positive subjects in the OCT training dataset, a data enhancement process was performed on the AMD images. This involved using image rotation and data generation through a conditional generative adversarial network (CGAN) [42,43] to increase the number of positive samples. Image rotation was found to be an effective method to enhance the data volume and model robustness while preventing overfitting. CGAN was chosen as it is a powerful tool for data enhancement, particularly in medical image generation, as the generator in CGAN exhibits higher efficiency with additional information of classification labels compared to normal GAN networks. A mini-max game between the generator and discriminator is the key objective function of CGAN, as shown in Formula (1). To enhance data quality, a noise-removing process of salt-and-pepper noise (SPN) filtering was applied to the generated images. The OCT images were resized to 512 × 512, and three ophthalmologists confirmed and filtered the effectively generated AMD images into the training database. A feature extraction algorithm based on correlation-based feature selection (CFS) was performed on the preprocessed OCT database, and the generated results were referred to as the “segmented OCT” database. Finally, a comparative study was conducted between the AMD detection performances of the OCT data and the segmented OCT database.
m i n G   m a x D   V   ( D , G ) = E x p d a t a ( x ) [ l o g D ( x | y ) ] + E z P z ( Z ) [ l o g ( 1 D ( G ( z | y ) ) ) ] .
The FAF dataset comprises 1947 images of AMD and 2874 images of normal cases. To augment the size of the dataset, image rotation is employed. Additionally, 3445 AMD and 2874 normal regular CFP images are collected from open sources and Zhuhai People’s Hospital and preprocessed with image rotation and salt-and-pepper noise (SPN) filtering.
The UWF dataset comprises 1100 original images of AMD and 1200 original images of normal cases. Due to the large size of the original dataset, efficient computing and storage are necessary. Non-threatening pathologic signs in the peripheral retina of AMD eyes can cause difficulties in training machine learning/deep learning models. To improve efficiency and accuracy, the study extracts the region of interest (ROI) of UWF images for AMD classification tasks. The ROI is defined as the area centered on the fovea with the radius equal to the distance from the center of the optic disk (OD) to the fovea. AMD UWF images are preprocessed with image rotation and additive noise performance based on salt-and-pepper noise (SPN) rules.

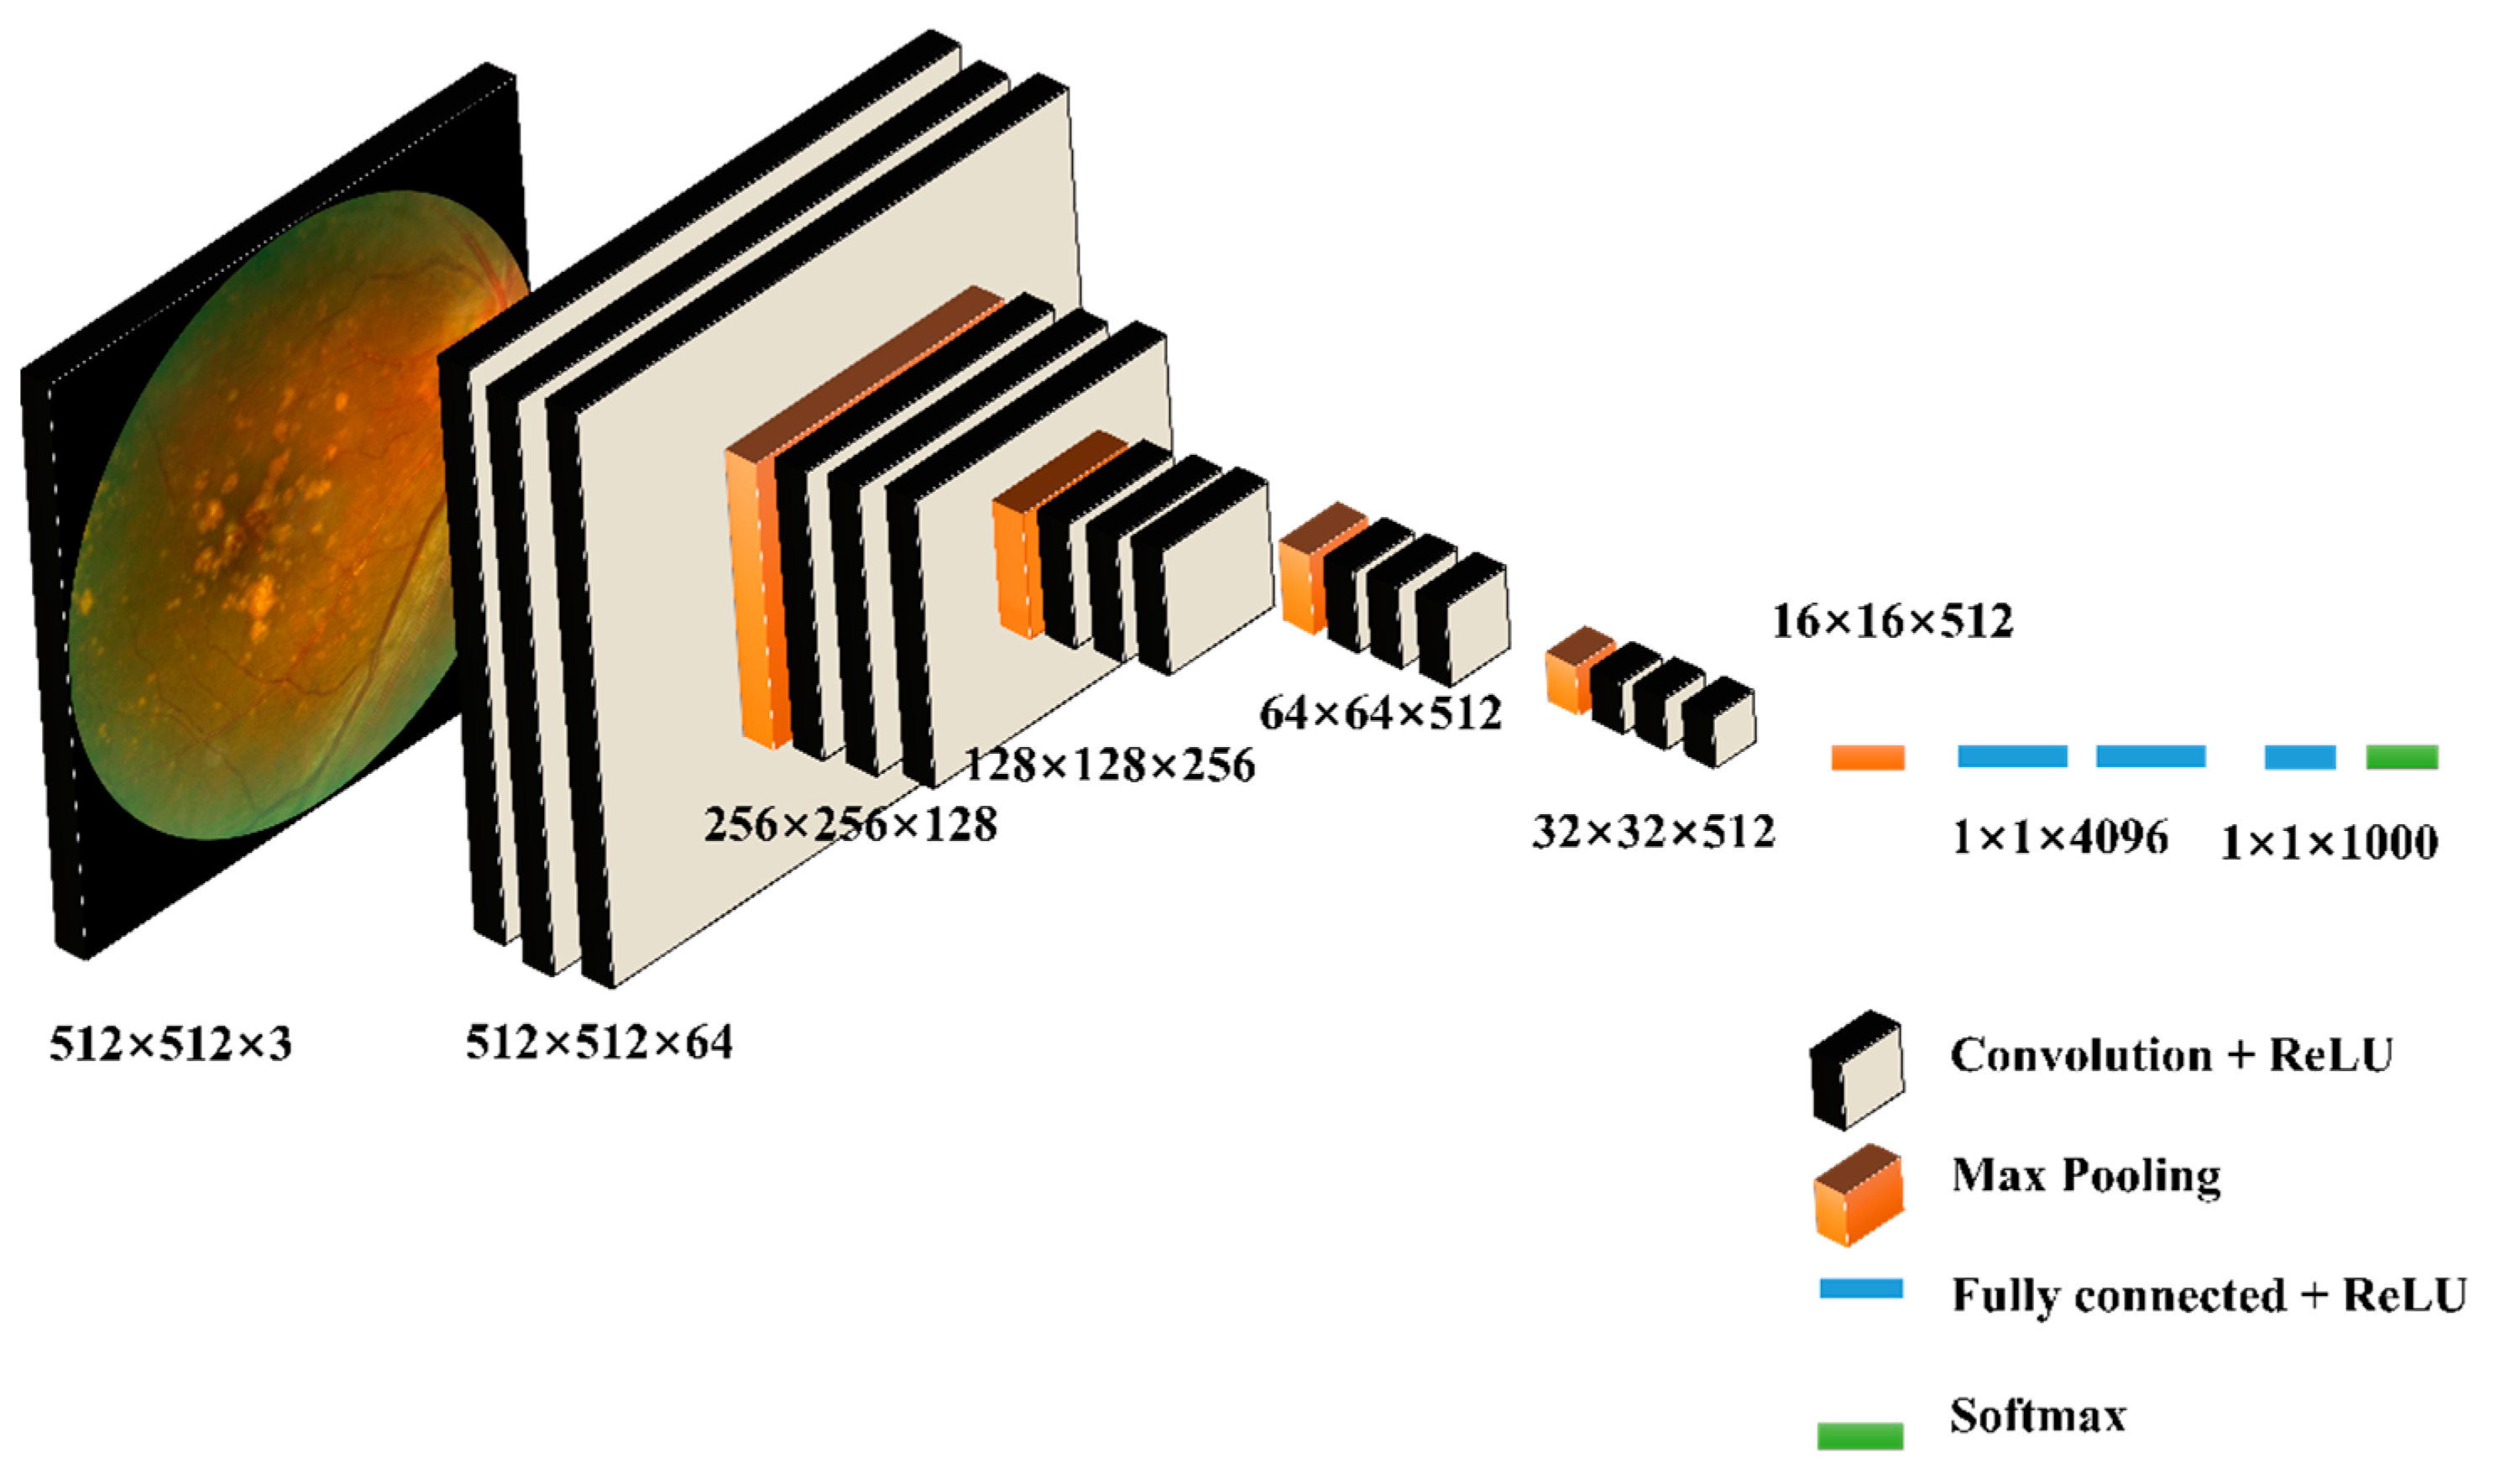
2.2.2. VGG16-Based Age-Related Macular Degeneration Detection

The VGG16 algorithm is a convolutional neural network architecture that has been widely used for various image classification tasks, including the detection of age-related macular degeneration (AMD) [44]. This algorithm has shown state-of-the-art performance on several benchmark image classification datasets, indicating its effectiveness in learning useful features from images (Algorithm 1). Its architecture is simple and uniform, with stacked convolutional layers, making it easier to understand and implement. Additionally, it is relatively lightweight compared to more recent deep neural network architectures, making it computationally efficient for real-time applications. However, the large number of parameters (138 million) in VGG16 can make it challenging to train and may lead to overfitting if the training dataset is not sufficiently large or diverse. Furthermore, it is limited in its ability to capture global context and long-range dependencies in images, which may be essential for certain tasks, such as object detection and segmentation. Despite these limitations, the VGG16 model has demonstrated good performance and can serve as a useful basic deep learning architecture for developing more specialized models for AMD detection [45].
This study employed the VGG16 model on various datasets, including OCT, segmented OCT, FAF, regular CFP, and ROI-extracted UWF images, for image classification tasks. VGG16 is a convolutional neural network architecture developed by the Visual Geometry Group (VGG) at the University of Oxford. The VGG team participated in the 2014 ImageNet Large-Scale Visual Recognition Challenge (ILSVRC) and achieved remarkable results with this architecture. The VGG16 architecture comprises 16 layers, including 13 convolutional layers and 3 fully connected layers. Each convolutional layer employs a 3 × 3 filter, followed by a ReLU activation function and a 2 × 2 max pooling layer. The fully connected layers have 4096 units each. However, deeper networks require more parameters and are computationally more expensive to train. To address this issue, the VGG team utilized smaller filter sizes (3 × 3) and smaller strides, reducing the number of parameters while still retaining a deep network architecture. The applied VGG16 algorithm uses the pseudocode presented below. This pseudocode utilizes VGG16 as a base model and adds new layers to develop a classifier for AMD detection. The input shape is defined as (512, 512, 3) to match the size of the preprocessed images. The layers of the VGG16 model are frozen to preserve the pre-trained weights, and new layers are added to the top of the model to create the classifier. The model is then compiled and trained using a generator that loads the preprocessed data. Finally, the model is assessed on a test set, and the accuracy is printed.
Algorithm 1: VGG16 algorithm for AMD detection
Import: Required libraries of tensorflow as tf
Input: Input images of OCT, segmented OCT, FAF, regular CFP, and ROI-extracted UWF
Output: Results of classification
First import VGG model and evaluation functions from tf
  from tensorflow.keras.applications.vgg16 import VGG16
  from tensorflow.keras.layers import Dense, Flatten, Dropout
Second Define input shape
  input_shape = (512, 512, 3)
  Initialize 2 centroids
Third Load VGG16 model pre-trained on ImageNet
  vgg16 = VGG16(weights=‘imagenet’, input_shape=input_shape, include_top=False)
  # Freeze layers
  for layer in vgg16.layers:
  layer.trainable = False
  # Add new classifier layers
  x = Flatten()(vgg16.output)
  x = Dense(512, activation=‘relu’)(x)
  x = Dropout(0.5)(x)
  x = Dense(1, activation=‘sigmoid’)(x)
Then Compile model
  model = tf.keras.models.Model(inputs=vgg16.input, outputs=x)
  model.compile(optimizer=‘adam’, loss=‘binary_crossentropy’, metrics=[‘accuracy’])
Next Train model
  model.fit(train_generator, epochs=10, validation_data=val_generator)
Final Evaluate model
  test_loss, test_acc = model.evaluate(test_generator)
  print(‘Test accuracy:’, test_acc)
Return data.name, VGG16 classification results
In this study, the effectiveness of the VGG16 algorithm is evaluated using several standard metrics commonly used in the field of medical image analysis, including sensitivity, specificity, accuracy, and the area under the receiver operating characteristic curve (AUC-ROC). These metrics are widely recognized as reliable measures of classification algorithm performance. To optimize the VGG16 algorithm, hyperparameters are tuned by training the algorithm on a designated training set and evaluating its performance on a separate validation set. Finally, the algorithm’s generalization performance is assessed by evaluating its performance on a distinct testing set.

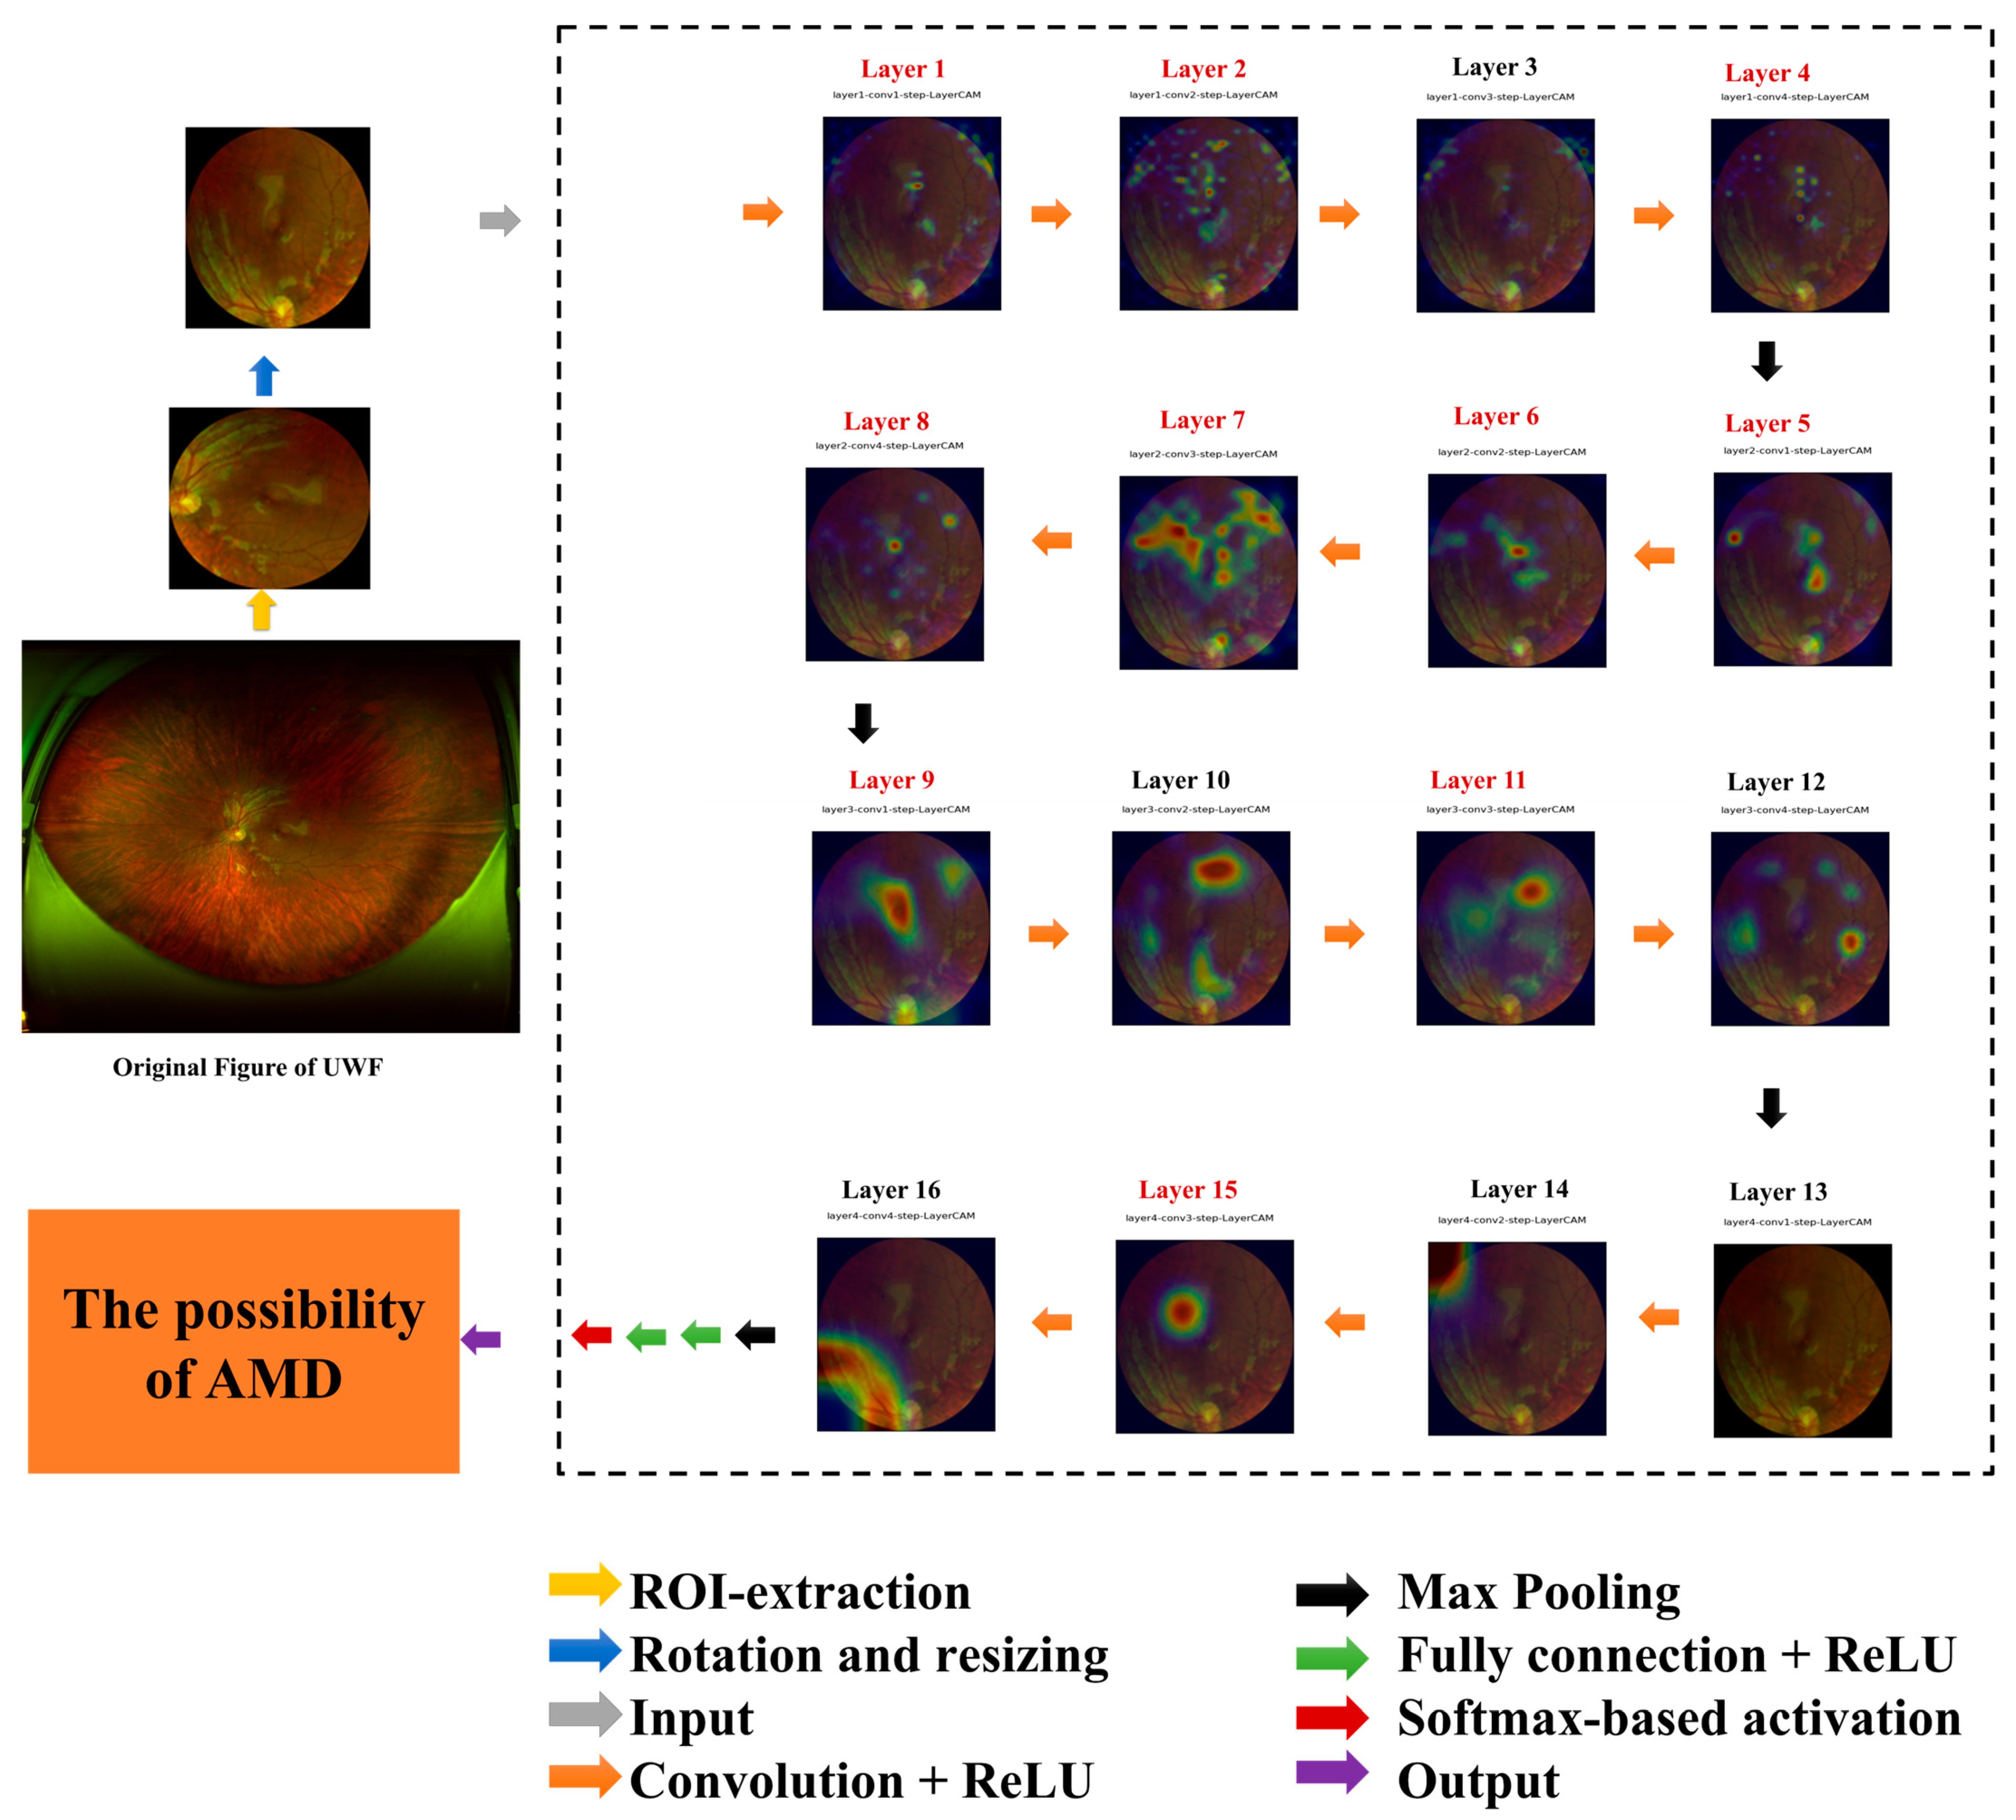
2.3. CAM-Based Explainable Artificial Intelligence Measurement of VGG-Based Model

2.3.1. Class Activation Mapping Algorithm

CAM, a technique utilized for visualizing the regions of an input image that contribute the most to a particular class prediction made by a deep learning model [46], operates by utilizing the last convolutional layer of a CNN model to obtain a feature map and then by applying a global average-pooling operation to obtain a weighted sum of the feature maps [47]. This weighted sum is subsequently passed through a fully connected layer to obtain class scores. Finally, the CAM is obtained by taking the linear combination of the feature maps with the weights obtained from the fully connected layer. The advantage of CAM is that it offers a simple and interpretable way of understanding the decision made by a deep learning model. By visualizing the regions of the image that contribute the most to a particular class prediction, CAM allows us to understand which parts of the image the model is attending to when making its decision. This can be useful in numerous applications, such as medical diagnosis, where it is important to understand which features the model is using to make its predictions.
The disadvantage of CAM is that it only provides a rough localization of the features that contribute to the model’s decision. This is because the CAM method utilizes the last convolutional layer of the model, which has a low spatial resolution. Therefore, the CAM may not be able to accurately localize small features or features that are located in close proximity to each other. Additionally, the CAM method only provides a visualization of the features that contribute to a single class prediction. To understand how the model makes a decision between multiple classes, it may be necessary to generate CAMs for each class separately, which can be time-consuming.
Several CAM algorithms, including gradient-weighted class activation mapping (Grad-CAM), smooth Grad-CAM [47], Grad-CAM++ [48], and convolutional attention map (LayerCam) [49], can be chosen for explainable AI. Grad-CAM algorithms compute the gradients of the output class score with respect to the feature maps in the final convolutional layer of a CNN. The gradients are used to weigh the feature maps, which are then summed to obtain the CAM. The guided Grad-CAM algorithm is a modification of Grad-CAM that restricts the backpropagation of gradients through ReLU activations in the CNN. This helps to highlight important image regions while suppressing irrelevant ones. The smooth Grad-CAM algorithm applies a smoothing operation to the gradients before using them to weigh the feature maps. This helps to reduce noise in the resulting CAM. Grad-CAM++ algorithm is an extension of Grad-CAM that incorporates both positive and negative gradients in the CAM computation. This helps to capture both positive and negative contributions of each feature map to the output class score. Each of these algorithms has its own advantages and disadvantages. It is important to choose a CAM algorithm that is appropriate for the task and provides meaningful explanations for the decisions made by the AI model. The choice of algorithm may depend on the specific requirements of the application. Generally, Grad-CAM is a popular and versatile algorithm that can be applied to a wide range of CNN architectures, while guided Grad-CAM is useful for highlighting specific image regions. Smooth Grad-CAM is helpful in reducing noise in the CAM, while Grad-CAM++ can capture both positive and negative feature map contributions. Unlike other CAM techniques that only work with fully convolutional networks, LayerCAM can be used with any CNN architecture, regardless of whether it includes fully connected layers or not. To generate a LayerCAM, the technique computes the gradient of the predicted class score with respect to the feature maps of the last convolutional layer of the network. The gradient is used to weigh each feature map, producing a weighted sum that represents the activation of the most discriminative regions for the predicted class. The resulting heat map can be overlaid on the original image to highlight the regions that are most important for the classification decision.
The gradient feature map is a great way to explain the ML models’ convergence direction. By comparing the conception of different CAM mechanisms, this study uses Grad-CAM for heatmap generation of the last layer, since it is suitable to evaluate VGG16 frameworks, which include a fully connected layer. A Layer-CAM is utilized for prototype extraction of layers within the network since with weighted sums are calculated, no fully connected layer is required for this approach.

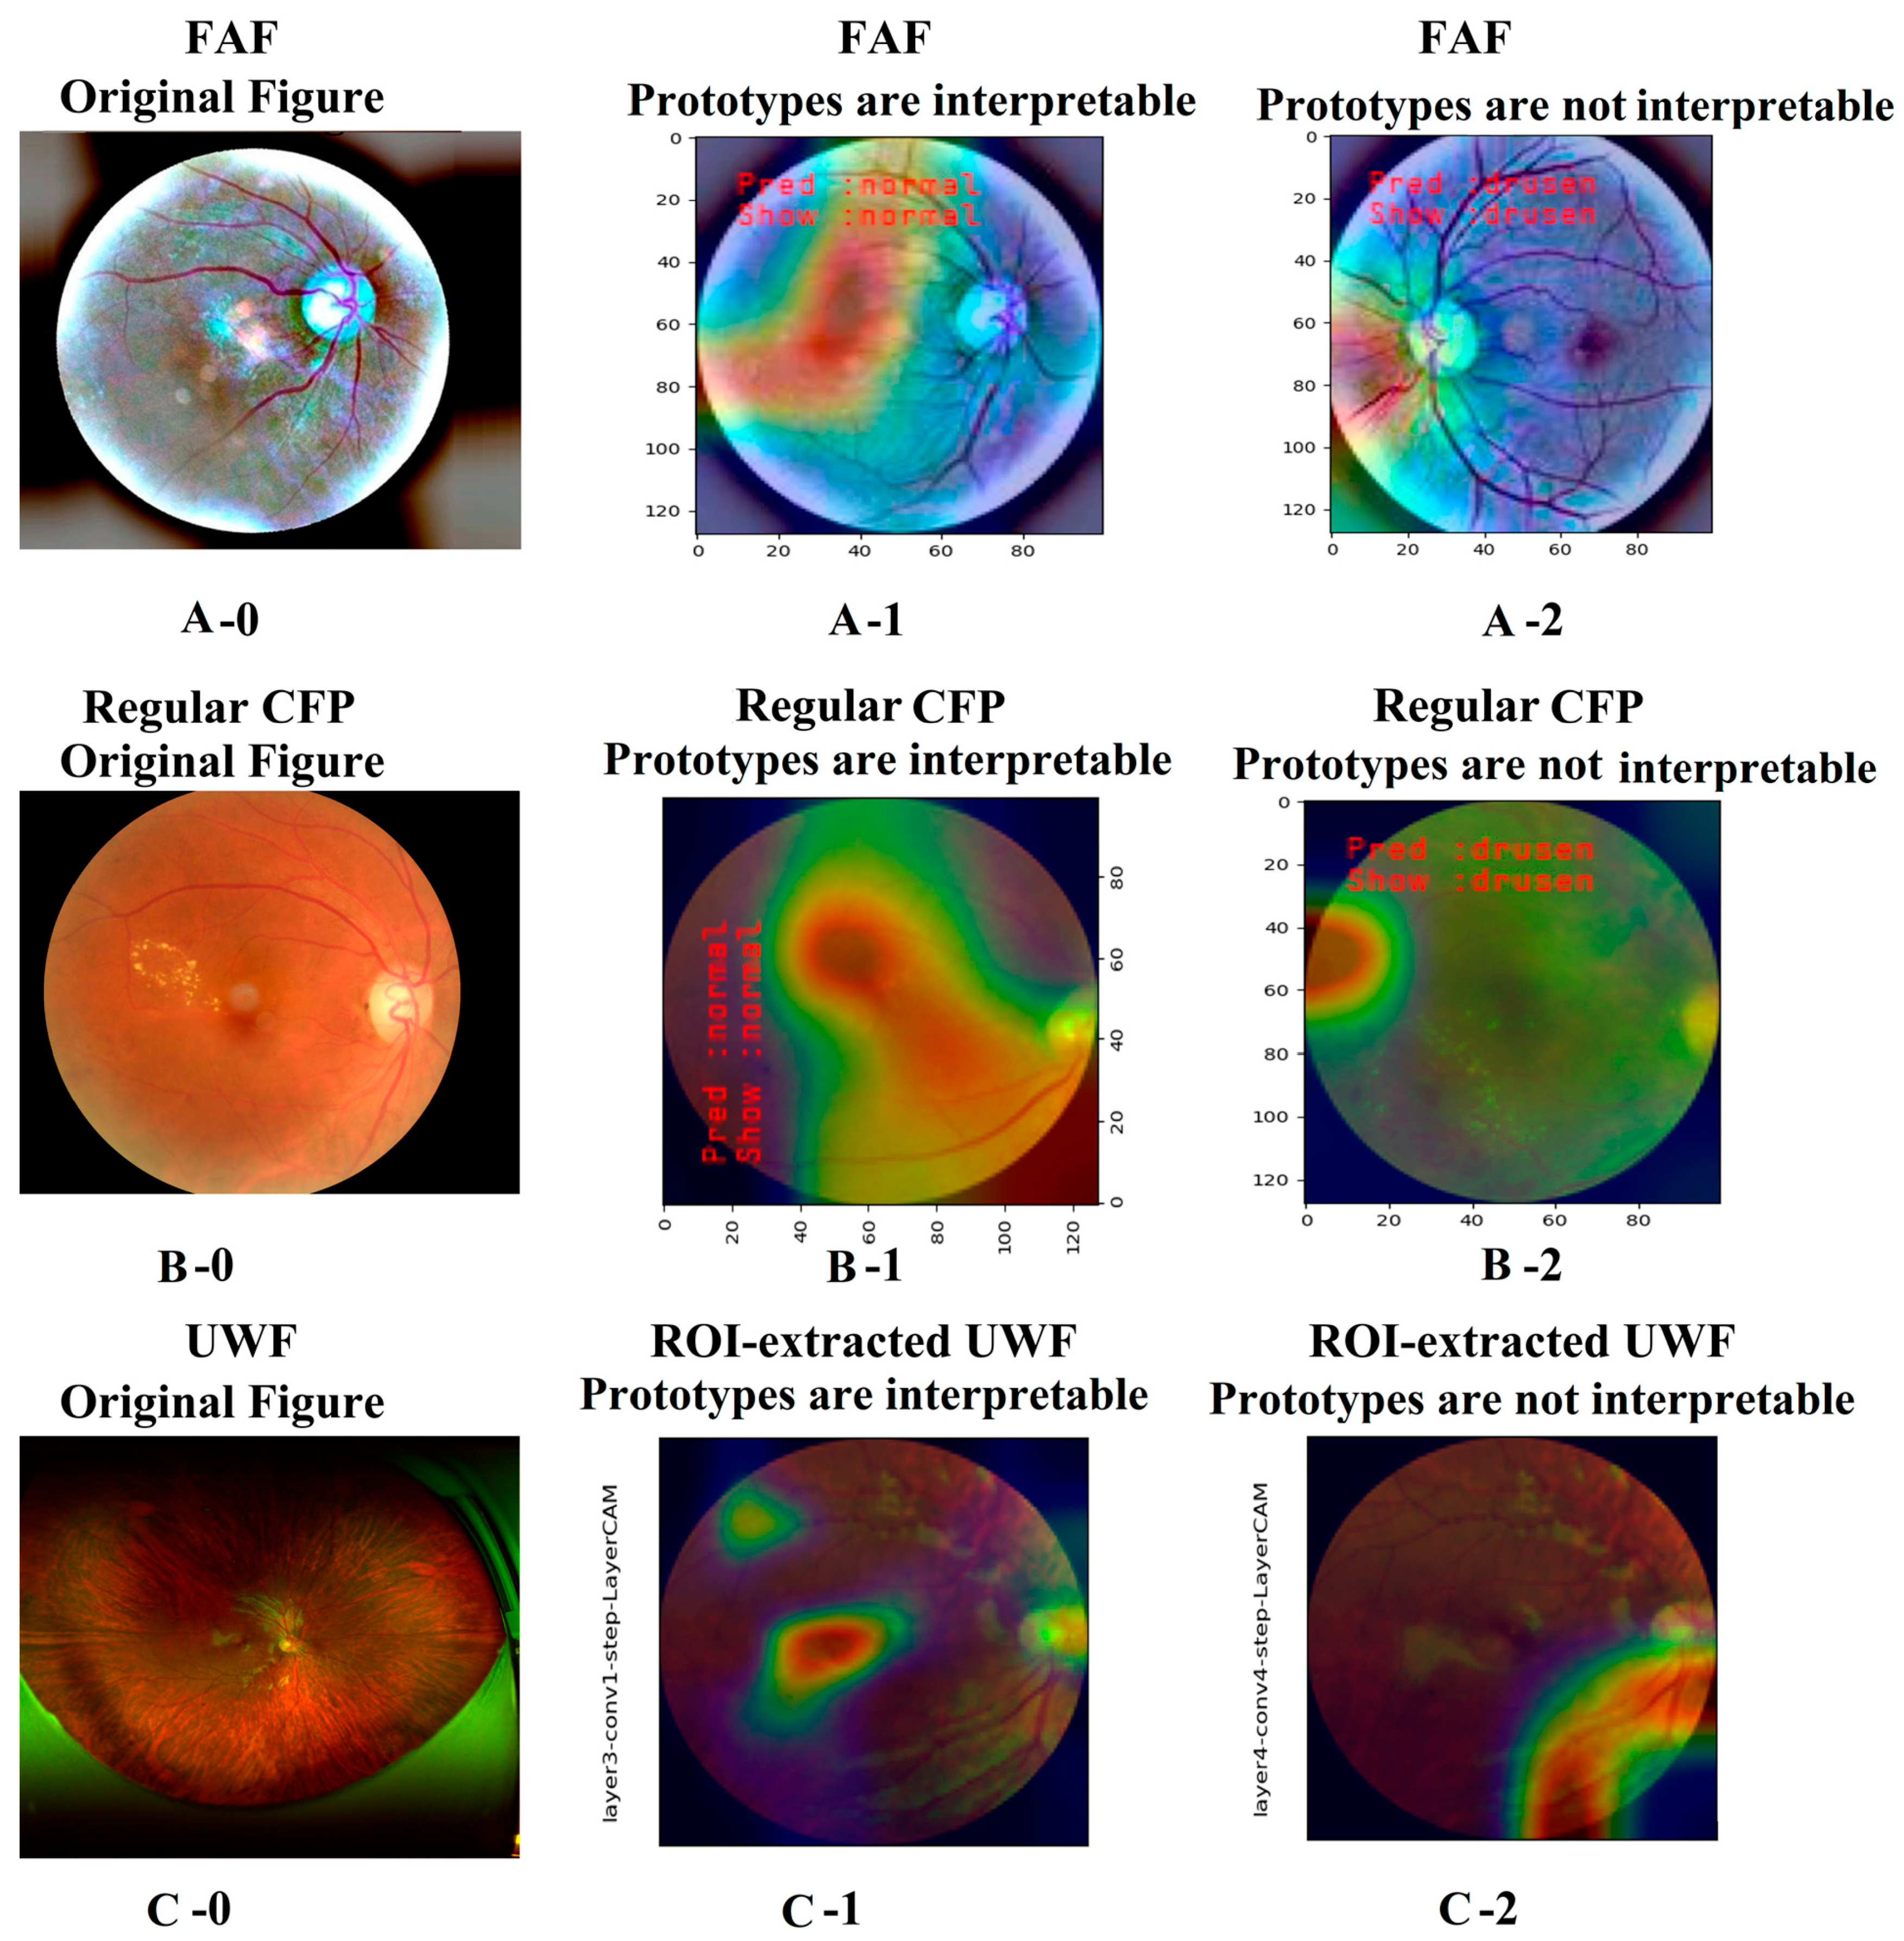
2.3.2. Explainable Artificial Intelligence Evaluation

The assessment of explainable AI (XAI) algorithms involves evaluating how effectively the model provides comprehensible explanations of its decision-making process. Several evaluation methods for XAI algorithms are available, including user studies, performance metrics, model-specific evaluation methods, and benchmarks and challenges [50]. User studies entail presenting the XAI-generated explanations to human experts or end-users and measuring their understanding and confidence in the model using various forms of surveys, interviews, or interactive tasks. In addition to accuracy, the quality of XAI algorithms can be evaluated based on performance metrics that quantify the quality of their explanations, such as coverage, consistency, and relevance. These metrics evaluate how well the model’s explanations match human understanding and domain knowledge. Furthermore, some XAI algorithms may require specialized evaluation methods based on their specific architecture or application. For instance, the intersection-over-union (IoU) score and consistency score are metrics used to evaluate the quality of class activation mapping (CAM)-based explanations by measuring the overlap between predicted heatmap and the ground truth segmentation mask and the extent to which the heatmap reflects object saliency, respectively. Finally, benchmarks and challenges can be developed to facilitate the comparison and advancement of XAI algorithms, where multiple models are assessed on a standardized dataset or task to identify the strengths and weaknesses of different approaches.
This study aimed to optimize the VGG16 model using skip connections, attention algorithms, and transfer mechanisms based on the XAI evaluation score. Specifically, a user study evaluation method was used, and the ground truth label was determined through the consensus of three ophthalmologists. The XAI indicator was calculated based on the accuracy rate between the predicted CAM-based prototypes and the ground truth using Formula (2).
X A I   i n d i c a t o r = T h e   n u m b e r   o f   t e s t   i m a g e s   w i t h   r i g h t   p r o t o t y p e s T h e   s u m   n u m b e r   o f   t e s t   i m a g e s

2.4. Model Optimization Based on Explainable Artificial Intelligence Metrics

The VGG16 model was evaluated using XAI evaluation scores in this study, and subsequently, skip connections, attention algorithms, and transfer mechanisms were employed for model optimization.

2.4.1. Skip Connections

Skip connections, also referred to as residual connections, are a type of connection employed in deep learning models that enable information to flow directly from one layer to another layer that is several layers away [51,52]. The fundamental concept behind skip connections is to add the input of one layer to the output of a later layer, thus effectively “skipping” over one or more intermediate layers. In a deep learning model without skip connections, the input undergoes a hierarchical transformation with each layer, with the output of one layer serving as the input to the next. However, as the number of layers increases, the gradients that are used to update the model parameters can become very small, leading to the vanishing gradient problem. Skip connections mitigate this problem by allowing gradients to flow more easily through the model.
To illustrate how skip connections operate in a neural network, the input is processed through several layers of the network, which extract increasingly abstract features from the input. At a certain layer, the input is directly added to the output of a later layer, effectively bypassing several intermediate layers. The resulting output is subsequently processed through several additional layers, which further refine the features. The final output of the network is a combination of the outputs from all of the layers, including the skipped layers.
Skip connections have been extensively utilized in AI-based ophthalmic applications and have demonstrated significant advantages, such as facilitating the flow of gradients during training, making it easier for the model to learn complex representations. Additionally, skip connections can improve the accuracy of deep learning models by enabling them to capture more complex patterns in the data. Furthermore, skip connections enhance the robustness of models by mitigating the vanishing gradient problem that can occur when gradients become too small to be useful for updating the model parameters. However, incorporating skip connections into a deep learning model can increase its complexity, rendering it more challenging to train and deploy. This approach may also increase the risk of overfitting on small datasets, particularly if the model is not fine-tuned properly. Additionally, this method can add to the computational cost, requiring more memory and processing power during training and inference.
In summary, skip connections have demonstrated potential in improving the accuracy and robustness of deep learning models for AMD detection, particularly when employed in complex deep learning frameworks. Nevertheless, their incorporation into a model may also increase its complexity and computational cost, necessitating careful fine-tuning to avoid overfitting.

2.4.2. Attention Mechanism

The attention mechanism is a deep learning technique that improves the accuracy and interpretability of models that process sequential data [53,54]. The attention mechanism enables the model to focus on specific parts of the input sequence or image that are most relevant to the task at hand. This is achieved by generating a set of attention weights that determine the importance of each feature or representation in the context of the task being performed. Attention weights can be generated using various techniques, including dot product attention, additive attention, or self-attention. Attention mechanisms have been shown to be effective in improving the accuracy and interpretability of deep learning models, particularly for tasks that require processing sequential data.
The application of attention mechanisms to AMD detection using deep learning frameworks, including VGG16, has shown promise in improving the accuracy of original models. Attention mechanisms can help focus on specific regions or features of an image that are most relevant to the task of AMD detection, reduce computation, and improve interpretability. However, adding attention mechanisms to deep learning models can increase their complexity, making them more difficult to train and deploy. Furthermore, attention mechanisms may increase the risk of overfitting on small datasets, particularly if the model is not fine-tuned properly. Additionally, developing attention mechanisms for AMD detection requires large amounts of high-quality data that are representative of the population being studied, which can be challenging and time-consuming.
In summary, attention mechanisms have demonstrated potential in enhancing the accuracy and interpretability of deep learning models for AMD detection, particularly when integrated with complex deep learning frameworks such as VGG16. Nevertheless, attention mechanisms also increase complexity and may lead to overfitting, necessitating the fine-tuning of models. Furthermore, their development for AMD detection requires large amounts of representative, high-quality data.

2.4.3. Transfer Learning

Transfer learning (TL) is a popular machine learning technique that involves utilizing the knowledge gained from training a model on one task to improve the performance of the same or a related model on a different task [55,56]. This approach allows for the reuse of a pre-trained model as a starting point for training a new model on a different but related task, which can lead to faster convergence, improved accuracy, and better generalization performance. By leveraging the learned representations from the pre-trained model as feature extractors and training only the last few layers of the new model on the target dataset, it is possible to achieve high accuracy with fewer data and less training time. This has made transfer learning an effective strategy for many applications in computer vision and natural language processing.
Transfer learning has the potential to enhance the performance of AMD detection models by leveraging the knowledge from pre-trained models, leading to higher accuracy with fewer labeled data and shorter training time. Moreover, transfer learning can increase the robustness of the AMD detection model, reducing overfitting and improving generalization to new datasets. By reusing pre-trained models, transfer learning can also save computational resources and facilitate the development of high-quality AMD detection models. However, the effectiveness of transfer learning depends on the similarity between the pre-trained model and the new task, and it may not be effective if the pre-trained dataset is irrelevant or too complex for the new task. Overfitting may also occur if the pre-trained model is too complex or if the training dataset is too small. Furthermore, transfer learning models may be limited to specific domains, such as fundus photography or OCT imaging, and may not generalize well to other imaging modalities or diseases.
Therefore, transfer learning has the potential to contribute significant benefits for AMD detection, including enhanced performance, robustness, and resource efficiency. Nonetheless, it is not exempt from limitations, such as reduced generalization, overfitting, and domain specificity. It is crucial to prioritize selecting a large dataset as the pre-training input, and when deciding to apply transfer learning for AMD detection, it is essential to choose similar datasets for the pre-training and training models.

2.4.4. Model Robustness Evaluation

Assessing the robustness of AI models is a critical step in ensuring their performance in real-world situations. The evaluation of an AI model’s robustness includes accurate, reliable, and time-consuming evaluation for unseen data [57], which can be performed through various methods of adversarial testing [58], including cross-validation, sensitivity analysis, and stress testing [59]. Adversarial testing involves exposing the AI model to deliberately modified data to detect potential weaknesses and areas that require improvement. Cross-validation assesses the AI model’s performance on distinct subsets of training data to ensure that it can generalize well to new data and avoid overfitting. Sensitivity analysis measures the model’s performance when its input data are perturbed or modified to evaluate the model’s robustness to changes in input data. Stress testing investigates the AI model’s performance under extreme conditions to determine its limits and identify how well it can handle challenging scenarios. By employing these methods, researchers and developers can identify and address potential weaknesses in AI models and improve their performance and reliability for real-world applications.
In this study, the unseen robustness measurement dataset was utilized for the training model cross-validation, which included 150 images of OCT, segmented OCT, FAF, regular CFP, and ROI-extracted UWF. Ten folders were employed in this method, and the average score determined the final outcome.

3. Results

3.1. Explainable Artificial Intelligence Analysis Based on VGG16 Model for AMD Detection

This study employed the VGG16 model to perform the task of classifying “AMD/Normal” using various databases, including OCT, segmented OCT, FAF, Regular CFP, and ROI-extracted UWF. The training model exhibited a loss value of less than 0.03, and a high accuracy of 96% was achieved with the training data. To evaluate the interpretability of the model, a subset of 100 images was randomly selected from the detection and validation datasets for CAM visualization display. The ratio of the number of images to the number of extracted images was then calculated to determine the interpretability evaluation index, XAI Indicator (XAII).

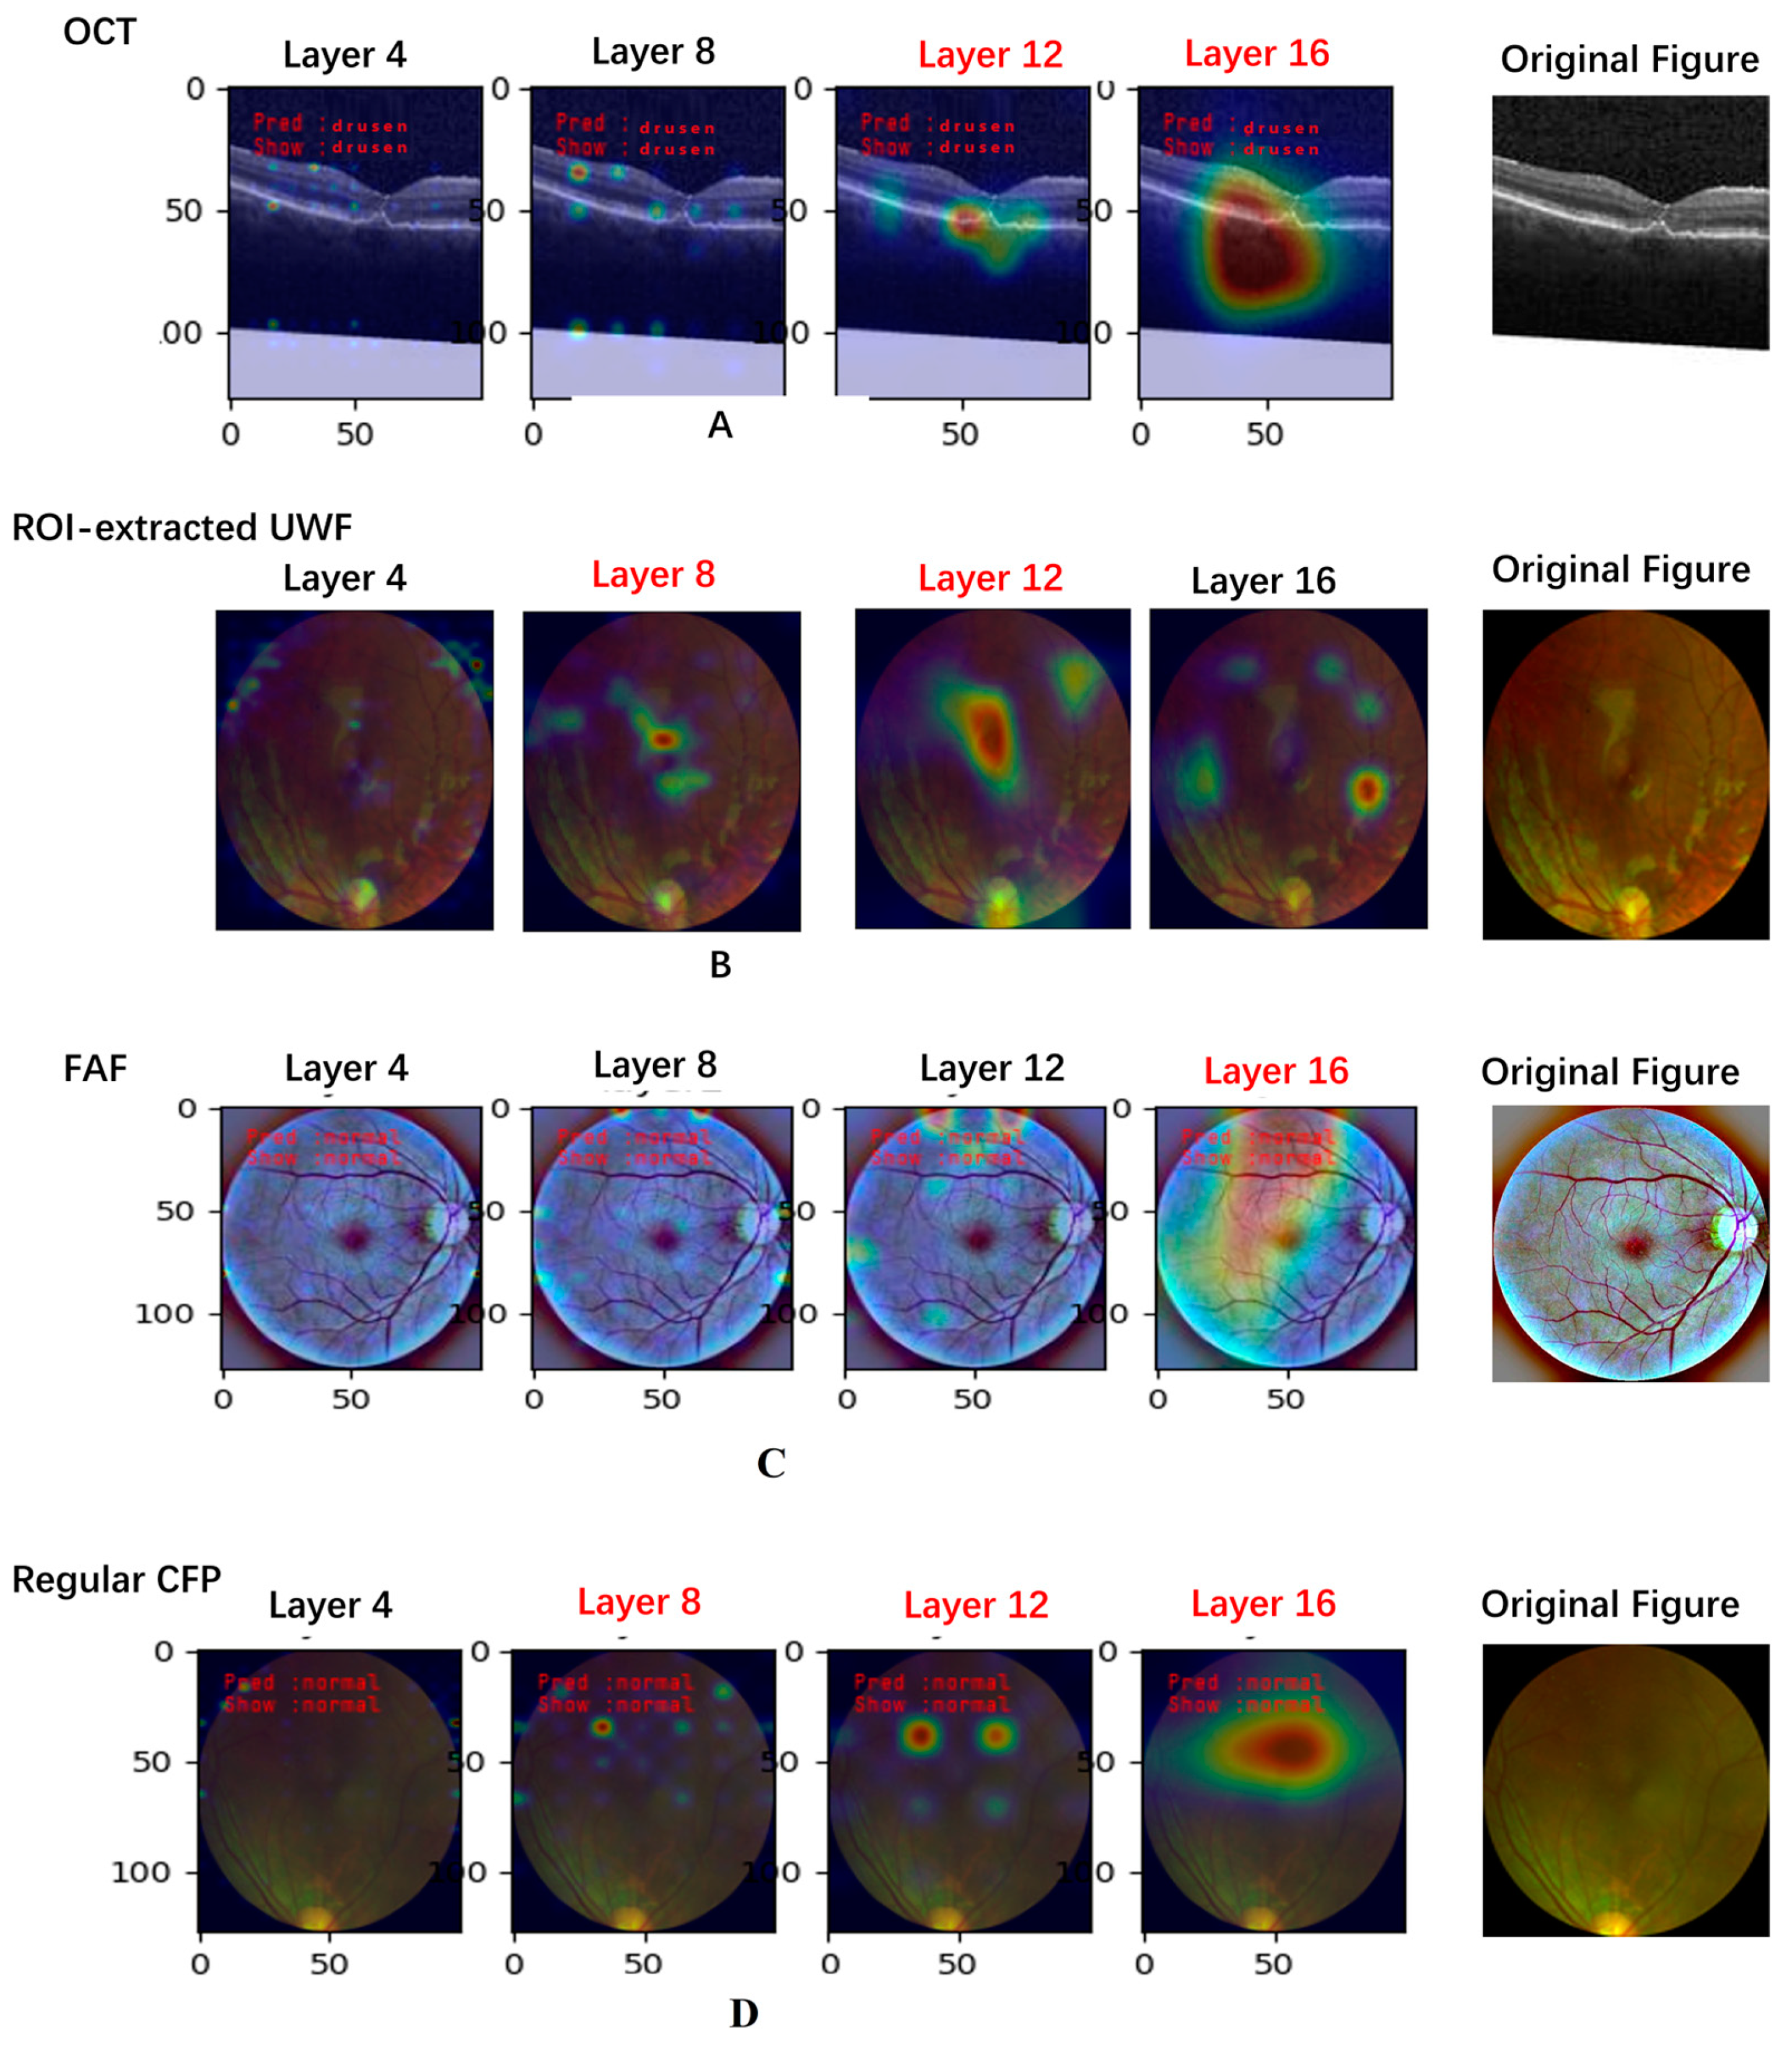
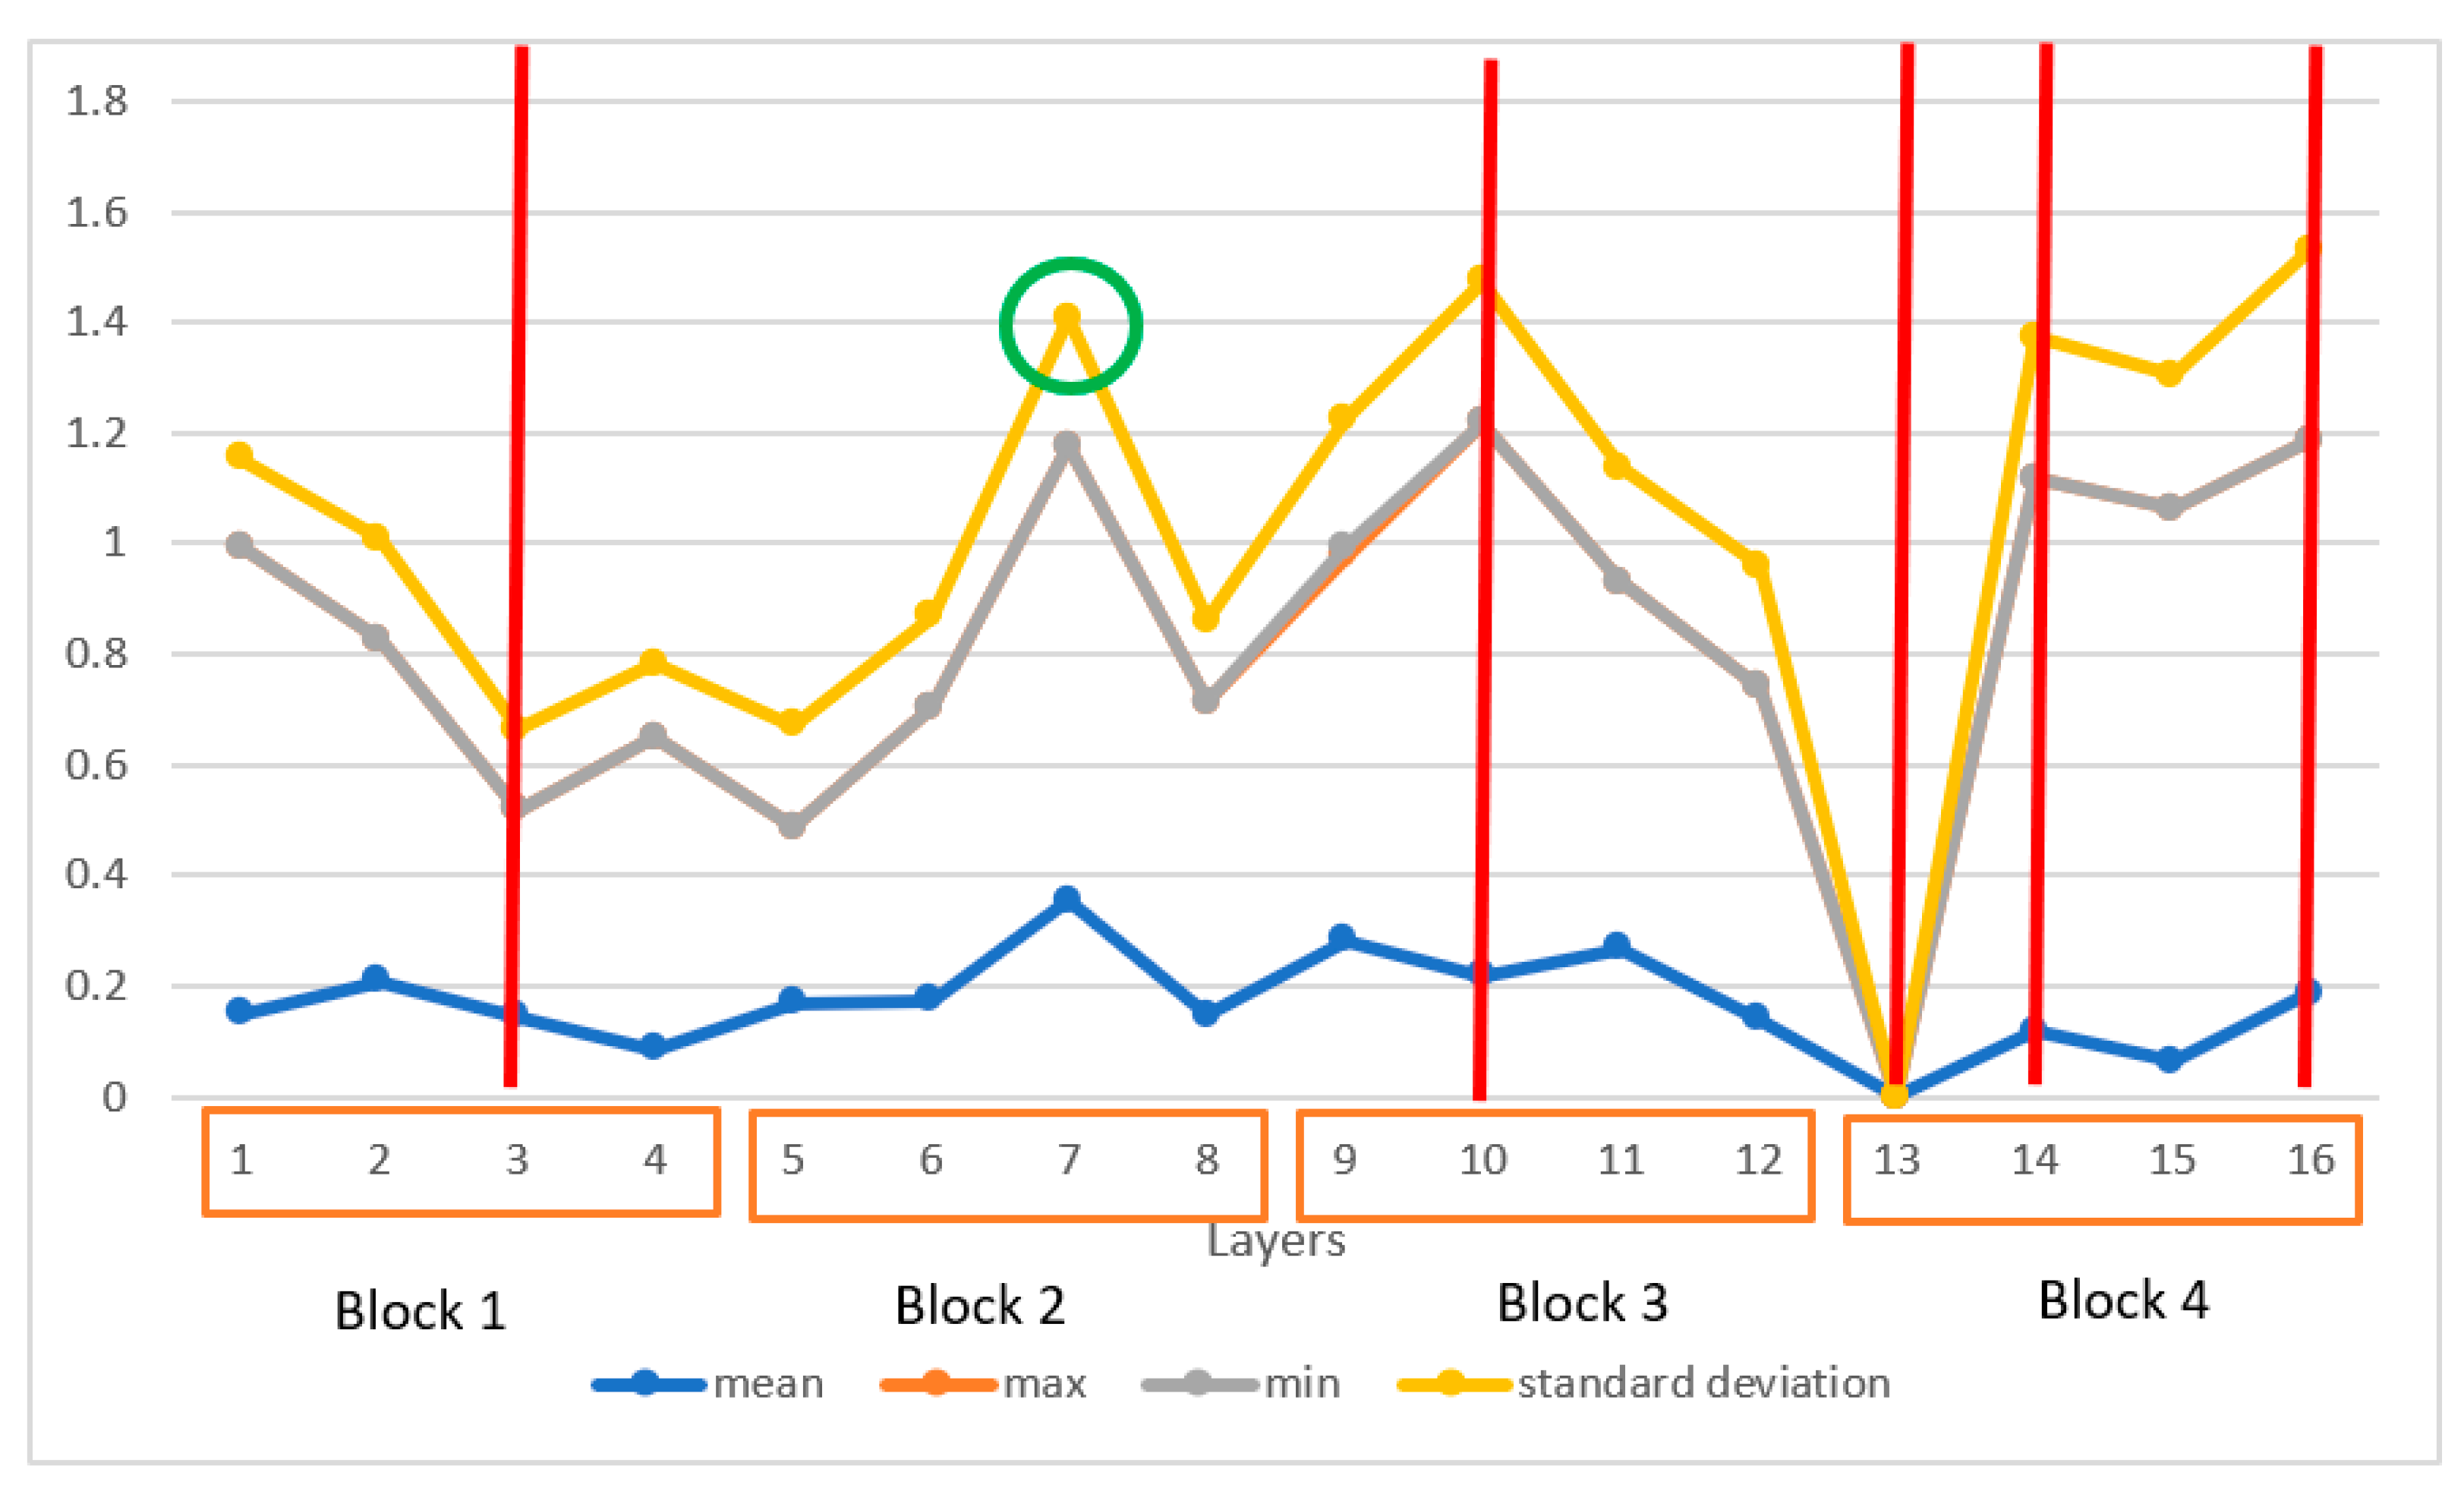
3.1.1. Explainable Artificial Intelligence Analysis Based on the Last Convolutional Layer of VGG16 Model

In this study, the Grad-CAM algorithm was employed to extract the prototypes from the final convolutional layer of the VGG16 model for various image types. The results indicate that the interpretability of the segmented OCT dataset was the highest, achieving a value of 100%. Moreover, the XAI values for OCT, FAF, regular CFP, and UWF were found to be 0.5, 0.5, 0.3, and 0.9, respectively.
Figure 1 displays a case of the interpretability result of OCT and segmented OCT images. All cases in Figure 1 are related to scenarios with a right classification of AMD, where drusen manifestations are shown in the images. The right prototypes should be shown in the area under the fovea. The OCT segmented images have no cases of interpretable errors, where images A-1, B-1, and B-2 represent interpretable correct cases, while image A-2 is an instance of an interpretable error. The data investigation based on Figure 1 reveals that 98% of the OCT explainable artificial intelligence (XAI) error cases occur at the incorrect prototypes located at the extreme ends of the images (as demonstrated in A-2 of Figure 1). In response to this, the images are divided into three segments based on their width, and the part with a width of 25% and 75% of the original images is retained. These manipulated data are termed “End-cut-OCT” images in this research. Subsequently, this dataset is employed to test AMD detection using deep learning models and compared with the original OCT datasets in the concluding experiment.
Figure 2 displays the XAI-based cases for FAF, regular CFP, and ROI-extracted UWF. The subfigures of A-0, B-0, and C-0 correspond to the original images, while A-1, B-1, and C-1 represent interpretable correct cases, and A-2, B-2, and C-2 represent interpretable error cases. The determination of whether an image is interpretably correct was made based on manual assessment by three ophthalmologists, who evaluated whether the label matched their prior knowledge. If the label and prior knowledge matched, the corresponding image was deemed to be interpretably correct.

3.1.2. Retrospective Explainable Artificial Intelligence Analysis of VGG16 Model

In this retrospective study, the interpretability of OCT, segmented OCT, FAF, regular CFP, and ROI-extracted UWF images was investigated using the VGG16 model. As depicted in Figure 3, the VGG16 architecture comprises four blocks, each of which concludes with a max-pooling layer, at the 4th, 8th, 12th, and 16th layers.
Therefore, in order to examine the interpretability of the images in this study, the Grad-CAM and Layer-CAM algorithms were employed after the max-pooling and convolutional layers of the VGG16 model, specifically layers of 4, 8, 12, and 16. The corresponding cases are presented in Figure 4, where the correct prototypes for layers 12 and 16 are demonstrated in the OCT image, layers 8 and 12 in ROI-extracted UWF, layer 16 in FAF, and layers 8, 12, and 16 in regular CFP images.
In this study, a cutoff value of 0.6 is employed to measure the interpretability of models. If the XAI index of a layer is greater than or equal to 0.6, it is considered to be effectively interpretable; otherwise, its learning process is deemed to be uninterpretable. According to Table 1, layer 12 of the model exhibits relatively high interpretability for OCT images. All layers are found to be interpretable for segmented OCT and ROI-extracted OCT images. For FAF images and regular CFP datasets, layers of four and eight are verified to be interpretable.
Furthermore, the results of the XAI analysis conducted on the model trained for AMD detection revealed an interesting trend. As depicted in Figure 4B, in the following ROI-extracted UWF images, prototypes are increasingly reasonable from layer 3 to layer 9. This implies that the model is learning interpretably from layer 3 to layer 9 but not after layer 9. To explore the underlying reasons, this study conducted an extensive XAI analysis on this figure for each layer of the model. The findings are presented in Figure 5, which reveals that layers 3, 10, 12, 13, 14, and 16 exhibit weak interpretability.
Equation (3) shows the prediction score for AMD detection of  y A M D is calculated by using the VGG16 model of  f V G G 16 A M D , the parameter of this model is  θ , and the input dataset is  I A ( i , j ) k is the feature matrix of unsampled figure  k . The class-specific gradients  g ( i , j ) k of the predicted class score with respect to the feature maps are calculated as shown in Equation (4). The feature maps are weighted as  W ( i , j ) k , which are a Relu activation calculation process of gradients  g ( i , j ) k (as shown in Equation (5)). Equations (6) and (7) illustrate that weighted feature maps are summed across the channel dimension  A ^ ( i , j ) k to produce a single heat map, which is denoted as  G r a d C a m   s c o r e of the Layer-CAM algorithm.
y A M D = f V G G 16 A M D ( I , θ )
g ( i , j ) k = y A M D A ( i , j ) k
W ( i , j ) L = r e l u ( g ( i , j ) k )
A ^ ( i , j ) k = W ( i , j ) k · A ( i , j ) k
G r a d C a m   s c o r e = r e l u ( l A ^ ( i , j ) k )
Upon analyzing the gradient matrix, feature map weighting matrix, and heat map (Layer-CAM) score matrix of each layer, four findings were identified by this study. As shown in Figure 6, values of min, max, mean, and standard deviation (std) of  A ^ ( i , j ) k matrix of each layer are descriptively illustrated. Firstly, the deeper the layer is, the closer the mean values are intended to be to zero, which means there is a downward trend for significant information maintenance. Secondly, a max-pooling process is between blocks; thus, there is a turning point of std, min, and max values with a downward numerical trend between blocks. After max pooling, more AI-generated information is added to the compressed figure, and the learning method would be changed by the model in the next layer. Thirdly, there is always a significant turning point of std, min, and max values in the layer with wrong prototypes. The deeper the layer is, the bigger the possibility would be. Fourthly, the layer with the greatest number of right prototypes usually appears in the second and third blocks, which must be verified in a further experiment.

3.2. Model Optimization Based on Explainable Artificial Intelligence Metrics

According to the results of Section 3.1.2, the original VGG16 shows great explainability for segmented OCT and ROI-extracted UWF in all the layers. However, it is interpretable for some layers for OCT, FAF, and regular CFP images. Thus, this study proposed two optimized model architectures (the pseudocode is shown in Algorithm 2) based on a skip connection and attention mechanism. Since the size of FAF is small, this study proposed an FAF-based AMD detection method based on the transfer learning mechanism and regular CFP-based model.
Algorithm 2: Optimized VGG16 algorithm for AMD detection
Parameters:  ε = 12 (OCT images);  ε = 4   a n d   8 (regular CFP and FAF images)
1.
Define the original VGG16 model
2.
Add skip and attention layers between the ε th layers and subsequent layers
3.
Train the new model on the training set
4.
Test the new model on the testing set
5.
Evaluate the performance of the new model
6.
Compare the performance of the new model with the original VGG16 model
Since it is interpretable in layer 12 for the original VGG16 AMD detection model based on OCT images, this study proposed a novel architecture by adding skip and attention layers between the 12th layers and subsequent layers (as shown in Figure 4A). Otherwise, because it is explainable for layers 4 and 8 in regular CFP and FAF images, this study proposed an optimized model by adding skip and attention connections between the fourth and eighth layers with subsequent layers (as shown in Figure 7B). Channel and spatial domain attention mechanisms are included in this framework. Finally, to solve the issue of the small size of the FAF training dataset, this study applies the transfer mechanism from the regular CFP-based optimized model to FAF-based AMD detection tasks.
As presented in Table 2, the performance of the improved VGG16 model was compared with the original VGG16 model. The original VGG16 model had an average testing accuracy of 82%, an average AUC of 90.772%, an average interpretability index of 0.64, and an average testing time per image of 0.084. In contrast, the improved VGG16 model demonstrated better accuracy, with an average testing accuracy of 95.448% and an average AUC of 94.574%. Moreover, the interpretability of the improved model was higher, with an average explainability index of 0.84. However, the average testing time per image was longer, with an average of 0.182. The improved model also demonstrated higher robustness, as indicated by its better performance on unseen testing datasets for each type of image. Specifically, based on the improved VGG16 model, the end-cut OCT images had a high testing accuracy of 94.14%, which was higher than the OCT images (91.4%). Moreover, transfer learning showed a significant advantage for FAF image classification (98.62% vs. 94.62%), showing potential for solving the issue of small size in the training datasets.

4. Discussions

In AI-based AMD detection, low explainability can result in low robustness, leading to reduced confidence in the model’s output and lower adoption rates [60]. A model lacking transparency may also be difficult to interpret, making it challenging for clinicians to understand how the model arrived at its diagnosis. Therefore, XAI exploration is necessary for AI-based medical identification tasks. Compared to the former studies, this study proposes a novel model optimization approach based on XAI. Taking the AMD image classification based on multiple types of images from the IOT system as an example, this study proposed a model enhancement approach by adding skip and attention mechanisms between explainable layers. A data bias-removing process is implemented and guided by XAI evaluation results. Real-world “unseen” data are used for the machine learning model’s robustness evaluation. By comparing the robustness of the original VGG16 and the optimized model for AMD detection, this study verified the effectiveness of the XAI mechanism to optimize the robustness of machine learning models based on four types of ophthalmic digital images (average accuracy for the unseen testing dataset of all data types: 82% vs. 96.62%). The ethics approval was approved by Zhuhai People’s Hospital (Zhuhai Hospital affiliated with Jinan University).
Otherwise, A high level of explainability and interpretability could assist in improving model performance and robustness [61]. This study verified the effectiveness of data bias removal and model enhancement processes in enhancing the robustness of AMD detection by evaluating accuracy results for unseen test datasets. This study shows that the CAM-based XAI method is a great way to evaluate the efficiency of layers in the model. With the CAM score and that judged by the ophthalmologists, the layers with explainability should be more concerned in the model architecture. Using skip and attention mechanisms, these layers could contribute more to the prediction process. In addition, with the CAM visualization and cooperation with experts, data bias could be recognized, which could assist the data preprocessing and data quality enhancements. Thus, compared to the original black-box models, where model bias and data bias are not recognized, the interpretable improved learning model shows high robustness.
Additionally, XAI indicators and measurements can also aid in sample data selection and preprocessing method choice [62]. The study showed that segmented OCT and ROI-extracted UWF deliver the strongest explainability and interpretability due to significant drusen features for OCT after segmentation and less noise in the entire ROI-extracted UWF image entity. It is important to analyze and interpret visualizations of prototypes at different layers to understand the model’s behavior and improve its accuracy, transparency, and interpretability. By understanding the most important features and patterns in diagnosis, clinicians can ensure that the AI system is not unfairly biased towards certain patient populations, making it more useful and effective in clinical practice.
Moreover, by exploring the XAI measurement in certain layers of the DL-based AMD detection model, this study identified three possible reasons for the existence of wrong prototypes. Firstly, the complexity and variability of features learned by the model at different layers could be contributing factors. Deeper layers of the model learn more abstract and intricate features that may not be directly relevant to the target AMD features, leading to the development of wrong prototypes in certain layers that may not aid accurate detection. Secondly, the model may have to overfit certain features or patterns in the training data, resulting in the generation of wrong prototypes. Insufficient amounts of training data may also be a possible reason for the development of wrong prototypes, as it can cause the model to learn irrelevant or incorrect features. To address these issues, skip connections that learn global and local features from each layer could be introduced. Advanced feature extraction mechanisms, such as reward mechanisms for reinforcement learning, punishment mechanisms for adversarial neural networks, and attention mechanisms for useful feature extraction, should also be considered. In addition, features extracted from different channels are different, so channel selection and model optimization should be considered in the future. Data rotation and other data enhancement processes could be used to improve data robustness, and more real-world data could be added to the model training dataset. Transfer learning is another great way to encounter the small size of the training dataset. It was verified in this study by comparing the performances between the original VGG16 (accuracy for the unseen testing dataset = 97%) and improved model with transfer (accuracy for the unseen testing dataset = 99.2%) based on FAF images.
Furthermore, this study suggests a potential relationship between the center of the optic disc and AMD, as nearly all the analyzed images exhibit a prototype in this area. The optic disc is an essential region in the retina that is positioned close to the macula, which is responsible for detailed vision and is often affected by AMD. Drusen, small deposits of cellular debris, can accumulate in the macula of individuals with AMD and may also be detected near the optic disc. Therefore, it is plausible that the appearance of a prototype in the center of the optic disc in certain images could be associated with the presence of drusen and AMD. However, additional research is required to validate this hypothesis.
The implementation of ophthalmic AI systems in clinical settings necessitates careful consideration of practical aspects, including data privacy, regulatory compliance, ethical considerations, and challenges related to system validation and performance monitoring. These considerations are crucial to ensure the privacy and security of patient data in accordance with relevant data protection regulations, such as GDPR and HIPAA. Compliance with regulatory requirements, including obtaining necessary certifications or approvals, may be necessary. Ethical considerations are paramount, including informed consent, transparency in decision making, and responsible use of AI technology. Robust validation processes are essential to assess the performance and reliability of ophthalmic AI systems, including evaluating the accuracy, sensitivity, specificity, and other pertinent metrics. Performance monitoring is crucial to identify any potential drift or degradation in system performance over time. Mitigating biases and ensuring fairness in AI systems is important and achieved through diverse and representative training data. User training and education are vital to equip healthcare professionals with the knowledge to interpret AI system outputs accurately. Integrating AI systems into clinical workflows should be seamless and efficient. Liability, malpractice, and legal frameworks must be established to address responsibility and accountability. Successful implementation requires collaboration among AI developers, healthcare professionals, regulatory bodies, and ethics committees to navigate these challenges while upholding patient privacy, safety, and ethical standards in AI technology usage.
However, there are still some limitations to this study. First, more DL models could be considered as the basic architecture for classifications rather than the vgg16 typical model. Second, more classification tasks rather than AMD detection could be performed to verify the hypothesis this study proposed. Third, a deep exploration related to data quality enhancements and data bias removal based on XAI could be discussed. Lastly, other XAI mechanisms and optimization methods may be considered, and the proposed model optimization methods could be compared to the other optimization approaches.

5. Conclusions

The issue of robustness is a crucial factor in the application of AI methods for AMD detection in real-world clinical data, which may be affected by the low interpretability of AI models. In this study, an exploration of AI-based AMD detection using OCT, regular CFP, FAF, and UWF images was conducted, along with measurement and analysis of XAI. The findings and insights obtained in this study suggest that the hypothesis that XAI can improve the robustness of DL models is significant. By providing a clear understanding of the model’s decision-making process, XAI can help identify potential biases or errors in the data or model architecture, leading to more reliable models. Additionally, XAI can aid in identifying the root cause of model failures or suboptimal performance, leading to better error analysis and model improvements. This feedback can be used to fine-tune the model and improve its robustness and performance. Furthermore, XAI can generate hypotheses for clinical research and contribute to knowledge-driven and truth-driven healthcare and disease treatments, rather than just being data-driven. The ability to comprehend how a model operates and why it makes certain decisions can lead to more reliable and robust AI systems, and XAI has enormous potential for enhancing medical AI models and bridging the gap between computer science and medicine.

6. Patents

The Chinese patents named “The explainable AI method and system for AMD detection” (No. 2022104330486), “The classification method for AMD detection” (No. 2022104328005), “The explainable AI algorithm for AMD early screening” (No. 2022104329332) and “The algorithm of Macular fovea diagnosis” (202111329782. X) are related to this project.

Author Contributions

Conceptualization, M.H.W., K.K.-l.C. and Y.P.; methodology, software, validation, formal analysis and investigation, M.H.W. and Z.L.; resources, X.Y. and M.H.W.; writing and revision—M.H.W.; visualization, M.H.W. and K.K.-l.C.; supervision, Y.P. and K.K.-l.C.; funding acquisition, M.H.W. All authors have read and agreed to the published version of the manuscript.

Funding

This research was funded by the National Science Foundation of China under Grant U22A2041, Shenzhen Key Laboratory of Intelligent Bioinformatics under Grant ZDSYS20220422103800001, Shenzhen Science and Technology Program under Grant KQTD20200820113106007, Zhuhai Technology and Research Foundation under Grant ZH22036201210034PWC and 2220004002412, MOE (Ministry of Education in China), Project of Humanities and Social Science under Grant 22YJCZH213, The Science and Technology Research Program of Chongqing Municipal Education Commission under Grant KJZD-K202203601 and KJQN0202203605, KJQN202203607, and the Natural Science Foundation of Chongqing China under Grant cstc2021jcyj-msxmX1108.

Institutional Review Board Statement

The study was conducted in accordance with the Declaration of Helsinki, and approved by the Institutional Review Board of Zhuhai People’s Hospital (Zhuhai Hospital Affiliated with Jinan University) (protocol code [2023] No. 54).

Informed Consent Statement

Informed consent was obtained from all subjects involved in the study.

Data Availability Statement

The UWF real-word dataset is an in-house dataset, which this article collected from Zhuhai People’s Hospital (Zhuhai Hospital Affiliated with Jinan University). The “data access authorization & medical data ethics supporting document” from Zhuhai People’s Hospital (Zhuhai Hospital Affiliated with Jinan University) can be shared upon request.

Conflicts of Interest

The authors declare no conflict of interest.

References

  1. Grassmann, F.; Mengelkamp, J.; Brandl, C.; Harsch, S.; Zimmermann, M.E.; Linkohr, B.; Peters, A.; Heid, I.M.; Palm, C.; Weber, B.H. A Deep Learning Algorithm for Prediction of Age-Related Eye Disease Study Severity Scale for Age-Related Macular Degeneration from Color Fundus Photography. Ophthalmology 2018, 125, 1410–1420. [Google Scholar] [CrossRef] [PubMed] [Green Version]
  2. Glatz, M.; Riedl, R.; Glatz, W.; Schneider, M.; Wedrich, A.; Bolz, M.; Strauss, R.W. Blindness and visual impairment in Central Europe. PLoS ONE 2022, 17, e0261897. [Google Scholar] [CrossRef] [PubMed]
  3. Bourne, R.; Steinmetz, J.D.; Flaxman, S.; Briant, P.S.; Taylor, H.R.; Resnikoff, S.; Casson, R.J.; Abdoli, A.; Abu-Gharbieh, E.; Afshin, A.; et al. Trends in prevalence of blindness and distance and near vision impairment over 30 years: An analysis for the Global Burden of Disease Study. Lancet Glob. Health 2021, 9, e130–e143. [Google Scholar] [CrossRef] [PubMed]
  4. Keenan, T.D.; Cukras, C.A.; Chew, E.Y. Age-Related Macular Degeneration: Epidemiology and Clinical Aspects. Adv. Exp. Med. Biol. 2021, 1256, 1–31. [Google Scholar] [CrossRef] [PubMed]
  5. Adamis, A.P.; Brittain, C.J.; Dandekar, A.; Hopkins, J.J. Building on the success of anti-vascular endothelial growth factor therapy: A vision for the next decade. Eye 2020, 34, 1966–1972. [Google Scholar] [CrossRef] [PubMed]
  6. Garcia-Layana, A.; Cabrera-López, F.; García-Arumí, J.; Arias-Barquet, L.; Ruiz-Moreno, J.M. Early and intermediate age-related macular degeneration: Update and clinical review. Clin. Interv. Aging 2017, 12, 1579–1587. [Google Scholar] [CrossRef] [Green Version]
  7. Wang, H. A Bibliographic Study and Quantitative Analysis of Age-related Macular Degeneration and Fundus Images. Ann. Ophthalmol. Vis. Sci. 2022, 5, 1–8. [Google Scholar]
  8. Hagiwara, Y.; Koh, J.E.W.; Tan, J.H.; Bhandary, S.V.; Laude, A.; Ciaccio, E.J.; Tong, L.; Acharya, U.R. Computer-aided diagnosis of glaucoma using fundus images: A review. Comput. Methods Programs Biomed. 2018, 165, 1–12. [Google Scholar] [CrossRef]
  9. Wang, H.; Chong, K.K.L.; Li, Z. Applications of AI to Age-Related Macular Degeneration: A case study and a brief review. In Proceedings of the 2022 International Conference on Computer Engineering and Artificial Intelligence (ICCEAI), Shijiazhuang, China, 22–24 July 2022; IEEE: Piscataway, NJ, USA, 2022. [Google Scholar]
  10. Li, J.-P.O.; Liu, H.; Ting, D.S.J.; Jeon, S.; Chan, R.V.P.; Kim, J.E.; Sim, D.A.; Thomas, P.B.M.; Lin, H.; Chen, Y.; et al. Digital technology, tele-medicine and artificial intelligence in ophthalmology: A global perspective. Prog. Retin. Eye Res. 2021, 82, 100900. [Google Scholar] [CrossRef]
  11. Russakoff, D.B.; Lamin, A.; Oakley, J.D.; Dubis, A.M.; Sivaprasad, S. Deep Learning for Prediction of AMD Progression: A Pilot Study. Investig. Opthalmol. Vis. Sci. 2019, 60, 712–722. [Google Scholar] [CrossRef] [Green Version]
  12. Gutfleisch, M.; Ester, O.; Aydin, S.; Quassowski, M.; Spital, G.; Lommatzsch, A.; Rothaus, K.; Dubis, A.M.; Pauleikhoff, D. Clinically applicable deep learning-based decision aids for treatment of neovascular AMD. Graefe’s Arch. Clin. Exp. Ophthalmol. 2022, 260, 2217–2230. [Google Scholar] [CrossRef]
  13. Yan, Q.; Weeks, D.E.; Xin, H.; Swaroop, A.; Chew, E.Y.; Huang, H.; Ding, Y.; Chen, W. Deep-learning-based prediction of late age-related macular degeneration progression. Nat. Mach. Intell. 2020, 2, 141–150. [Google Scholar] [CrossRef] [PubMed]
  14. Serener, A.; Serte, S. Dry and wet age-related macular degeneration classification using oct images and deep learning. In Proceedings of the 2019 Scientific Meeting on Electrical-Electronics & Biomedical Engineering and Computer Science (EBBT), Istanbul, Turkey, 24–26 April 2019; IEEE: Piscataway, NJ, USA, 2019. [Google Scholar]
  15. Saha, S.; Nassisi, M.; Wang, M.; Lindenberg, S.; Kanagasingam, Y.; Sadda, S.; Hu, Z.J. Automated detection and classification of early AMD biomarkers using deep learning. Sci. Rep. 2019, 9, 10990. [Google Scholar] [CrossRef] [PubMed] [Green Version]
  16. Wang, H.; Li, Z.; Xing, L.; Chong, K.K.; Zhou, X.; Wang, F.; Zhou, J.; Li, Z. A Bibliographic Study of Macular Fovea Detection: AI-Based Methods, Applications, and Issues. In Proceedings of the World Conference on Intelligent and 3-D Technologies (WCI3DT 2022) Methods, Algorithms and Applications; Springer: Singapore, 2023. [Google Scholar]
  17. Wang, M.H.; Yu, X. A Bibliographic Study of “Liver-Eye” Related Research:A Correlation Function Analytic Research between Age-Related Macular Degeneration (AMD) and Traditional Chinese Medicine (TCM) Liver Wind Internal Movement Syndrome. Adv. Clin. Med. 2023, 13, 6342. [Google Scholar] [CrossRef]
  18. Ravi, V.; Narasimhan, H.; Chakraborty, C.; Pham, T.D. Deep learning-based meta-classifier approach for COVID-19 classification using CT scan and chest X-ray images. Multimed. Syst. 2022, 28, 1401–1415. [Google Scholar] [CrossRef]
  19. Holzinger, A.; Dehmer, M.; Emmert-Streib, F.; Cucchiara, R.; Augenstein, I.; Del Ser, J.; Samek, W.; Jurisica, I.; Díaz-Rodríguez, N. Information fusion as an integrative cross-cutting enabler to achieve robust, explainable, and trustworthy medical artificial intelligence. Inf. Fusion 2022, 79, 263–278. [Google Scholar] [CrossRef]
  20. Wang, H. A Survey of AI to AMD and Quantitative Analysis of AMD Pathology Based on Medical Images. Artif. Intell. Robot. Res. 2022, 11, 143–157. [Google Scholar]
  21. García-Floriano, A.; Ferreira-Santiago, Á.; Camacho-Nieto, O.; Yáñez-Márquez, C. A machine learning approach to medical image classification: Detecting age-related macular degeneration in fundus images. Comput. Electr. Eng. 2019, 75, 218–229. [Google Scholar] [CrossRef]
  22. Salehi, M.A.; Mohammadi, S.; Gouravani, M.; Rezagholi, F.; Arevalo, J.F. Retinal and choroidal changes in AMD: A systematic review and meta-analysis of spectral-domain optical coherence tomography studies. Surv. Ophthalmol. 2022, 68, 54–66. [Google Scholar] [CrossRef]
  23. Gualino, V.; Tadayoni, R.; Cohen, S.Y.; Erginay, A.; Fajnkuchen, F.; Haouchine, B.; Krivosic, V.; Quentel, G.; Vicaut, E.; Gaudric, A. Optical coherence tomography, fluorescein angiography, and diagnosis of choroidal neovascularization in age-related macular degeneration. Retina 2019, 39, 1664–1671. [Google Scholar] [CrossRef]
  24. Oh, K.; Kang, H.M.; Leem, D.; Lee, H.; Seo, K.Y.; Yoon, S. Early detection of diabetic retinopathy based on deep learning and ultra-wide-field fundus images. Sci. Rep. 2021, 11, 1897. [Google Scholar] [CrossRef]
  25. Yang, J.; Fong, S.; Wang, H.; Hu, Q.; Lin, C.; Huang, S.; Shi, J.; Lan, K.; Tang, R.; Wu, Y.; et al. Artificial intelligence in ophthalmopathy and ultra-wide field image: A survey. Expert Syst. Appl. 2021, 182, 115068. [Google Scholar] [CrossRef]
  26. Matsuba, S.; Tabuchi, H.; Ohsugi, H.; Enno, H.; Ishitobi, N.; Masumoto, H.; Kiuchi, Y. Accuracy of ultra-wide-field fundus ophthalmoscopy-assisted deep learning, a machine-learning technology, for detecting age-related macular degeneration. Int. Ophthalmol. 2019, 39, 1269–1275. [Google Scholar] [CrossRef] [PubMed] [Green Version]
  27. Chen, H.; Ji, Y. Adversarial Training for Improving Model Robustness? Look at Both Prediction and Interpretation. Proc. Conf. AAAI Artif. Intell. 2022, 36, 10463–10472. [Google Scholar] [CrossRef]
  28. Lim, J.S.; Hong, M.; Lam, W.S.; Zhang, Z.; Teo, Z.L.; Liu, Y.; Ng, W.Y.; Foo, L.L.; Ting, D.S. Novel technical and privacy-preserving technology for artificial intelligence in ophthalmology. Curr. Opin. Ophthalmol. 2022, 33, 174–187. [Google Scholar] [CrossRef]
  29. Ting, D.S.; Peng, L.; Varadarajan, A.V.; Keane, P.A.; Burlina, P.M.; Chiang, M.F.; Schmetterer, L.; Pasquale, L.R.; Bressler, N.M.; Webster, D.R.; et al. Deep learning in ophthalmology: The technical and clinical considerations. Prog. Retin. Eye Res. 2019, 72, 100759. [Google Scholar] [CrossRef]
  30. Karnowski, T.P.; Aykac, D.; Giancardo, L.; Li, Y.; Nichols, T.; Tobin, K.W.; Chaum, E. Automatic detection of retina disease: Robustness to image quality and localization of anatomy structure. In Proceedings of the 2011 Annual International Conference of the IEEE Engineering in Medicine and Biology Society, Boston, MA, USA, 30 August–3 September 2011; IEEE: Piscataway, NJ, USA, 2011. [Google Scholar]
  31. Kamran, S.A.; Tavakkoli, A.; Zuckerbrod, S.L. Improving robustness using joint attention network for detecting retinal degeneration from optical coherence tomography images. In Proceedings of the 2020 IEEE International Conference On Image Processing (ICIP), Anchorage, AK, USA, 19–22 September 2021; IEEE: Piscataway, NJ, USA, 2020. [Google Scholar]
  32. Hahn, T.; Pyeon, M.; Kim, G. Self-routing capsule networks. Adv. Neural Inf. Process. Syst. 2019, 32, 1–10. [Google Scholar]
  33. Liang, Y.; Li, B.; Jiao, B. A deep learning method for motor fault diagnosis based on a capsule network with gate-structure dilated convolutions. Neural Comput. Appl. 2021, 33, 1401–1418. [Google Scholar] [CrossRef]
  34. Tjoa, E.; Guan, C. A Survey on Explainable Artificial Intelligence (XAI): Toward Medical XAI. IEEE Trans. Neural Netw. Learn. Syst. 2020, 32, 4793–4813. [Google Scholar] [CrossRef]
  35. Hagras, H. Toward Human-Understandable, Explainable AI. Computer 2018, 51, 28–36. [Google Scholar] [CrossRef]
  36. Adadi, A.; Berrada, M. Peeking Inside the Black-Box: A Survey on Explainable Artificial Intelligence (XAI). IEEE Access 2018, 6, 52138–52160. [Google Scholar] [CrossRef]
  37. Mooney, P. Retinal OCT Images (Optical Coherence Tomography); Kaggle: San Francisco, CA, USA, 2018. [Google Scholar]
  38. Naren, O.S. Retinal OCT—C8; Kaggle: San Francisco, CA, USA, 2021. [Google Scholar]
  39. K-S-Sanjay-Nithish. Retinal Fundus Images; Kaggle: San Francisco, CA, USA, 2021. [Google Scholar]
  40. Larxel. Retinal Disease Classification; Kaggle: San Francisco, CA, USA, 2021. [Google Scholar]
  41. Larxel. Ocular Disease Recognition; Kaggle: San Francisco, CA, USA, 2020. [Google Scholar]
  42. Yi, X.; Walia, E.; Babyn, P. Generative adversarial network in medical imaging: A review. Med Image Anal. 2019, 58, 101552. [Google Scholar] [CrossRef] [PubMed] [Green Version]
  43. Yoo, T.K.; Choi, J.Y.; Kim, H.K. A generative adversarial network approach to predicting postoperative appearance after orbital decompression surgery for thyroid eye disease. Comput. Biol. Med. 2020, 118, 103628. [Google Scholar] [CrossRef] [PubMed]
  44. Kadry, S.; Rajinikanth, V.; Crespo, R.G.; Verdú, E. Automated detection of age-related macular degeneration using a pre-trained deep-learning scheme. J. Supercomput. 2022, 78, 7321–7340. [Google Scholar] [CrossRef]
  45. Ye, L.-Y.; Miao, X.-Y.; Cai, W.-S.; Xu, W.-J. Medical image diagnosis of prostate tumor based on PSP-Net+VGG16 deep learning network. Comput. Methods Programs Biomed. 2022, 221, 106770. [Google Scholar] [CrossRef]
  46. Bae, W.; Noh, J.; Kim, G. Rethinking class activation mapping for weakly supervised object localization. In Computer Vision–ECCV 2020: 16th European Conference, Glasgow, UK, August 23–28 2020, Proceedings, Part XV 16; Springer: Berlin, Germany, 2020. [Google Scholar]
  47. Selvaraju, R.R.; Cogswell, M.; Das, A.; Vedantam, R.; Parikh, D.; Batra, D. Grad-cam: Visual explanations from deep networks via gradient-based localization. In Proceedings of the IEEE International Conference on Computer Vision, Venice, Italy, 22–29 October 2017. [Google Scholar]
  48. Chattopadhay, A.; Sarkar, A.; Howlader, P.; Balasubramanian, V.N. Grad-cam++: Generalized gradient-based visual explanations for deep convolutional networks. In Proceedings of the 2018 IEEE Winter Conference on Applications of Computer Vision (WACV), Lake Tahoe, NV, USA, 12–15 March 2018; IEEE: Piscataway, NJ, USA, 2018; pp. 839–847. [Google Scholar]
  49. Jiang, P.-T.; Zhang, C.-B.; Hou, Q.; Cheng, M.-M.; Wei, Y. LayerCAM: Exploring Hierarchical Class Activation Maps for Localization. IEEE Trans. Image Process. 2021, 30, 5875–5888. [Google Scholar] [CrossRef]
  50. Mohseni, S.; Zarei, N.; Ragan, E.D. A Multidisciplinary Survey and Framework for Design and Evaluation of Explainable AI Systems. ACM Trans. Interact. Intell. Syst. 2021, 11, 24. [Google Scholar] [CrossRef]
  51. Mao, X.; Shen, C.; Yang, Y.B. Image restoration using very deep convolutional encoder-decoder networks with symmetric skip connections. Adv. Neural Inf. Process. Syst. 2016, 29. [Google Scholar] [CrossRef]
  52. Zhou, Z.; Siddiquee MM, R.; Tajbakhsh, N.; Liang, J. Unet++: Redesigning skip connections to exploit multiscale features in image segmentation. IEEE Trans. Med. Imaging 2019, 39, 1856–1867. [Google Scholar] [CrossRef] [Green Version]
  53. Guo, M.-H.; Xu, T.-X.; Liu, J.-J.; Liu, Z.-N.; Jiang, P.-T.; Mu, T.-J.; Zhang, S.-H.; Martin, R.R.; Cheng, M.-M.; Hu, S.-M. Attention mechanisms in computer vision: A survey. Comput. Vis. Media 2022, 8, 331–368. [Google Scholar] [CrossRef]
  54. Yan, Y.; Jin, K.; Gao, Z.; Huang, X.; Wang, F.; Wang, Y.; Ye, J. Attention-based deep learning system for automated diagnoses of age-related macular degeneration in optical coherence tomography images. Med. Phys. 2021, 48, 4926–4934. [Google Scholar] [CrossRef]
  55. Gour, N.; Khanna, P. Multi-class multi-label ophthalmological disease detection using transfer learning based convolutional neural network. Biomed. Signal Process. Control 2021, 66, 102329. [Google Scholar] [CrossRef]
  56. Zhuang, F.; Qi, Z.; Duan, K.; Xi, D.; Zhu, Y.; Zhu, H.; Xiong, H.; He, Q. A Comprehensive Survey on Transfer Learning. Proc. IEEE 2020, 109, 43–76. [Google Scholar] [CrossRef]
  57. Brendel, W.; Rauber, J.; Kümmerer, M.; Ustyuzhaninov, I.; Bethge, M. Accurate, reliable and fast robustness evaluation. Adv. Neural Inf. Process. Syst. 2019, 32. [Google Scholar] [CrossRef]
  58. Qin, C.; Martens, J.; Gowal, S.; Krishnan, D.; Dvijotham, K.; Fawzi, A.; De, S.; Stanforth, R.; Kohli, P. Adversarial robustness through local linearization. Adv. Neural Inf. Process. Syst. 2019, 32. [Google Scholar] [CrossRef]
  59. Li, Z.; Caro, J.O.; Rusak, E.; Brendel, W.; Bethge, M.; Anselmi, F.; Patel, A.B.; Tolias, A.S.; Pitkow, X. Robust deep learning object recognition models rely on low frequency information in natural images. PLoS Comput. Biol. 2023, 19, e1010932. [Google Scholar] [CrossRef]
  60. Saarela, M.; Geogieva, L. Robustness, Stability, and Fidelity of Explanations for a Deep Skin Cancer Classification Model. Appl. Sci. 2022, 12, 9545. [Google Scholar] [CrossRef]
  61. Al-Essa, M.; Andresini, G.; Appice, A.; Malerba, D. XAI to Explore Robustness of Features in Adversarial Training for Cybersecurity. In Foundations of Intelligent Systems: 26th International Symposium, ISMIS 2022, Cosenza, Italy, 3–5 October 2022, Proceedings; Springer: Berlin/Heidelberg, Germany, 2022. [Google Scholar]
  62. Bradshaw, T.J.; McCradden, M.D.; Jha, A.K.; Dutta, J.; Saboury, B.; Siegel, E.L.; Rahmim, A. Artificial Intelligence Algorithms Need to Be Explainable—Or Do They? J. Nucl. Med. 2023, 64, 976–977. [Google Scholar] [CrossRef] [PubMed]
Figure 1. The XAI performed visualization of OCT and segmented the OCT database. Note: (A-1) represents a case of XAI-based OCT that is correct and interpretable, while (A-2) is an interpretable and correct OCT case. Both (B-1) and (B-2) are cases where the interpretability of segmented OCT is consistent with the ground truth. The significant pixels for prediction are highlighted by red circles.
Electronics 12 02697 g001
Figure 2. The XAI cases of fundus images of FAF, regular CFP, and UWF. Note: The original images of FAF cases are depicted in (A-0,B-0,C-0). Subsequently, (A-1,B-1,C-1) correspond to correctly interpretable cases of FAF, regular CFP, and UWF, while (A-2,B-2,C-2) are cases where prototypes are not interpretable for FAF, regular CFP, and UWF.
Electronics 12 02697 g002
Figure 3. The architecture of the VGG16 model.
Electronics 12 02697 g003
Figure 4. Grad-CAM output of OCT, ROI-extracted UWF, FAF and regular CFP for DL model. Note: Figures (AD) exhibit the Grad-CAM outputs for OCT, ROI-extracted UWF, FAF and regular CFP images, respectively. The highlighted layer in red displayed on the top of these subfigures corresponds to XAI metrics that are deemed accurate.
Electronics 12 02697 g004
Figure 5. Layer-CAM output of the specific image of UWF for VGG16 DL model. Note: The highlighted layer in red displayed on the top of these subfigures corresponds to XAI metrics that are deemed accurate.
Electronics 12 02697 g005
Figure 6. Descriptive analysis of  A ^ ( i , j ) k for the specific image. Note: the red line is the layer with wrong prototypes, the green circle is the layer with the greatest number of right prototypes, and orange cuboids are blocks in the network.
Electronics 12 02697 g006
Figure 7. Model optimization based on skip and attention mechanisms based on OCT and regular CFP images. Note: Subfigure (A,B) represents the optimized model architecture for OCT and regular CFP images respectively.
Electronics 12 02697 g007
Table 1. XAI analysis for layers 4, 8, 12, and 16 of VGG16. Note: The bold numbers are higher than the cutoff of 0.6, which represents this layer is interpretable.
Image TypeLayers
481216/Output
OCT0.240.380.640.58
Segmented OCT10.90.941
FAF0.780.690.540.57
Regular CFP0.650.770.410.36
ROI-extracted UWF0.860.760.840.89
Table 2. Comparison between VGG16 and improved VGG16 model.
MethodsData TypeLossAccuracy for the Training and Validation DatasetAccuracy for the Unseen Testing DatasetSensitivitySpecificityAUCXAI IndicatorTest Time/Second (Per Image)
Original VGG16OCT0.024100%82%74%60%88.11%0.50.084
Segmented OCT0.015100%90%89%91%91.01%10.112
FAF0.044100%97%94%95%90.72%0.50.117
Regular CFP0.21799.58%57%61%46%80.88%0.30.067
ROI-extracted UWF0.009100%81%83%79%86.994%0.90.099
Average values for all data types0.024100%82%80%74%90.772%0.640.084
Improved VGG16OCT0.012100%90.6%91%89.1%91.4%0.640.07
End-cut-OCT0.00298.9%94.6%96%96%94.14%0.60.45
Segmented OCT0.001100.0%99.0%100%99%99.75%10.06
Regular CFP0.01198.7%93.7%91%96%96.10%0.80.21
ROI-extracted UWF0.00799.7%91.2%94%96%84.25%0.90.15
FAF with transfer0.001100.0%99.2%100%99%98.62%0.90.12
FAF without transfer0.011100.0%100%100%100%94.62%0.840.12
Average values for all data types0.55%99.55%96.62%96%96%94.58%84.00%18.50%
Disclaimer/Publisher’s Note: The statements, opinions and data contained in all publications are solely those of the individual author(s) and contributor(s) and not of MDPI and/or the editor(s). MDPI and/or the editor(s) disclaim responsibility for any injury to people or property resulting from any ideas, methods, instructions or products referred to in the content.

