Article

An Advanced Non-Interrupted Internal Calibration Model Based on Azimuth Modulation and Waveform Diversity for SAR Systems

Aviation Key Laboratory of Science and Technology on High Performance Electromagnetic Windows, AVIC Research Institute for Special Structures of Aeronautical Composite, Ji’nan 250023, China
*
Author to whom correspondence should be addressed.
Electronics 2023, 12(12), 2677; https://doi.org/10.3390/electronics12122677
Submission received: 18 May 2023 / Revised: 4 June 2023 / Accepted: 7 June 2023 / Published: 15 June 2023

Abstract

:
Internal calibration, designed for obtaining the gain and phase errors introduced by the fluctuations of the electronic instruments, is an essential operation to guarantee the imaging performance of modern synthetic aperture radar (SAR) systems. However, in most of the current internal calibration schemes, the internal calibration processes interrupt the normal SAR data acquisition, which results in a loss of azimuth samples and degradation of the SAR image quality. To this end, an advanced non-interrupted internal calibration model is proposed, performing the internal calibration during nominal data acquisitions. The calibration signals and echoes are orthogonal and are received simultaneously. Then, they can be separated by postprocessing via the waveform diversity concept. Two schemes based on the proposed model are demonstrated via theoretical analysis and simulation experiments. The proposed model can achieve a considerable signal-to-noise ratio (SNR) and reduce the influence of calibration signals on echoes, which have some potential applications for future SAR missions.

1. Introduction

Synthetic aperture radar (SAR), which can remotely map the reflectivity of objects or environments with high spatial resolution, is an important tool for remote sensing observation [1]. The calibration plays an important role in SAR systems since high-quality SAR images can be obtained after calibration, and hence they can be used for extensive remote sensing applications with high accuracy. An overview of SAR calibration has been concluded in [2]. In general, calibration techniques can be divided into external calibration and internal calibration [3,4,5]. External calibration, which is carried out utilizing distributed targets with homogeneous scattering characteristics, corner reflectors, or stable targets identified in the scene, can provide radiometric, polarimetric, and geometric calibration of SAR systems [6,7]. Internal calibration is the process of characterizing the radar system performance using calibration signals injected into the radar data system by built-in devices, which can track gain and phase fluctuations of SAR electronic instruments during data acquisition [5,8].
Numerous internal calibration methods have been studied in the last few decades [4,5,6,9,10,11,12,13,14]. The ENVISAT ASAR system employs a complex calibration network for internal calibration through a series of different calibration pulses [15]. An individual transmit/receive modules internal calibration technique based on phase encoding, named pseudonoise gating, was proposed for TerraSAR-X [4,16], and it has been further studied in [17]. The transmit power times receiver gain product is derived by internal calibration in Sentinel-1, which is complex and allows correction of both amplitude and phase errors in the image data [3,12]. For polarimetric SAR systems, Shuo Wang et al. proposed a method of polarization internal calibration in [6]. In addition, a novel wireless internal calibration method with auxiliary antenna is presented in [11], which can cover the whole SAR instrument. Nowadays, the increasing complexity of multi-channel SAR system and the real-time on-board error correction requirement pose new challenges for calibration. Marwan Younis et al. proposed an internal calibration strategy based on a single tone signal injected into the receiving path for future digital beamforming SAR instruments [18].
In most internal calibration schemes, the normal SAR operation is interrupted to perform a calibration process, which causes missing samples in the azimuth direction and hence degrades the SAR performance. To solve this problem, a novel internal calibration scheme that does not interrupt SAR data acquisition is proposed for SAR systems [19], which will be beneficial for future SAR missions with very extensive data acquisition. The introduced technique in [19] uses coded signals to retrieve a calibration signal continuously injected into the receive path during the echo receiving process. Then, a high gain can be obtained after range compression and azimuth integration. A real-time internal calibration method for receiving channels of radar systems using phased array antennas with real-time digital beam-forming is proposed in [20]. The calibration signal is a binary phase-shift keying signal that is amplitude modulated by an on-off keying code sequence, and simulation results show it can satisfy the real-time requirement with an insignificant effect on receiving quality. In addition, a pseudo-orthogonal calibration signal model is also proposed in [21] to reduce the power level of the noise gain.
In this paper, the non-interrupted calibration scheme is further researched. An advanced non-interrupted internal calibration model based on azimuth modulation and waveform diversity is proposed in this paper. In the proposed model, the calibration signals and echoes are orthogonal and are received simultaneously, and they can be separated in the postprocessing via waveform diversity technique. The non-interrupted scheme in [19] can be regarded as a special case of the proposed model. Two new schemes based on the proposed model are demonstrated, which can achieve a considerate signal-to-noise ratio (SNR) of calibration signal by reducing the influence on SAR image quality compared with the scheme proposed in [19]. Through precise design of the timing diagram, the calibration signal can be retrieved via a waveform diversity technique. The theoretical analysis is given in the paper, followed by the simulation experiment. In addition, the raw data acquired from Sentinel-1 mission are used to demonstrate the effectiveness of the proposed schemes. The proposed two schemes can achieve a considerable SNR and reduce the influence of calibration signals on echoes, which have some potential applications for future SAR missions.
This paper is organized as follows. The principle of internal calibration is introduced in Section 2. Then, the proposed non-interrupted internal calibration model is described in detail in Section 3. Two new internal calibration schemes are also demonstrated. In Section 4, the simulation experiments are performed to verify the effectiveness of the proposed scheme. The comparison of the proposed schemes and the traditional scheme is discussed in Section 5. Finally, Section 6 concludes the paper.

2. Principle of Internal Calibration

In this section, the principle of internal calibration is described in detail. A non-interrupted internal calibration scheme proposed in [19] is also briefly introduced.

2.1. Transfer Function Derivation for Internal Calibration

The SAR instrument requires measurement stability. However, considering the reality conditions and aging effect, the SAR instrument cannot provide sufficient stability. Therefore, the internal calibration system is implemented to measure the actual instrument gain and phase changes during data acquisition [12].
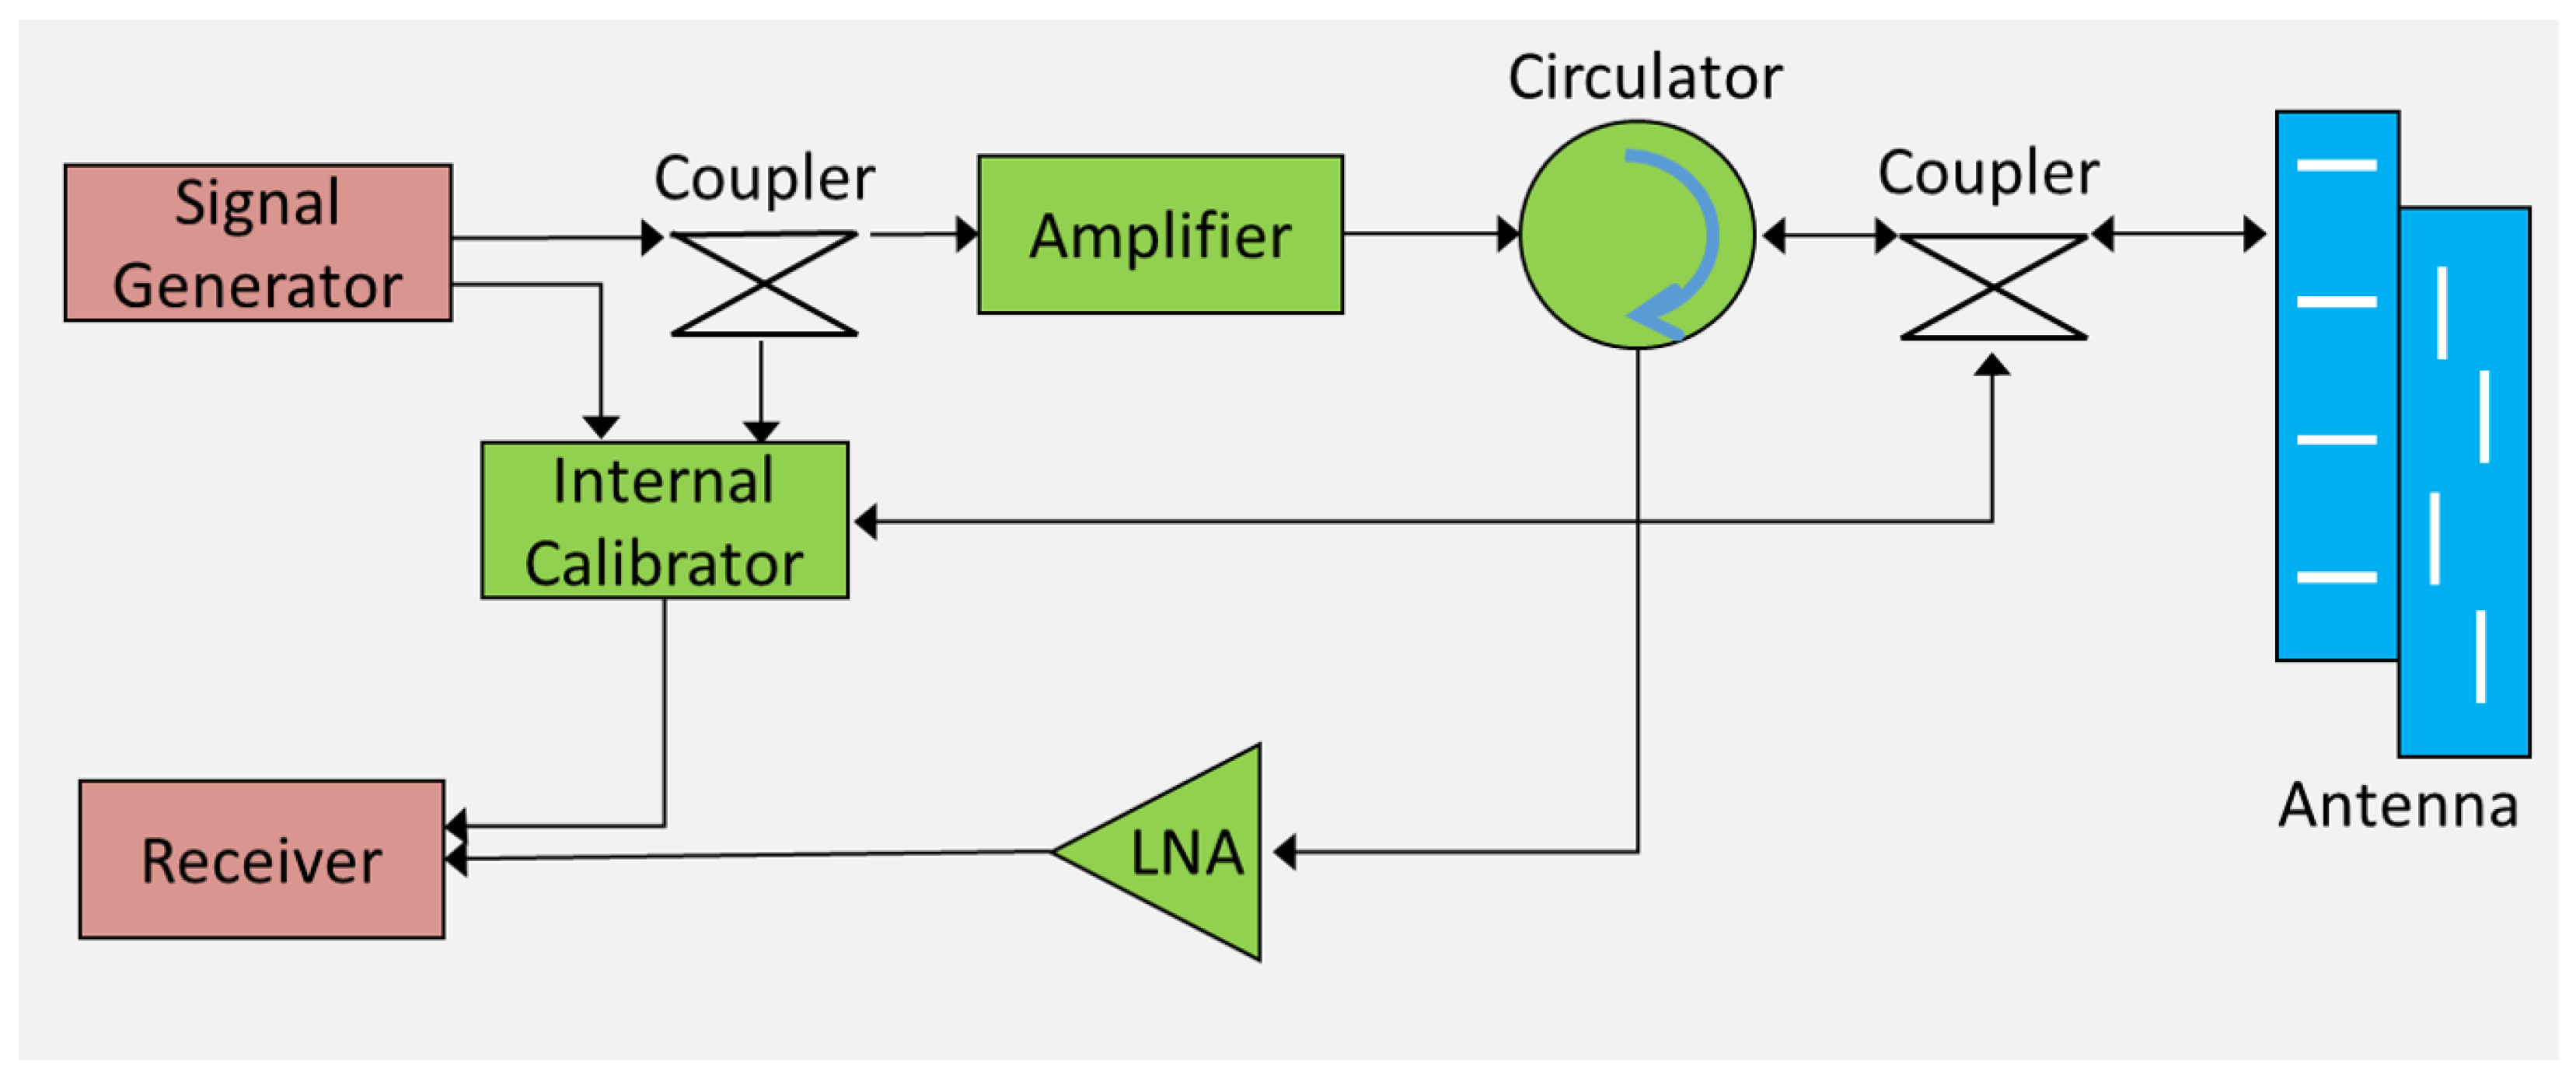
A basic principle of the internal calibration method is that the calibration signals shall experience the same changes as the measurement signals. A typical SAR system with internal calibration can be seen in Figure 1. The chirp signal generated by the signal generator can be written as
s 0 ( t ) = A 0 · exp j 2 π f 0 t + j π K r t 2 ,
where A 0 is the amplitude, f 0 is the carrier frequency, t is the time, and K r is the chirp rate. The instrument transfer function H, which describes the influence of the measured instrument, can be derived as [22]
H ( f ) = F h ( t ) ,
where F denotes the Fourier transform and h ( t ) is the response function of the instrument. The transfer function (TH) of the signal generator can be given by
H 0 = F s 0 ( t ) .
The internal calibration path can be divided into three types: T X path, R X path, and C E path [22]. The T X routing passes through a signal generator, amplifier, circulator, internal calibrator, and receiver; the R X routing passes through a signal generator, internal calibrator, circulator, low-noise amplifier (LNA), and receiver; the C E routing passes through a signal generator, internal calibrator, and receiver. Consequently, in the internal calibration system, the TH of the three calibration paths can be written as
H T X = H 0 · H A · H C P · H I N · H R
H R X = H 0 · H I N · H C P · H L N A · H R
H C E = H 0 · H I N · H R
where H T X , H R X , and H C E denote the TH of the T X path, the R X path, and the C E path, respectively. H A , H C P , H I N , H L N A and H R represent the TH of the amplifier, coupler, internal calibrator, LNA, and receiver, respectively. The TH of the calibration replica can be built by combining the three calibration path signals, as follows
H c a l = H T X · H R X H C E = H 0 · H A · H L N A · H R · H C P 2 · H I N .
The calibration replica H c a l covers all part of the radar path except passive radiating antenna elements. Additionally, the influence of the internal calibrator and coupler does not cancel out. Therefore, the stable behavior or precise characteristic is required for the internal calibrator and coupler. In general, the SAR imaging is interrupted during internal calibration to prevent interference between the internal calibration signals and the SAR data acquisition.

2.2. Non-Interrupted Internal Calibration Scheme [19]

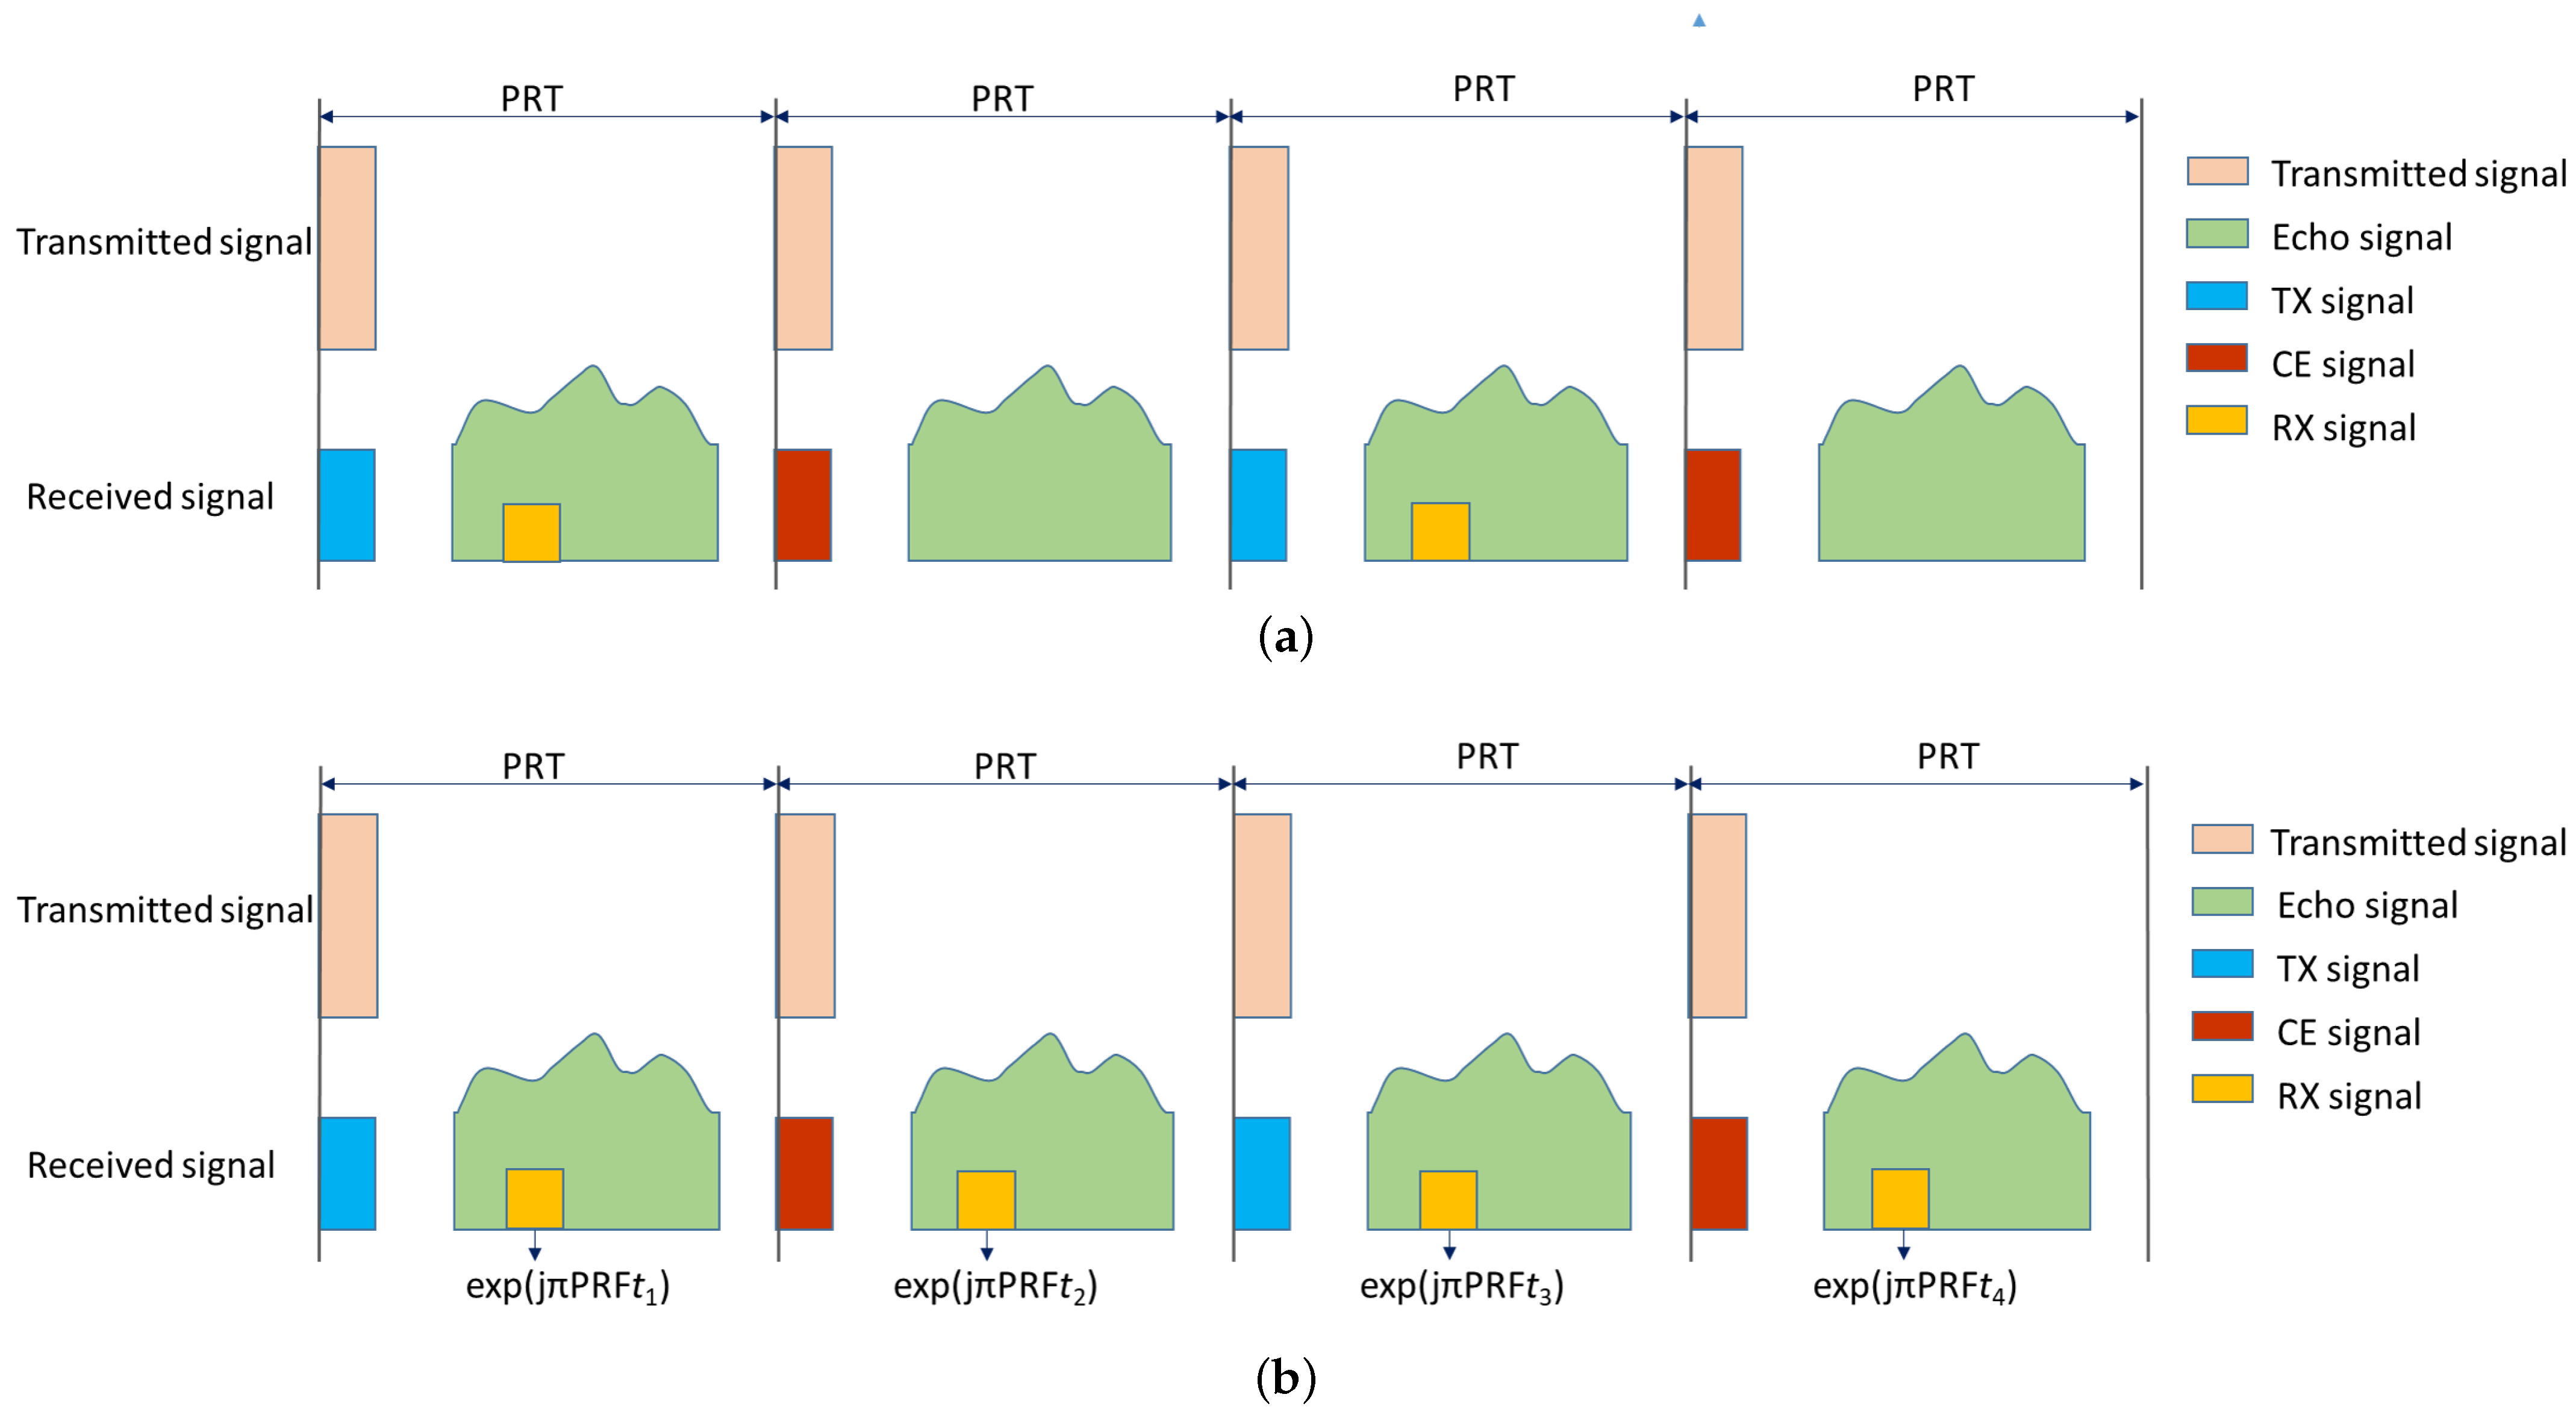
In order to avoid interruption of SAR data acquisition, some new ideas have been proposed. In [19], a new internal calibration scheme is proposed for the SAR system, which does not require interrupting SAR data acquisition. The transmitted signal is generated by the signal generator and routed though the nominal transmit path. Meanwhile, a small portion of the signal is coupled to the T X path [19]. Similarity, a small portion of the transmitted signal during the transmit event can also be coupled to the C E path. The new internal calibration method can be seen in Figure 2. At one pulse repetition interval (PRT), the system can transmit radar signal and receive the T X signal simultaneously. At the next PRT, the system can transmit radar signal and receive the C E signal simultaneously. As stated in [19], in the new internal synchronization scheme, the SAR system should have the ability to receive and transmit signals simultaneously.
In order to send an R X signal without interrupting the normal SAR data acquisition, the method of injecting a low-power calibration signal during the echo receive windows is proposed in [19]. The R X signal and echoes are received by the receiver simultaneously. In order to enable the retrieval of the R X signal and minimize the influence on the SAR echoes, three coded signals are investigated in [19]. Due to the compression gain that can be achieved by the calibration signal, the signal power can be very low, causing only minor disturbances in the actual SAR image. The gain in the R X signal after range compression can be expressed as [19]
G r g = B r · T r ,
where B r is the signal bandwidth and T r is the signal width. The gain of R X signal after azimuth integration can be written as
G a z = P R F · T a ,
where T a is the azimuth integration interval. It should be noted that Equation (9) assumes the SAR instrument to be stable within the T a duration. Therefore, the total gain of the R X signal can be represented as
G t o t a l = G r g · G a z .

3. Proposed Internal Calibration Model and Schemes

In this section, the proposed advanced non-interrupted internal calibration model is introduced in detail. Two new internal calibration schemes based on the proposed model, which can improve the SNR of the R X signal and reduce the influence of the R X signal on focused SAR image, are demonstrated, including the design of the timing diagram, the SNR analysis, and the processing step.

3.1. Non-Interrupted Internal Calibration Model

In the conventional calibration scheme, the calibration signals generated by the signal generator are the same as the transmitted signals and are injected into the calibration loop. However, in the proposed advanced non-interrupted internal calibration model, the calibration signals are modulated by a complex term along azimuth time. The calibration signal can be expressed as
s p ( t ) = s 0 ( t ) A ( t ) ,
where A ( t ) is the azimuth modulation term. It should be noted that in the new model, the calibration signals are orthogonal to the transmitted signals; therefore, they can be separated via postprocessing. A ( t ) can be expressed as different forms corresponding to different internal calibration schemes. For example, if A ( t ) 1 , the corresponding scheme is the conventional scheme, where the calibration signals are the same as the transmitted signals. However, if A ( t ) is expressed as different forms, some new internal calibration schemes can be derived. Here, two forms of A ( t ) are demonstrated (as shown in Table 1), corresponding to the first internal calibration scheme and second internal calibration scheme discussed in the next subsections. It is noted that the azimuth modulation is similar to the azimuth phase coding technique [23,24,25]. The difference is that only the phase is modulated along azimuth time in the azimuth phase coding technique. However, in the proposed model, the amplitude and phase all can be modulated.

3.2. First Internal Calibration Scheme

3.2.1. Timing Diagram

In the first internal calibration scheme, A ( t ) can be seen in Table 1 and can be expressed as follows
A ( t ) = 1 , t = 2 n · P R T 0 , t = ( 2 n + 1 ) · P R T
The R X signal is injected to the receiving path. However, the PRF of the R X signal is half of the PRF of echoes. As Figure 3a shows, at one PRT, the echoes and R X signal are received simultaneously. At the next PRT, only echoes are received.
The azimuth power spectrum has the shape of the two-way azimuth power pattern of the antenna, which can be written as [26]
p a ( f ) = sinc 2 0.886 f Δ f D o p ,
where sinc denotes the sinc function, which is defined by sinc ( x ) = sin x / x ; f is the Doppler frequency; and Δ f D o p is the Doppler bandwidth, which is given by
Δ f D o p 2 V θ b w λ ,
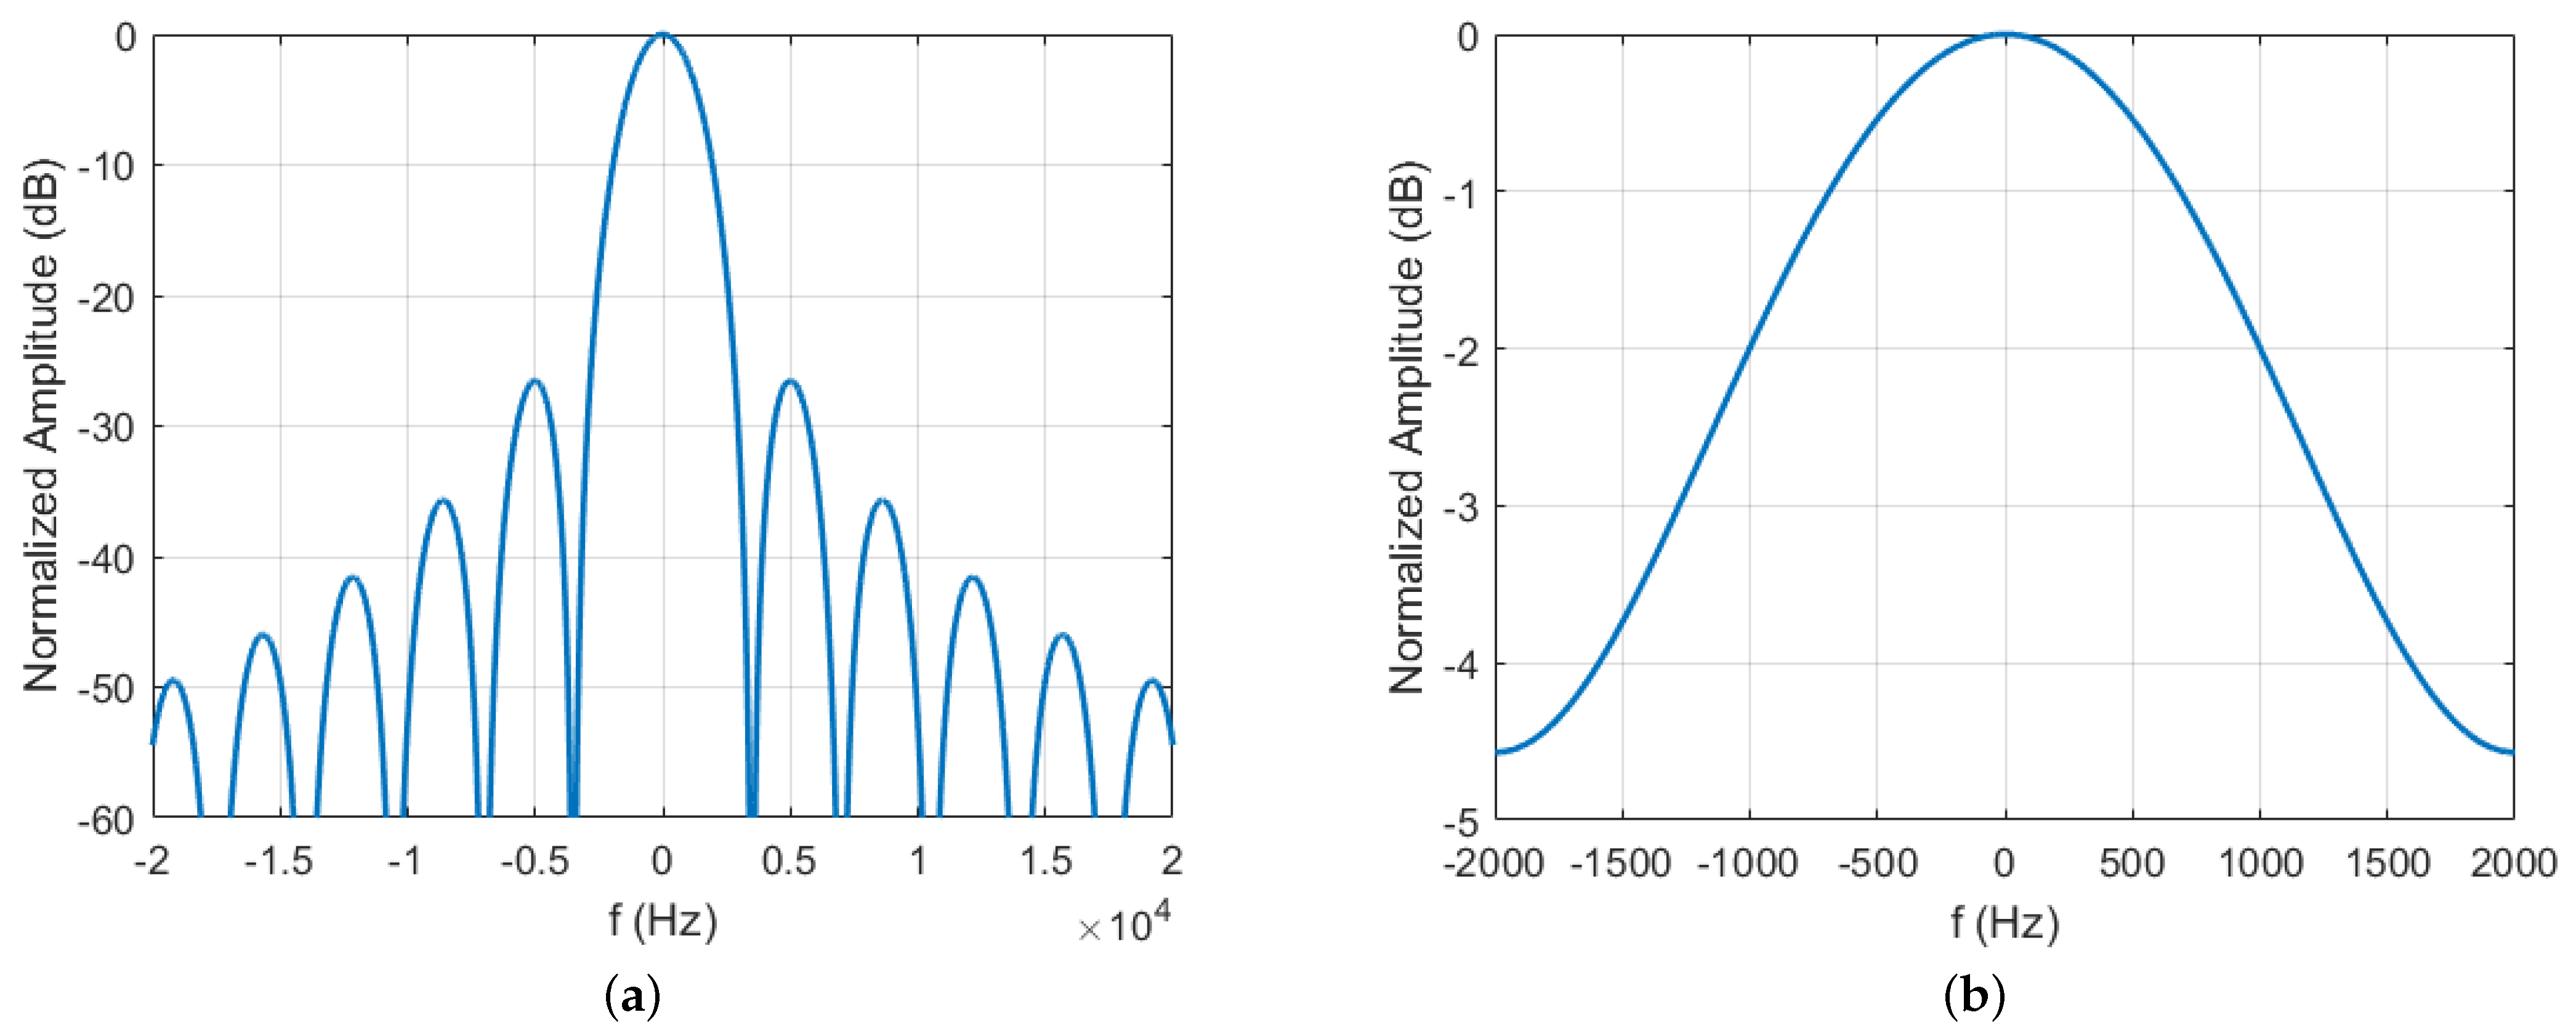
where V is the velocity and θ b w = 0.886 λ L a is the azimuth beamwidth, where λ is the wavelength of carrier frequency, and L a is the antenna length along the azimuth direction. Equation (14) denotes that the 3 dB width of the one-way azimuth power pattern is regarded as Doppler bandwidth [26]. However, in reality, the Doppler frequency is not band limited. The aliasing phenomenon will happen for frequencies larger than + P R F / 2 or smaller than P R F / 2 . The Figure 4a is the spectral density Δ f D o p without aliasing, while the Figure 4b is the spectral density Δ f D o p with aliasing (suppose the oversampling rate is 1.29, i.e., P R F = 1.29 · Δ f D o p ; the detailed analysis can be seen in Section 4).
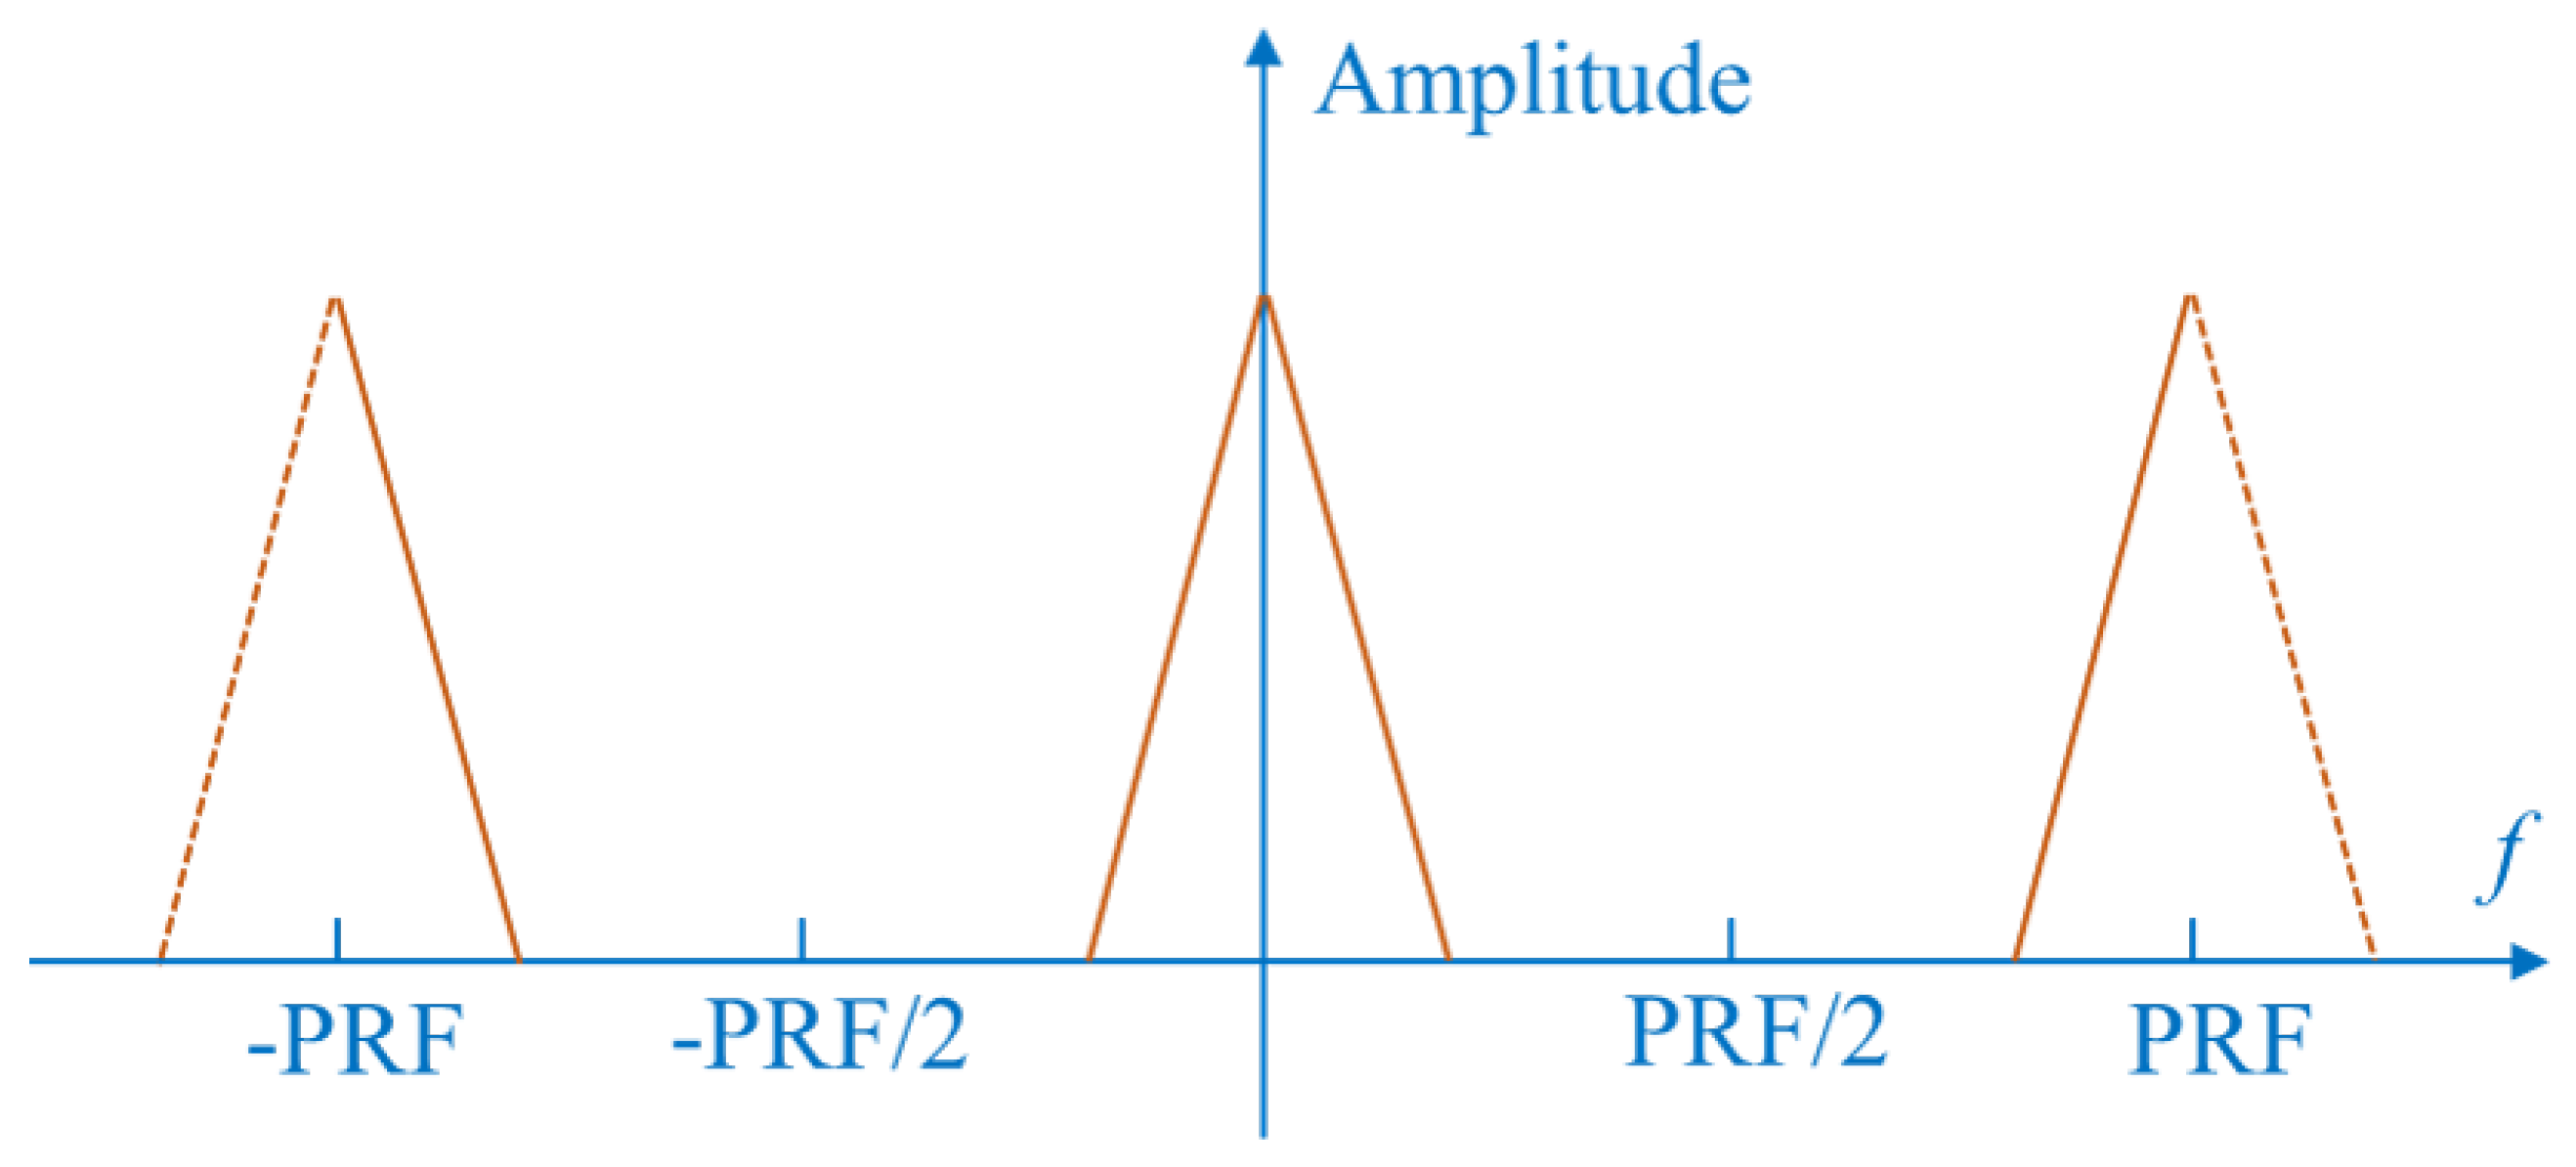
For the R X signal, the sampling frequency is P R F / 2 . According to the upsampling theory (which can be seen in Appendix A), the spectral density of R X signal is periodic and the period is 2. The change in the R X signal is slow, corresponding to a low-frequency domain. Therefore, in the frequency domain, one peak of the R X signal is around zero frequency, while the other peak is around ± P R F / 2 , which can be seen in Figure 5.

3.2.2. SNR Analysis and Processing Step

Compared with the scheme proposed in [19], the proposed scheme reduces the amount data of the R X signal in the received signal. In the following analysis, we demonstrate that in the proposed scheme, the R X signal has a considerable SNR compared with the scheme in [19], while the proposed scheme reduces the amount data of the R X signal in the received signal, which can reduce the influence of R X signal on echoes.
Suppose the average power of R X signal in each samples is P R X . After range compression, the power of R X signal in peak position is P R X · G r g . If there are N a azimuth samples, the gain of R X signal after azimuth integration can be given by G a z = P R F · T a = N a . Hence, in the scheme proposed in [19], the R X power P t o t , t r a after azimuth integration can be expressed as
P t o t , t r a = P R X · G r g · N a .
Suppose the noise power (including echo power and thermal noise power) for R X signal is P n o i ( f ) at frequency f. The SNR of the R X signal can be written as
P SNR , t r a = P t o t , t r a P n o i ( f l o w ) ,
where f l o w denotes the low frequency. In the proposed scheme, the total R X power P t o t , p r o 1 after azimuth integration can be expressed as
P t o t , p r o 1 = P R X · G r g · N a / 2 .
Since there are two peaks in the Doppler frequency domain, a high pass filter is used to achieve the peaks in the high frequency. Therefore, after filtering, the total R X power is given by
P t o t , f l t , p r o 1 = P t o t , p r o 1 / 2 = P R X · G r g · N a / 4 .
The SNR of the R X signal in the proposed scheme can be written as
P SNR , p r o 1 = P t o t , f l t , p r o 1 P n o i ( f h i g h ) ,
where f h i g h denotes the high frequency.
Therefore, the ratio of SNR between the proposed scheme and the scheme in [19] can be expressed as
γ 1 = P SNR , p r o 1 P SNR , t r a = P n o i ( f l o w ) 4 P n o i ( f h i g h ) .
Under no aliasing condition of a two-way antenna pattern, the power of the antenna in the high frequency around ± P R F / 2 is less than −6 dB. However, considering the aliasing effect, the power of the antenna in the high frequency around ± P R F / 2 may be larger than −6 dB. As shown in Figure 4b, the power of the antenna in the high frequency around ± P R F / 2 is about −4.4 dB. Therefore, in the proposed internal calibration scheme, the SNR is less than −1.6 dB compared with the scheme in [19]. Nevertheless, in the processing of the echoes, a low pass filter with the bandwidth Δ f D o p is used to filter out the half of the power of R X power at high frequency. Hence, the total R X power after processing is one-quarter of the power in [19], which means that the influence of R X signal on echoes is reduced.
The processing step of the first internal calibration scheme is shown in Figure 6a, which can be summarized as follows:
step1: 
Range compression for R X signal.
step2: 
After azimuth fast Fourier transform (FFT), the R X signal is extracted by a high pass filter.
step3: 
Azimuth inverse FFT (IFFT) is carried out, then the R X signal is obtained via azimuth coherent integration every T a duration.
step4: 
Obtain the compensation term and compensate for the echoes.
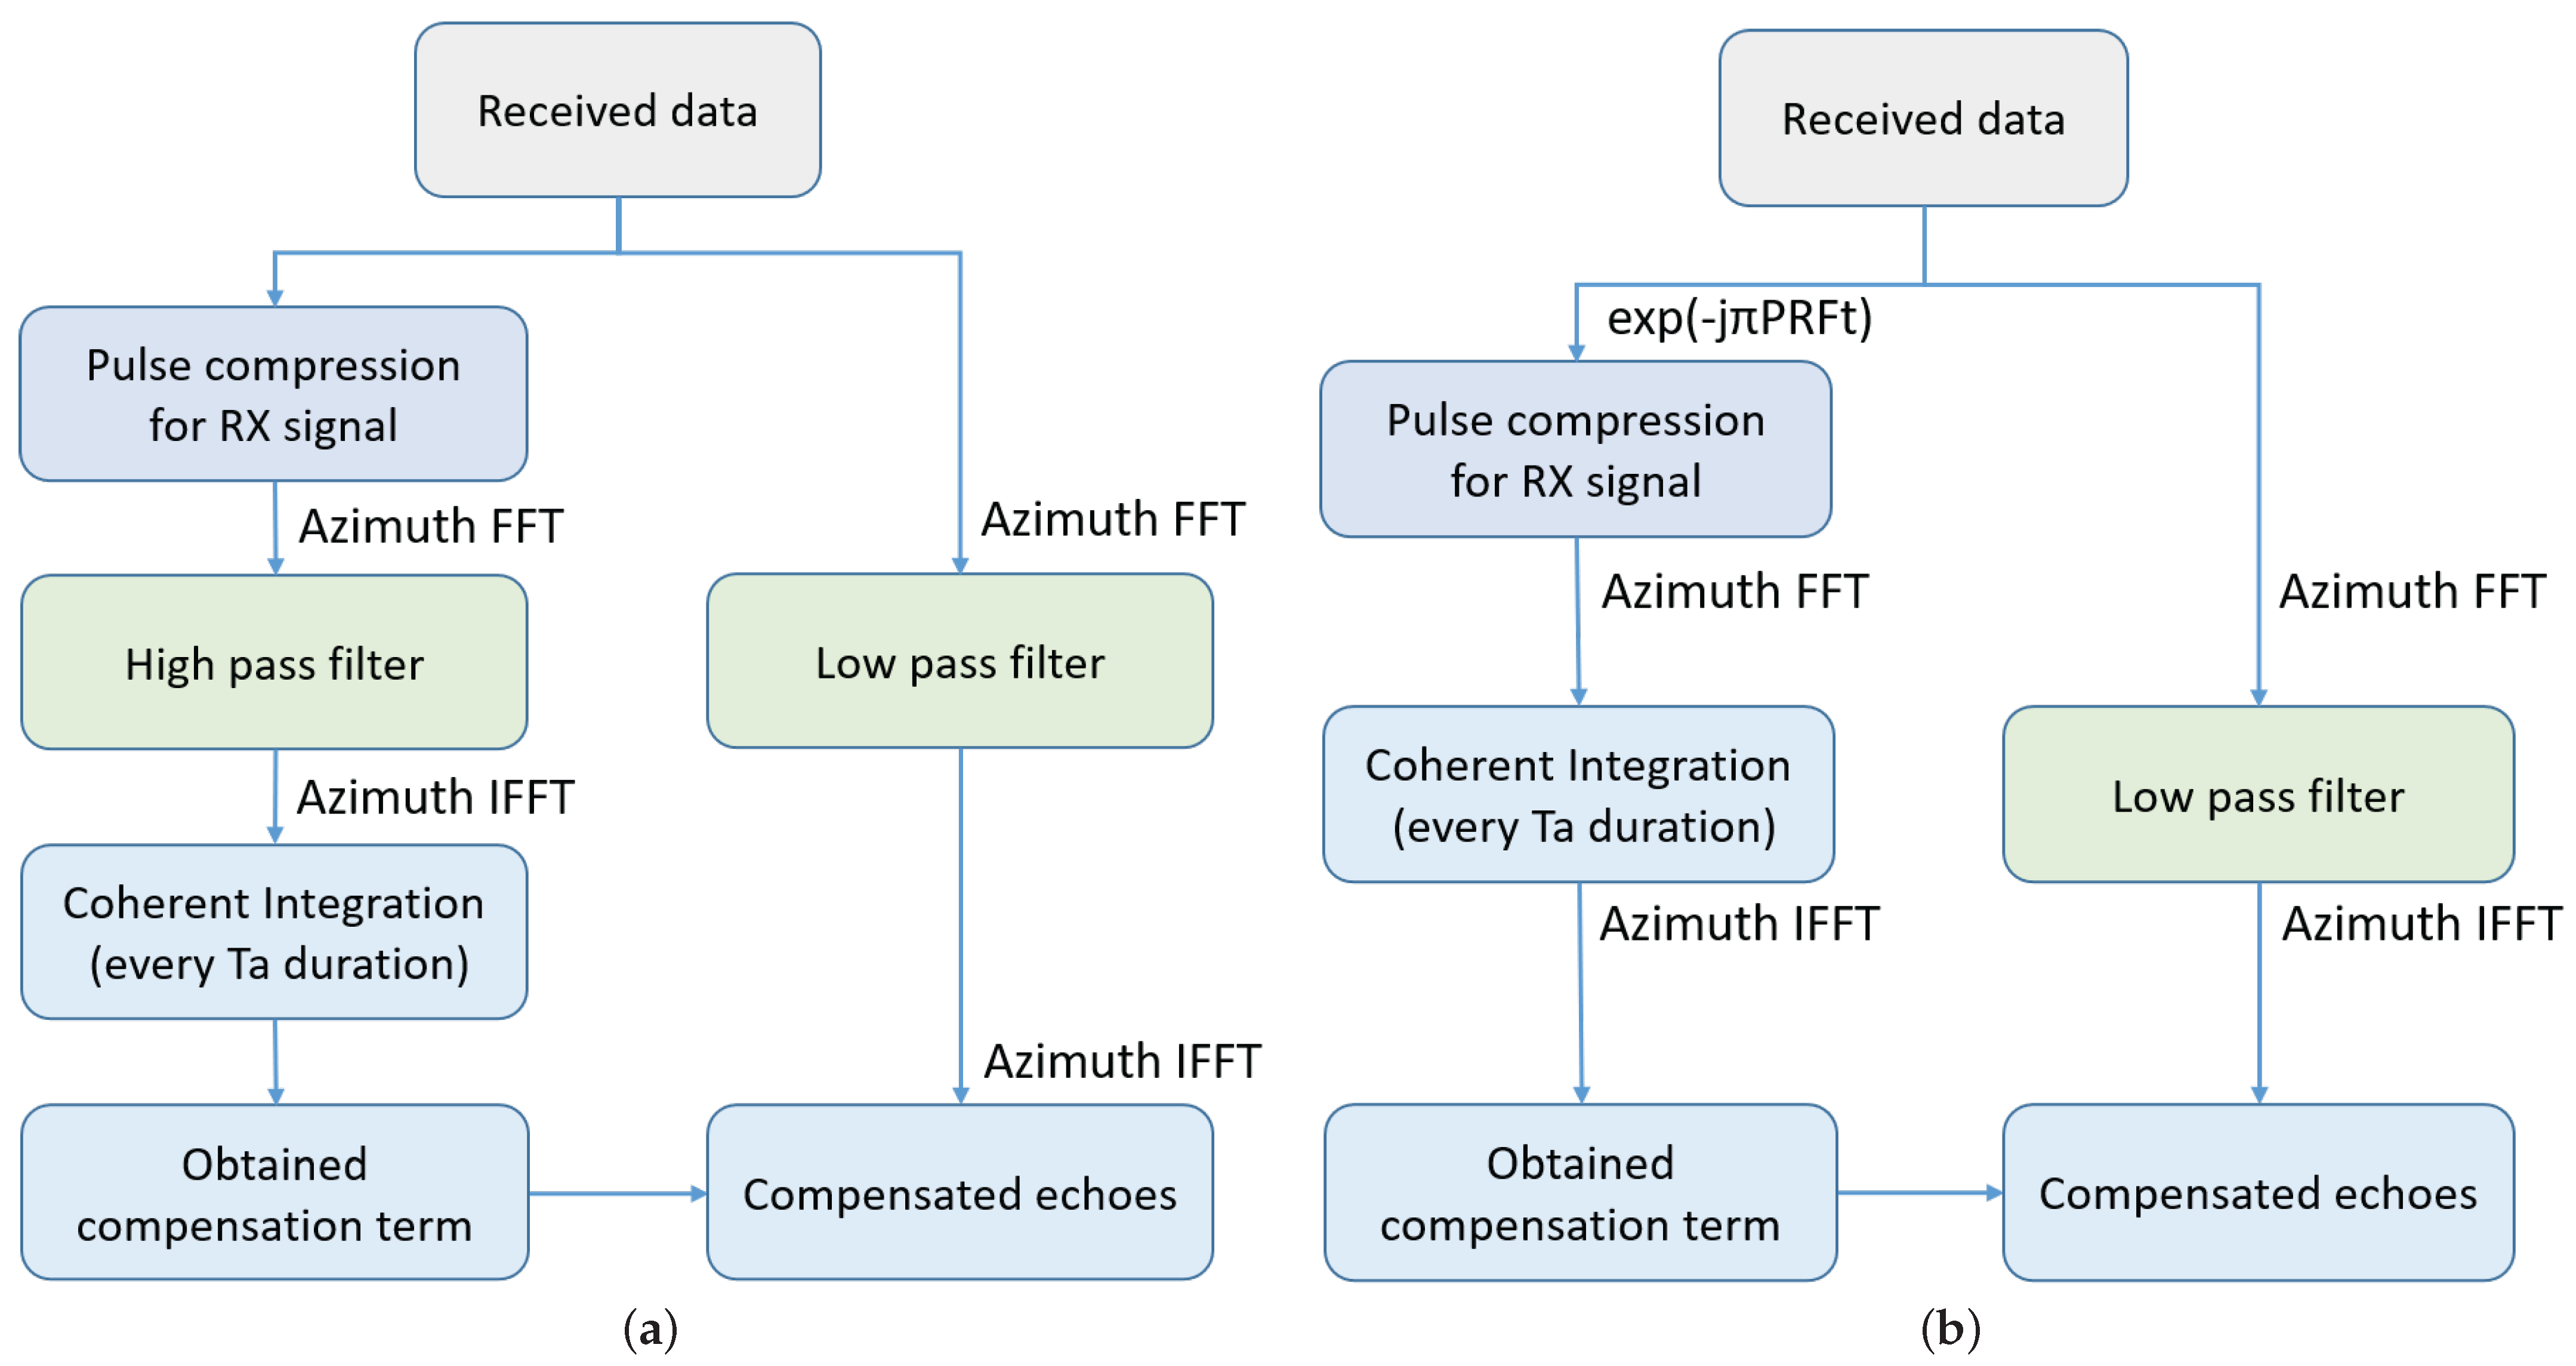
Figure 6. The processing flowchart. (a) Proposed first scheme. (b) Proposed second scheme.
Electronics 12 02677 g006
It should be noted again that in the processing of the echoes signal, the peak of R X signal in the high frequency around ± P R F / 2 is filtered out; therefore, the influence of R X signal on echoes is reduced.

3.3. Second Internal Calibration Scheme

3.3.1. Timing Diagram

In the second internal calibration scheme, A ( t ) can be expressed as follows
A ( t ) = exp ( j π P R F · t ) = 1 , t = 2 n · P R T 1 , t = ( 2 n + 1 ) · P R T
The R X signal is injected to the receiving path. The PRF of the R X signal is equal to the PRF of echoes. However, the difference between the proposed internal calibration scheme and the scheme proposed in [19] is that the R X signal is modulated with the azimuth-time varying phase exp ( j π P R F t ) , where t denotes the azimuth time. Therefore, after azimuth FFT operation, the peak position in Doppler frequency domain is around ± P R F / 2 .

3.3.2. SNR Analysis and Processing Step

The total power after azimuth coherent integration is given by
P t o t , f l t , p r o 2 = P R X · G r g · N a .
The SNR of the R X signal in the proposed scheme can be written as
P SNR , p r o 2 = P t o t , f l t , p r o 2 P n o i ( f h i g h ) ,
where f h i g h denotes the high frequency. Therefore, the ratio of SNR between the proposed scheme and the traditional algorithm can be expressed as
γ 2 = P SNR , p r o 2 P SNR , t r a = P n o i ( f l o w ) P n o i ( f h i g h ) .
As mentioned earlier, the two-way antenna power in the ± P R F / 2 is less than the power in the zero frequency, which means that the proposed scheme has a higher SNR than the scheme proposed in [19]. In addition, in the processing of the echoes, the total power of R X signal can be removed by a low pass filter with the bandwidth Δ f D o p . Therefore, R X signal almost has no influence on the echo signal. However, the drawback of the second internal calibration scheme is that it should be modulated with the azimuth-time varying phase exp ( j π PRF t ) , which complicates system design and may introduce residual errors.
The processing step of the first internal calibration scheme can be seen in Figure 6b, which can be summarized as follows:
step1: 
Multiply exp ( j π PRF t ) along the azimuth direction.
step2: 
Range compression for R X signal.
step3: 
Azimuth coherent integration every T a duration.
step4: 
Obtain the compensation term and compensate for the echoes.

4. Simulation Experiment

In this section, the simulation experiment is performed to demonstrate the effectiveness of the proposed schemes. First, the SNR of R X signal in the simulation experiment is analyzed in detail. Then, the effectiveness of the proposed schemes is demonstrated using the data acquired from Sentinel-1 mission.

4.1. SNR Analysis for Simulation Experiment

The simulation parameters can be seen in Table 2. The carrier frequency is 9.6 GHz. The corresponding wavelength is 0.0312 m. Suppose the velocity is 7000 m/s and the antenna length is 4 m. Therefore, the corresponding Doppler bandwidth Δ f D o p = 0.886 λ L a is 3100 Hz. The PRF is 4000 Hz, which denotes that the oversampling rate is 1.28. The antenna pattern in the frequency domain can be seen in Figure 4. Suppose the power P R X of the simulated R X signal is about 10 , 000 1 of the normalized antenna power in zero frequency. Assume the azimuth duration T a is 10 s. As a result, in the simulation experiment, the S N R of the R X signal after azimuth integration is
P SNR , t r a = P R X , i n P n o i ( f l o w ) = 43.5 dB
P SNR , p r o 1 = P t o t , f l t , p r o 1 P n o i ( f h i g h ) = 42 dB
P SNR , p r o 2 = P t o t , f l t , p r o 2 P n o i ( f h i g h ) = 48 dB .
Consequently, a high SNR of R X signal can also be obtained in the proposed two internal calibration schemes.

4.2. Experiment Using Sentinel-1 Data

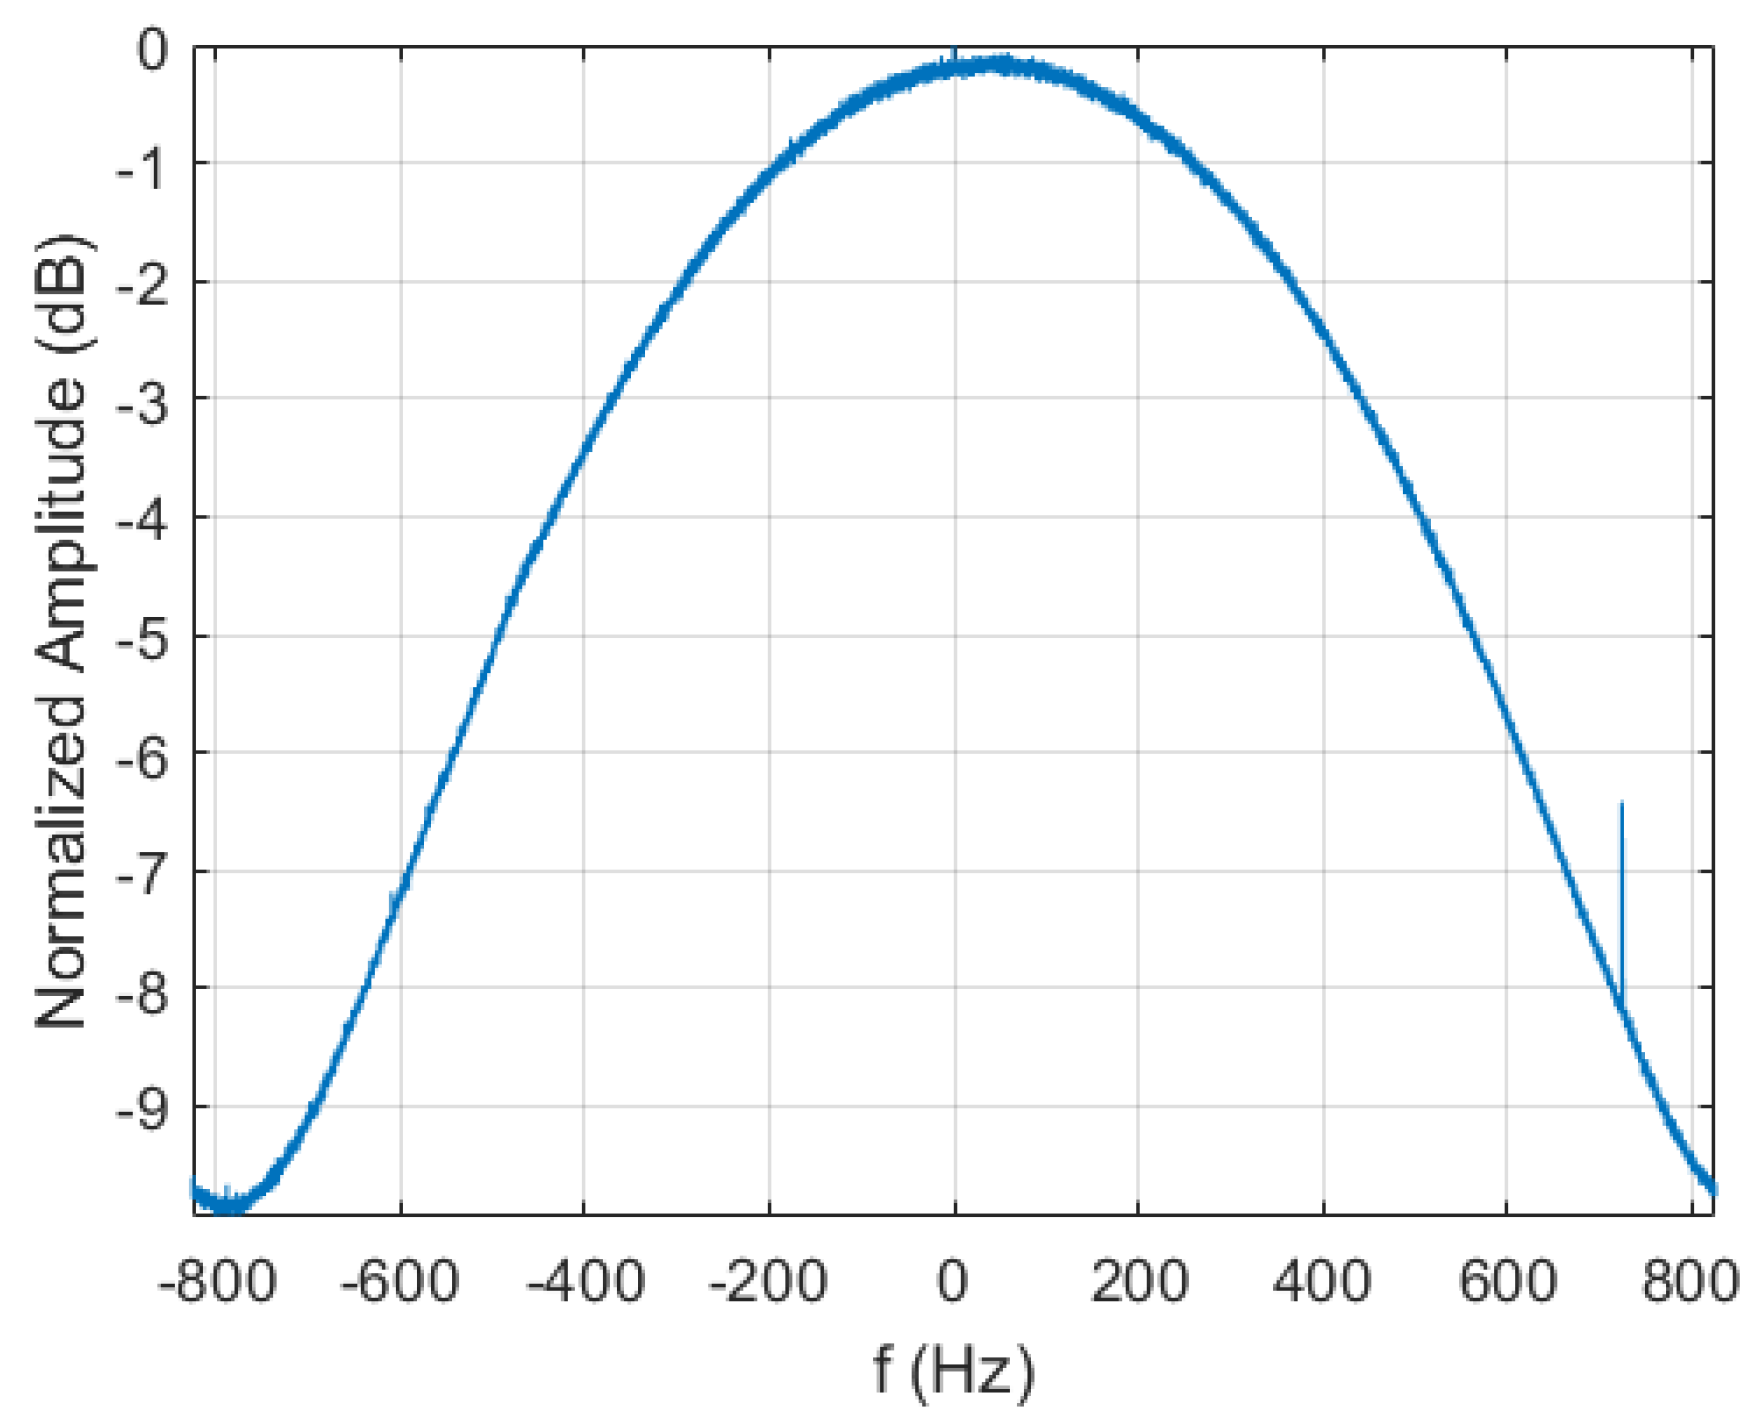
In this subsection, the decoded Sentinel-1 SAR raw data are used for a simulation experiment. The parameters of data acquired for Sentinel-1 satellite can be seen in Table 3. The SAR mode of the Sentinel-1 data used in the paper is Stripmap. First, the raw data are transformed into the range Doppler frequency domain. After the amplitude in the range line has been summarized, the aliasing antenna pattern can be obtained and the result can be seen in Figure 7.
In order to verify the effectiveness of the proposed schemes, the calibration signals are injected into the echoes. Here, the scheme proposed in [19] and the two schemes proposed in this paper are performed. The inverse chirp of signal is used in simulation. The bandwidth and width of the R X signal are the same as those of the transmitted SAR signal, while the chirp rate is the opposite. The power of the R X signal is about 2000 1 of the power of echoes. The white noise, whose power is the same for the R X signal, is also added to the digital signal in addition to the calibration signal [19,27].
Since the R X signal can be regarded as noise for echoes, the R X signal will have some influence on the SAR focused image. The mean power image disturbance Δ P is used to evaluate the influence, and it is defined as [19]
Δ P = 10 · log 10 1 N x · N y x N x y N y Δ Image ( x , y ) 2 ,
where N x is the point number of SAR image in the range direction and N y is the point number of SAR image in the azimuth direction. Δ Image ( x , y ) is the image difference given by [19]
Δ Image ( x , y ) = Image o r i g ( x , y ) Image c a l ( x , y ) ,
where Image o r i g ( x , y ) denotes the original focused image without an injected calibration signal, and Image c a l ( x , y ) denotes the focused image with an injected calibration signal.
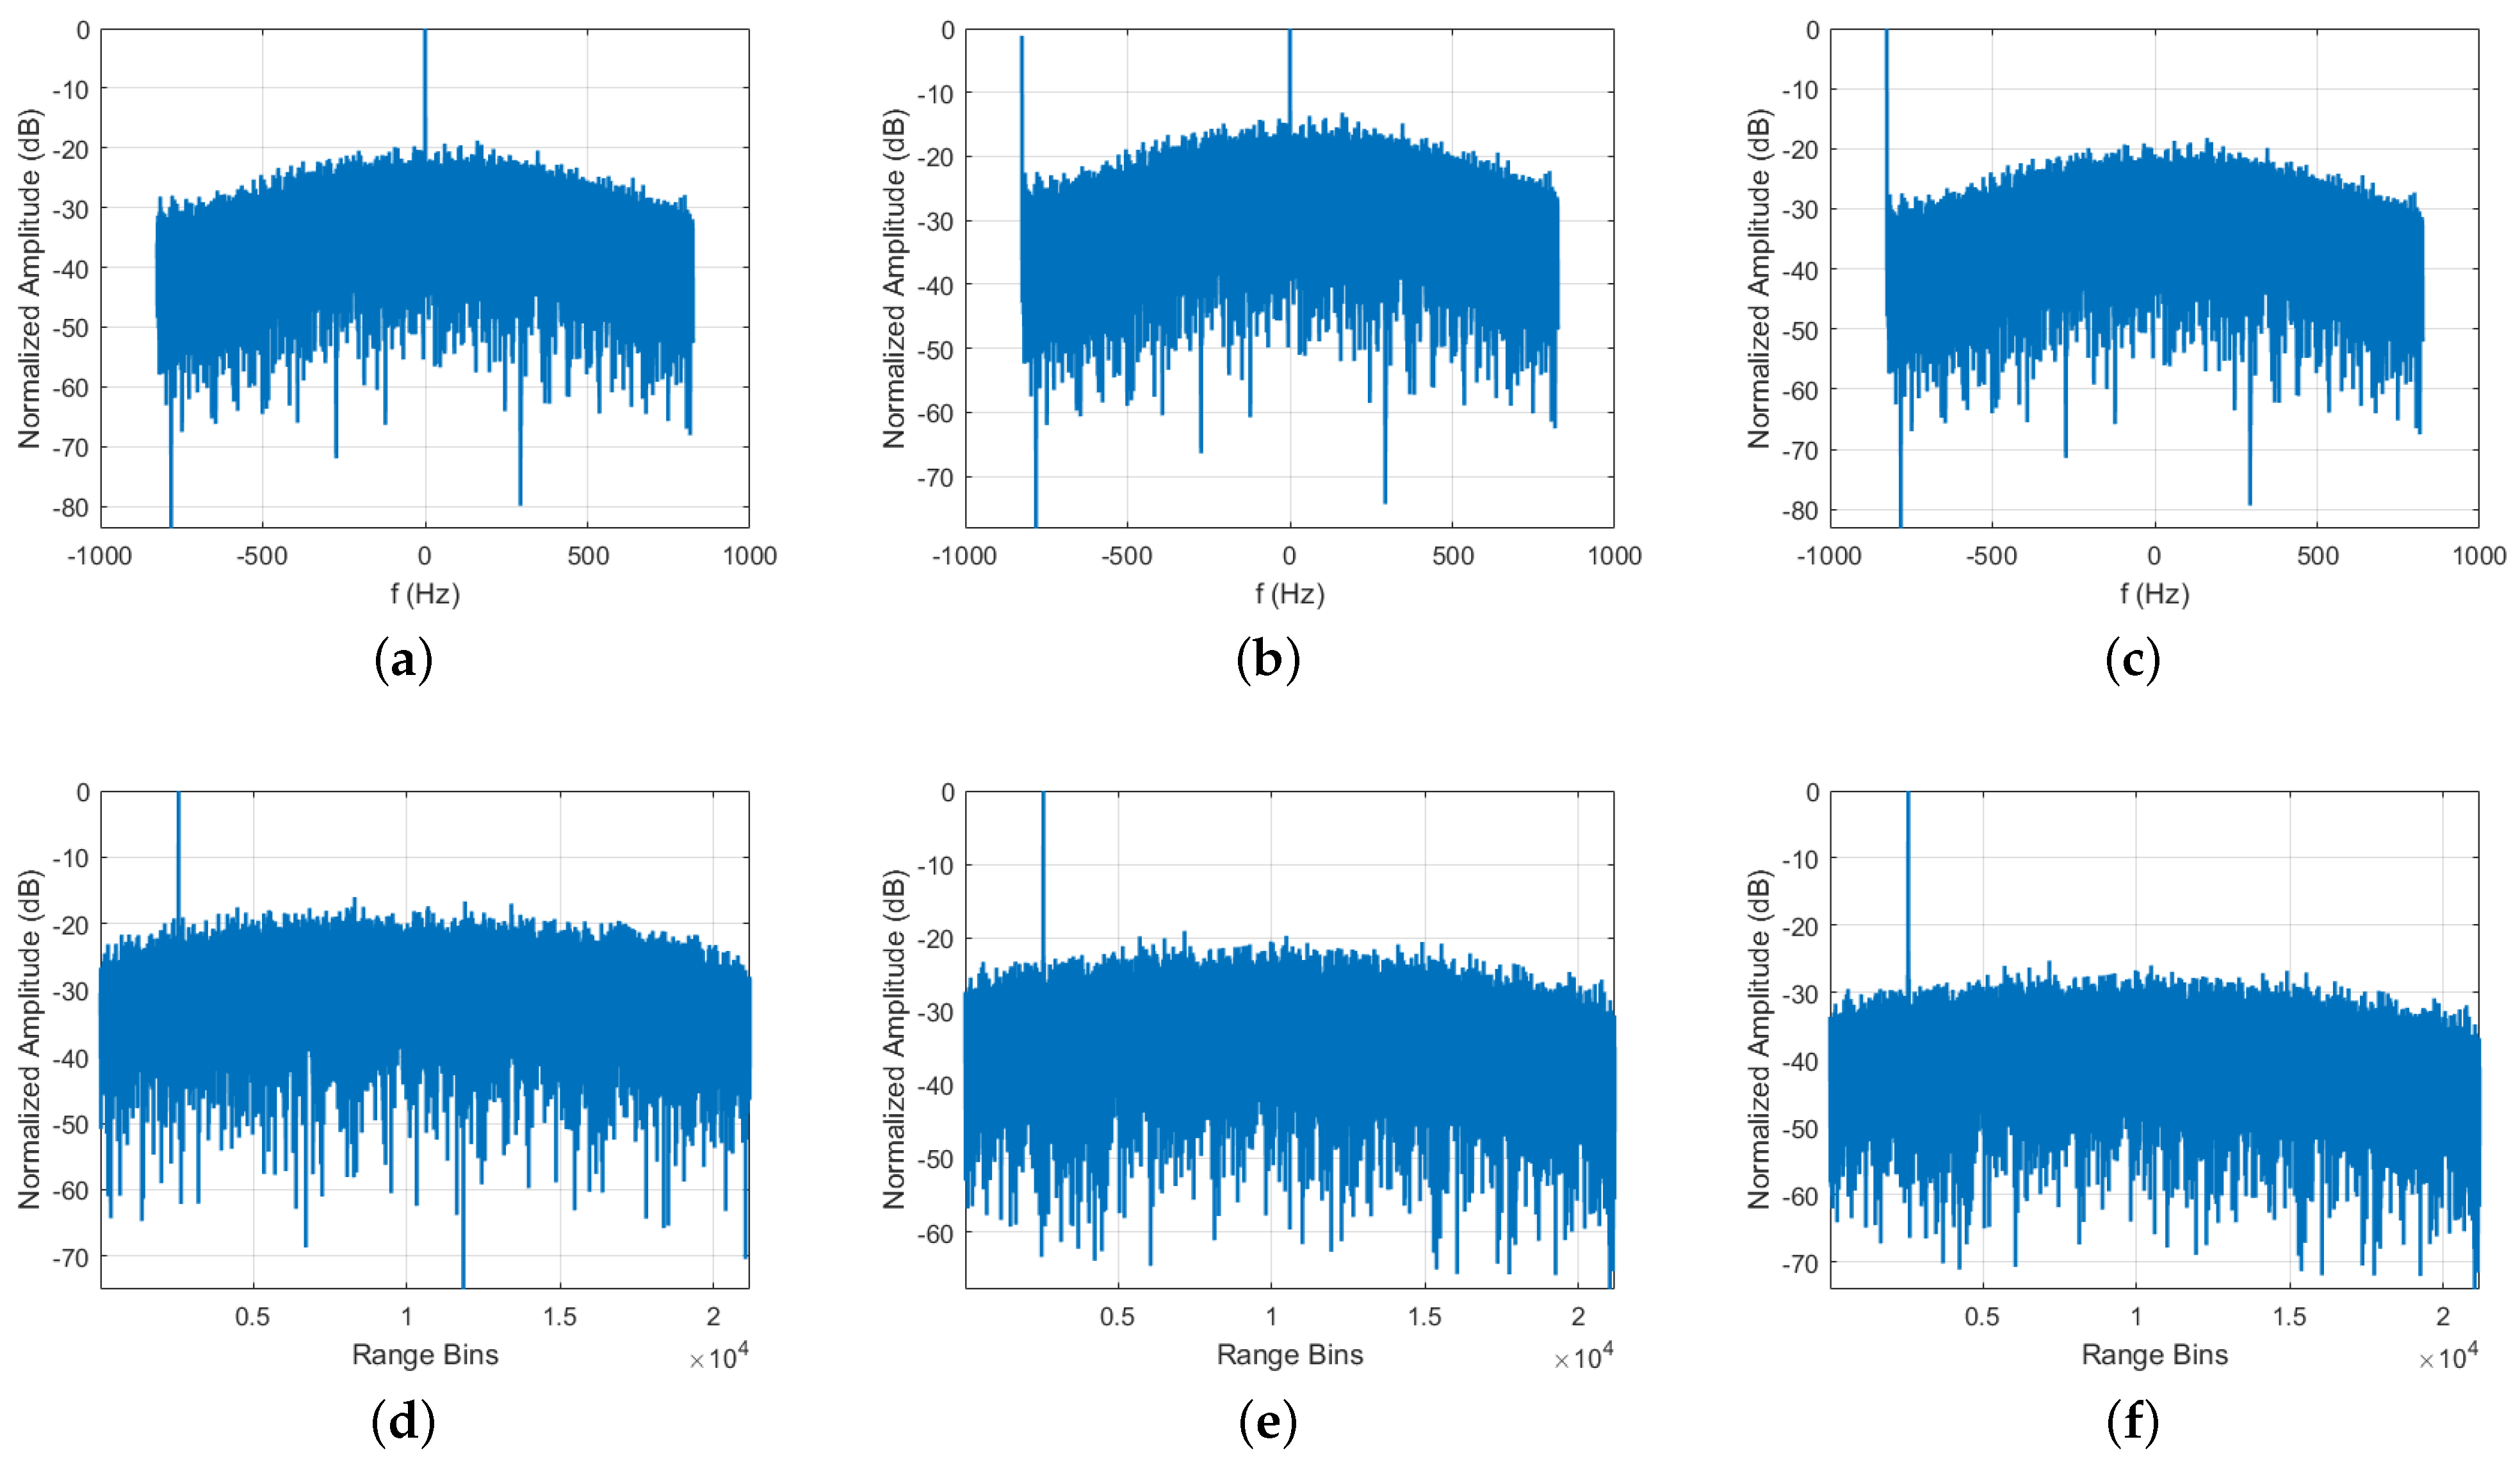
After range compression for the R X signal, the peak position is in the specific range bins; therefore, the specific range bins can be extracted along the azimuth direction. The amplitude of three schemes in the azimuth frequency domain and range time domain can be seen in Figure 8. All the echoes contained the R X signal in the scheme proposed in [19], and the change in the RX signal is slow. Therefore, there is only one peak around zero frequency, as Figure 8a shows. In the proposed first scheme, only one-half of the echoes contain the R X signal. According to the upsampling theory, there are two peaks in the azimuth frequency domain, which can be seen in Figure 8b. In Figure 8c, the peak value is around ±PRF/2 due to the azimuth modulation in the proposed second scheme. In addition. since the energy of the antenna pattern is the lowest at ±PRF/2, after the calibration signal has been extracted and coherently accumulated in the azimuth direction, the SNR of the signal in Figure 8f is obviously better than that in Figure 8d,e.
The image disturbance Δ P and SNR can be seen in Table 4. The scheme proposed in [19] has a SNR of 26.8 dB, while the SNR of the proposed first scheme is 29.8 dB. This is because the spectral power at the edge of the frequency domain is about 9 dB less than the spectral power in the low frequency, as shown in Figure 7. In the simulation experiment, the normalized amplitude of antenna pattern around the ±PRF/2 is about −4.4 dB (as shown in Figure 4b). However, in Sentinel-1 SAR data, the normalized amplitude of antenna pattern around the ±PRF/2 is about −9 dB. As a result, the difference of P n o i ( f l o w ) between the simulation experiment and Sentinel-1 SAR data experiment is about −9 (dB) − (−4.4 dB) = −4.6 dB. Therefore, the value P SNR , p r o 1 P SNR , t r a between the simulation and Sentinel-1 SAR data is about −4.6 dB,
42 dB 43.5 dB = 1.5 dB 1.6 dB = 29.8 dB 26.8 dB + ( 4.6 dB ) simulation Sentinel 1
The value P SNR , p r o 2 P SNR , t r a between the simulation and Sentinel-1 SAR data is about −4.6 dB,
48 dB 43.5 dB = 4.5 dB 4.6 dB = 36.0 dB 26.8 dB + ( 4.6 dB ) simulation Sentinel 1
The proposed second scheme has the best performance, since the SNR of R X signal is the highest and the R X signal is removed from the received signal. The image disturbances in the proposed second scheme are caused by the white noise added in the received signal. The results prove the effectiveness of the proposed two schemes.

5. Discussion

The proposed two schemes are based on the use of upsampling theory and azimuth modulation, respectively. Compared with the internal calibration scheme proposed in [19], the proposed two schemes have a considerable SNR and reduce the influence on echoes. For the proposed first scheme, the PRF of R X signal is half of the PRF of echoes. The PRF of R X signal can also be extended to other values, such as a quarter of PRF of echoes. The core of the PRF choice of R X signal is that the signal’s spectral replicas have a component around the ± P R F / 2 , where the two-way antenna power is lowest. For the proposed second scheme, the azimuth modulation is added for the R X signal. As a result, the position of the peak in frequency domain is around the ± P R F / 2 , which can improve the SNR of the R X signal. In addition, for the processing of echoes, a low filter with bandwidth Δ f D o p is used in the azimuth frequency domain, which can filter out the R X signal. Consequently, the R X signal is removed which will not influence the echoes.
Beyond that, a dual-postprocessing technique can be used to remove the R X signal in the received signal with a very small impact on the focused SAR image [28]. The dual-postprocessing technique exploits the orthogonal signal’s sparsity in range-compressed data, which is suitable for the situation discussed in this paper. The scheme proposed in [19], as well as the first scheme and the second scheme proposed in this paper, can employ the dual-postprocessing technique to reduce the influence of R X signal on echoes.
The computational cost of different schemes is also compared. Suppose there are K sampling points in the range direction. For simplicity, suppose N a = K . The computational cost required in the application of the scheme in [19], the proposed first scheme, and the second scheme are 2 K log 10 K + K , 6 K log 10 K + 4 K , and 6 K log 10 K + 4 K , respectively. The computational costs of the proposed first scheme and second scheme are the same, and they are higher than that of the scheme in [19]. In addition, there are also some drawbacks of the proposed schemes. First, azimuth amplitude and phase modulation require specialized hardware to implement, which complicates the signal generation process and may introduce additional errors. Secondly, specialized hardware also requires precise timing control. These factors increase the difficulty and cost of system implementation.

6. Conclusions

The internal calibration plays an important role in monitoring changes in SAR instruments. In this paper, an advanced non-interrupted internal calibration model is proposed. Based on the proposed model, two new internal calibration schemes are demonstrated which will not interrupt normal SAR operation. In addition, compared with the conventional schemes, the proposed schemes can reduce the influence of the R X signal on the focused image. A theoretical analysis is given in the paper, followed by simulation experiments. The data acquired from the Sentinel-1 satellite are used to carry out the calibration process. The test results demonstrate the effectiveness of the proposed schemes.
Using the described two internal calibration schemes, the focused SAR image quality can be improved, which is very beneficial for SAR modes (such as staggered SAR) and long data acquisition [19,29,30]. In the future, we will focus on designing a real SAR system to demonstrate the feasibility of the proposed schemes.

Author Contributions

Conceptualization, D.L. and X.P.; methodology, D.L.; software, D.L.; validation, D.L. and X.P.; formal analysis, X.P.; investigation, X.P.; writing—original draft preparation, D.L.; writing—review and editing, D.L. and X.P.; visualization, D.L.; supervision, X.P.; project administration, D.L.; funding acquisition, D.L. and X.P. All authors have read and agreed to the published version of the manuscript.

Funding

This research was funded by the National Natural Science Fund under Grant 62071442.

Data Availability Statement

Data available on request due to restrictions.

Acknowledgments

The authors would like to thank the European Space Agency (ESA) for providing the Sentinel-1 data.

Conflicts of Interest

The authors declare no conflict of interest.

Appendix A. Theoretical Analysis for Upsampling Theory
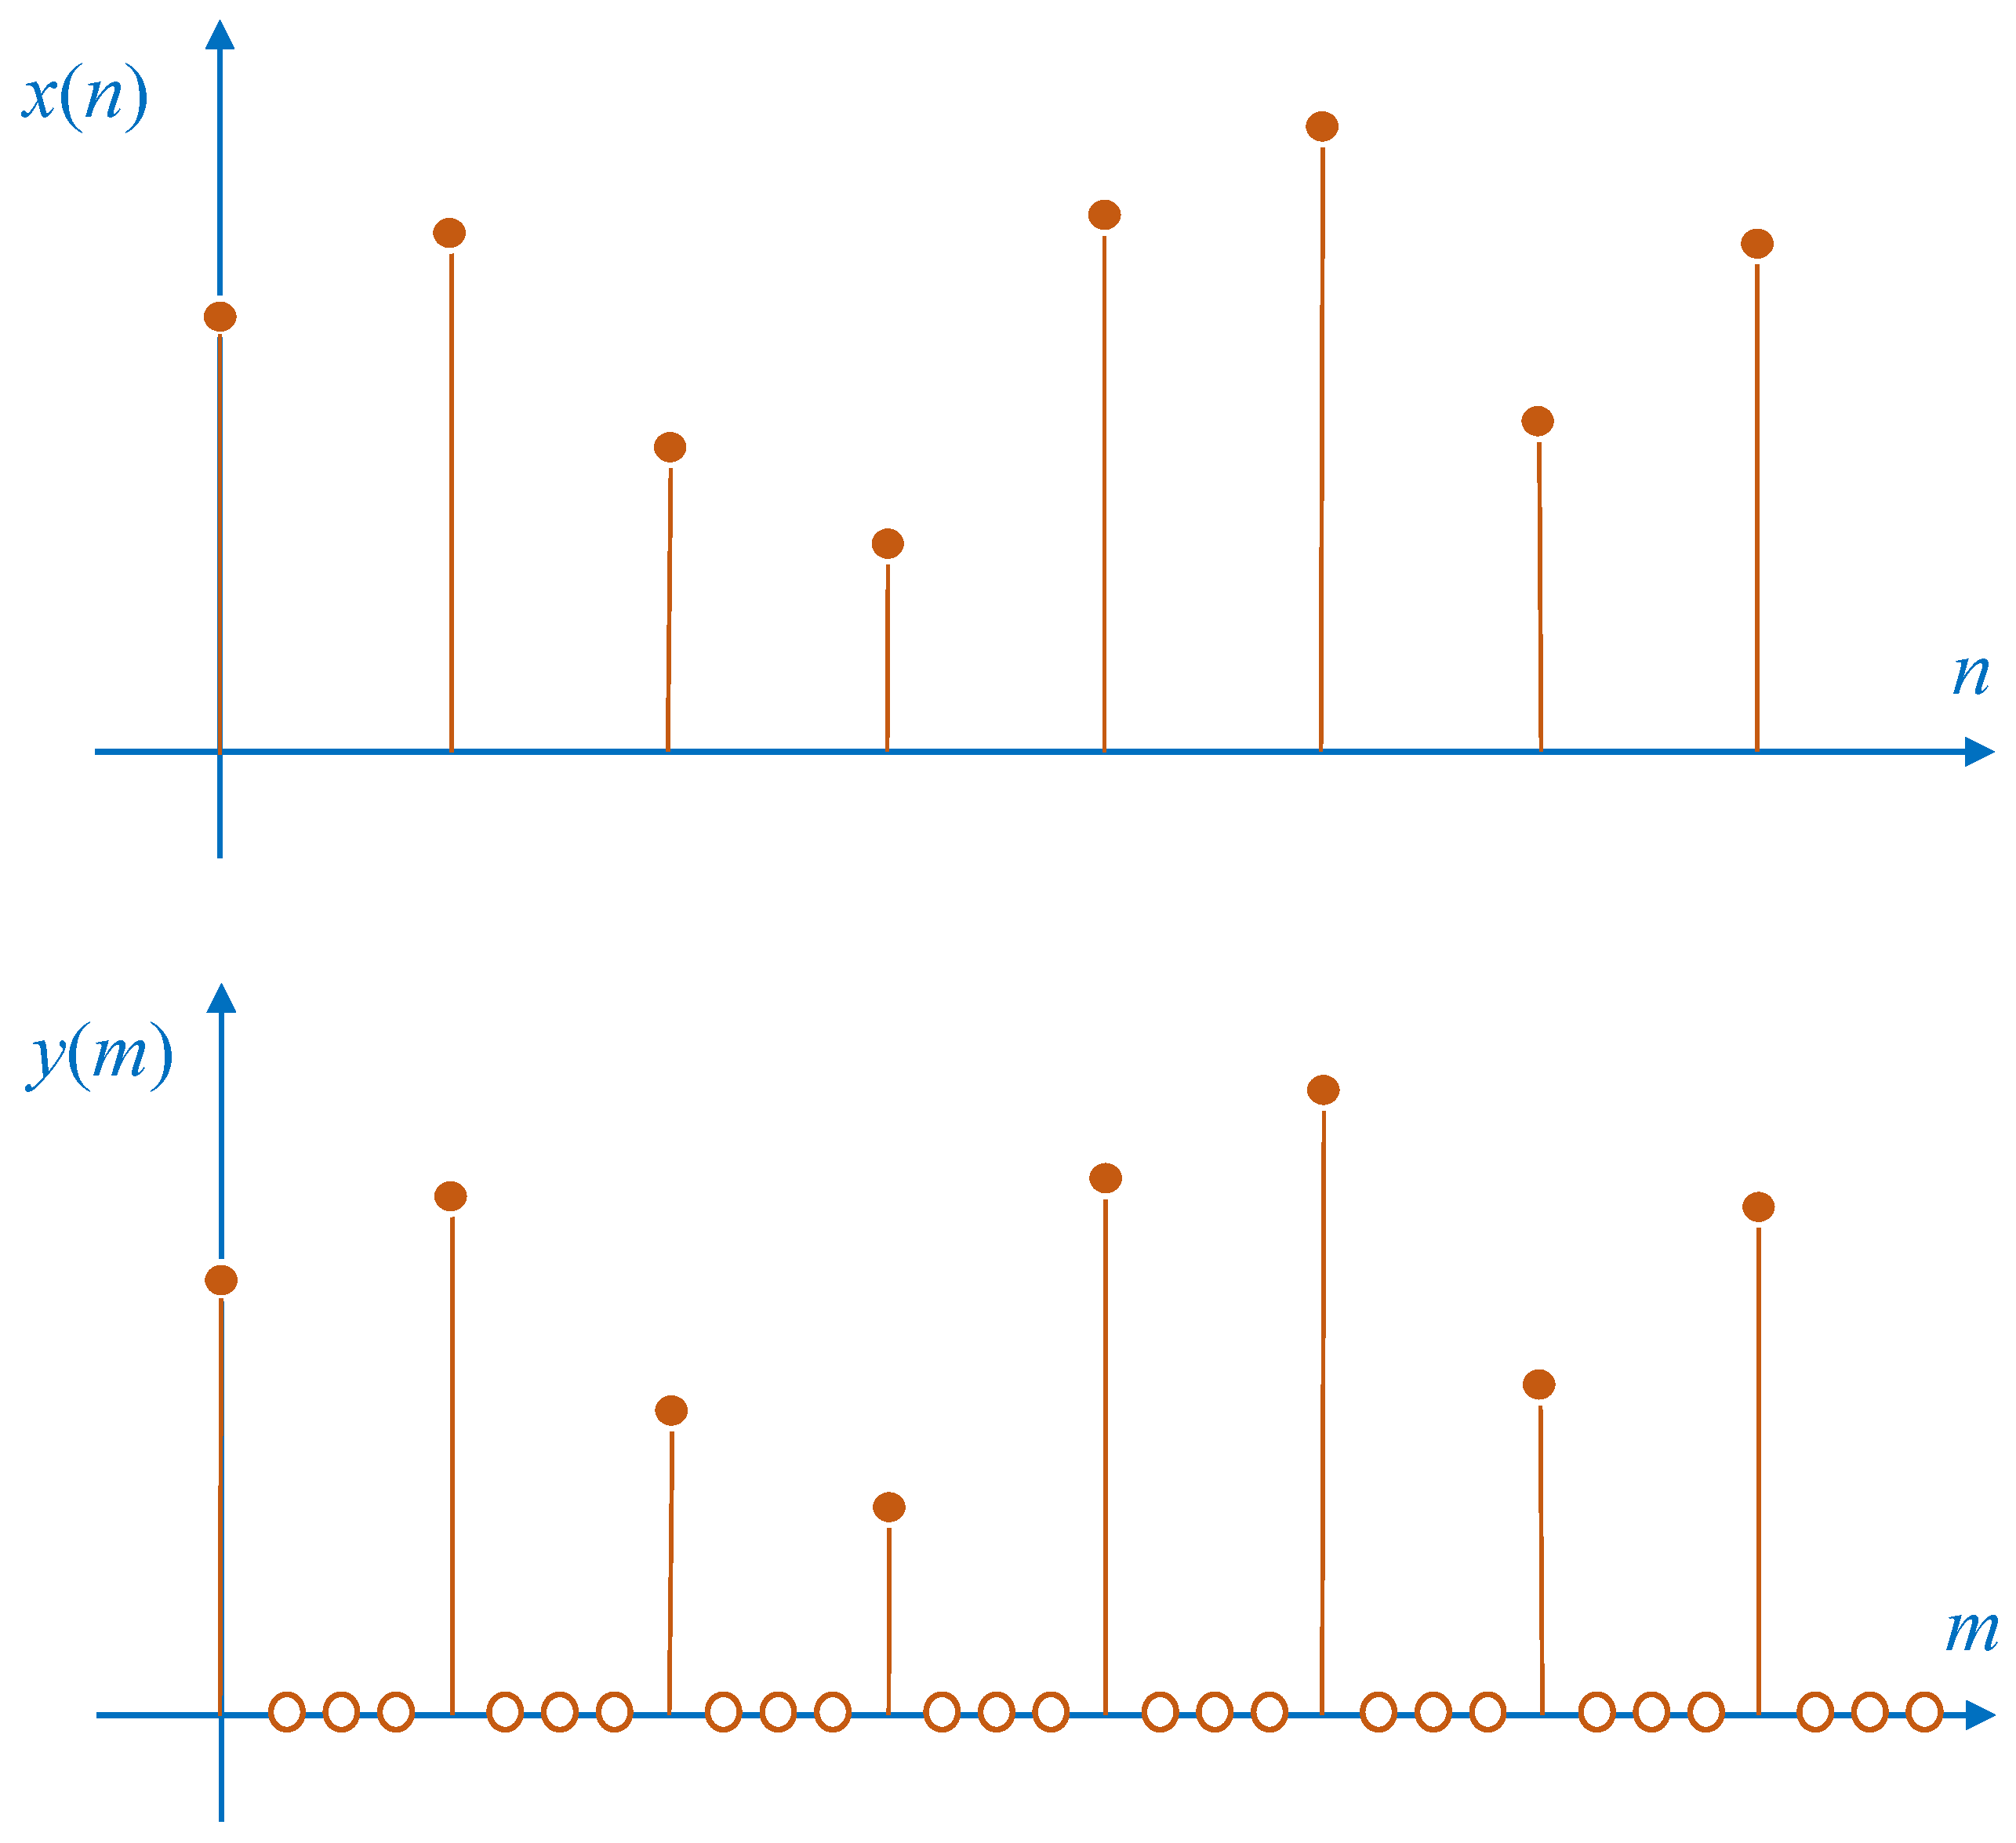
Here, we give a theoretical analysis for the umsampling theory [31]. Suppose x ( n ) is a sequence (as shown in Figure A1), where n = 0 , 1 , · , N 1 . Assuming that the data sequence has the current sampling period of T, the sampling frequency is given by f s = 1 / T . The Fourier transform of x ( n ) is given by
X ( f ) = n = 0 N 1 x ( n ) exp ( j 2 π f n / f s ) ,
where f is the frequency. Suppose the sequence y ( n ) is defined as follows
y ( m ) = x m L m = n L 0 otherwise .
The Equation (A2) denotes the process of upsampling by an integer factor of L. An example with integer factor L = 4 is shown in Figure A1. The Fourier transform of y ( m ) can be derived as
Y ( f ) = m = 0 ( N 1 ) L y ( m ) exp ( j 2 π f m / f s ) = n = 0 N 1 x ( n ) exp ( j 2 π f n L / f s ) = X ( L f ) .
After upsampling by a factor of L, the new sampling period becomes T / L , thus the new sampling frequency is changed to be
f s L = L f s .
This indicates that after upsampling, the spectral replicas originally centered as 0, ± f s , ⋯, ± L f s / 2 are included in the frequency range from L f s / 2 Hz to the new limit L f s / 2 Hz, which can be seen in Figure A2.
Figure A1. The sequence x ( n ) (top) and y ( m ) (bottom).
Electronics 12 02677 g0a1
Figure A2. X ( f ) (top) and Y ( f ) (bottom) in frequency domain ( L = 4 ).
Electronics 12 02677 g0a2
To remove those included spectral replicas, an interpolation filter can be used to remove the unwanted spectral replica. After filtering via the interpolation filter, we will achieve the desired spectrum for y ( m ) . In the processing of the internal calibration signal in the paper, since the interpolation filter is used to remove the low-frequency images that are aliased by the upsampling operation in the azimuth frequency domain, it is essentially an anti-aliasing high pass filter.

References

  1. Moreira, A.; Prats-Iraola, P.; Younis, M.; Krieger, G.; Hajnsek, I.; Papathanassiou, K.P. A Tutorial on Synthetic Aperture Radar. IEEE Geosci. Remote Sens. Mag. 2013, 1, 6–43. [Google Scholar] [CrossRef] [Green Version]
  2. Freeman, A. SAR Calibration: An Overview. IEEE Trans. Geosci. Remote Sens. 1992, 30, 1107–1121. [Google Scholar] [CrossRef]
  3. Schwerdt, M.; Schmidt, K.; Ramon, N.T.; Klenk, P.; Yaguemartinez, N.; Pratsiraola, P.; Zink, M.; Geudtner, D. Independent System Calibration of Sentinel-1B. Remote Sens. 2017, 9, 511. [Google Scholar] [CrossRef] [Green Version]
  4. Brautigam, B.; Schwerdt, M.; Bachmann, M. An Efficient Method for Performance Monitoring of Active Phased Array Antennas. IEEE Trans. Geosci. Remote Sens. 2009, 47, 1236–1243. [Google Scholar] [CrossRef] [Green Version]
  5. Deng, Y.; Zheng, H.; Wang, R.; Feng, J.; Liu, Y. Internal Calibration for Stepped-Frequency Chirp SAR Imaging. IEEE Geosci. Remote Sens. Lett. 2011, 8, 1105–1109. [Google Scholar] [CrossRef]
  6. Wang, S.; Qi, H.; Yu, W. Polarimetric SAR Internal Calibration Scheme Based on T/R Module Orthogonal Phase Coding. IEEE Trans. Geosci. Remote Sens. 2009, 47, 3969–3980. [Google Scholar] [CrossRef]
  7. Jager, M.; Scheiber, R.; Reigber, A. Robust, Model-Based External Calibration of Multi-Channel Airborne SAR Sensors Using Range Compressed Raw Data. Remote Sens. 2019, 11, 2674. [Google Scholar] [CrossRef] [Green Version]
  8. Schwerdt, M.; Brautigam, B.; Bachmann, M.; Doring, B.; Schrank, D.; Gonzalez, J.H. TerraSAR-X Calibration Results. In Proceedings of the IEEE International Geoscience and Remote Sensing Symposium, Friedrichshafen, Germany, 2–5 June 2008; Volume 2, pp. 205–208. [Google Scholar]
  9. Curlander, J.C.; McDonough, R.N. Synthetic Aperture Radar: Systems and Signal Processing; Wiley: New York, NY, USA, 1991. [Google Scholar]
  10. Zink, M.; Bamler, R. X-SAR Radiometric Calibration and Data Quality. IEEE Trans. Geosci. Remote Sens. 1995, 33, 840–847. [Google Scholar] [CrossRef]
  11. Wang, P.; Sun, H.; Yu, W. A Novel Wireless Internal Calibration Method of Spaceborne SAR. J. Radars 2018, 7, 35–46. [Google Scholar]
  12. Schied, E.; Rostan, F.; Oestergaard, A.; Traver, I.N.; Snoeij, P. The Sentinel-1 C-SAR Internal Calibration. In Proceedings of the 8th European Conference on Synthetic Aperture Radar, Aachen, Germany, 7–10 June 2010; pp. 341–343. [Google Scholar]
  13. Wang, X.; Wang, R.; Deng, Y.; Wang, P.; Li, N.; Yu, W.; Wang, W. Precise Calibration of Channel Imbalance for Very High Resolution SAR With Stepped Frequency. IEEE Trans. Geosci. Remote Sens. 2017, 55, 4252–4261. [Google Scholar] [CrossRef]
  14. Younis, M.; Rommel, T.; de Almeida, F.; Huber, S.; Martone, M.; Villano, M.; Krieger, G. Investigations on the Internal Calibration of Multi-Channel SAR. In Proceedings of the 2017 IEEE International Geoscience and Remote Sensing Symposium (IGARSS), Fort Worth, TX, USA, 23–28 July 2017; pp. 5386–5389. [Google Scholar]
  15. Zink, M.; Torres, R.; Buck, C.H.; Rosich, B.; Closa, J. Calibration and Early Results of the ASAR on ENVISAT. In Proceedings of the IEEE International Geoscience and Remote Sensing Symposium, Toronto, ON, Canada, 24–28 June 2002; Volume 1, pp. 596–598. [Google Scholar]
  16. Schwerdt, M.; Hounam, D.; Alvarezperes, J.; Molkenthin, T. The Calibration Concept of TerraSAR-X: A Multiple-Mode, High-Resolution SAR. Can. J. Remote Sens. 2005, 31, 30–36. [Google Scholar] [CrossRef]
  17. Gong, Y.; Wang, R.; Wang, P. Improved Phase-Encoding Calibration for Active Phased-Array Antennas of SAR. IEEE Geosci. Remote Sens. Lett. 2016, 13, 767–771. [Google Scholar] [CrossRef]
  18. Younis, M.; de Almeida, F.Q.; Huber, S.; Laux, C.; Krieger, G. An Internal Instrument Calibration Simulator for Multi-Channel SAR. In Proceedings of the IEEE International Geoscience and Remote Sensing Symposium (IGARSS), Valencia, Spain, 22–27 July 2018; pp. 9201–9204. [Google Scholar]
  19. Reimann, J.; Schwerdt, M. Technique for Concurrent Internal Calibration during Data Acquisition for SAR Systems. Remote Sens. 2020, 12, 1773. [Google Scholar] [CrossRef]
  20. Viet, H.T.; Minh, T.H. A Real-Time Internal Calibration Method for Radar Systems Using Digital Phase Array Antennas. In Proceedings of the Industrial Networks and Intelligent Systems: 7th EAI International Conference, INISCOM 2021, Hanoi, Vietnam, 22–23April 2021; Springer: Cham, Switzerland, 2021; pp. 88–103. [Google Scholar]
  21. Tran, V.H.; Hoang, M.T. Improving the Structure of a Signal Used for Real-Time Calibrating of the Receiving Channels of Digital Transceiver Modules in Digital Phased Antenna Arrays. J. Russ. Univ. Radioelectron. 2021, 24, 19–26. [Google Scholar]
  22. Brautigam, B.; Gonzalez, J.H.; Schwerdt, M.; Bachmann, M. TerraSAR-X Instrument Calibration Results and Extension for TanDEM-X. IEEE Trans. Geosci. Remote Sens. 2010, 48, 702–715. [Google Scholar] [CrossRef]
  23. Bordoni, F.; Younis, M.; Krieger, G. Ambiguity Suppression by Azimuth Phase Coding in Multichannel SAR Systems. IEEE Trans. Geosci. Remote Sens. 2011, 50, 617–629. [Google Scholar] [CrossRef] [Green Version]
  24. Natsuaki, R.; Sakar, N.; Yague-Martinez, N.; Pinheiro, M.; Prats-Iraola, P. Investigations on the Optimum Combination of Azimuth Phase Coding and Up-and Down-Chirp Modulation for Range Ambiguity Suppression. In Proceedings of the IGARSS 2019—2019 IEEE International Geoscience and Remote Sensing Symposium, Yokohama, Japan, 28 July–2 August 2019; pp. 2288–2291. [Google Scholar]
  25. Dall, J.; Kusk, A. Azimuth Phase Coding for Range Ambiguity Suppression in SAR. In Proceedings of the IGARSS 2004. 2004 IEEE International Geoscience and Remote Sensing Symposium, Anchorage, AK, USA, 20–24 September 2004; Volume 3, pp. 1734–1737. [Google Scholar]
  26. Cumming, I.G.; Wong, F.H. Digital Processing of Synthetic Aperture Radar Data: Algorithms and Implementation; Artech House: Norwood, MA, USA, 2005. [Google Scholar]
  27. Schuchman, L. Dither Signals and Their Effect on Quantization Noise. IEEE Trans. Commun. 1964, 12, 162–165. [Google Scholar] [CrossRef]
  28. Villano, M.; Krieger, G.; Moreira, A. Nadir Echo Removal in Synthetic Aperture Radar via Waveform Diversity and Dual-Focus Postprocessing. IEEE Geosci. Remote Sens. Lett. 2018, 15, 719–723. [Google Scholar] [CrossRef]
  29. Villano, M.; Krieger, G.; Jäger, M.; Moreira, A. Staggered SAR: Performance Analysis and Experiments With Real Data. IEEE Trans. Geosci. Remote Sens. 2017, 55, 6617–6638. [Google Scholar] [CrossRef]
  30. Villano, M.; Krieger, G.; Moreira, A. Staggered SAR: High-Resolution Wide-Swath Imaging by Continuous PRI Variation. IEEE Trans. Geosci. Remote Sens. 2014, 52, 4462–4479. [Google Scholar] [CrossRef]
  31. Tan, L.; Jiang, J. Digital Signal Processing: Fundamentals and Applications; Academic Press: Cambridge, MA, USA, 2018. [Google Scholar]
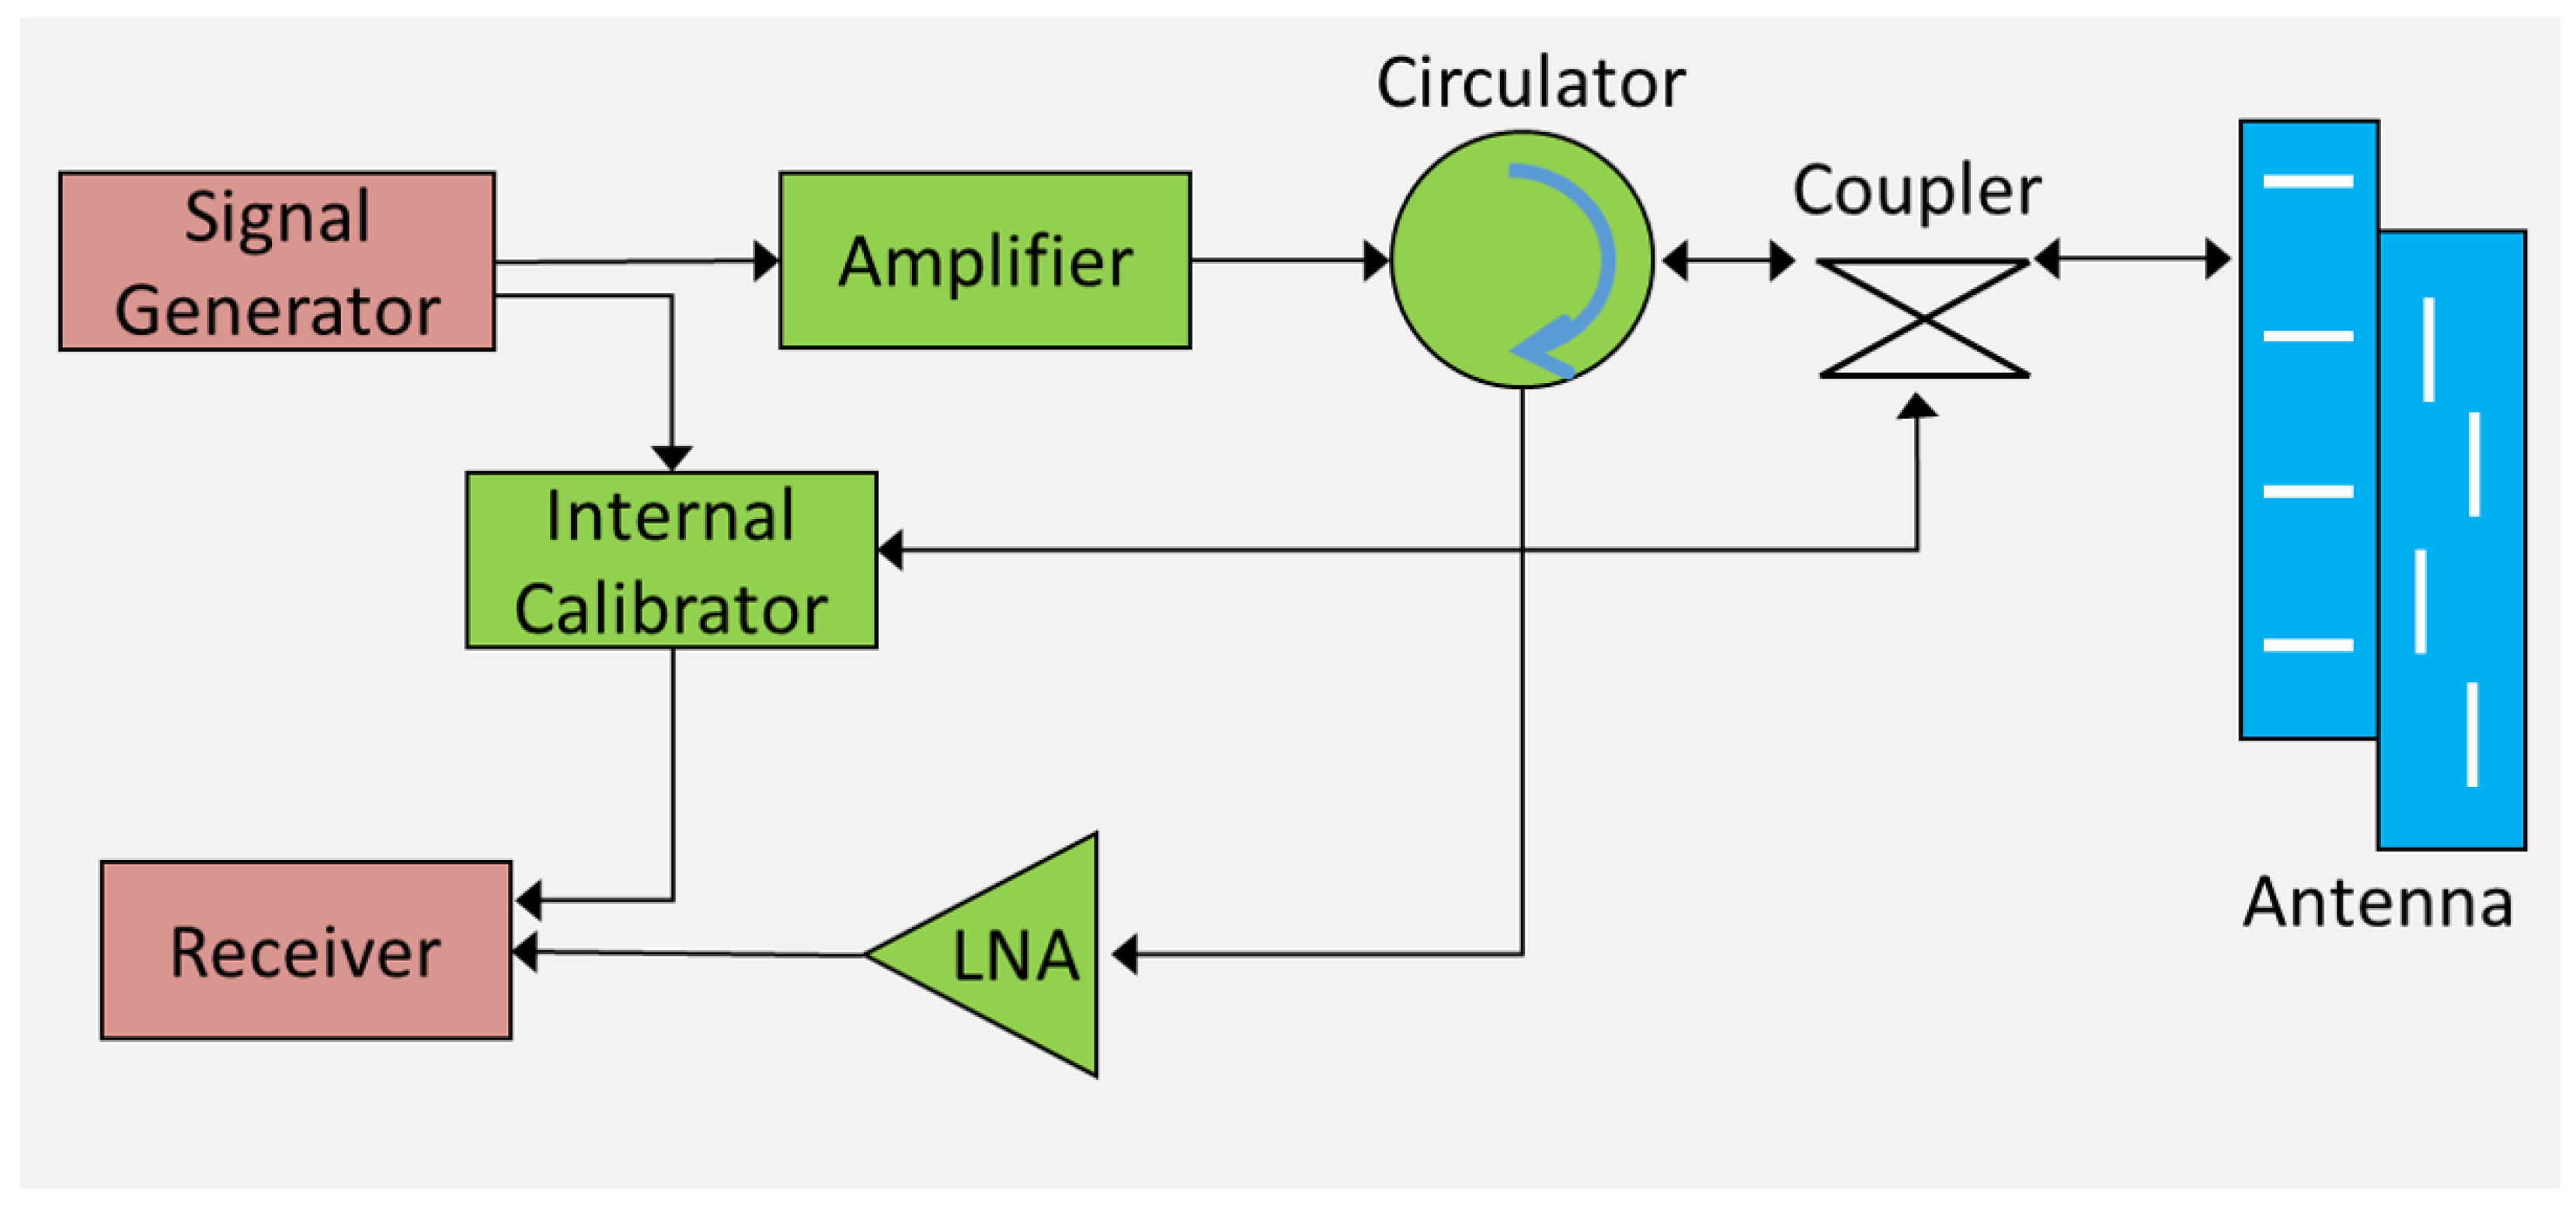
Figure 1. A typical SAR system with internal calibration loop.
Electronics 12 02677 g001
Figure 2. A new calibration scheme proposed in [19].
Electronics 12 02677 g002
Figure 3. Timing diagrams of proposed internal calibration schemes. (a) Proposed first scheme. (b) Proposed second scheme.
Electronics 12 02677 g003
Figure 4. The two-way antenna pattern in Doppler frequency domain. The oversampling rate is 1.29. (a) No aliasing. (b) Aliasing.
Electronics 12 02677 g004
Figure 5. The spectral of R X signal in Doppler frequency domain in the proposed first scheme.
Electronics 12 02677 g005
Figure 7. The antenna pattern of data acquired from Sentinel-1 mission in frequency domain.
Electronics 12 02677 g007
Figure 8. The processing results. (a,d) Scheme in [19]; (b,e) proposed first scheme; (c,f) proposed second scheme. The top figures denote the normalized amplitude in the frequency domain. The bottom figures denote the normalized signal after azimuth coherent along range direction.
Electronics 12 02677 g008
Table 1. A ( t ) in Different Schemes.
Azimuth Time0PRT2PRT3PRT2n · PRT(2n + 1) · PRT
Scheme proposed in [19]111111
Proposed first scheme101010
Proposed second scheme1−11−11−1
Table 2. Simulation Parameters for a X-band SAR System.
ParameterSymbolValue
Carrier frequency f 0 9.6 GHz
Wavelength λ 0.0312 m
VelocityV7000 m/s
Azimuth bandwidth Δ f D o p 3100 Hz
Pulse repetition frequency PRF 4000 Hz
Antenna length L a 4 m
Azimuth duration T a 10 s
Range pulse bandwidth B r 80 MHz
Range pulse width T r 70 μs
Table 3. Sentinel-1 Data Parameters.
ParameterSymbolValue
Carrier frequency f 0 5.405 GHz
Pulse repetition frequency PRF 1650 Hz
Azimuth duration T a 15.3136 s
Range pulse bandwidth B r 50.6 MHz
Sampling frequency F r 56.3 MHz
Range pulse width T r 51.50 μs
Table 4. Image Disturbances and SNR Analysis in Sentinel-1 Data Experiment.
SchemeImage DisturbancesSNR of RX Signal
MeanMax
Scheme proposed in [19]−31.7 dB0.0019 deg.−18.4 dB360 deg.26.8 dB
Proposed first scheme−34.4 dB0.0017 deg.−19.6 dB360 deg.29.8 dB
Proposed second scheme−35.8 dB0.0012 deg.−20.5 dB360 deg.36.0 dB
Disclaimer/Publisher’s Note: The statements, opinions and data contained in all publications are solely those of the individual author(s) and contributor(s) and not of MDPI and/or the editor(s). MDPI and/or the editor(s) disclaim responsibility for any injury to people or property resulting from any ideas, methods, instructions or products referred to in the content.