1. Introduction
Intravenous infusion has become a crucial means of modern clinical treatment. Infusion sets are widely used to deliver fluids to hospital patients, such as blood, drugs, or liquid nutrients [
1]. In the clinical treatment of intravenous infusion, the bag infusion set is often used to complete the task of sub-loading large-capacity liquids. The main difference between a disposable bag infusion set and a traditional disposable infusion set lies in the addition of the liquid bag assembly part, and a complete liquid bag assembly primarily consists of a liquid bag body, lanyard, liquid inlet catheter, effluent catheter, dosing interface catheter, and dosing interface. In addition, two kinds of liquid bag components are derived from the bag infusion set in two application scenarios: Single-insertion liquid bag components and double-insertion liquid bag components. The difference lies in the length of the liquid inlet catheter of the liquid bag components, and the two types of liquid bag components are shown in
Figure 1.
Because the quality of the products of drugs and medical devices related to intravenous infusion is associated with the safety of patients, pharmaceutical and medical device manufacturers pay great attention to the quality of their products. The components of the bag infusion set and liquid bag assembly often have two defects in the production process: Missing lanyards and missing dosing interfaces, collectively called missing pipeline defects in this paper. At present, the factory detects both defects via human sight, which increases the labor cost for the enterprise, reduces the automation level of the bag infuser in the production process, and increases the difficulty of building a digital factory. The two defects and the factory manual visual inspection of defects are shown in
Figure 2.
Using new technologies to replace manual visual inspection is imminent to reduce companies’ personnel costs and increase the efficiency of bagged infuser production. Machine vision is rapidly growing due to faster GPU computer hardware development. Machine vision further expands its application areas outside the manufacturing, security, and medical fields [
2].
For instance, machine vision technology is often used in PCB defect detection in the electronic circuit industry [
3]. Machine vision technology is often used in the detection of tool defects in industrial machine tools [
4]. Machine vision technology is also used in the pharmaceutical industry to ensure that patients receive the specified quality of drug treatment [
5]. At the same time, machine vision also has related research on defect detection of liquid drug containers [
6].
The application of machine vision in quality inspection related to intravenous infusion and medical devices primarily focuses on detecting impurities in pharmaceutical solutions and the surface quality of pharmaceutical packaging. For example, Akira Ishii et al. used unique illumination methods and appropriate imaging optics to observe foreign objects in plastic bottles of pharmaceutical fluids as black or bright spots in diffuse background illumination, based on which a machine vision-based real-time image processing method for foreign objects in plastic bottles of pharmaceutical liquids was realized [
7]. Li Yangguo et al. used a mechanical movement to determine a motion difference between the foreign body in the I.V. solution and the background while using an optical imaging system to obtain the target motion sequence image and finally used an Image processing algorithm to complete the foreign body detection of I.V. solution products [
8]. Ji Ge et al. used an improved PCNN to segment the different images of foreign objects in the injection solution, judged the presence of foreign objects in the injection solution based on the continuity and smoothness of the foreign object trajectory, and finally developed an intelligent foreign object detection machine for injection solution [
9]. Zhou Bowen et al. used the method of quadratic difference and energy accumulation to obtain the smallest possible targets of motion in pharmaceutical injections. Moreover, they proposed a support vector machine-based bubble and visible foreign body classification algorithm to detect the tiny visible foreign bodies within the injectable solution based on the above two aspects [
10].
Wang Yaonan et al. ensured the foreign body detection machine strictly followed the improved “rotation, sudden braking, video tracking” process to reduce the effect of bubbles, then applied the improved PCNN Tsallis Entropy to segment the difference images, and finally determined the presence of foreign bodies in the injection solution based on the continuity and smoothness of their traces. Ultimately, they could decide if there was a foreign body in the injection based on the continuity and smoothness of the paths [
11]. Yao Qin designed a reflection illumination method with lateral illumination to increase the contrast between the ampoule and the foreign body in it and investigated a two-stage frame difference method with the sub-pixel alignment of image sequences to extract small target traces under the auxiliary background interference to detect the foreign body in the ampoule solution effectively [
12]. Yang Shuang et al. proposed a probabilistic threshold segmentation and Kalman filter prediction method for the online detection and tracking of visible foreign objects in ampoule solution, which meets the requirements of online detection regarding speed and accuracy [
13]. Ge Ji et al. applied supervised learning and used various features such as the area of impurities, average gray value, geometric invariant moment, and wavelet packet energy spectrum to generate feature vectors to classify foreign particles in the injection solution in ampoules effectively [
14].
In the literature [
15], liquid bag defect detection was studied, and the paper focused more on the comparison of light experiments as a way to obtain better backlight angles and light intensities and proposed a correction algorithm for adaptive gamma rays. In this paper, new ideas for detection algorithms are presented.
This paper takes a bag infusion set as the basis. We studied the detection methods of missing defects of liquid bag lanyards and missing defects of the liquid bag dosing interface and introduced machine vision technology to detect defects in fluid bag assembly.
2. Image Acquisition Platform Design
The two defects studied in this paper are located at the inlet end of the liquid bag assembly, primarily composed of a lanyard, liquid inlet catheter, dosing interface catheter, and dosing interface. These parts are directly or indirectly connected to the bag body through thermal bonding and bonding. Since the lanyard needs to be bent by a robot when thermal bonding, the dosing interface also needs to be clamped by the manipulator, often because the clamping is not in place, the hot die contact is poor, the positioning is not correct, and for other reasons, resulting in the production of liquid bag assembly lanyard with one end missing, a missing lanyard, and a missing dosing interface. We proposed using use one camera to collect images of the lanyard and dosing interface simultaneously and then determine whether they are missing. However, the lanyard will rotate during the clamping process, so the lanyard has elastic potential energy around the axis. When the two ends are fixed, the elastic potential energy causes the lanyard to rotate from the horizontal plane to the vertical plane. Finally, this leads to the lanyard and the dosing interface not existing in one flat plane. The images of both parts cannot be collected simultaneously by one camera. As shown in
Figure 3, the lanyard rotates from horizontal plane 1 to vertical plane 2, and the dosing interface is in horizontal plane 1.
To summarize, in order for a camera to collect both the lanyard and dosing interface images and observe and analyze the characteristics of the existing production line, we found that although the form of the lanyard will change, it and other pipe parts are beyond the edge of the belt and hang in the air at the same time. Moreover, to realize the online detection target of the automated production line for these two defects, a clamping mechanism was added to the line to complete the fixation of the lanyard. The agency primarily consists of two air cylinders and two high-transparent glass plates. One high-transparent glass plate is fixed on the edge of the conveyor belt support as the bottom plate of the pipeline part, and one is connected in series with two cylinders, which can complete vertical and horizontal movement and then fix the lanyard, dosing interface, and other pipelines between the two glass plates. The light source selects the backlight to shine upward from under the bottom glass plate, and the camera is fixed vertically downward above the upper glass plate. The specific design diagram is shown in
Figure 4.
In this study, in the beginning, the original production line still operates around the clock, and it is not easy to stop for research transformation. This paper built a simple experimental platform. The experimental platform structure is generally similar to the design; it simply changed from testing four liquid bag components to testing one at a time. The testing platform built is shown in
Figure 5.
In the actual operation, cylinder 1 first drives upper transparent glass 3 to move in the vertical plane, and then cylinder 2 drives highly transparent glass 3 to move in the horizontal plane so that the lanyard that may deviate from the horizontal plane is re-pressed in the horizontal plane. Highly transparent glass 4 is the bottom plate, light source 5 provides the image acquisition illumination condition, and camera 6 completes the image acquisition.
The image quality captured by the camera will directly affect the defect detection result. By analyzing the geometric dimensions and surface characteristics of the pipeline part of the liquid bag assembly, the HIK ROBOT MV-CA032-10GM camera and the HIK ROBOT MVL-KF1628M-12MP lens are selected. Their central performance is shown in
Table 1. Other major hardware facilities related to the experiment include the CPU: Intel(R) Core(TM) i5-7400, with memory of 16 GB.
3. Research Methods
In this section, firstly, based on the analysis of the characteristics of the liquid bag pipeline, the corresponding detection strategy of the channel’s missing defects is developed. Then, research on relevant vision algorithms is carried out according to the developed defect detection strategy. Finally, the specific algorithm research on the pipeline of missing defects detection of the liquid bag component of the bag infuser is completed.
3.1. Defect Detection Strategy Research
Through the experimental platform built in the previous section, we collected the image of the pipeline part of the liquid bag assembly. A defect-free image of the pipeline part of the fluid bag assembly is shown in
Figure 2d. We roughly divided the image of the pipeline part of the liquid bag into the image background composed of the light source and the image target consisting of the fluid bag assembly. The lower part of the image target was primarily composed of the liquid bag sealing edge. Due to the various irregular statuses formed during the edge-sealing thermal-bonding operation and the unheated part reserved on the edge of the bag, the image of this part appeared to contain many lines; still, the outline of this part was visible while essentially in a connected state. The middle and upper parts of the image were the areas where the pipeline at the inlet end of the liquid bag assembly is located. With the exception of a few pixels used to express the pipeline information, most of the pixels were used to describe the background composed of light sources. Similarly, the outline of the pipeline was also clearly visible and essentially in a connected state. However, the outline’s internal information on the pipeline could be irregular. There was only no clutter at the edge of the liquid bag.
In machine vision, the template-matching method is the standard method to detect whether parts have missing parts [
16]. That is, the image undergoes a series of image pre-processing steps, which separate the image background, extract the image target, compare it with the standard image target, and judge whether it is consistent with the standard parts according to the similarity of the comparison. However, the research object in this paper presents a state of being soft. During the operation of the production line, even the same liquid bag component cannot always remain in the same shape on the production line, which leads to the fact that even the images taken with the same liquid bag component running twice on the production line are not necessarily successfully judged when the template matching is finally performed. Therefore, this paper’s detection of missing pipelines could not use the template matching method.
Because the outline of the pipeline can be seen easily when the naked human eye observes the collected image, it is not difficult to conclude that the number of pipeline outlines is closely related to the number of pipelines. For this reason, this paper intended to deduce the number of channels by judging the number of contours of the pipeline area and to deduce whether the pipeline is missing by considering the number of pipelines. Observing the image again, we determined that regardless of how the pipeline part oscillates, the lanyard contour of a complete liquid bag assembly can be approximated as a semi-circular ring, and the rest of the pipeline contour can show a vertical direction trend. If we traverse the whole picture horizontally, we can always find the outline of the other pipeline contour in the vertical direction except for the dosing interface. Therefore, we located the area, counted the number of vertical strike outlines, and determined if the lanyard was missing. In the case of the dosing interface, because of the difference between the inlet pipes of the two types of liquid bags and the possible deformation of the lanyards, when traversing the whole image, a region with a fixed category of contours and the number of outlines including the dosing interface cannot always be found. For this problem, this paper proposed that the area of the dosing interface is roughly located separately and that only the number of contours of the dosing interface be calculated. As shown in
Figure 6a, the green shapes in the red box all present a vertical state and are used to determine whether the lanyard is missing. The green outline in the blue box is the outline of the dosing interface, which is used to judge whether the dosing interface is missing.
The two types of missing defects are used in different areas to judge the number of contours, so they cannot be tested simultaneously during the inspection. At the same time, through field research in the factory, we learned that the factory treats the two kinds of pipeline defects differently in post-processing methods. For a missing lanyard, because it is not easy to repair the liquid bag components by manual thermal bonding, such defective parts are directly scrapped and recycled. For the missing dosing interface, the dosing interface can be glued by hand to keep the liquid bag assembly intact, and such defective parts will not be scrapped directly and belong to semi-finished products. Based on the different post-processing in the plant, we formulated a detection strategy in which the missing lanyard is first detected. If a lanyard was missing, the pipeline detection procedure was directly ended. Otherwise, the detection of the missing dosing interface was carried out. In summary, the detection strategy determined in this section is shown in
Figure 6b.
3.2. Contour Extraction Study
Through the discussion in the previous section, a defect detection strategy using the number of pipeline contours to determine the number of pipelines and, thus, whether pipeline deficiency occurs was developed. Still, unlike human vision, which can easily observe the shapes in an image, the quality of the image in digital image processing will directly affect the difficulty of extracting the image contours. In this subsection, specific algorithms for contour extraction are developed through comparative experiments. The pre-processing image scheme was finally selected by combining comparative experiments based on the actual effect of edge detection and the pre-reached goals.
3.2.1. Study of Edge Extraction Algorithm
The contour is the place where two regions meet in a digital image. Contour extraction starts with finding the edge information in the picture and then converting the edge information to contour. The edge information is also where the gray transform is intense in the digital image [
17]. Using some calculation methods, we can obtain the relevant set of edge pixels in the image [
18]. The edge detection algorithm uses the edge detection operator and image convolution operation to obtain a series of gradient information. Generally, the gradient is divided into two directions: Vertical and horizontal. Therefore, to obtain the gradient information of the whole image, the gradient in the two directions will be summed, and finally, the desired gradient will be filtered according to the gradient threshold set. The common edge detection operators are the Roberts, Prewitt, Sobel, and Canny operators. In this paper, we used the Canny operator.
The Canny operator is a classical image edge detection method with a short operation time and a relatively simple computation process [
19,
20,
21].
The steps of the implementation of the Canny operator are:
Transforming the image into a grayscale image.
Applying Gaussian filtering to smooth the image and remove the noise.
Applying kernel convolution on the x and y axes and using the kernel to calculate the gradient magnitude.
Applying non-maximum suppression techniques.
Applying a double-thresholding approach to determine the possible boundaries.
Using hysteresis techniques to track the edges.
The Canny operator is a complete edge detection algorithm with strong anti-interference capability. It can detect both powerfully transformed edges and weakly transformed edges separately because it uses two different thresholds for edge detection. It determines whether the weak edges should be retained by judging whether there is a connection between the weak and strong edges.
However, it is not sensible to extract the contour directly from the edge image at present because the Canny algorithm edge image contains a great deal of irrelevant edge information at this time, so we hoped to eliminate the disturbing edge information in the pipeline region through certain pre-processing methods and then carry out Canny algorithm edge detection and, finally, contour extraction.
3.2.2. Image Pre-Processing Study
Through the edge information of the pipeline region extracted using the Canny edge detection operator above, a great deal of interference edge information appears, some distributed on the background of the light source and some inside the pipeline contour. Due to the dual-thresholding mode of the Canny algorithm, this edge information also allows some weak interference edges with slight gradients to be retained. This phenomenon behaves differently on different images even if the same double threshold is used. Suppose the weak interference edges can be separated from the target boundaries; in that case, the double-thresholding selection of the Canny operator will be much easier, and the fragile interference edges can be prevented simultaneously. At the same time, we observe the morphology of all the interference edges and compare them with the pipeline contour. These edges, as a whole, are short, which can be considered image noise in these places in the grayscale map, and the study of image noise will also help us to process this interference information. We proposed using the methods of “filtering” and “thresholding” to process the image before edge detection. Filtering deals with image noise; threshold segmentation is used to segment solid and weak edges in advance. The method of combining these methods needs to be verified and selected by experiments. First, various algorithms involved in verification are discussed.
Filtering is often used to deal with image noise, such as common salt, Gaussian, Poisson, etc. In this paper, interference edge information is also regarded as noise, which can be considered unnecessary information noise in image processing. Moreover, image filtering is used to remove the noise of the image under the condition that the detailed features of the image can be retained, and its processing effect has a specific influence on the subsequent processing of the image [
22]. Depending on the image noise, there are many different filtering methods. Still, because the type of noise in this paper is challenging to judge, experiments will be conducted using several standard filtering algorithms and, finally, we decided which filtering algorithm to use. The traditional filtering methods are mean filtering, median filtering, and Gaussian filtering. They all go through the whole original image by specifying a template matrix and then processing the pixel values of the original image covered by the template matrix according to their separate ways and replacing the midline point pixel values of the coverage of the template matrix with the results.
Image thresholding is a common technique in image segmentation, which uses the grayscale difference between the target region and the background region in the grayscale image of the original image conversion [
23] and selects a threshold value. As the image grayscale segmentation occurs, it divides the grayscale image into two parts by two different grayscale values instead. It completes the segmentation of the image target and background. This paper uses the Otsu algorithm to determine the threshold value automatically. The idea is to seek a threshold value that makes the grayscale interclass variance between the segmented target and background the largest [
24].
This paper used VisualStudio2017 to write an algorithm based on C++. Three main combined algorithms were used to process the original grayscale image: Three kinds of filtering + Canny, three kinds of filtering + binarization + Canny, and direct binarization + Canny. The average time spent for each of the three filtering algorithms was calculated. During the experiment, the overall goal was to detect all the pipeline edge information. The secondary objective was to exclude the interference edge information to adjust each filtering algorithm’s processing kernel size and the Canny algorithm’s double threshold size. The final experimental results are shown in
Figure 7 and
Figure 8.
From
Figure 7a–c, it can be obtained that, compared with the three filters, Gaussian has almost no effect on removing the image noise identified in this paper and the median filter and mean filter are better at removing the interference edges outside the pipeline, but a mean filter is not as good as a median filter for the edge information inside the channel, while all three filters cannot remove all the interference contours. In
Figure 7d–f, after adding the threshold segmentation algorithm to the filtering operation and edge detection, combining mean and median filters and binarization can remove various interference edge information in the pipeline area well. Still, their edge information has different degrees of deformation than the original picture contour. Combining the Gaussian filter and binarization does not cause too much deformation but cannot remove the interference edge information inside the pipeline. Although the variety of Gaussian filtering and binarization does not cause too much distortion, it still cannot remove the interference edge information inside the pipeline. Finally, comparing
Figure 7a–e, we can see that Canny edge detection after mean filter + binarization and median filter + binarization can obtain the image edge information containing only the pipeline contour. Although both have a certain degree of distortion, the median filter is more severe than the mean filter. However, the edge direction remains unchanged, which meets the image requirements of the detection strategy. At the same time, from
Figure 8, comparing the time consumed by each filtering algorithm, we can see that the time consumed by mean filtering is much less than that of median filtering. Therefore, the best preprocessing scheme for contour extraction is mean filtering and Otsu binarization for grayscale images.
3.2.3. Study of Contour Extraction Algorithm
Through the discussion and research in the previous two subsections, we can now obtain edge images consisting of discontinuous edges from grayscale images, which cannot be individually located to a single continuous contour. In this paper, based on the edge detection images obtained from the literature [
25], two algorithms have been introduced in the literature to achieve contour extraction. The algorithm’s results can produce a collection of pixel point locations containing multiple segments composed of contours. According to this location information, we used different colors to indicate the different shapes detected, and all the outlines are drawn in one image. The results are shown in
Figure 9a, thus completing the task of contour extraction of the entire image, and the set of contour points can help us to carry out subsequent delineation detection. Later, the relevant regions of interest will be delineated using the relevant location information of these contour points. The number of contours will be detected simultaneously. The flow chart of the contour extraction algorithm is shown in
Figure 9b.
3.3. Contour Number Detection Study
In the first section of this chapter, we clarified that the defect detection strategy can be divided into two significant steps: Contour extraction and contour number judgment. In the second section, we studied the contour extraction algorithm in detail and finally obtained all the contour point sets of the pipeline image. On this basis, this section will delimit the ROI of the lanyard and dosing interface through the corresponding geometric features of each profile and finally realize the number of contour judgments to achieve missing detection.
3.3.1. Adaptive ROI Acquisition
The extraction of contours is performed through the FindContours function of the OpenCV library [
26] with the specific parameters RETR_EXTERNAL and CHAIN_APPROX_NONE [
25]. The function obtains a collection of contours, each of which is, in turn, a point set containing only the location information of the image contours. The location information that these points represent cannot directly specify the lanyard ROI and the dosing interface ROI, and certain other features are needed to find the two ROIs. This paper uses information related to the external rectangles of the contours to help locate the two ROIs. It is easy to conclude from the observation that the contour lines of the pipeline part are primarily composed of five elements and their relative positions are determined. We can use the information related to the external rectangles of these contours to distinguish the different contours.
Figure 10 shows the extracted external rectangles of all contours, in which we will use rectangular boxes 1–5 to locate the pipeline contours and assist in ROI acquisition.
As can be seen from the figure, rectangle box 1 is always located in the upper left corner. The bottom edge of the rectangle box is just on the contour of the liquid bag sealing edge. Above the bottom edge is the pipeline contour area, so we can use rectangle box 1 to delineate the pipeline ROI, which is used for lanyard absence detection.
Similarly, rectangle box three is always located in the upper right corner. The rectangle box always contains the dosing interface, so we can use rectangle box 3 to delineate the dosing interface ROI.
The method of outlining the pipeline ROI is as follows: Traverse all contours, determine whether the coordinates of the upper left corner of the outer rectangle of the silhouette are (0,0) points, find rectangle box 1, subtract the offset ten from the height of the rectangle box 1 to obtain the height of the pipeline ROI, and ensure the upper left point of the pipeline ROI is the (0,0) point and the pipeline ROI’s width is the image’s width. The method to delineate the dosing interface ROI is as follows: To iterate all the contours, determine whether the coordinates of the upper right corner of the outer rectangle of the outline are (1099,0) points, find rectangle box 3 in which 1099 is the last pixel horizontal coordinate in one line of the image, move the upper left point of rectangle box 3 to the right by 100 pixels as the upper left point of the dosing interface ROI, subtract 200 pixels from the width of the rectangle as the dosing interface ROI width, and determine the pipeline ROI height is the dosing interface ROI height. The detection strategy first detects whether the lanyard is missing or not and then determines whether the two-way dosing area is missing or not. Therefore, the ROI of the pipe is extracted first, then the ROI of the dosing two-pass site is extracted, and the division of ROI is realized by the above method, as shown in
Figure 11. This subsection finally divides the pipeline ROI and the dosing interface ROI by judging the location characteristics of the contour set’s external rectangular box. The flow chart of the two ROI divisions is shown in
Figure 12.
3.3.2. Virtual Linear Method to Detect the Number of Pipelines
Following the defect detection strategy formulated at the beginning of this chapter, it is now possible to obtain the relevant pipeline ROI and draw the appropriate contour map. This section proposes the virtual straight-line method for the detection of the number of contours. The specific idea is to first rely on the extracted contour point set to draw a single-pixel-width contour map in the empty map and then use the pipeline ROI and dosing interface ROI to extract two images containing only the line contour and only the dosing interface in the contour map, draw a virtual straight line in the specified area of the image, and count the number of intersection points generated by the virtual straight line and the contour to determine the number of contours. The actual value obtained is compared with the theoretical value, and if the actual value is smaller than the theoretical value, it means there is a defect. The critical point of the virtual line is where to draw the virtual line and how to accurately calculate the intersection points and count the number of contours.
The horizontal coordinates and lengths of the virtual straight-line starting points for lanyard detection and dosing interface detection are well determined, with the horizontal coordinates representing column 0 of their respective ROI maps and the length being the width of the ROI image. The bottom edge of the pipeline ROI is obtained by offsetting a certain distance upward from the outline of the liquid bag seal, so the vertical coordinate of the virtual straight line for detecting the lanyard is obtained by subtracting an offset of 50 pixels from the height of the pipeline ROI map so that the virtual straight line in the lanyard ROI map can be drawn, as shown in
Figure 13a. Because the morphology of the lanyard is not consistent on each liquid bag, and thus some of the lanyard contours in the dosing interface ROI map contain varying heights, the virtual straight line in the dosing interface ROI map cannot use the image border as a baseline to specify the vertical coordinates of the starting point of the virtual straight line. The virtual straight line in the dosing interface ROI map then helps to locate the lanyard by the lanyard outline, using the pixel point with a 255 gray value that first appears in the first column of the dosing interface ROI map as the base point D, which must be the lanyard outline point. The vertical coordinate of the virtual straight-line starting point is obtained by subtracting an offset of 70 pixels from the base point’s vertical coordinate. The virtual straight line of the dosing interface ROI diagram is shown in
Figure 13b. The offset in implementing the virtual straight-line method is appropriate for the virtual straight line to appear in the middle of the corresponding area, which is obtained by summarizing a great deal of practical experience.
In image processing, lines are not drawn directly in the image. Rather, it determines the number of pixels contained in the specified area that are used to express the contours, i.e., the number of pixels with a gray value of 255, but this number does not represent the true number of contours. As shown in
Figure 14, in the ROI contour map we obtained, because the contour lines are closely connected, multiple pixels with a gray value of 255 sometimes appear in succession on the same line, and if this quantity is used directly, it cannot accurately represent the number of contour lines. Therefore, judgment is added to the pixel points with a gray value of 255. That is, a pixel point with a gray value of 255 is considered to be an intersection only when the previous pixel point has a gray value of 0 within the delimited straight line; otherwise, the number of intersection points is not increased.
4. Experiment and Analysis
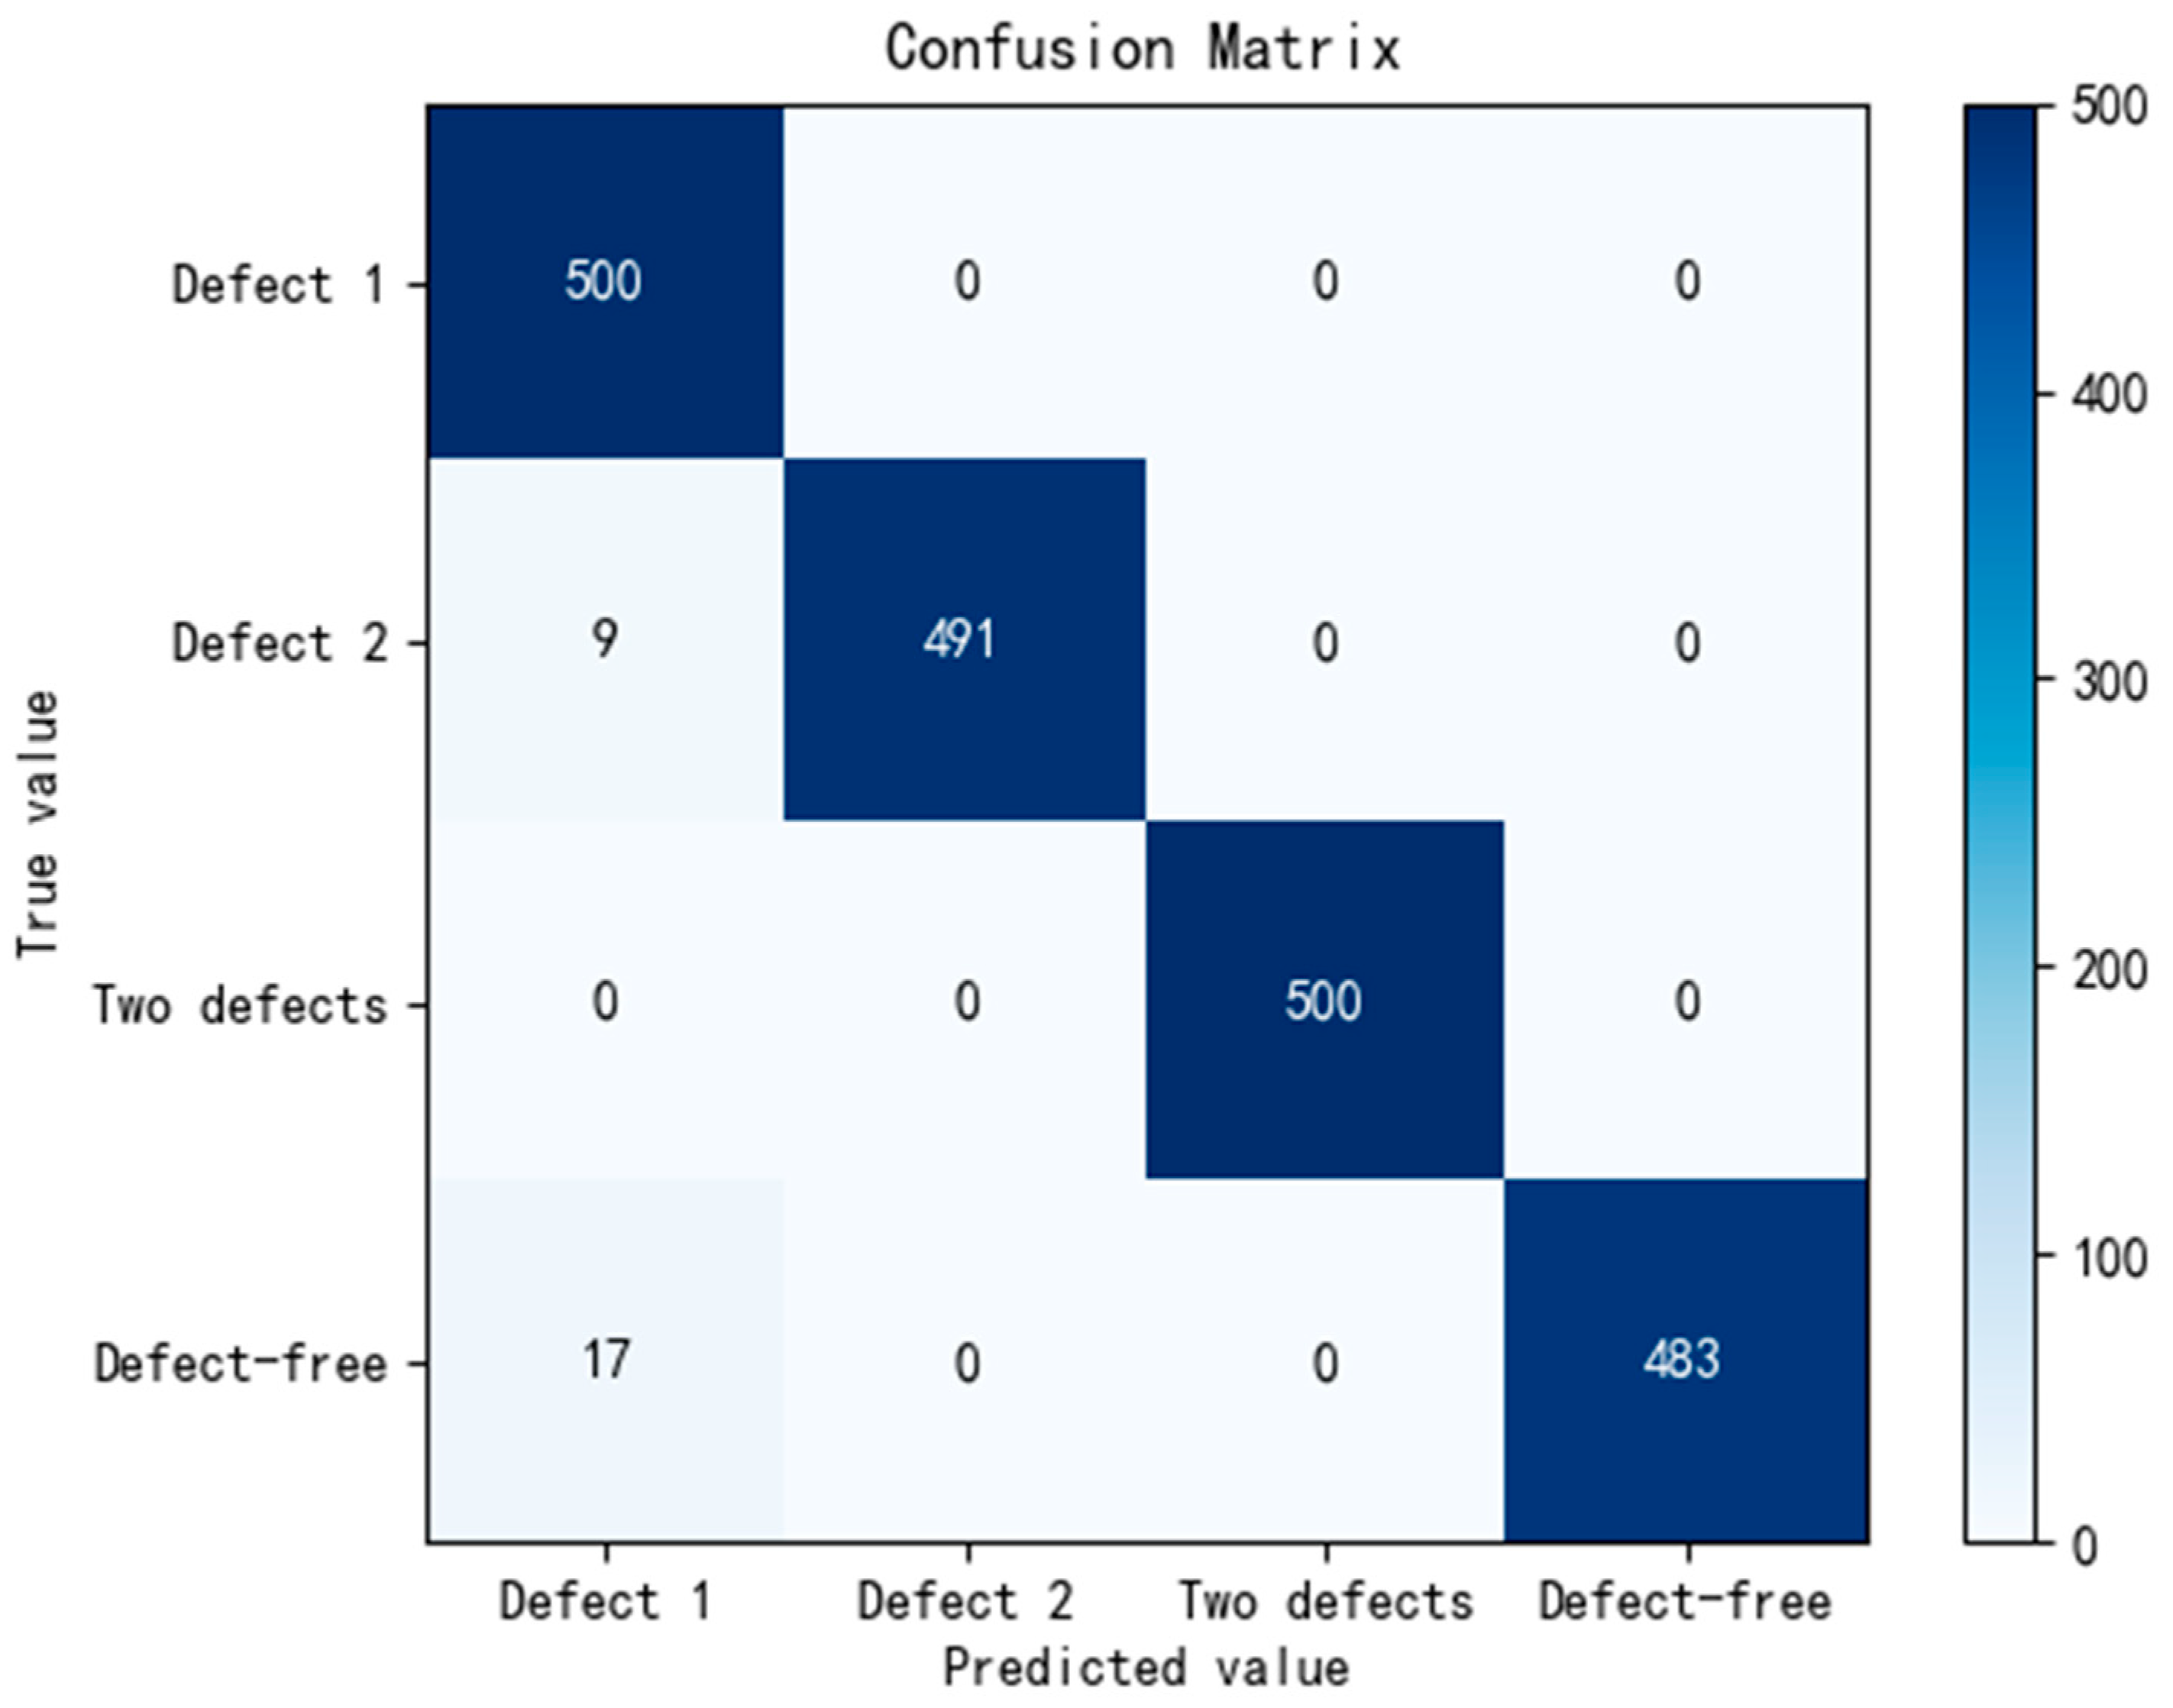
This section uses C++ language to call the OpenCV library in Visual Studio 2017 platform to build the pipeline missing detection algorithm. Based on the camera SDK programming, it calls the camera to capture images. The images are delivered to the algorithm detection interface for defect detection. The specific settings of the experiment are as follows: 500 missing lanyard liquid bag assemblies, 500 missing dosing interface liquid bag assemblies, 500 both missing lanyards and dosing interface fluid bag assemblies, and 500 defect-free liquid bag assemblies were selected. These 2000 experimental samples were mixed into the testing platform for image acquisition and image processing in turn, and the identification of the missing defects of each liquid bag assembly and the time from image acquisition to identification completion of each fluid bag assembly were recorded. The final test results of missing pipeline defects are shown in
Figure 15. The time curve of the system algorithm for detecting the 2000 missing pipeline defects is shown in
Figure 16.
Among the 2000 positive and negative samples tested for the detection of defective piping, the detection rate of bad piping was 100%. There was a 3.4% false identification rate for the defect-free liquid bag assembly and a 1.8% false identification rate for the defective dosing interface, as shown in
Figure 15. All of these incorrectly identified liquid bag assemblies were identified as missing lanyards. By tracing the contour map during the execution of the algorithm and comparing it with the real map, it was found that the contour of the gap formed between the two-way dosing line and the lanyard was very small. When using mean filtering plus binarization, the edge of this area is removed directly. The total number of contours becomes smaller, and the algorithm incorrectly judges that the lanyard is missing. The fundamental reason is that the liquid bag assembly was improperly preserved after being brought back to the laboratory, and the lanyard was seriously deformed during the experiment. At the same time, because the platform built in the laboratory cannot simulate the state of the conveyor belt clamping liquid bag body when the glass plate corrects the lanyard posture, it will drive the whole liquid bag offset. Finally, when the deformed liquid bag is pressed manually and tested again, all the wrong liquid bag components are detected correctly. As shown in
Figure 16, the maximum time required to detect pipeline defect of a liquid bag assembly is 438 milliseconds in a test of 2000 liquid bags; because the factory production line will generate four liquid bag assemblies at a time, the conversion time is 1.75 s for a set of four liquid bag assemblies. In contrast, the single station work time for producing a set of fluid bag assemblies in the factory production line is 8 s. The time-consuming algorithm proposed in this paper is less than the workstation time, and the defect detection rate is 100%, so the visual detection algorithm of missing pipeline defects studied in this paper meets the actual needs of the factory.
5. Conclusions
In this paper, regarding the two kinds of pipeline defects in the liquid bag assembly of the bag infusion device, a defect detection method based on machine vision was proposed, an image acquisition system was built, and the flattening of the liquid bag was analyzed and studied. According to the characteristics of the transparent liquid bag, the effects of different filtering and edge detection algorithms were discussed through comparative experiments, and the image preprocessing method of mean filtering + Otsu binarization was proposed. The virtual straight-line method and adaptive ROI region algorithm are proposed, and the possibility of using the algorithm to detect the missing pipeline of the liquid bag assembly of the bag infusion device was verified by experiments. This method can replace artificial naked-eye detection and automatically detect the two kinds of defects of liquid bag assembly, namely a missing lanyard and a missing dosing interface on the production line. The main conclusions are as follows:
- (1)
Using a specific image acquisition mechanism to assist the flattening liquid bag assembly and collecting through the camera, the image acquisition problem of the liquid bag assembly with an unfixed shape is effectively solved.
- (2)
Several algorithms, such as filtering, Otsu binarization, and edge detection, are discussed to solve the problem of the low contrast of transparent object images and the separation of the object and the background. Finally, an image preprocessing method of mean filtering + Otsu binarization is proposed.
- (3)
An adaptive ROI region selection method and a virtual linear scanning method are proposed to realize the detection of two kinds of defects. A defect detection rate of up to 100% can replace manual work to record during production and realize full automation of production inspection.


