Article

Reducing Red Light Running (RLR) with Adaptive Signal Control: A Case Study

1
School of Transportation Science and Engineering, Beihang University, Beijing 100083, China
2
Department of Mechanical Engineering, University of Michigan, Ann Arbor, MI 48105, USA
3
State Key Lab of Intelligent Transportation System, Beijing 100094, China
4
Zhongguancun Laboratory, Beijing 100094, China
*
Author to whom correspondence should be addressed.
Electronics 2023, 12(11), 2344; https://doi.org/10.3390/electronics12112344
Submission received: 3 April 2023 / Revised: 11 May 2023 / Accepted: 16 May 2023 / Published: 23 May 2023
(This article belongs to the Special Issue Recent Advances of Intelligent Transportation Systems in Smart Cities)

Abstract

:
Traffic accidents are a leading cause of premature death for citizens, with millions of injuries and fatalities occurring annually. Due to the fact that a large proportion of accidents are caused by red light running, reduction of the frequency of red light running (RLR) has been extensively researched in recent years. However, most of the previous studies have focused on reducing RLR frequency through driver education or warning sign design, with little attention paid to the relationship between RLR behavior and traffic signal control. Considering RLR is significantly affected by the number of vehicles arriving during yellow, it is possible to identify RLR behaviors in advance by analyzing data on yellow-arriving vehicles. Meanwhile, based on the strong correlation between yellow arriving and RLR frequency, it is possible to reduce RLR by traffic signal control. In this paper, we propose a quantitative model of correlation between RLR frequency and yellow light arrival based on high-resolution traffic and signal event data from Twin Cities, Minnesota. On this basis, the Non-dominated Sorting Genetic Algorithm-II (NSGA-II) is implemented to find trade-offs between minimizing the RLR frequency and the traffic delay. A case study of a 6-intersection arterial road reveals that in unsaturation, saturation, and supersaturation flow, our approach can converge to a Pareto optimal front in 30–50 iterations, which shows that is possible to simultaneously reduce RLR frequency and enhance traffic efficiency safety, which is conducive to ensuring the life safety of traffic participants.

1. Introduction

Traffic accidents are one of the most significant reasons of casualties all over the world, which have already caused about 1.35 million deaths, and are becoming a global public health concern for all countries [1]. Because of the dense population, traffic accidents are frequent in urban roadways, which make form a major research area for accident prevention [2,3]. As critical hubs in modern cities, signalized intersections are generally considered to be the most dangerous locations in a road network. According to the Federal Highway Administration (FHWA), approximately 50% of accidents causing casualties in the United States occurred at signalized intersections [4,5]. Recent studies indicate that red light running (RLR) is one of the most significant factors of traffic crashes at intersections [6,7,8]. On the one hand, RLR behavior leads to extra conflict points within intersections, and the RLR vehicle may collide with a vehicle of the previous phase. On the other hand, RLR vehicles usually have high velocity, which may increase the severity of the accident, and 928 people were killed and 116,000 people injured in crashes that involved red light running in 2020 in the U.S. [9]. Therefore, research aimed at reducing RLR frequency reduction has received lots of attention.
Many efforts have been devoted to developing appropriate strategies to reduce the frequency of RLRs. RLR enforcement is one of the most widely used methods to reduce the RLR frequency all over the world [9]. A straightforward way is to use RLR cameras to detect RLR behaviors, and the traffic police will give a corresponding penalty related to the severity of the RLR behavior, and much research has shown that RLR cameras significantly reduce RLR frequency [10,11]. However, some researches argue that RLR cameras may increase rear-end crashes [12]. Hence, it is not enough to only use enforcement methods for RLR reduction.
Apart from the enforcement method, some studies use warning signs for RLR frequency reduction, such as pavement markings [13], early warning signs [14], green flash [15], and countdown warning signal [16]. Others combine RLR cameras and warning signs; for example, red LED ground lights integrated with a traffic signal and RLR detection camera warning gantry are being utilized as effective tools to improve safety at signalized intersections [17]. Moreover, with the development of V2X communications, Intersection Collision Warning Systems (ICWSs) have been developed. These systems allow for the detection of vehicles’ speed and position, and drivers can receive messages about potential RLR risks to prevent RLR behaviors [18]. However, these methods have practical limitations in terms of warning accuracy and cost and may not be fully effective. Some researchers have analyzed general risky driver behavior, including RLRs, using machine learning methods to predict real-time risky driving behavior and crash severity and proposed a traffic accident risk assessment framework, helping drivers to know the risk in advance, which may help to reduce traffic crash and RLR behaviors [1,2,3].
In previous work, through high-resolution traffic and signal event data, we discovered a strong correlation between RLR frequency and traffic signals [19,20], i.e., RLR most likely caused by the dilemma zone stemming from unreasonable signal timing, as shown in Figure 1 [21,22]. When the set signal timing is unreasonable, the maximum distance that vehicles can travel during yellow may be shorter than the minimum stopping distance, leading to the formation of a dilemma zone. Drivers may face a difficult decision about whether to stop or go through, which may cause them to misjudge the start time of the red light and fail to control the vehicle speed reasonably, eventually leading to the occurrence of RLR [23,24].
Due to their excellent self-learning and adjustment capabilities, adaptive traffic signal control (ATSC) methods have been widely applied to traffic operation optimization in recent years. Since ATSC can adjust signal timing according to real-time traffic state, it also shows great potential in RLR behavior reduction. To this end, we establish a correlation model of correlation between RLR frequency and yellow arrival and develop a novel ATSC approach to reduce RLR frequency while ensuring efficiency. The contributions of this paper are listed as follows:
  • A quantitative model of correlation between RLR behaviors and yellow light arrival is established based on high-resolution traffic and signal event data from Twin Cities, Minnesota;
  • To reduce RLR frequency, a novel ATSC approach based on NSGA-II is developed;
  • We evaluate our approach using a real-world road network, and the results show that our approach can simultaneously reduce RLR frequency and enhance the efficiency of intersections.
The remainder of this paper is organized as follows: Section 2 reviews the related works. In Section 3, we complete RLR behavior identification using high-resolution data and propose a quantitative model of correlation between RLR and yellow light arrival based on high-resolution data. A novel ATSC approach based on NSGA-II for the arterial road to reduce RLR frequency is introduced. Then, a case study of an arterial road with five signalized intersections is presented to verify the effectiveness of our model in Section 4. Finally, we conclude the paper and discuss future research directions in Section 5.

2. Related Work

2.1. Identification of Red Light Running

As crashes resulting from RLR are frequent occurrences [25], which seriously threatens traffic safety, it is imperative to find effective ways to reduce RLR frequency for urban intersections. To achieve this purpose, the first task is to accurately identify the red light running behavior. Most current research relies on rare video detector data [26,27], making it challenging to collect enough RLR behavior data for both analyzing and building an identification model. To solve the problem of data scarcity from camera monitoring, some researchers proposed automatic detection of RLR using vehicular cameras [28]. However, these methods cannot identify and control RLR before it occurs, making it difficult to reduce the frequency of RLR at its source. In order to reduce the frequency of RLR at its source, it is necessary to identify RLR behavior in advance. Some studies have taken vehicle trajectory data, video detector data, connected vehicles data, etc., as a basis for training machine learning models or deep learning models for RLR prediction [29,30,31,32,33,34,35]. However, owing to the scarcity of RLR vehicle data, these models are difficult to train and hard to apply in practice.

2.2. Reduction of Red Light Running Frequency

Another urgent issue to find effective ways to reduce RLR frequency for urban intersections. Not surprisingly, many transportation professionals are dedicated to this issue and have generated many important research results. One approach to reduce RLR frequency involves the use of automated red light enforcement. By using a red light camera system, the intersection can be continuously monitored, and vehicles will be recorded when they pass the intersection during a red light. Previous studies have shown that red light cameras can substantially reduce the RLR frequency [10,11,25,36,37,38,39]. Besides, since RLR behavior is usually caused by the dilemma zones, traffic engineers have developed and refined the dilemma zones protection systems to reduce RLR frequency [26,40]. A straightforward way is to predict vehicle behaviors and impending signal phase and timing (SPAT) and match the signal phase with the arrival of the vehicle. For example, some researchers analyzed the effect of extending the length of the yellow cycle in signalized intersection to reduce conflict and RLR in high-speed traffic conditions [41], and a number of studies have found that extending the yellow phase is effective in RLR frequency reduction [42]. Other ways to reduce RLR is using additional roadside warning display screens, and a typical case is the Cooperative Intersection Collision Avoidance System (CICAS) constructed by the United States Department of Transportation [43]. In addition, using dynamic extension of all red intervals is an alternative way to reduce RLR; in other words, the all-red phase will be extended when a vehicle is about to run the red light, then an additional clearance time can be provided for these vehicles [44,45,46,47]. Moreover, a pavement marking with auxiliary countermeasure (PMAIC) was proposed where drivers can get appropriate suggestions to guide their driving behavior based on current vehicle speed such that RLR can be prevented in advance [48].

2.3. Traffic Signal Control for RLR Reduction

However, these methods are limited in warning accuracy or cost with regard to practical use and therefore fail to achieve a significant impact. To our best knowledge, research on optimizing signal control methods to reduce red light running (RLR) from upstream vehicles is rare, and most signal timing methods focus on enhancing only traffic efficiency based on real-time traffic data or traffic prediction results [49,50,51]. Only a few studies aim to reduce RLR behavior at isolated intersections, such as the signal timings method proposed by Collotta et al. based on the data of wireless sensor networks [52]. However, reducing the RLR frequency of arterial roads using adaptive traffic signal control methods has not been proposed in previous studies. This study quantifies the relationship between the RLR frequency and control factors, i.e., yellow arrival. In order to simultaneously enhance traffic efficiency and reduce RLR, traffic signal control can be modeled as a multi-objective optimization problem. The solution of this problem is not a point but a Pareto front of best trades-offs between RLR frequency and traffic efficiency aimed at reducing delays and RLR behaviors.

3. Methodology

3.1. RLR Identification Based on High-Resolution Data

Aiming to optimize signal phasing timing for RLR frequency reduction, it is important to identify control factors that are highly correlated with RLR frequency. In our paper, the high-resolution data of traffic signals and detectors were used to explore the relationship between RLR frequency and associated factors, i.e., yellow arrivals. In this section, the collection method of high-resolution traffic data is first introduced, and the way to identify RLR behaviors is then discussed. Statistically analysis of RLR data is then conducted, and we particularly focus on the quantitative relationships between RLR frequency and significant control factors.

3.1.1. Field Data Collection and RLR Identification

In this section, data analysis based on the data of high-resolution detectors and traffic signals recorded by the SMART-SIGNAL system is conducted. The system was developed at the University of Minnesota [53] and can continuously record the traffic signal phase and loop detector triggers. The loop detectors are located at 400 feet in the upstream of the stop line, and the stop-bar loop detectors are set right behind the stop-bar. We also installed link entrance detectors on major approaches. The yellow interval of the traffic signal is 5.5 s. In this research, approximately 8 months’ data collected from the arterial road of TH55, which located at Twin Cities, Minnesota, was used in this research. The format of data is shown in Figure 2, in which two types of data are included, namely detector data and traffic light data. Detector data are a record of the time, detector number, on/off status (vehicle arrive or leave), and time since the last activation of the detector. Traffic light data are a record of the time, phase, color of traffic light, and on/off status (with on representing the phase start and off representing the phase end). In Figure 3, both detectors and traffic light data were recorded, the type of devices can be distinguished by column 3, where D, G, and Y are the detector, green light, and yellow light, respectively, and the state will change if the vehicle arrives at the detector or the light changes it phase. If the device type is detector (D), when the state is off, the last column represents the vacant time of the detector before vehicle arrival, while when state is on, it represents the occupancy time of vehicle. The device type is green or yellow (G or Y), and when the state is off, the column of last time means duration of green or yellow light, while when state is on, it represents the duration before this light since last time this phase was used. For example, detector data 1 shows that a vehicle arrived at the No. 8 detector at 08:09:15.012 and the previous vacant time of the detector was 7.902 s, the traffic light data 1 shows that at 08:09:16.761, the green time of phase 3 ends, and the green time lasts 29.389 s in total.
The next step is to identify RLR based on the high-resolution data. Since the vehicles will be recorded when passed through the stop-line, when combined with the signal phase data collected from the SMART-SIGNAL system, the RLR can be easily identified. In order to verify the identification results, we check the downstream detectors to see if there is a corresponding record that matches the identification results. The detailed data extraction method has been published in our previous work [19,20]. We analyzed the high-resolution data collected from TH55 for five intersections over 8 months. The relationship between RLR frequency and yellow arrival was analyzed based on the RLR identification results.

3.1.2. The Yellow Arrival vs. RLR Frequency

In this section, we aim to quantify the correlation between RLR frequency and yellow arrival using high-resolution traffic and signal event data. Previous studies have shown that yellow arrival flow has a significant impact on the probability of RLR [54], and a related signal optimization method to reduce RLR for intersections was proposed. However, since the locations of advance detectors of the arterial intersections vary, the travel times (vehicles run from the advance loop to stop-bar loop) are different. As a result, vehicles that have the potential to run the red light may arrive at the advance detectors beyond the yellow time. To address this issue, we will focus on the influence of the arrival volume at the advance detectors for a period of time before and after the onset of yellow. The descriptive statistics used in this paper are listed in Table 1 for ease of understanding.
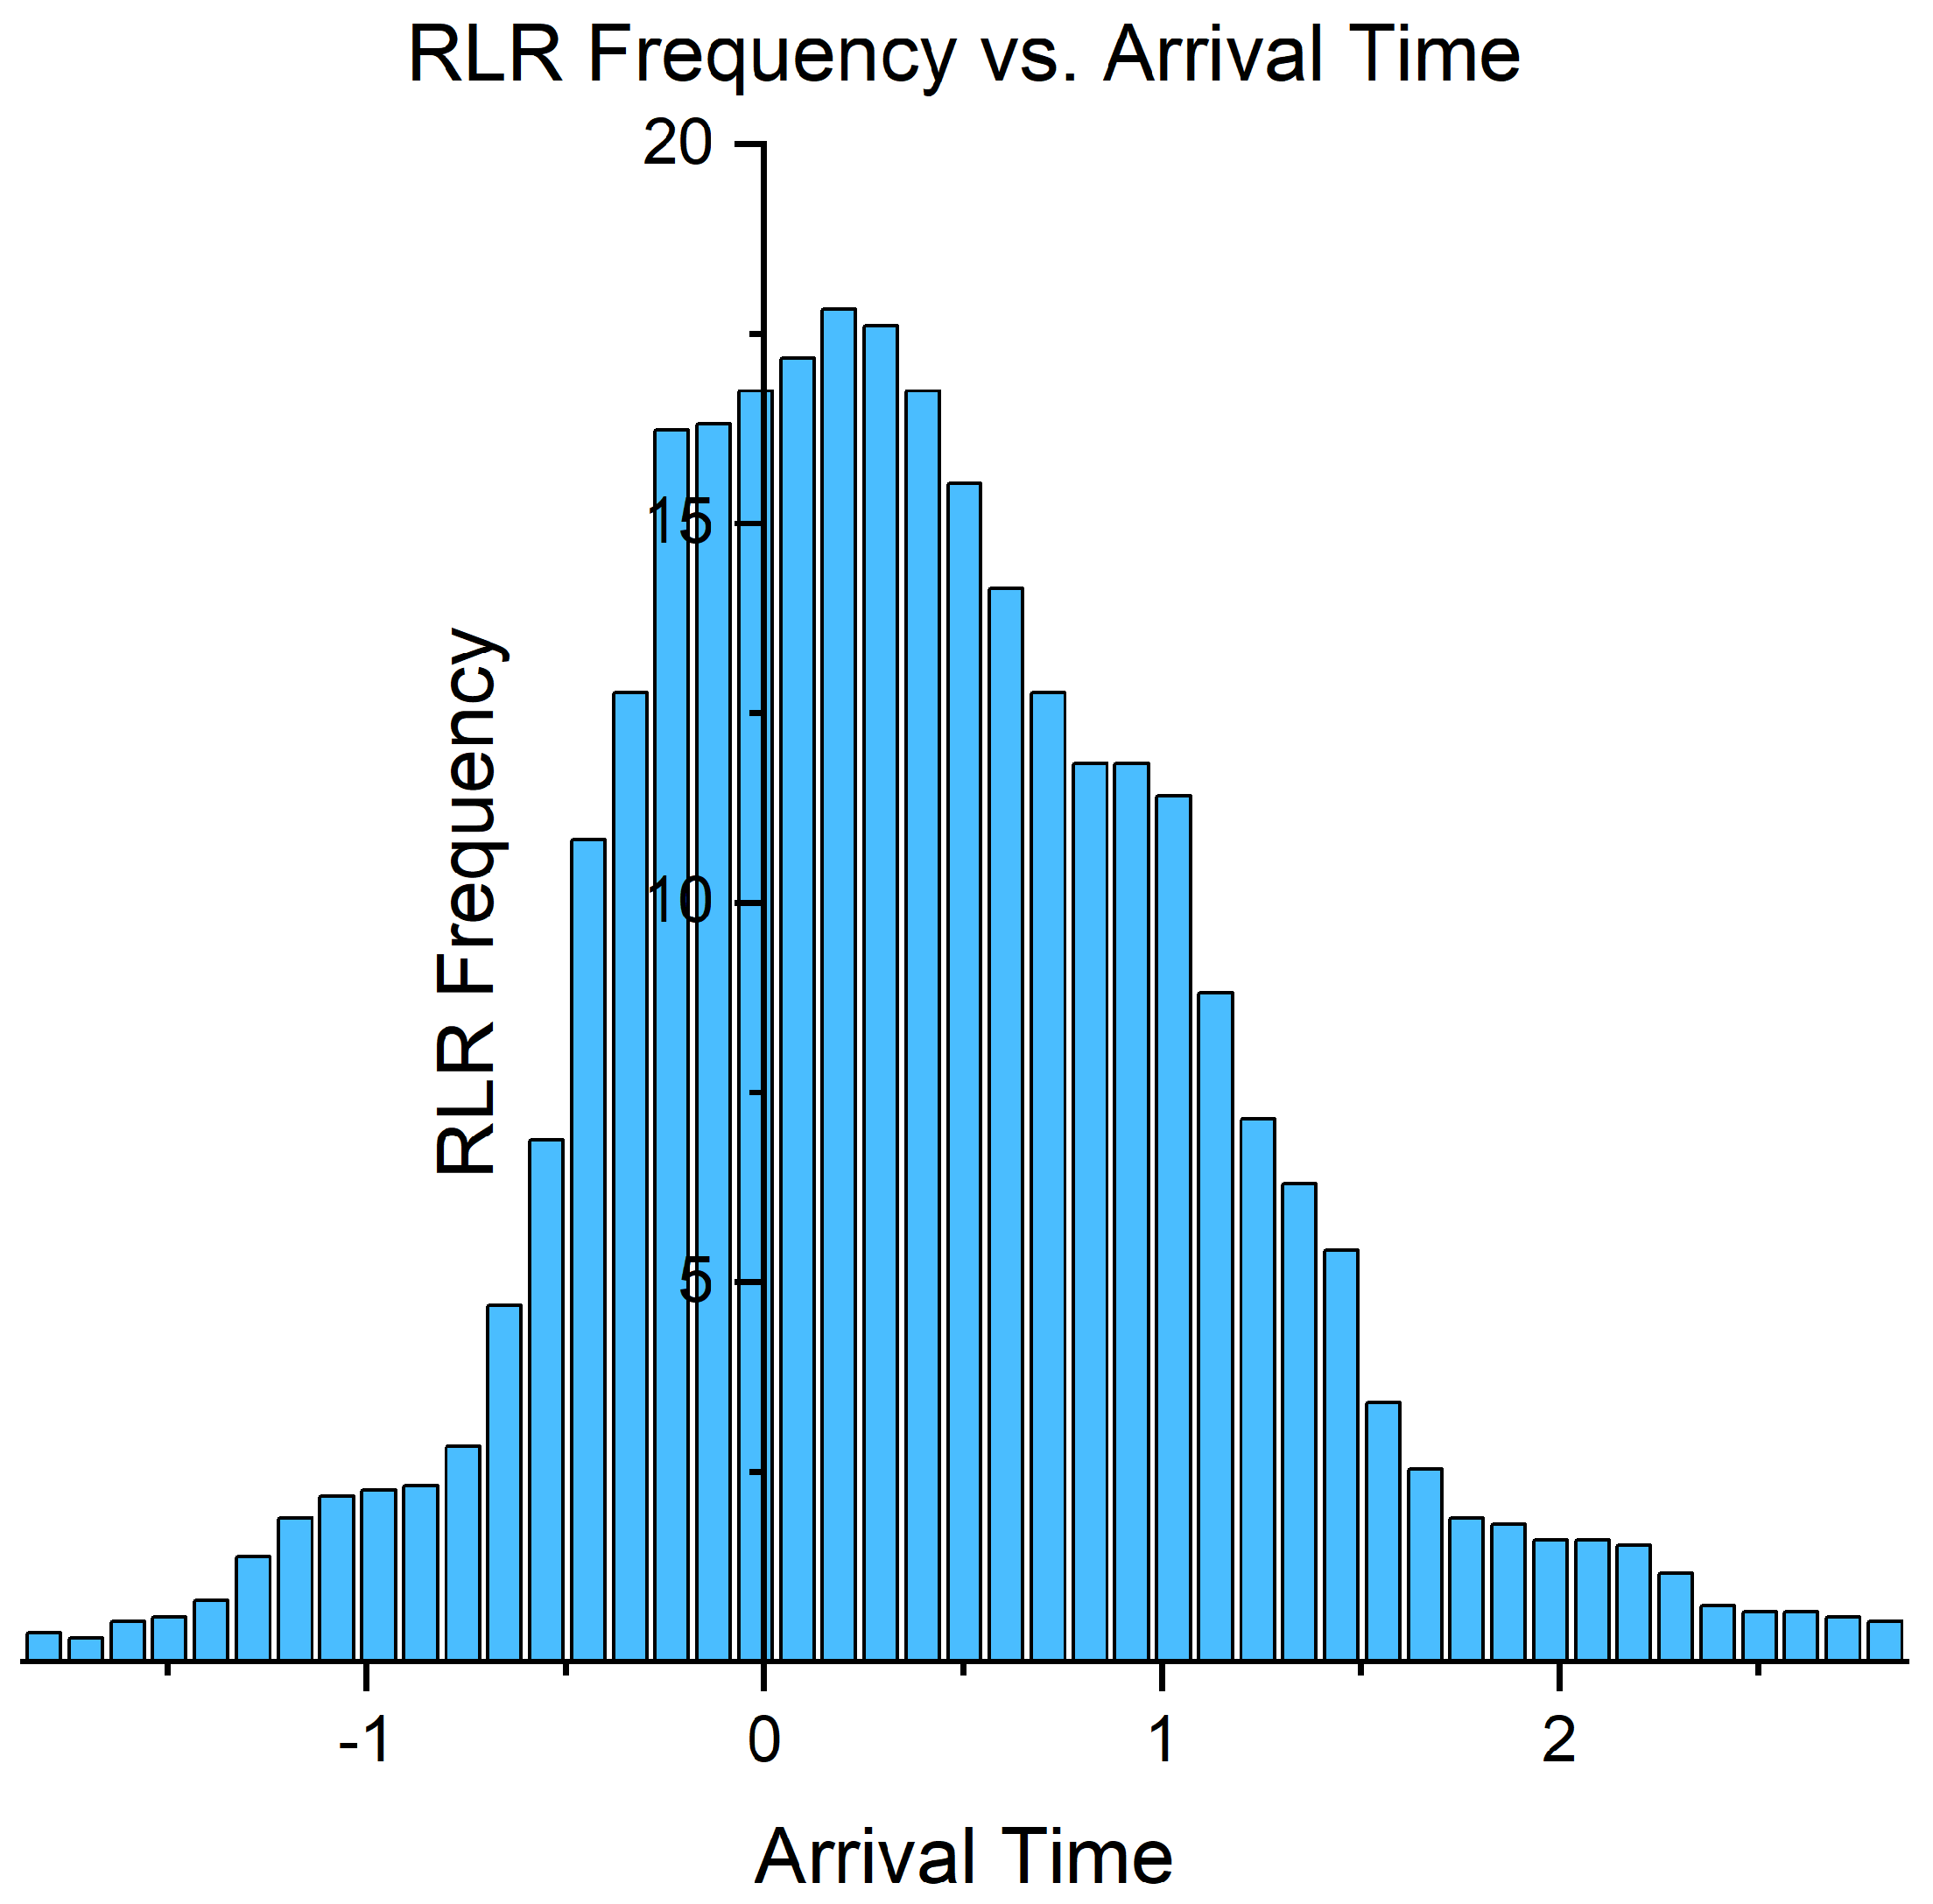
In this research, the RLR frequency is defined as the number of RLRs per thousand arrival vehicles (advance detectors). We divide the time into 0.2 s intervals. Based on the high-resolution traffic and signal event data, we collect the number of vehicles that arrive at the advance loop during each segment and identify the corresponding RLR vehicle numbers. Then, we plot a scatter graph of RLR frequency.
As depicted in Figure 4, five months of data for Int. Boone (see Figure 2 and Figure 3) are used in this research. In this figure, the X-axis describes the time of vehicles arrival at the advance detectors. The onset of yellow time is marked as 0. The Y-axis represents the RLR frequency, which is calculated by dividing the corresponding RLR numbers by the arrival vehicle numbers. Figure 4 shows that the majority of RLR vehicles arrive at the advance detectors during the interval [ t y 1 , t y + 2 ] , where t y represents the onset of the yellow time. Therefore, this finding indicates that if we can reduce the number of vehicles that arrive at the advance detectors during the interval, we could reduce the RLR frequency.
Based on the high-resolution data, a quantitative model of correlation between RLR and yellow light arrival was proposed. Using intersection 101 (Boone) as an example, the following nonlinear regression model is established:
Y B o o n e = k 1 + e ( a + b Q )
where, Y is the estimated frequency of running the red light at the intersection, and Q is the traffic flow to the section detector in a specific time period. For intersection 101, this specific time period is [ T O n e s t Y 2 , T O n e s t Y + 3 ] , T O n e s t Y is the time when the yellow light starts, and k,a,b is the corresponding regression coefficient. For intersection 101, we selected the red light running frequency from a 10 month period as the sample, and using the Levenberg–Marquardt method, we estimate the parameters of the nonlinear regression model to obtain the nonlinear regression model of intersection 101, and the results are shown in Table 2. The result of T-test and single sample K-S test shows that the residual follows a normal distribution with the mean value of 0.0. Moreover, the results of ANOVA test show that the nonlinear regression model proposed in this paper has a good degree of fit to the observed values, with R 2 of 0.754. The results also show that the frequency of red light running at intersections can be predicted based on the traffic flow arriving at the road detector in a specific time period.
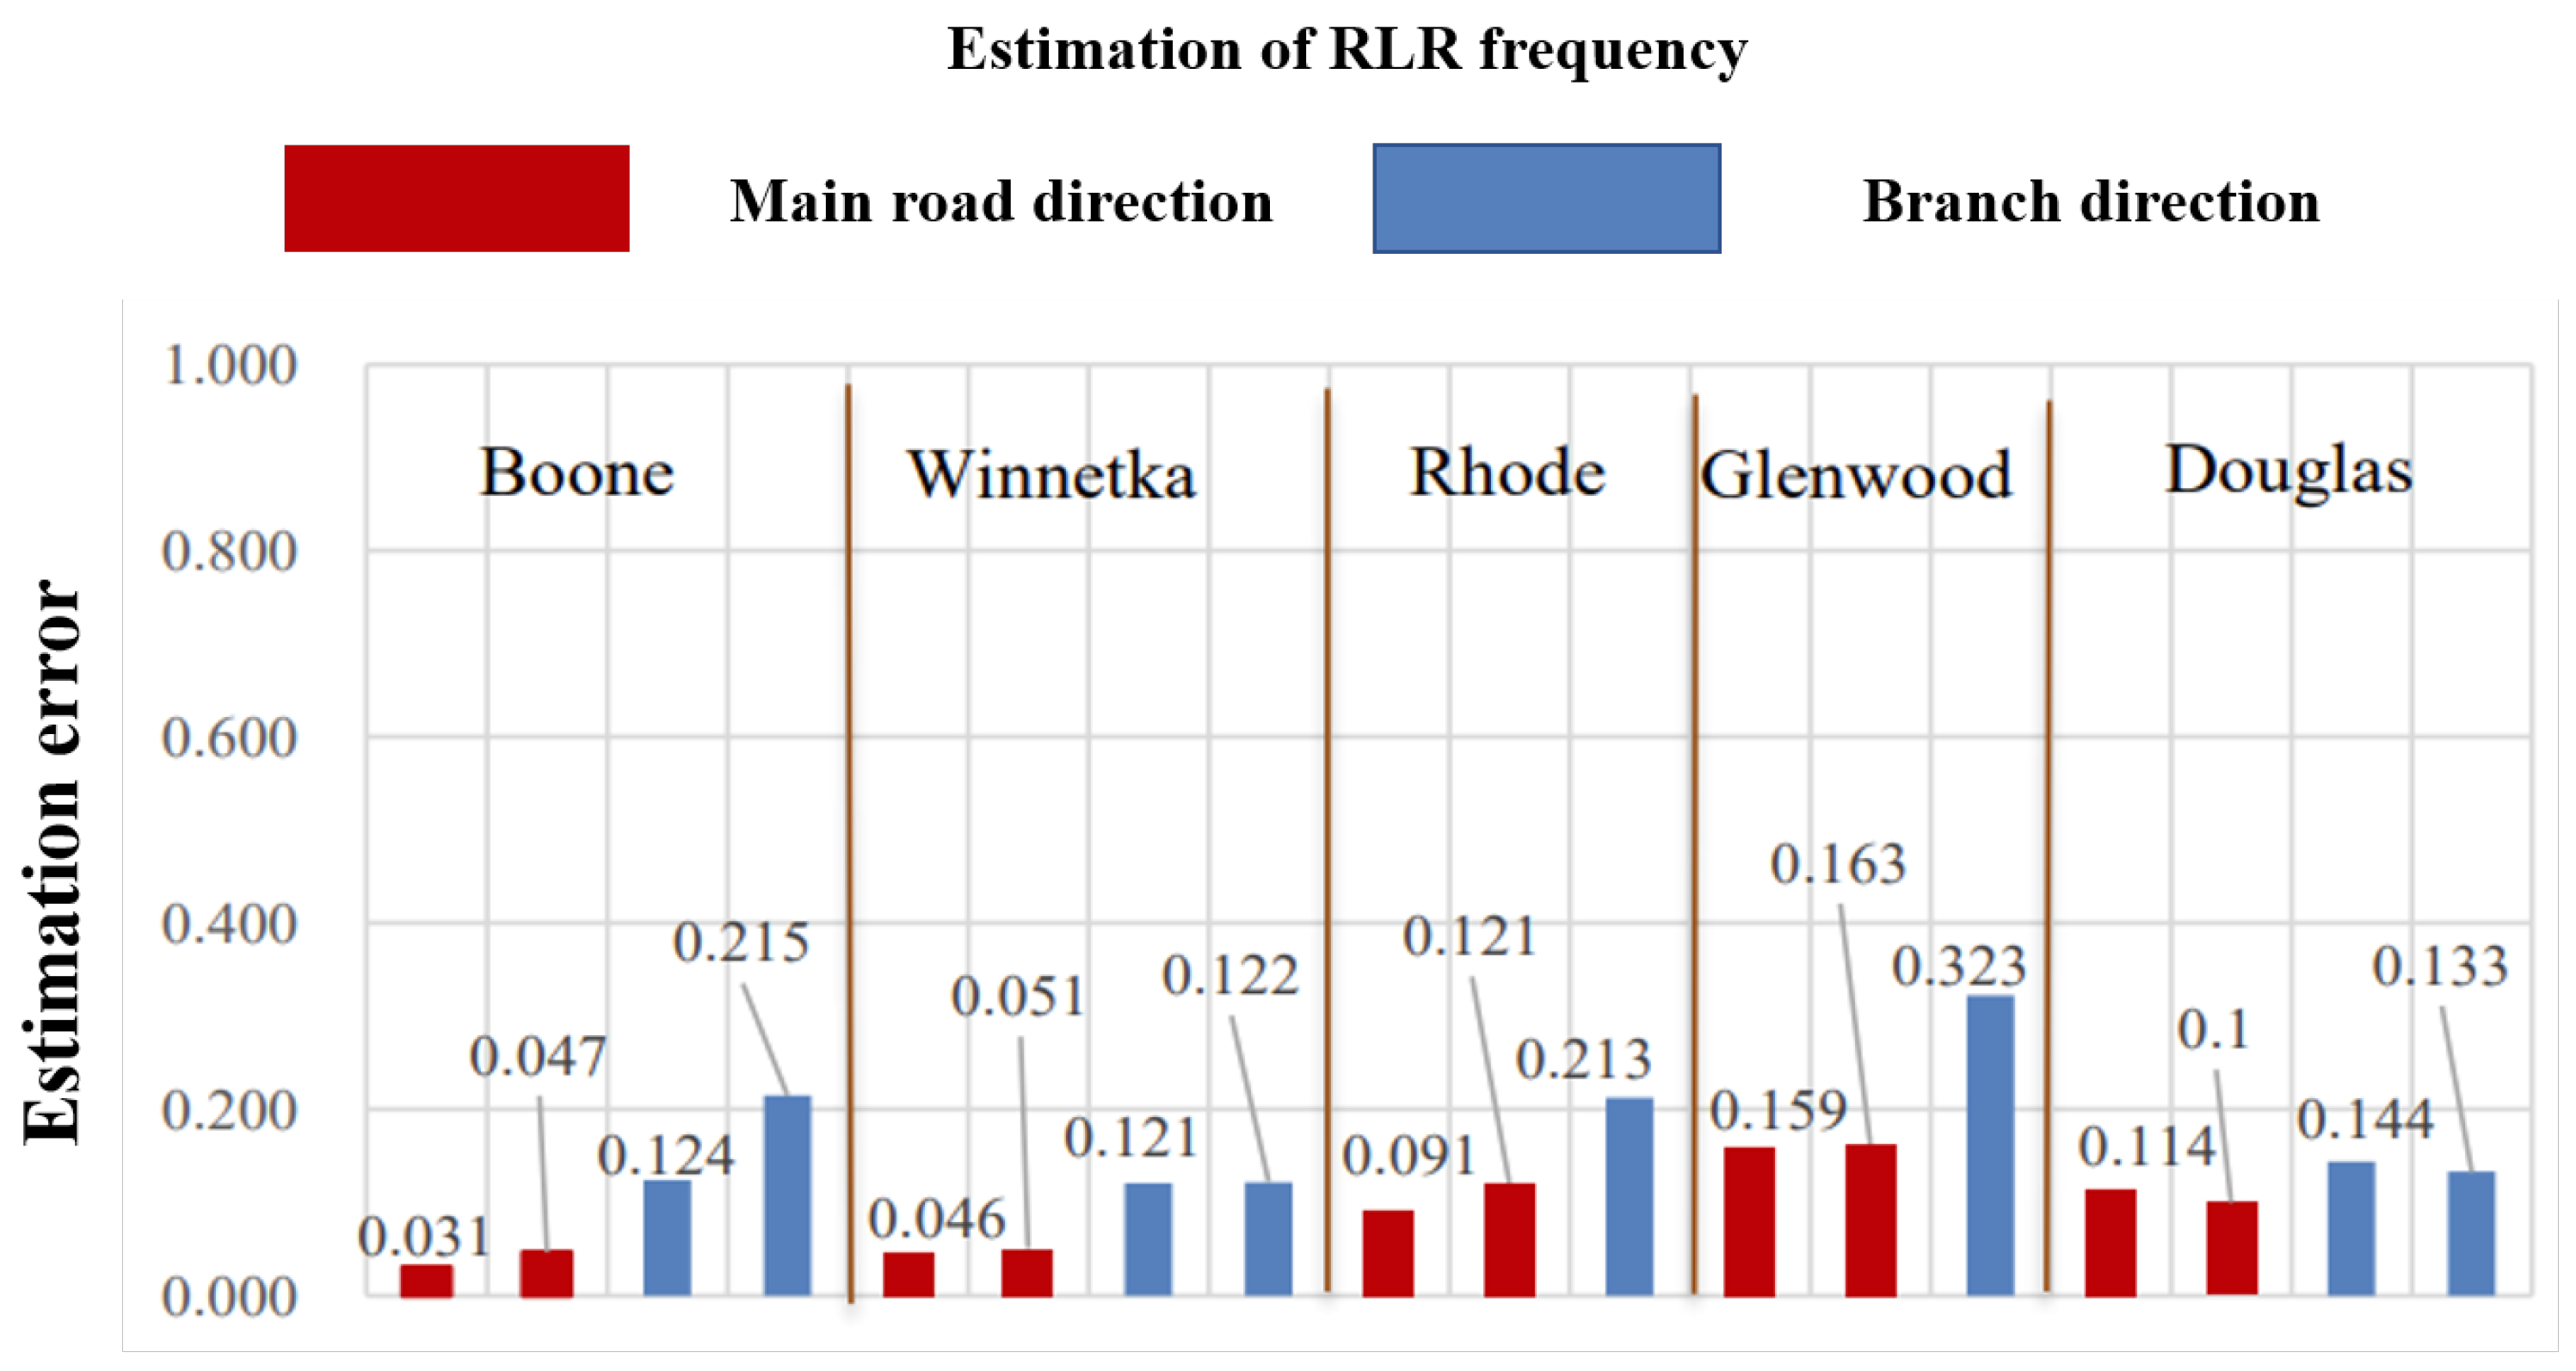
In order to validate the nonlinear estimation model of red light running frequency proposed in this paper, the actual red light running frequency data are used for validation. Since the different geometric shapes of intersections and the different locations of road detector may affect the estimation of red light running frequency, nonlinear regression analysis was conducted for the other four intersections of TH55 main road. The model was validated using two months of high-precision data for the main road. The results show that the proposed model can effectively estimate the frequency of RLR. According to the prediction results, an error statistics chart for each direction of the intersection is drawn as shown in Figure 5. In the figure, red represents the estimation error of the red light running frequency in the direction of the main road, and blue represents the estimation error of the red light running frequency in the direction of the branch road. The error statistics results indicate that the estimation error of branch direction at intersections 103 and 104 is relatively large. This phenomenon is due to the fact that these intersections are T-junctions. In addition, the estimation error of RLR frequency in the main road direction of these five intersections is relatively low, indicating that the model proposed in this paper has high accuracy in estimating the frequency of RLR. This finding provides a theoretical basis for reducing the frequency of red light running by optimizing the signal timing of main roads.

3.2. Traffic Signal Control Method for Reducing RLR Frequency

This study advocates an approach to optimize the signal timing to reduce RLR frequency for the arterial road. As previously mentioned, reducing the number of vehicles arriving at a given time interval ( [ t y 1 , t y + 2 ] for Int. Boone), we can reduce RLR frequency. However, only minimization of the arrival vehicle numbers may be accompanied by a reduction in traffic efficiency. This study tries to reduce RLR frequency without compromising traffic performance. Hence, a multiple-objective signal optimization framework is needed. NSGA-II is a population-based optimization method that has been widely used in multi-criteria signal control optimization in recent years because of its high convergence speed and robust elitist strategy [55,56], which finally lead us to choose NSGA-II for optimizing the signal timing toward achieving both RLR reduction and efficiency enhancement. The following section describes the signal optimization procedure to optimize signal timings to reduce the RLR frequency based on NSGA-II.
Instead of minimizing total intersection delay under given demand, we aim to reduce RLR frequency, which is significantly affected by the arriving vehicle numbers during a specific time interval. Therefore, we formulate the problem as a multi-objective one. With multiple objective functions, it is important to find good compromises, or trade-offs, rather than a single solution. The general notion of a multi-objective optimum was introduced by [57]. The multi-objective problems are expressed as follows:
Decision variables: The offset for the arterial road φ k , k + 1 .
Objective: To minimize the number of vehicles that arrive at advance detectors during the special time interval. Therefore, multiple objectives are involved, i.e.,
min J = ( f 1 φ k , k + 1 , f 2 ( φ k , k + 1 ) )
where φ k , k + 1 is a set of offsets between intersection k and intersection k+1. f 1 φ k , k + 1 is the first objective function (minimum average traffic delay under a given demand), and since we are concerned about the RLR frequency of the arterial road, the first objective function represents the sum of the arrival vehicle numbers for all of the signalized intersections. f 2 φ k , k + 1 is the second objective function (arriving vehicle numbers during special time interval), these two objective functions can be calculated according to the following formulas. Where n represent the throughput of arterial road, d i represent delay of vehicle i, m represents the number of intersections, and f R , i ( x ) represents the estimation frequency of red light running.
f 1 φ k , k + 1 = i = 1 n d i n
f 2 ( φ k , k + 1 ) = i = 1 m f R , i ( x )
In this research, multi-objective optimization is implemented to optimize the signal setting plan and determine timing plans with the best compromises between the number of arrival vehicles and vehicle delay. The optimal trade-off between the two competing objectives is presented with an approximation of the Pareto front. In recent years, researchers have presented different multi-objective simulation platforms based on NSGA-II algorithms, such as fuel consumption, traffic emission, traffic safety, and others [58,59,60]. Unlike ordinary genetic algorithms, the NSGA-II algorithm layers individuals based on the dominant relationship between individuals in the population before selecting operator execution, which allows excellent individuals have a greater chance to be inherited in the next generation. A crowding degree index is also added to the algorithm to improve the distribution and diversity of the population, and it can be calculated as follows:
d i = s = 1 m f s i + 1 f s i 1 f s m a x f s m i n m
where f s i + 1 and f s i 1 represent the closest function value to individual i among all individual value in population for the s-th objective function, and f s m a x and f s m i n represent the maximum and minimum value for the s-th objective function.
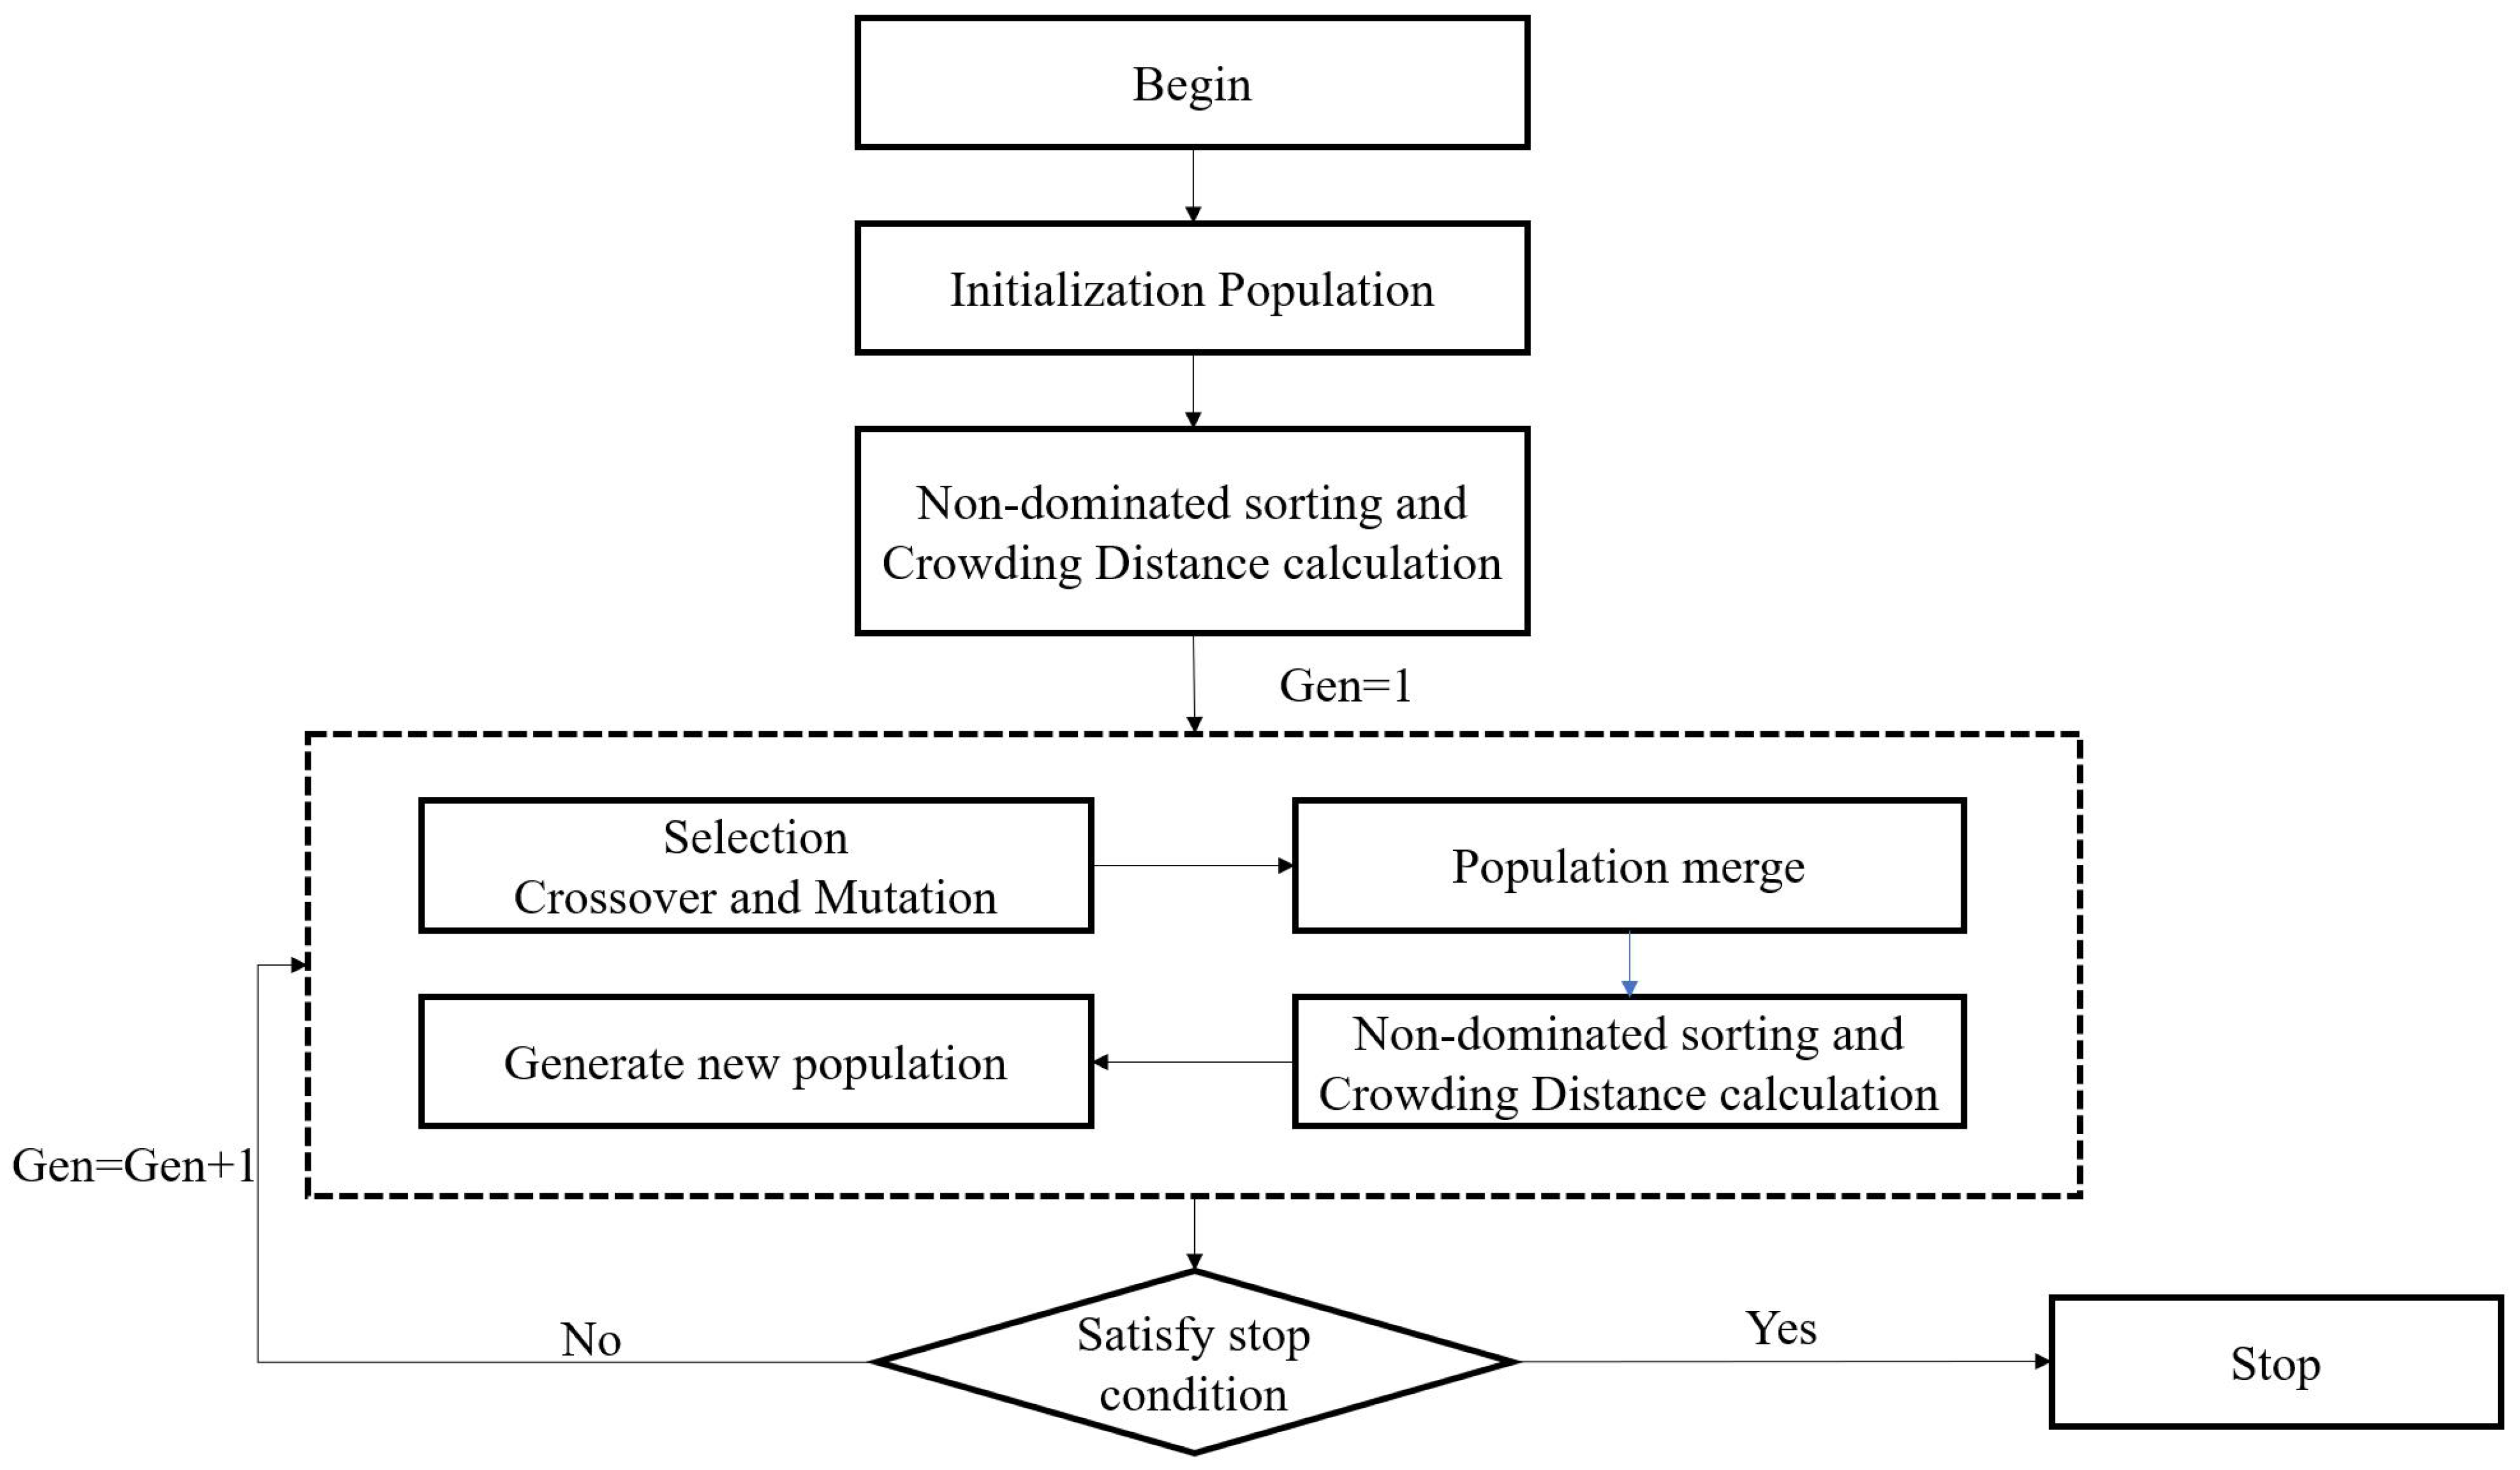
In this research, NSGA-II is used to solve the multi-objective control problem. The major process is as follows (as shown in Figure 6):
Step 1
Create a population individual according to phase of all the intersection in the arterial road and determine hyper-parameters including the population size, mutation, gene length, and crossover probability.
Step 2
Rank the individuals based on the dominance rule.
Step 3
Conduct the crossover and mutation operations to create an offspring population.
Step 4
Combine the parent and offspring populations to create a new population for forming Pareto fronts.
Step 5
Add distance to each individual to create a diverse front and obtain the non-dominated fronts of the population using a fast non-dominated sorting approach.
Step 6
Stop and save the last offspring population if the algorithm meets the criteria of maximum generation.

4. Simulation-Based Study

4.1. Simulation Platform

In this research, Q-Paramics (V6.4.1) software was used to conduct the simulation. Q-Paramics software can simulate the behaviors of vehicles in urban and highway road networks at a micro level. An Application Programming Interface (API) number is provided by this software, which allows the user to customize underlying features of simulation model.
Q-Paramics can collect high-resolution traffic data using the Microsoft Visual C++ application. Moreover, the traffic metrics such as arrival vehicle numbers can be recorded when the simulation is finished, and the traffic signal phase will be updated by the “Solution Algorithms” module once the information is collected. Then, Q-Paramics would restart the simulation with the new signal timing plan. Figure 7 illustrates how the multi-objective control is implemented in the simulation platform.

4.2. Simulation Setting

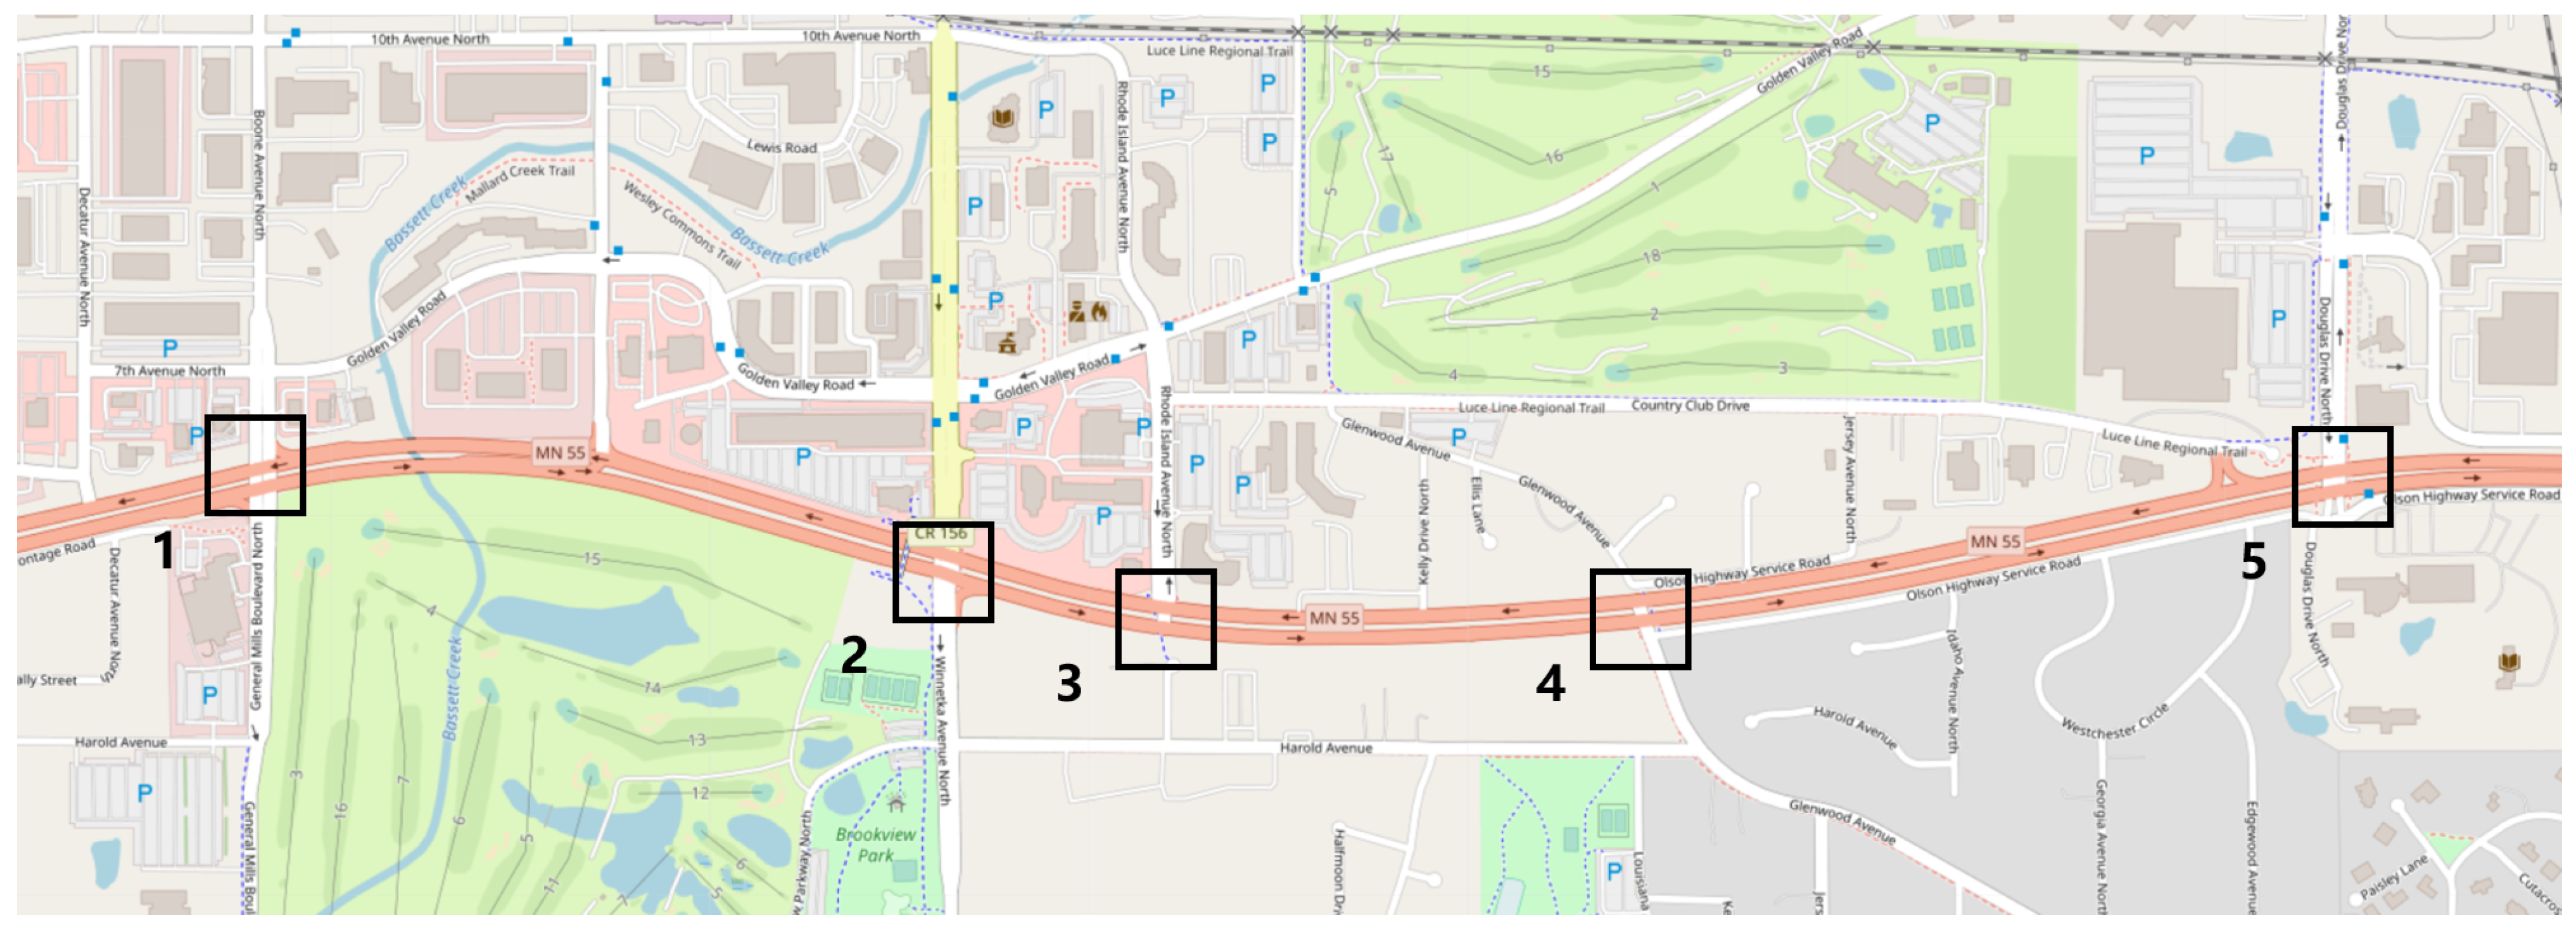
As shown in Figure 8, the selected test site is named TH55, which is located at Twin Cities, Minnesota (the same place where we have collected the high-resolution data). The arterial road is approximately 2 km long and has five signalized intersections, where intersections 3 and 5 are three-leg intersections. The special time interval for each intersection was set as [ t y 1 , t y + 2 ] . The simulation time was added as approximately one hour, and the warm-up time was 5 min. The Q-Paramics road network was built using field data, and the initial signal timing plan was also collected from the field. Real traffic flow data during afternoon peak hour (5:00–6:00 p.m.) were used in the simulation test.
The NSGA-II was run to optimize the two objectives. Table 3 summarizes the parameters relative to the NSGA-II procedure.

4.3. Simulation Result

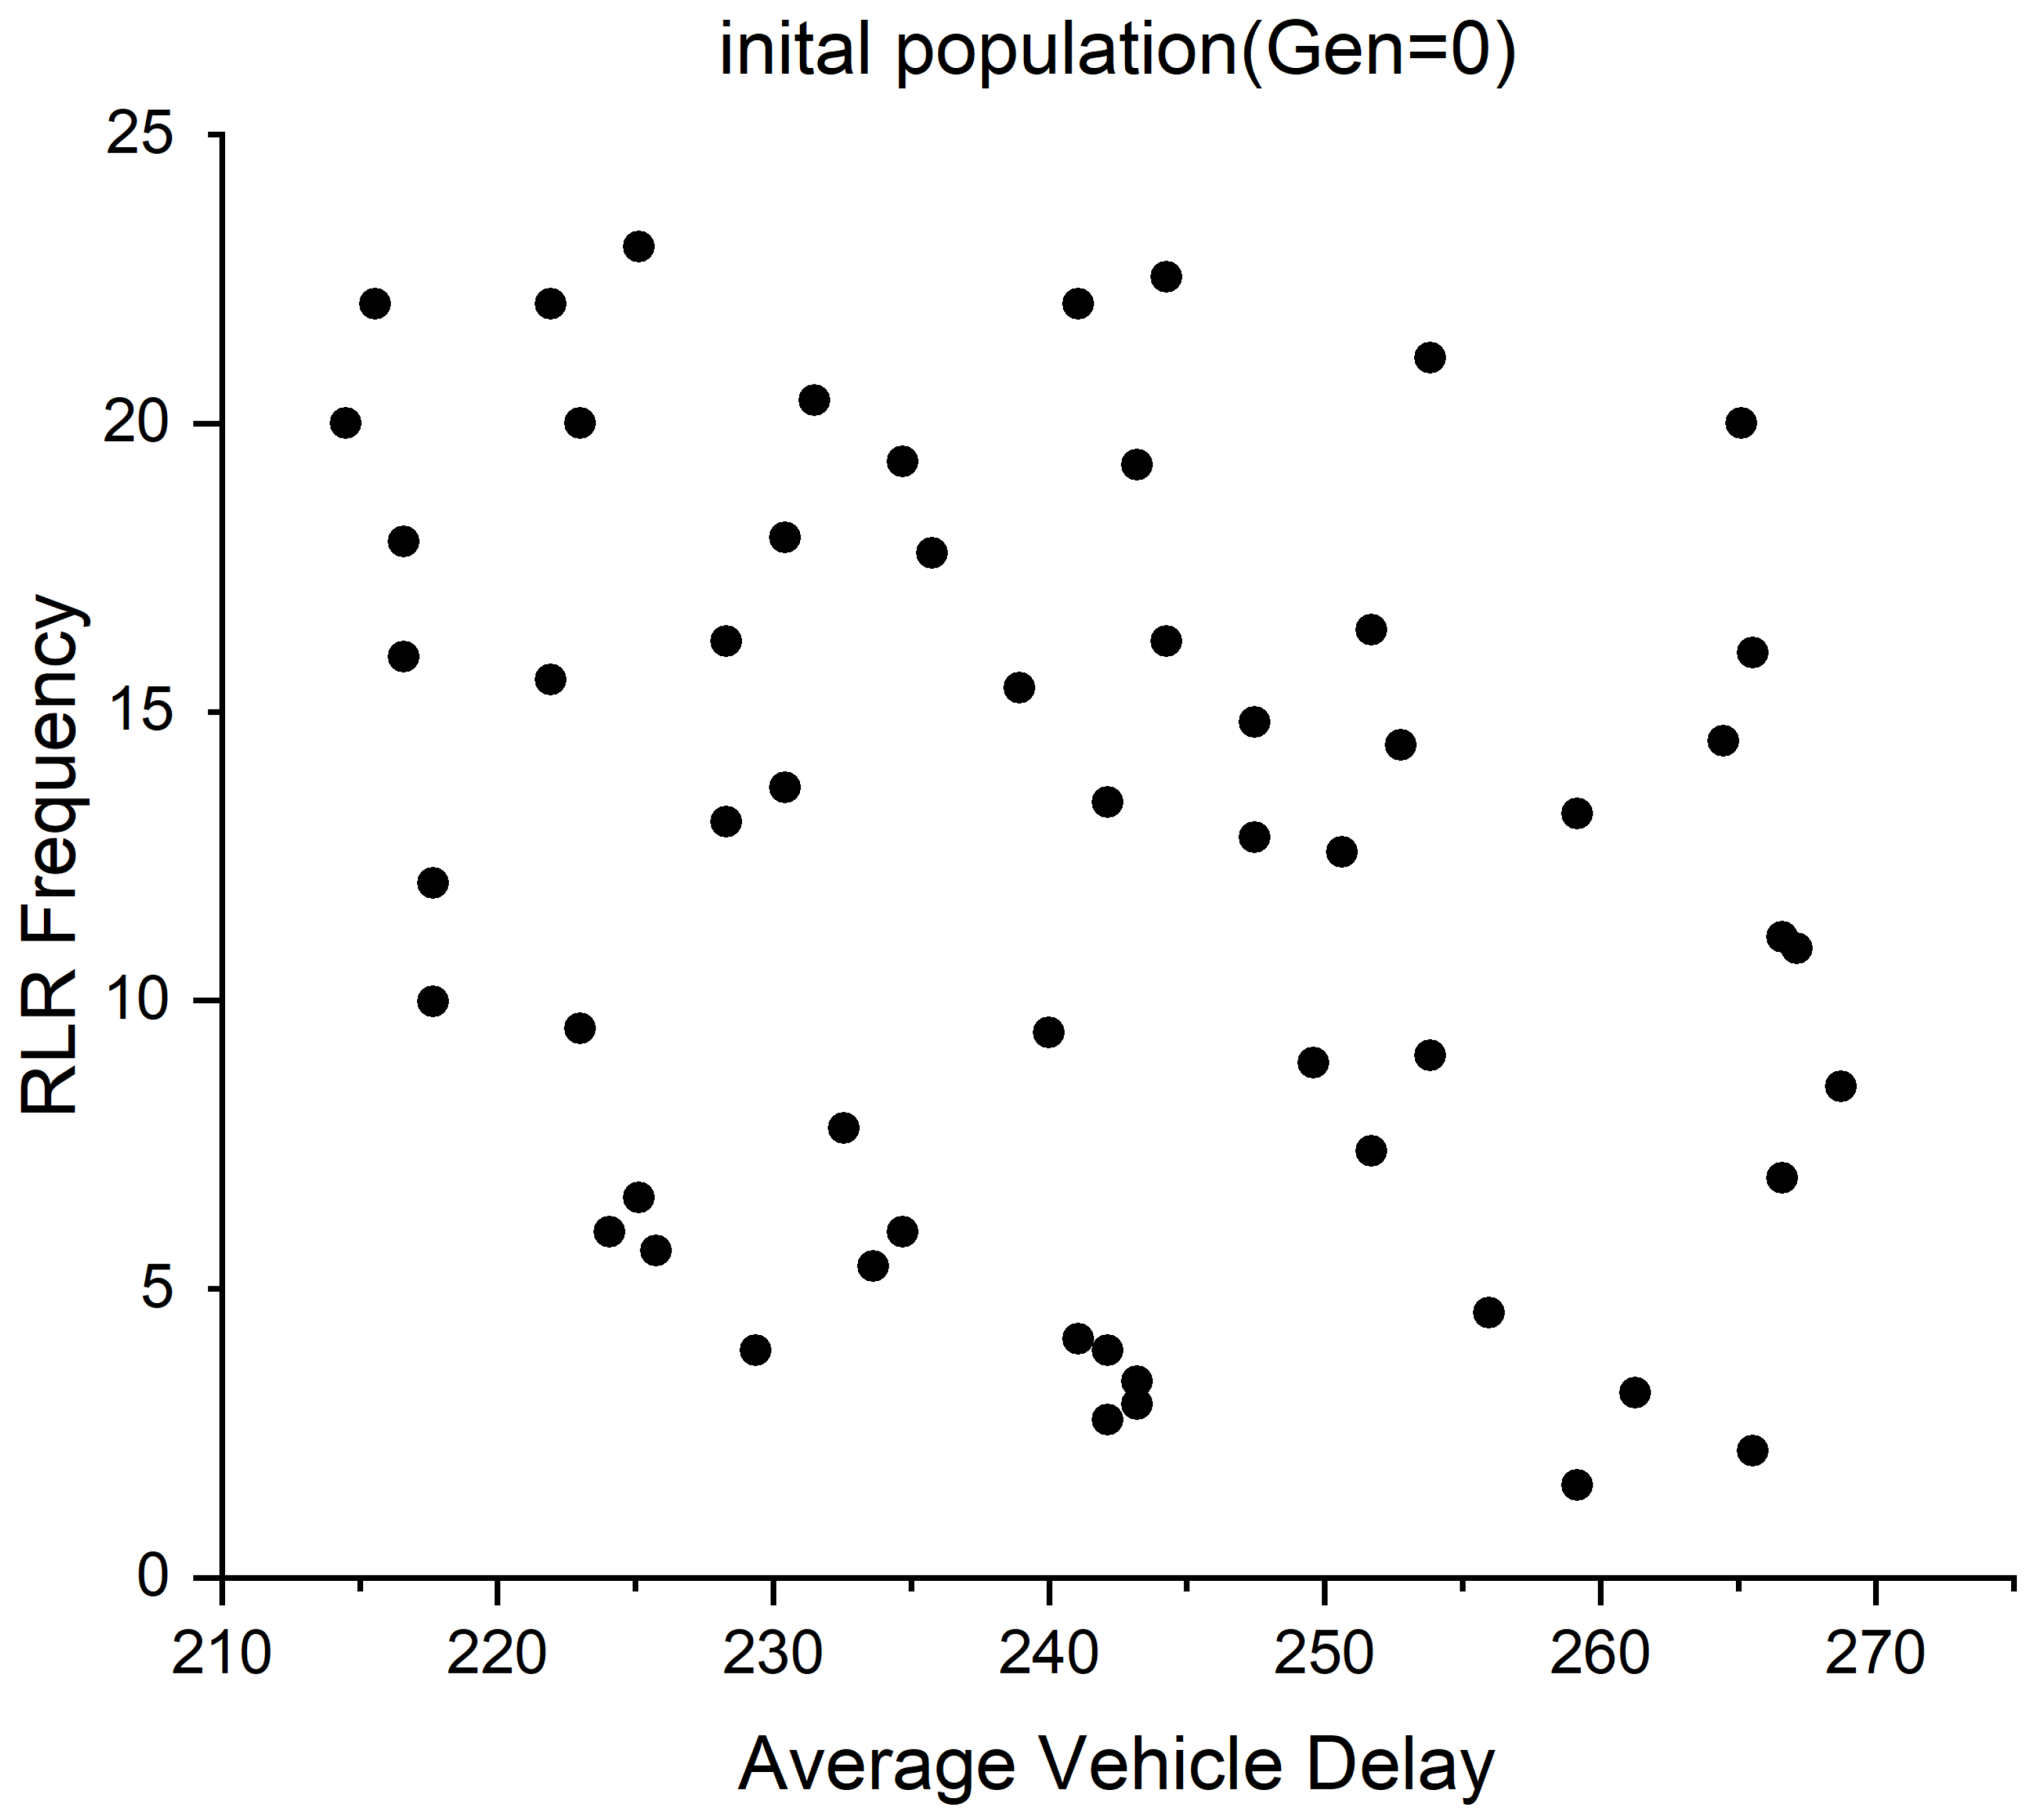
The experiment was conducted under the conditions of unsaturated flow, saturation flow, and supersaturation flow on the main road. The experiment began from the initial population, and an initial population was set for each flow condition. For example, Figure 9 shows the relationship between the frequency of RLR on the main road and the average delay of vehicles corresponding to each individual of the initial population randomly generated under the condition of supersaturation flow on the main road, where each individual represents a signal timing scheme, which was randomly selected.
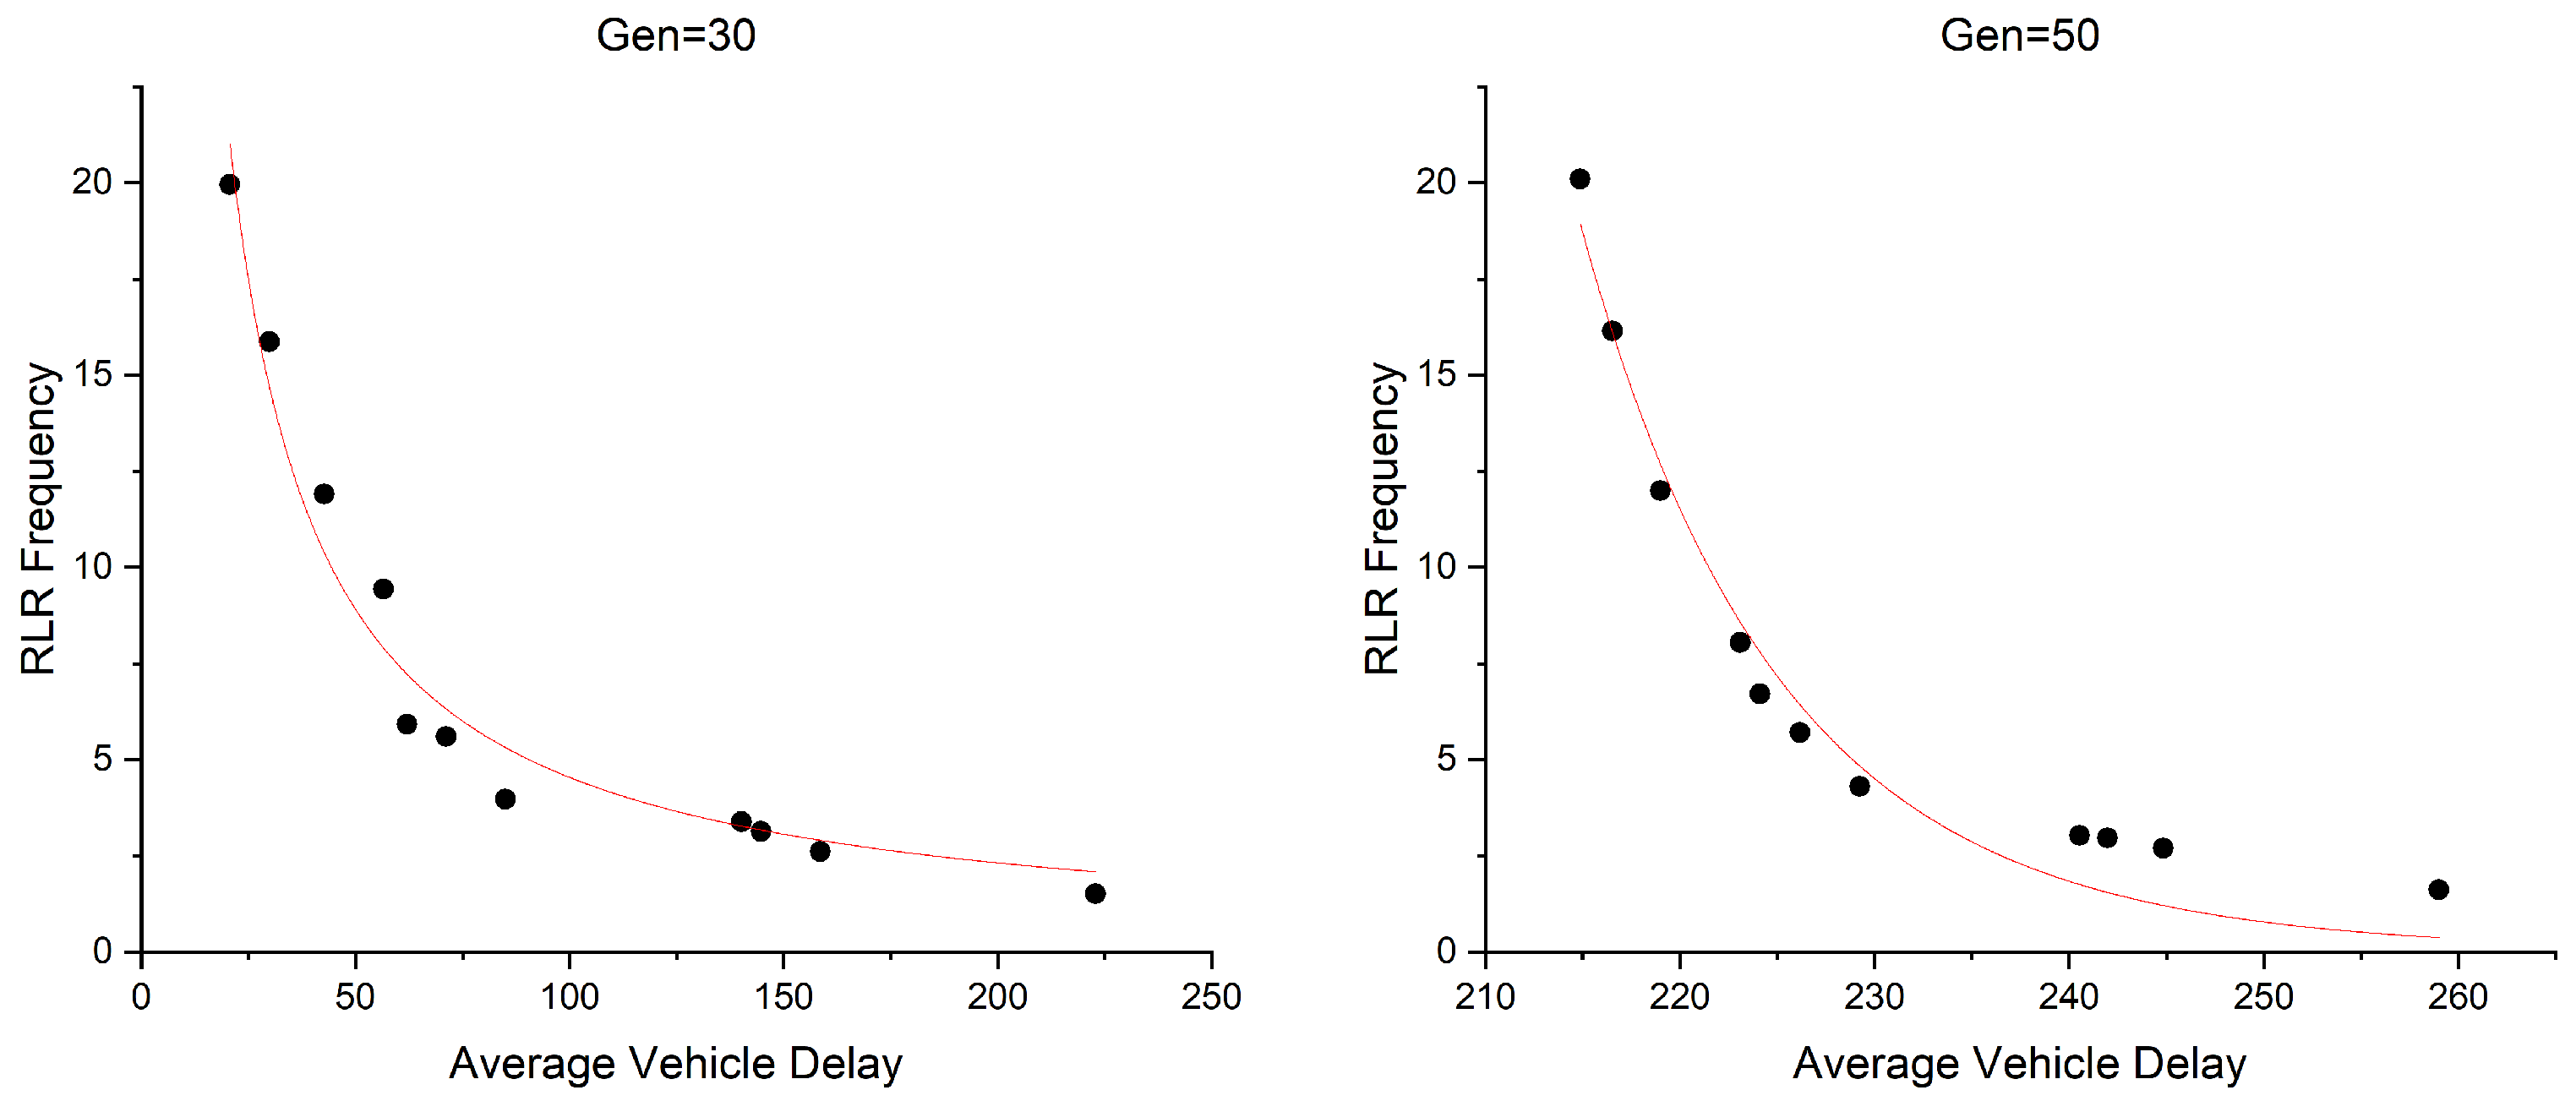
The optimization results under unsaturated flow are shown in Figure 10. From the figure, it can be seen that the solution after 30 iterations is similar to the solution after 50 iterations, which shows that the algorithm performs well in convergence. A clear Pareto frontier can be observed, which clearly presents the trade-offs between the minimum arrival number and the minimum average vehicles delay. It can be seen that our method can find a Pareto optimal solution that has both low delay and RLR frequency. Therefore, the best signal timing plan can be designed by using the Pareto frontier, which not only minimizes the arrival vehicle number but also the average vehicle delay.
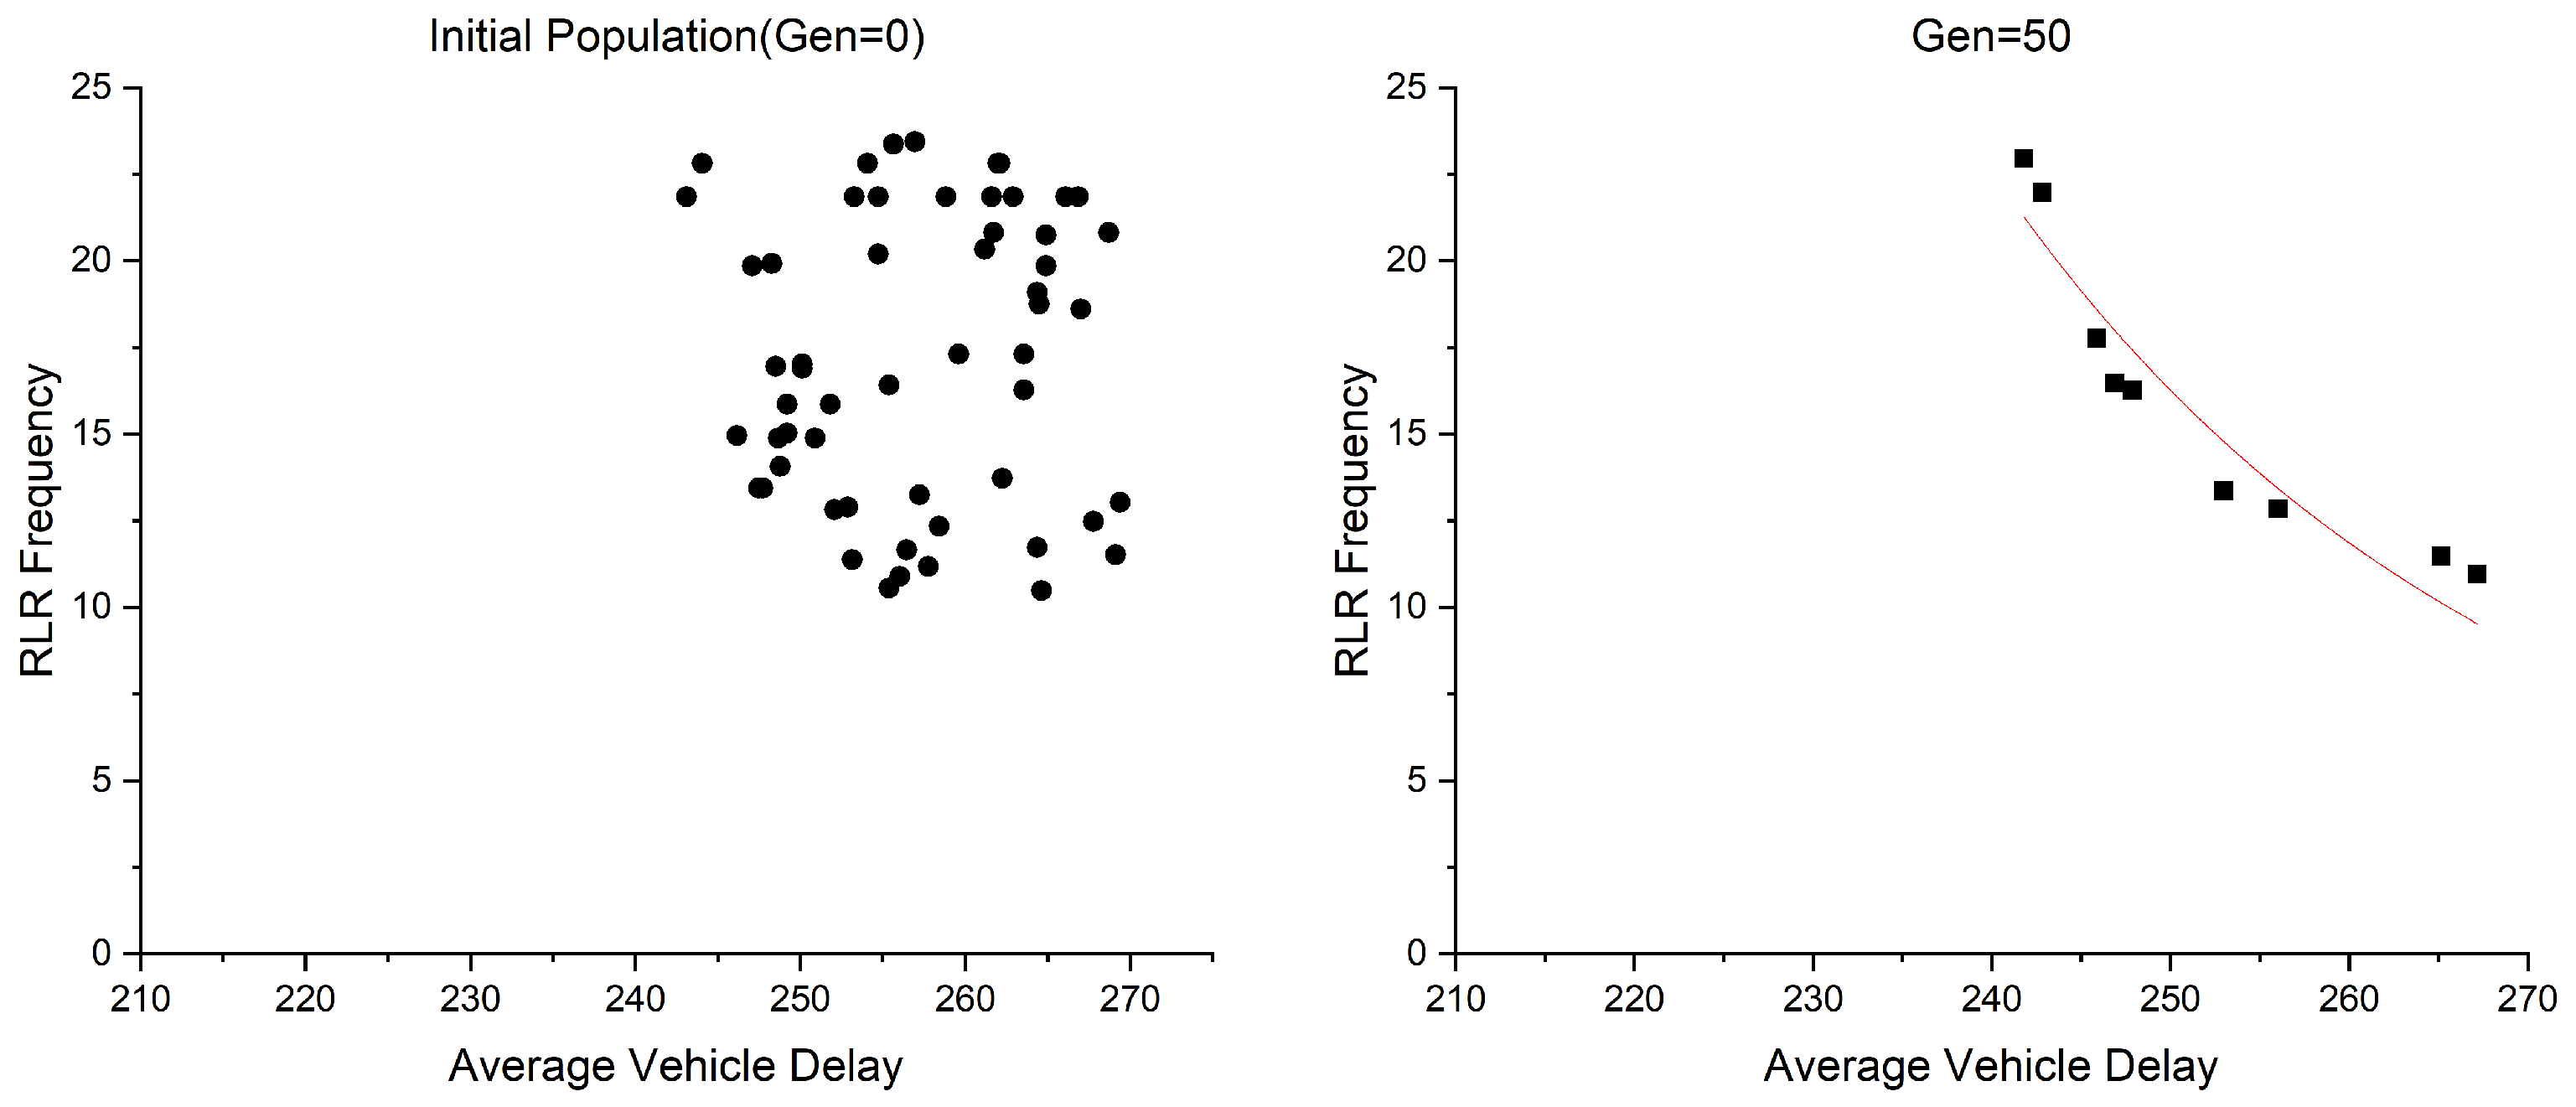
In order to test the convergence under different traffic flow conditions, the experiment is conducted under saturation flow and supersaturation flow. Compared to unsaturated flow condition, the number of vehicles increase by 15% and 30%, respectively, and the results are shown in Figure 11 and Figure 12. The results indicate that our method can converge to a Pareto frontier and find Pareto optimal solutions in both traffic flow conditions.
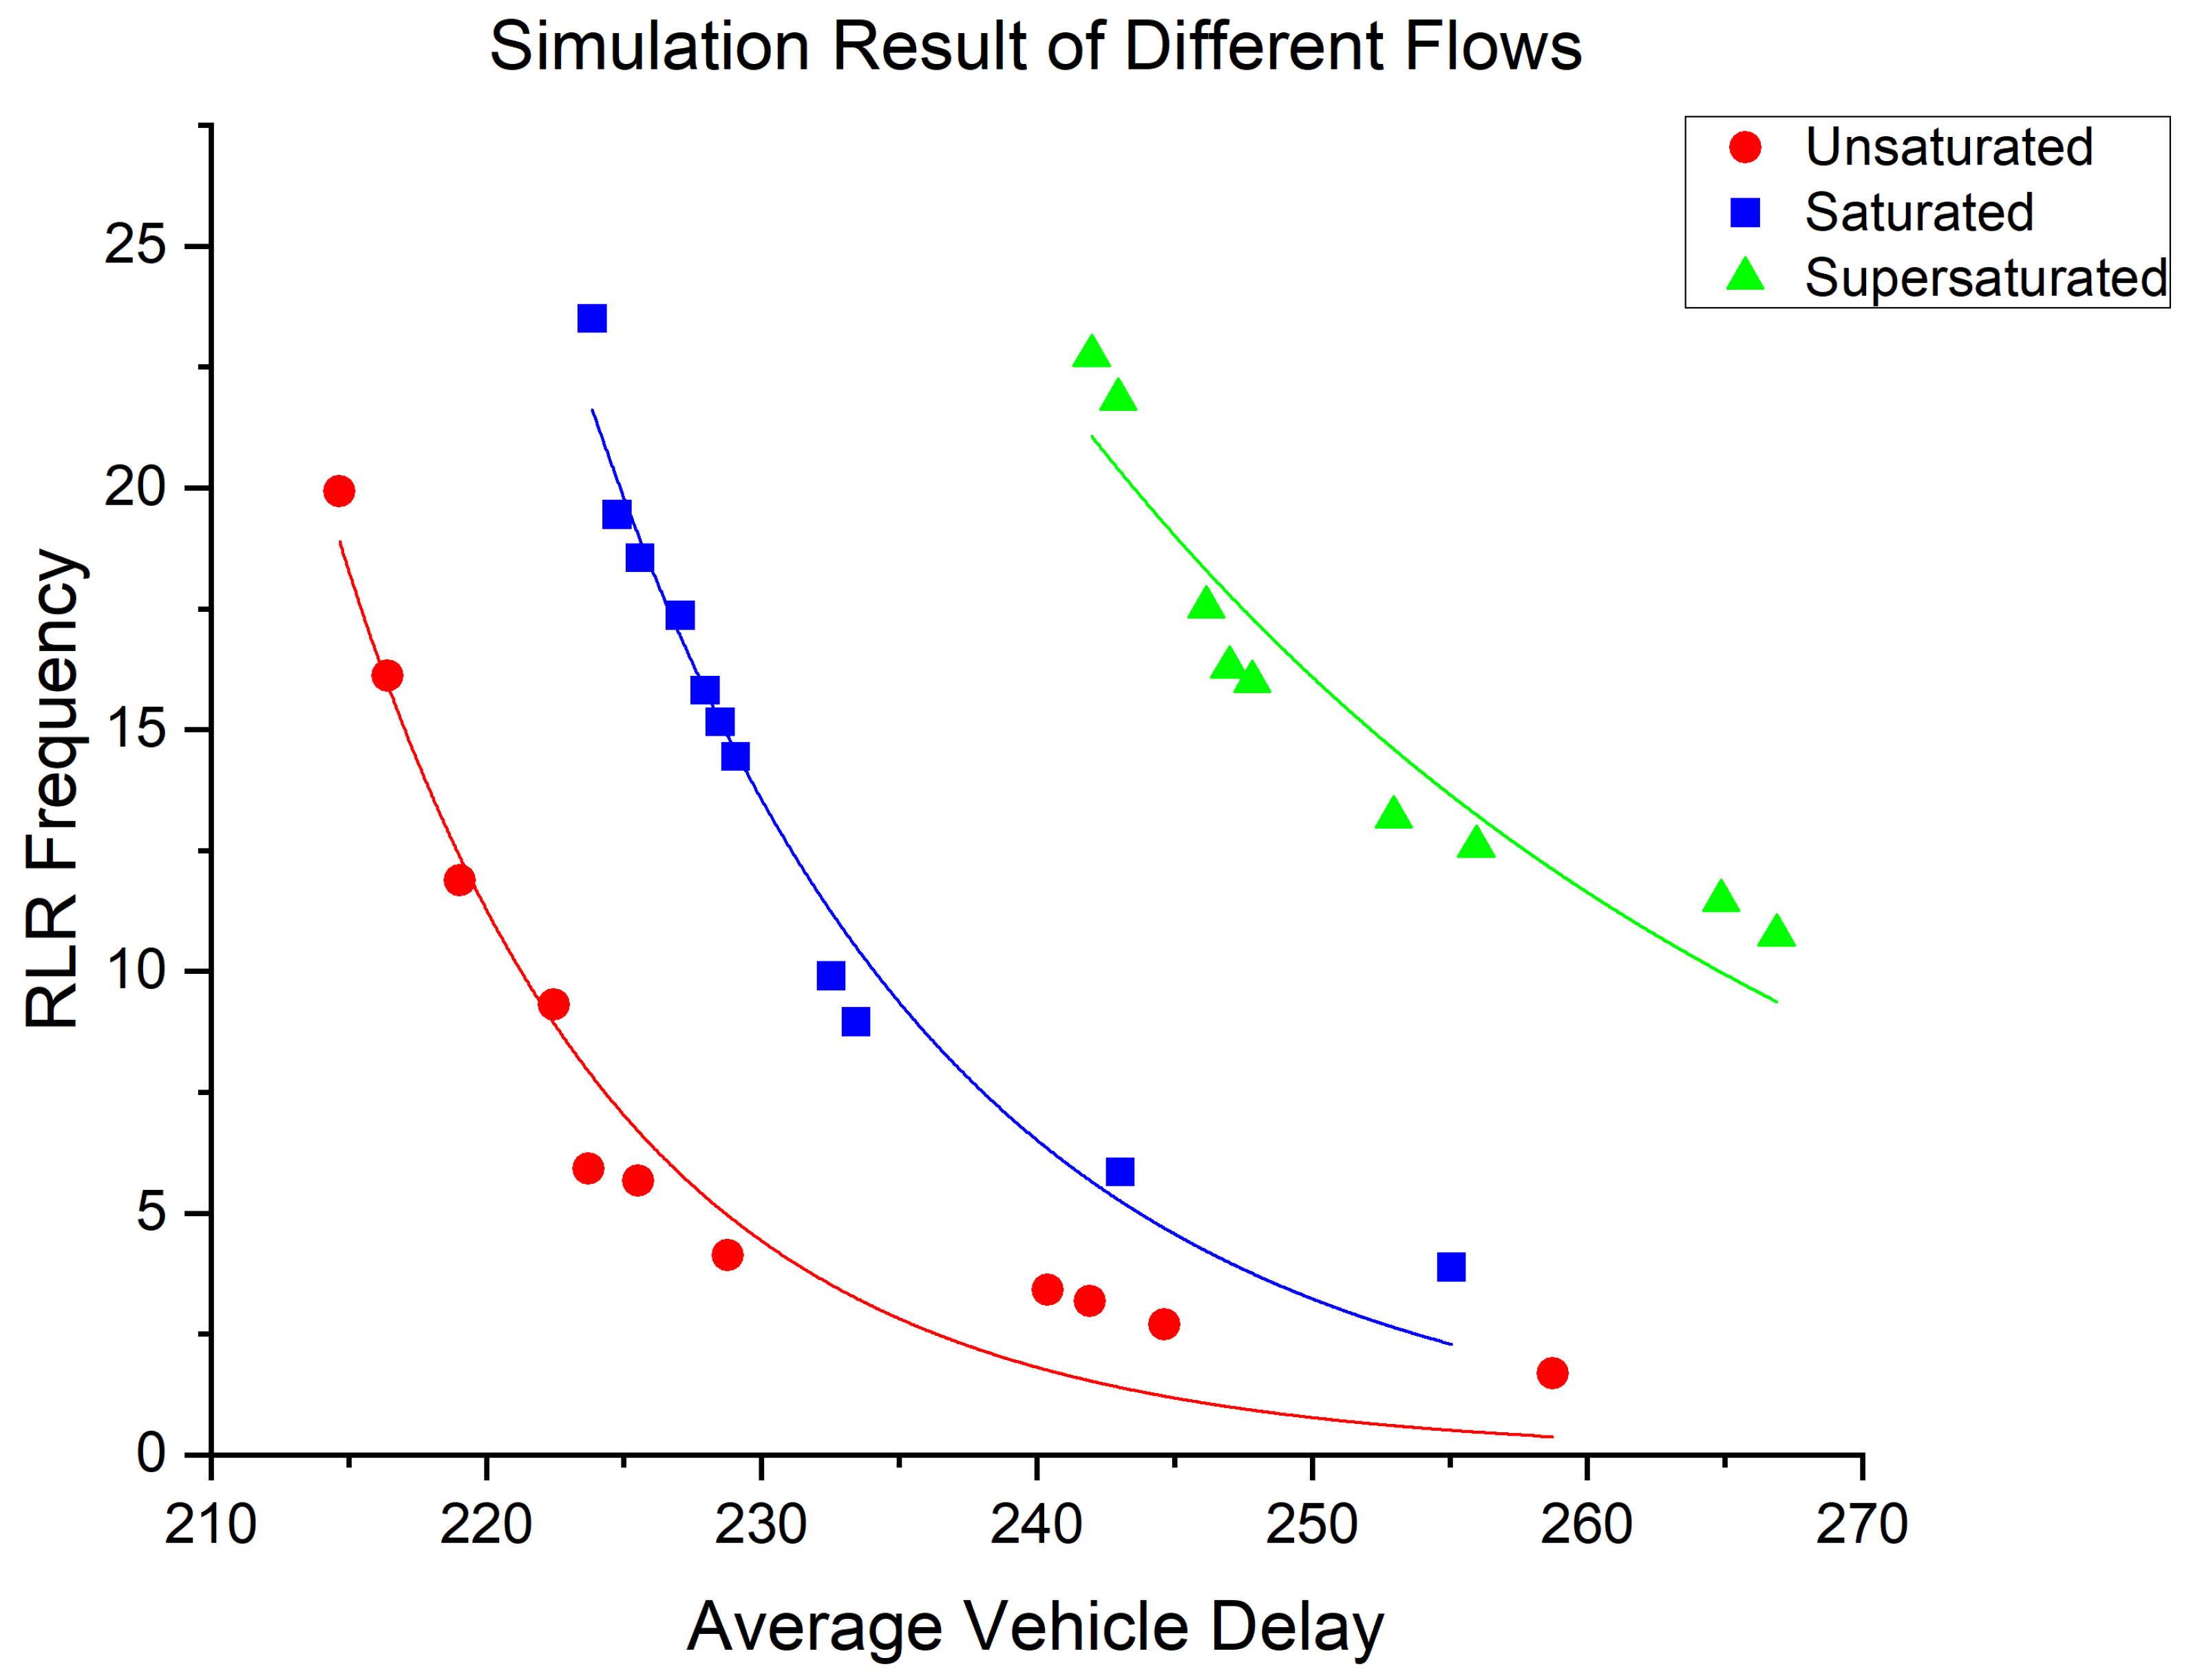
The simulation results under different traffic conditions are compared, and the comparison results are shown in Figure 13. When the main road is unsaturated, the algorithm considering the frequency of red light running on the main road and the average vehicle delay has the best optimization effect. With the increase in the main road flow, the frequency of red light running on the main road and the average vehicle delay increase accordingly. When the main road is oversaturated, the frequency of red light running and the average vehicle delay on the main road are at a high level, and the algorithm on the main road fails to produce a significant optimization effect. The simulation results under different flows show that the algorithm has achieved good control effects in both unsaturated and saturated states.

5. Discussion

Since RLR is one of the most important factors of traffic accidents, in this paper, we propose a novel adaptive traffic signal control approach to reduce the RLR frequency by controlling yellow-arriving vehicles. Specifically, we explore the correlation between yellow arriving and RLR frequency based on high-resolution traffic and signal event data and propose a quantitative model using nonlinear regression method. Furthermore, we develop a novel ATSC approach based on NSGA-II, aimed at enhancing efficiency while reducing RLR frequency. On this basis, the simulation is conducted based on a real road network in Twin Cities, Minnesota. The results show that our approach achieves good performance in both traffic efficiency enhancement and RLR frequency reduction. Under the conditions of unsaturated flow, saturation flow, and supersaturation flow, our method can converge to an optimal Pareto frontier in 30–50 iterations.

6. Conclusions and Future Work

In this paper, we propose a traffic signal control method to simultaneously reduce RLR and enhance traffic efficiency. To the best of our knowledge, this is the first time that a traffic signal control method has been proposed to reduce RLR for arterial roads. Compared to other methods for RLR reduction, such as RLR camera enforcement and warning signs, we use only historical high-resolution traffic data to build our model. This means that the model can be used in different arterial roads as long as the historical high-resolution traffic data can be collected. Unlike camera enforcement and warning signs, our method does not require the addition of more roadside facilities, thereby reducing management costs. Moreover, compared to other methods that use machine learning or deep learning to predict or identify RLR behavior, our model utilizes less data to build the relationship model of correlation between RLR and yellow-arriving vehicles, which can predict the number of RLR vehicles in advance with better explanatory power. However, our model still has some deficiencies. First, it is costly to collect high-resolution traffic data from each arterial road. Then, the relationship model of correlation between RLR frequency and yellow arrival may vary across different arterial roads due to differences in traffic demand, necessitating adjustments to the model in different environments.
To sum up, in the future, we will focus on addressing these issues. We aim to reduce its dependence on high-resolution data with the assistance of traffic flow models. Moreover, we will enhance the RLR estimation model and try to find a more generalized model that can estimate RLR in different traffic demands and road-net conditions, thereby improving the generalization performance of the model. In addition, our model uses a centralized control framework, creating difficulties for its application on large-scale road networks because of high computing costs. Some emerging computer technologies, such as TinyML [61], may help to transform the model into a distributed framework, thereby further enhancing its adaptability in various traffic scenarios.

Author Contributions

Conceptualization, H.L.; Methodology, H.L., X.C. and P.L.; Software, P.L.; Formal analysis, X.C.; Writing—original draft, H.L. and X.C.; Writing—review & editing, Y.R.; Project administration, Y.R.; Funding acquisition, Y.R. All authors have read and agreed to the published version of the manuscript.

Funding

This research was funded by Ministry of Science and Technology, National Natural Science Foundation and Beijing Municipal Science & Technology Commision under grant 2018YFE0204300, 51998018 and Z211100004221008 respectively.

Data Availability Statement

Due to privacy restrictions, research data in manuscripts cannot be disclosed.

Acknowledgments

The authors are grateful to Shuyue Pan affiliated to Daimler AG, Autonomous Driving Systems for her help with the revision of this paper.

Conflicts of Interest

The authors declare no conflict of interest.

References

  1. Almoshaogeh, M.; Abdulrehman, R.; Haider, H.; Alharbi, F.; Jamal, A.; Alarifi, S.; Shafiquzzaman, M. Traffic accident risk assessment framework for qassim, saudi arabia: Evaluating the impact of speed cameras. Appl. Sci. 2021, 11, 6682. [Google Scholar] [CrossRef]
  2. Zahid, M.; Chen, Y.; Jamal, A.; Al-Ofi, K.A.; Al-Ahmadi, H.M. Adopting machine learning and spatial analysis techniques for driver risk assessment: Insights from a case study. Int. J. Environ. Res. Public Health 2020, 17, 5193. [Google Scholar] [CrossRef]
  3. Jamal, A.; Zahid, M.; Tauhidur Rahman, M.; Al-Ahmadi, H.M.; Almoshaogeh, M.; Farooq, D.; Ahmad, M. Injury severity prediction of traffic crashes with ensemble machine learning techniques: A comparative study. Int. J. Inj. Control Saf. Promot. 2021, 28, 408–427. [Google Scholar] [CrossRef]
  4. Safety Intersection. Federal Highway Administration; US Department of Transportation: Washington, DC, USA, 2019. [Google Scholar]
  5. Wang, X.; Yu, R.; Zhong, C. A field investigation of red-light-running in Shanghai, China. Transp. Res. Part F Traffic Psychol. Behav. 2016, 37, 144–153. [Google Scholar] [CrossRef]
  6. Devlin, A.; Candappa, N.; Corben, B.; Logan, D. Designing safer roads to accommodate driver error. Psychopharmacology 2011, 10, 193–212. [Google Scholar]
  7. Hadi, M.; Amine, K.; Hunsanon, T.; Arafat, M. Evaluating the benefits of red-light violation warning system in a connected vehicle simulation environment. Transp. Res. Rec. 2021, 2675, 1372–1381. [Google Scholar] [CrossRef]
  8. Ko, M.; Geedipally, S.R.; Walden, T.D.; Wunderlich, R.C. Effects of red light running camera systems installation and then deactivation on intersection safety. J. Saf. Res. 2017, 62, 117–126. [Google Scholar] [CrossRef]
  9. IIHS. Red Light Running. Available online: https://www.iihs.org/topics/red-light-running#maintaining-public-support (accessed on 20 August 2022).
  10. Retting, R.A.; Ferguson, S.A.; Hakkert, A.S. Effects of red light cameras on violations and crashes: A review of the international literature. Traffic Inj. Prev. 2003, 4, 17–23. [Google Scholar] [CrossRef]
  11. Baratian-Ghorghi, F.; Zhou, H.; Franco-Watkins, A. Effects of red light cameras on driver’s stop/go decision: Assessing the green extension hypothesis. Transp. Res. Part F Traffic Psychol. Behav. 2017, 46, 87–95. [Google Scholar] [CrossRef]
  12. Chai, C.; Wong, Y.D.; Lum, K. Safety impacts of red light cameras at signalized intersections based on cellular automata models. Traffic Inj. Prev. 2015, 16, 374–379. [Google Scholar] [CrossRef]
  13. Yan, X.; Radwan, E.; Guo, D.; Richards, S. Impact of “Signal Ahead” pavement marking on driver behavior at signalized intersections. Transp. Res. Part F Traffic Psychol. Behav. 2009, 12, 50–67. [Google Scholar] [CrossRef]
  14. Appiah, J.; Naik, B.; Wojtal, R.; Rilett, L.R. Safety effectiveness of actuated advance warning systems. Transp. Res. Rec. 2011, 2250, 19–24. [Google Scholar] [CrossRef]
  15. Tang, K.; Xu, Y.; Wang, F.; Oguchi, T. Exploring stop-go decision zones at rural high-speed intersections with flashing green signal and insufficient yellow time in China. Accid. Anal. Prev. 2016, 95, 470–478. [Google Scholar] [CrossRef]
  16. Huang, M.; Fujita, M.; Wisetjindawat, W. Countdown timers, video surveillance and drivers’ stop/go behavior: Winter versus summer. Accid. Anal. Prev. 2017, 98, 185–197. [Google Scholar] [CrossRef]
  17. Hussain, Q.; Alhajyaseen, W.K.; Brijs, K.; Pirdavani, A.; Brijs, T. Innovative countermeasures for red light running prevention at signalized intersections: A driving simulator study. Accid. Anal. Prev. 2020, 134, 105349. [Google Scholar] [CrossRef]
  18. Hussain, Q.; Alhajyaseen, W.K.; Brijs, K.; Pirdavani, A.; Reinolsmann, N.; Brijs, T. Drivers’ estimation of their travelling speed: A study on an expressway and a local road. Int. J. Inj. Control Saf. Promot. 2019, 26, 216–224. [Google Scholar] [CrossRef]
  19. Ren, Y.; Wang, Y.; Wu, X.; Yu, G.; Ding, C. Influential factors of red-light running at signalized intersection and prediction using a rare events logistic regression model. Accid. Anal. Prev. 2016, 95, 266–273. [Google Scholar] [CrossRef]
  20. Chen, P.; Yu, G.; Wu, X.; Ren, Y.; Li, Y. Estimation of red-light running frequency using high-resolution traffic and signal data. Accid. Anal. Prev. 2017, 102, 235–247. [Google Scholar] [CrossRef]
  21. Gazis, D.; Herman, R.; Maradudin, A. The problem of the amber signal light in traffic flow. Oper. Res. 1960, 8, 112–132. [Google Scholar] [CrossRef]
  22. Sackman, H.; Monahan, B.; Parsonson, P.; Trevino, A. Vehicle Detector Placement for High-Speed, Isolated Traffic-Actuated Intersection Control. Manual of Theory and Practice; Technical Report; Semantic Scholar: Seattle, WA, USA, 1977; Volume 2. [Google Scholar]
  23. Elmitiny, N.; Yan, X.; Radwan, E.; Russo, C.; Nashar, D. Classification analysis of driver’s stop/go decision and red-light running violation. Accid. Anal. Prev. 2010, 42, 101–111. [Google Scholar] [CrossRef]
  24. Abadi, M.G.; Jashami, H.; McCrea, S.A.; Hurwitz, D.S. Evaluation of Right-of-Way Transitions at Signalized Intersections: Implications of Driver Behavior for Conflicting Through Movements. Transp. Res. Rec. 2017, 2624, 48–57. [Google Scholar] [CrossRef]
  25. Retting, R.A.; Ferguson, S.A.; Farmer, C.M. Reducing red light running through longer yellow signal timing and red light camera enforcement: Results of a field investigation. Accid. Anal. Prev. 2008, 40, 327–333. [Google Scholar] [CrossRef] [PubMed]
  26. Gates, T.J.; Noyce, D.A.; Laracuente, L.; Nordheim, E.V. Analysis of driver behavior in dilemma zones at signalized intersections. Transp. Res. Rec. 2007, 2030, 29–39. [Google Scholar] [CrossRef]
  27. Yang, C.D.; Najm, W.G. Examining driver behavior using data gathered from red light photo enforcement cameras. J. Saf. Res. 2007, 38, 311–321. [Google Scholar] [CrossRef] [PubMed]
  28. Brasil, R.H.; Machado, A.M.C. Automatic detection of red light running using vehicular cameras. IEEE Lat. Am. Trans. 2017, 15, 81–86. [Google Scholar] [CrossRef]
  29. Zaheri, D.; Abbas, M. An algorithm for identifying red light runners from radar trajectory data. In Proceedings of the 2015 IEEE 18th International Conference on Intelligent Transportation Systems, Gran Canaria, Spain, 15–18 September 2015; pp. 2683–2687. [Google Scholar]
  30. Jahangiri, A.; Rakha, H.A.; Dingus, T.A. Adopting machine learning methods to predict red-light running violations. In Proceedings of the 2015 IEEE 18th International Conference on Intelligent Transportation Systems, Gran Canaria, Spain, 15–18 September 2015; pp. 650–655. [Google Scholar]
  31. Wang, J.X. Research of vehicle speed detection algorithm in video surveillance. In Proceedings of the 2016 International Conference on Audio, Language and Image Processing (ICALIP), Shanghai, China, 11–12 July 2016; pp. 349–352. [Google Scholar]
  32. Li, M.; Chen, X.; Lin, X.; Xu, D.; Wang, Y. Connected vehicle-based red-light running prediction for adaptive signalized intersections. J. Intell. Transp. Syst. 2018, 22, 229–243. [Google Scholar] [CrossRef]
  33. Zahid, M.; Jamal, A.; Chen, Y.; Ahmed, T.; Ijaz, M. Predicting red light running violation using machine learning classifiers. In Green Connected Automated Transportation and Safety, Proceedings of the 11th International Conference on Green Intelligent Transportation Systems and Safety, Beijing, China, 17–19 October 2020; Springer: Berlin/Heidelberg, Germany, 2022; pp. 137–148. [Google Scholar]
  34. Zahid, M.; Chen, Y.; Khan, S.; Jamal, A.; Ijaz, M.; Ahmed, T. Predicting risky and aggressive driving behavior among taxi drivers: Do spatio-temporal attributes matter? Int. J. Environ. Res. Public Health 2020, 17, 3937. [Google Scholar] [CrossRef]
  35. Wang, J.; Huang, H.; Xu, P.; Xie, S.; Wong, S. Random parameter probit models to analyze pedestrian red-light violations and injury severity in pedestrian–motor vehicle crashes at signalized crossings. J. Transp. Saf. Secur. 2020, 12, 818–837. [Google Scholar] [CrossRef]
  36. Hu, W.; McCartt, A.T.; Teoh, E.R. Effects of red light camera enforcement on fatal crashes in large US cities. J. Saf. Res. 2011, 42, 277–282. [Google Scholar] [CrossRef]
  37. Maina, E.V.; Ford, A.; Robinson, M. Estimating the safety benefits of red light cameras at signalized intersections in urban areas case study: The City of Virginia Beach. Int. J. Transp. Eng. 2015, 3, 45–54. [Google Scholar]
  38. McCartt, A.T.; Hu, W. Effects of red light camera enforcement on red light violations in Arlington County, Virginia. J. Saf. Res. 2014, 48, 57–62. [Google Scholar] [CrossRef]
  39. Jamil, H.M.; Shabadin, A.; Ibrahim, M. Automated Awareness Safety System (AwAS) for Red Light Running in Malaysia: An Analysis of Four-year Data on Its Effectiveness. J. Soc. Automot. Eng. Malays. 2022, 6, 19–29. [Google Scholar]
  40. Li, P. Stochastic Methods for Dilemma Zone Protection at Signalized Intersections. Ph.D. Thesis, Virginia Tech, Blacksburg, VA, USA, 2009. [Google Scholar]
  41. Bonneson, J.A.; Son, H.J. Prediction of expected red-light-running frequency at urban intersections. Transp. Res. Rec. 2003, 1830, 38–47. [Google Scholar] [CrossRef]
  42. Bonneson, J.A.; Zimmerman, K.H. Effect of yellow-interval timing on the frequency of red-light violations at urban intersections. Transp. Res. Rec. 2004, 1865, 20–27. [Google Scholar] [CrossRef]
  43. Neale, V.L.; Perez, M.A.; Lee, S.E.; Doerzaph, Z.R. Investigation of driver-infrastructure and driver-vehicle interfaces for an intersection violation warning system. J. Intell. Transp. Syst. 2007, 11, 133–142. [Google Scholar] [CrossRef]
  44. Wang, L.; Zhang, L.; Zhang, W.B.; Zhou, K. Red light running prediction for dynamic all-red extension at signalized intersection. In Proceedings of the 2009 12th International IEEE Conference on Intelligent Transportation Systems, St. Louis, MO, USA, 4–7 October 2009; pp. 1–5. [Google Scholar]
  45. Zhang, L.; Wang, L.; Zhou, K.; Zhang, W.B.; Misener, J.A. Use of field observations in developing collision-avoidance system for arterial red light running: Factoring headway and vehicle-following characteristics. Transp. Res. Rec. 2010, 2189, 78–88. [Google Scholar] [CrossRef]
  46. Park, S.Y.; Chang, G.L. Intelligent Dilemma Zone Protection System at High-Speed Intersections; Technical Report; State Highway Administration, Office of Policy & Research: Baltimore, MD, USA, 2017. [Google Scholar]
  47. Park, S.Y. Design, Deployment, and Evaluation of an Integrated Dilemma Zone Protection System for Improving Safety and Mobility for High Speed Suburban Intersections. Ph.D. Thesis, University of Maryland, College Park, MD, USA, 2017. [Google Scholar]
  48. Wu, Y.; Abdel-Aty, M.; Ding, Y.; Jia, B.; Shi, Q.; Yan, X. Comparison of proposed countermeasures for dilemma zone at signalized intersections based on cellular automata simulations. Accid. Anal. Prev. 2018, 116, 69–78. [Google Scholar] [CrossRef]
  49. Ren, Y.; Jiang, H.; Ji, N.; Yu, H. TBSM: A traffic burst-sensitive model for short-term prediction under special events. Knowl.-Based Syst. 2022, 240, 108120. [Google Scholar] [CrossRef]
  50. Ren, Y.; Jiang, H.; Zhang, L.; Liu, R.; Yu, H. HD-RMPC: A Hierarchical Distributed and Robust Model Predictive Control Framework for Urban Traffic Signal Timing. J. Adv. Transp. 2022, 2022, 8131897. [Google Scholar] [CrossRef]
  51. Hu, H.; Li, K.; Chu, D.; Lu, L. Combination Optimization between Traffic Signal and Connected and Automated Vehicle’s Trajectory at the Isolated Intersection. In Proceedings of the 2022 IEEE 25th International Conference on Intelligent Transportation Systems (ITSC), Macau, China, 8–12 October 2022; pp. 1617–1622. [Google Scholar]
  52. Collotta, M.; Pau, G.; Scatà, G.; Campisi, T. A dynamic traffic light management system based on wireless sensor networks for the reduction of the red-light running phenomenon. Transp. Telecommun. 2014, 15, 1–11. [Google Scholar] [CrossRef]
  53. Liu, H.X.; Wu, X.; Ma, W.; Hu, H. Real-time queue length estimation for congested signalized intersections. Transp. Res. Part C Emerg. Technol. 2009, 17, 412–427. [Google Scholar] [CrossRef]
  54. Grembek, O.; Li, Y.I.; Zhang, W.B.; Zhou, K. Analysis of Cycle-Based Data and Development of Enhanced Signal Timing Models to Reduce Red Light Running; Technical Report; Taylor and Francis: Milton Park, UK, 2007. [Google Scholar]
  55. Nguyen, P.T.M.; Passow, B.N.; Yang, Y. Improving anytime behavior for traffic signal control optimization based on NSGA-II and local search. In Proceedings of the 2016 International Joint Conference on Neural Networks (IJCNN), Vancouver, BC, Canada, 24–29 July 2016; pp. 4611–4618. [Google Scholar]
  56. Al-Turki, M.; Jamal, A.; Al-Ahmadi, H.M.; Al-Sughaiyer, M.A.; Zahid, M. On the potential impacts of smart traffic control for delay, fuel energy consumption, and emissions: An NSGA-II-based optimization case study from Dhahran, Saudi Arabia. Sustainability 2020, 12, 7394. [Google Scholar] [CrossRef]
  57. Pareto, V. Course of Political Economy; Oxford University Press: Oxford, UK, 1896. [Google Scholar]
  58. Stevanovic, A.; Stevanovic, J.; Zhang, K.; Batterman, S. Optimizing traffic control to reduce fuel consumption and vehicular emissions: Integrated approach with VISSIM, CMEM, and VISGAOST. Transp. Res. Rec. 2009, 2128, 105–113. [Google Scholar] [CrossRef]
  59. Stevanovic, A.; Stevanovic, J.; Kergaye, C. Optimization of traffic signal timings based on surrogate measures of safety. Transp. Res. Part C Emerg. Technol. 2013, 32, 159–178. [Google Scholar] [CrossRef]
  60. Liu, G.; Qiu, T.Z. Trade-offs between bus and private vehicle delays at signalized intersections: Case study of a multiobjective model. Transp. Res. Rec. 2016, 2539, 72–83. [Google Scholar] [CrossRef]
  61. Schizas, N.; Karras, A.; Karras, C.; Sioutas, S. TinyML for Ultra-Low Power AI and Large Scale IoT Deployments: A Systematic Review. Future Internet 2022, 14, 363. [Google Scholar] [CrossRef]
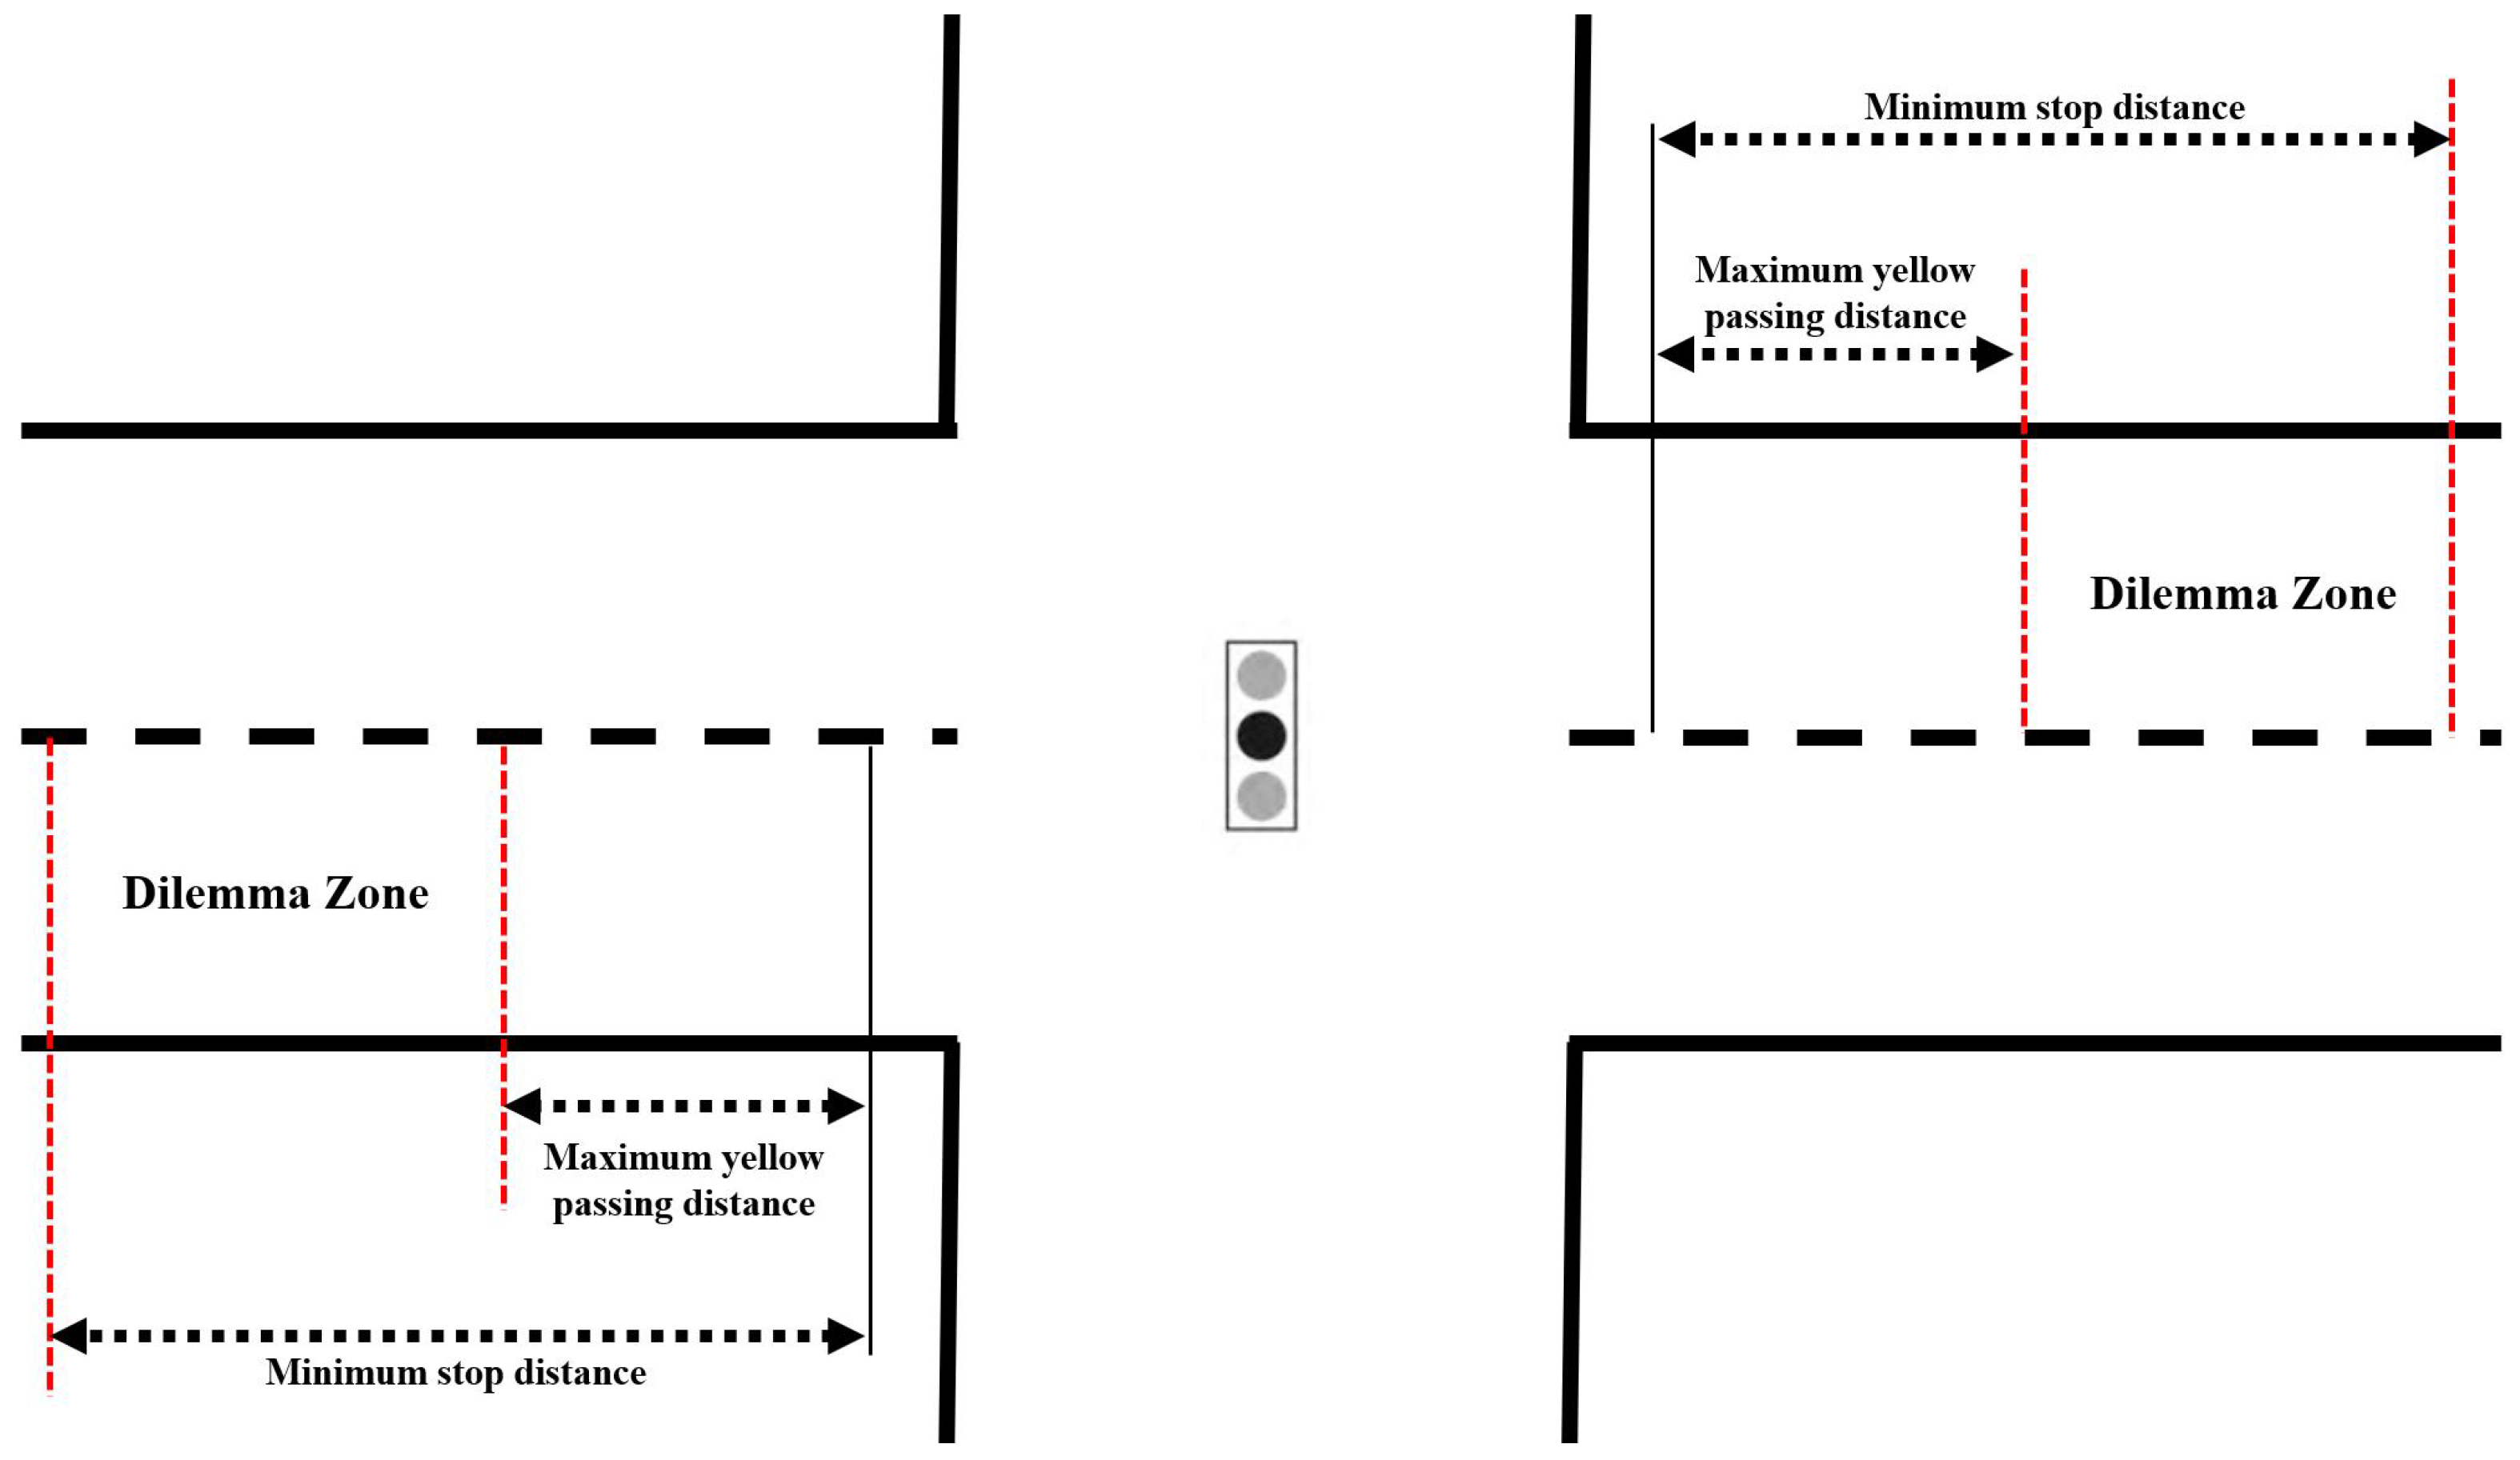
Figure 1. Dilemma zone.
Electronics 12 02344 g001
Figure 2. Detector location.
Electronics 12 02344 g002
Figure 3. Format of data.
Electronics 12 02344 g003
Figure 4. RLR frequency.
Electronics 12 02344 g004
Figure 5. Estimation of RLR frequency.
Electronics 12 02344 g005
Figure 6. The procedure of NSGA-II algorithm.
Electronics 12 02344 g006
Figure 7. The multi-objective optimization procedure.
Electronics 12 02344 g007
Figure 8. The road network.
Electronics 12 02344 g008
Figure 9. Initial population under supersaturation flow.
Electronics 12 02344 g009
Figure 10. Distribution of optimal solutions after various generations.
Electronics 12 02344 g010
Figure 11. Distribution of optimal solutions under saturation flow.
Electronics 12 02344 g011
Figure 12. Distribution of optimal solutions under supersaturation flow.
Electronics 12 02344 g012
Figure 13. Simulation results of different flows.
Electronics 12 02344 g013
Table 1. Descriptive statistics in this paper.
ParameterMeaning
t y onset of yellow time
Yestimated frequency of RLR
T O n e s t Y yellow light start time
kregression coefficient
aregression coefficient
bregression coefficient
φ k , k + 1 the offset for the intersection between k and k+1
f 1 x optimization function that minimizes the average traffic delay
f 2 x optimization function that minimizes yellow arrival
nthroughput of arterial road
d i delay of vehicle i
mnumber intersections
f R , i ( x ) the estimation frequency of red light running
f s i + 1 , f s i 1 the closest function value to individual i for the s-th objective function
f s m a x the maximum value for the s-th objective function
f s m i n the minimum value for the s-th objective function
Table 2. Parameter esimation results.
ParameterEstimationErrorLower Bound (%95)Upper Bound (%95)
k17.0720.14320316.78117.413
a4.1560.1071173.9464.336
b−0.006310.000217−0.00679−0.00609
Table 3. NSGA-II parameters used in simulation tests.
ParameterValueParameterValue
Population Size50No. of Functions2
Chromosome Length55No. of Generation50
Cross-over Probability0.7Mutation Probability0.125
Disclaimer/Publisher’s Note: The statements, opinions and data contained in all publications are solely those of the individual author(s) and contributor(s) and not of MDPI and/or the editor(s). MDPI and/or the editor(s) disclaim responsibility for any injury to people or property resulting from any ideas, methods, instructions or products referred to in the content.