Abstract
Pen-holding postures (PHPs) can significantly affect the speed and quality of writing, and incorrect postures can lead to health problems. This paper presents and experimentally implements a methodology for quickly recognizing and correcting poor writing postures using a digital dot matrix pen. The method first extracts basic handwriting information, including page number, handwriting coordinates, movement trajectory, pen tip pressure, stroke sequence, and pen handling time. This information is then used to generate writing features that are fed into our proposed fusion classification model, which combines a simple parameter-free attention module for convolutional neural networks (CNNs) called NetworkSimAM, CNNs, and an extension of the well-known long short-term memory (LTSM) called Mogrifier LSTM or MLSTM. Finally, the method ends with a classification step (Softmax) to recognize the type of PHP. The implemented method achieves significant results through receiver operating characteristic (ROC) curves and loss functions, including a recognition accuracy of 72%, which is, for example, higher than that of the single-stroke model (i.e., TabNet incorporating SimAM). The obtained results show that a promising solution is provided for accurate and efficient PHP recognition and has the potential to improve writing speed and quality while reducing health problems induced by incorrect postures.
1. Introduction
Poor pen-holding postures (PHPs) may increase the incidence of myopia in students. Danjie Jiang [1] studied how reading and writing posture are related to myopia. The author concluded that keeping an adequate distance between the eye and the book is beneficial to preventing and managing myopia. Li Wei [2] reported that the duration of the reading and writing tasks affected the writing quality of Chinese characters. Li Wei also showed that correct PHPs can produce high-quality strokes in writing. Therefore, it is essential to recognize the type of PHP and distinguish the incorrect PHPs.
This paper presents and experimentally implements the SimAM-CNN-MLSTM approach to recognize erroneous PHPs using handwriting features. Many classification methods based on handwriting features have already been described in the literature. For example, Sheng He and Lambert Schomaker [3] used a deep learning approach to identify writers by exploiting handwritten text features. In 2019, Bailin Yang et al. [4] discussed a model-based unsupervised recognition method for handwriting poses. Their method uses unsupervised clustering to group features and then predict handwriting poses. Nikita Lemos et al. [5] proposed predicting personality traits using handwriting features. In the above references, image processing methods are used to extract handwriting features. However, since image processing is performed after handwriting, the features cannot be acquired in real time for manipulation. In addition, image processing can only provide static features, and information such as pressure and time cannot be obtained. Therefore, recognition performance is poor due to slow writing speed or excessive writing intensity.
Dynamic features are more effective than static features in recognizing erroneous PHPs in real time. Therefore, we propose to use dynamic features for PHP recognition. The accuracy of PHP recognition is highly dependent on the dynamic features of the handwriting. For example, Shammi Akhtar [6] proposed using a handwriting tablet to identify the author’s hand by extracting the dynamic features of the handwriting. In their study, the initial values of dynamic features are used after averaging to improve the quality of the features. Zuzana Dankovičová [7] applied secondary processing features to the classification method of normal and dyslexic writers. The processed dynamic writing features include speed, acceleration, number of pen lifts, and other real-time information. Some researchers also used the same digital pen described in the following sections of this paper to extract highly generalized handwriting features through secondary extraction of the original handwriting information. Their experiments revealed that further processing of the raw data can improve classification performance [8,9].
After obtaining the feature data, a classification model must be designed. Among the different classification models, tree-based models are particularly suitable for tabular data and tend to perform better than deep network models. The most widely used tree-based models are Random Forest [10,11] and XGBoost [12,13]. These models have an approximate decision flow from a hyperplane and an efficient representation of tabular data. In addition, their primary forms are highly interpretable. In contrast, deep network models, such as convolutional neural networks (CNNs) [14,15], with stacked convolutional layers and multilayer perceptrons, are often overly parameterized, resulting in a lack of appropriate induction bias and ultimately poor performance.
TabNet [16] is a simulated decision tree network specialized for processing tabular data. The classification of TabNet is slightly superior to that of Random Forest [17]. The sample used in this paper also consists of tabular data, and its form is a one-dimensional feature vector trained in terms of features. Therefore, for these data, the approach discussed in this study relies on a model based on TabNet. Additionally, to further refine the prediction accuracy, the SimAM [18] module is added to improve the neurons in the feature matrix.
It is known today that the characteristics of multiple strokes in writing contain more information. Therefore, the three-dimensional sample data, combined with the multi-shot features, are imported into the long short-term memory (LSTM) models. This allows the model to process the temporal features. SimAM is integrated into CNN by boosting the weights of highly correlated features [19]. In addition, the Mogrifier long short-term memory (MLSTM) [20] is proposed. This variant of LSTM allows the input data to be fully independent and interact with each other. Therefore, it can significantly improve the performance of the network. In this paper, multiple fusion classification models are proposed to recognize PHPs, and we propose the following five contributions:
(1) Creation of a self-collected dataset, as there are no relevant public datasets to conduct in-depth experiments. This item requires developing a list of experimental tasks, processing raw data, and producing stroke features in writing;
(2) Proposal and implementation of a TabNet model integrating SimAM for PHP recognition and classification of single strokes in writing, which we call single stroke classification (SSC);
(3) Implementation of an MLSTM model, incorporating SimAM and CNN, applied to PHP recognition and classification of multiple strokes in writing, which we call multiple stroke classification (MSC);
(4) Comparison of accuracy rates by F1-score values of the proposed models with other classification models;
(5) Demonstrating the feasibility and stability of proposed models using relevant assessment tools.
The proposed work is organized as follows. Section 2 introduces related work, defines the research problem, and explains why self-collected data were used. Section 3 describes the experimental environment, the data collection process, the feature processing method, and the experimental approach. Section 4 discusses the experimental results. Section 5 concludes the paper and presents future work.
2. Related Work
Although there are currently no studies that use handwriting features to predict PHPs, there have been a wide range of applications in the field of handwriting analysis, such as signature verification and handwritten text recognition. Therefore, in this study, we draw on the existing literature on deep learning techniques and network structures and improve them to predict PHPs using handwriting features. We will present the borrowed models and the improved search methods separately to illustrate the differences and innovations of our study from the existing literature.
CNN is a classic deep learning model that is now widely deployed and mastered. To further improve prediction accuracy, the original CNN model can be improved. For example, SU Rehman et al. [21] proposed a novel unsupervised convolutional neural network approach for visual pattern classification that uses sparse convolutional filters to learn the CNN initialization of the first layer and then allows the CNN to use these features through backward learning to learn higher-level features for classification. They demonstrated the benefits of this method on public datasets. The research team also proposed a new learning strategy for visual classification problems that improves the convergence and learning efficiency of CNN using an improved elastic backpropagation algorithm, also known as the modified resilient backpropagation (MRPROP) algorithm [22]. They achieved good results on public-facing datasets.
SimAM is an out-of-the-box module that has no additional model parameters, which makes it particularly suitable for various deep learning recognition tasks. For example, Zhongwen Wang et al. [19] applied dual-stream convolutional networks combined with SimAM modules for human behavior recognition. The results showed a 2.6% improvement in the UCF101 dataset (action recognition dataset composed of realistic action videos from YouTube with 101 action categories) and a 11.7% improvement in the HMDB51 dataset (dataset consisting of 6766 realistic video clips belonging to 51 action categories, each category containing at least 101 clips). Xiaoyi Qin et al. [23] used the SimAM module to detect noise and were able to reduce the noise detection error rate to 0.643%.
TabNet is a versatile model that has been applied to various domains. Sabri Boughorbel et al. [24] used TabNet to predict vacancy rates in hospitals and achieved better results than traditional machine learning models. Heng Shi et al. [25] used TabNet to detect signaling enzymes and achieved a classification accuracy of 94.51%. In the stock market domain, Jixiang Sun et al. [26] used TabNet for stock market forecasting and found that it outperformed the LSTM, generative adversarial network (GAN), and gate recurrent unit (GRU) models. The model also has good interpretability. In the medical industry, Linfu Jiang et al. [27] used TabNet to predict coronary heart disease and found that it performed better than traditional models.
Merging multiple deep models can improve the accuracy of the base model. For example, recent work in urban planning has shown that CNNs can be combined with LSTM models to predict particulate matter such as PM2.5 (very small particles in air with diameters less than or equal to 2.5 μm) in urban areas, as shown in the work of [28]. The fusion model can also be used to predict other things, such as credit risk prediction [29] and emotion monitoring [30]. All experimental results proved that the fusion model has the highest prediction accuracy. There are also models fused with variants of LSTM, such as bidirectional LSTM. For example, CNNs were combined with bidirectional LSTM to analyze brainwave emotions in [31], resulting in accuracy rates of 88.55% for validity and 89.07% for arousal. Moreover, Hao Li et al. [32] used a combined CNN and MLSTM approach to predict human movements, which includes six common patterns: walking, running, climbing, descending, ascending, and descending. The prediction accuracy of MLSTM was found to be 1.03% better than conventional LSTM, while the accuracy of MLSTM combined with CNN was improved by 1.17%. The above results show the superiority of the algorithm. Ming Lian et al. [33] also used the above method to predict the air pollution levels and air quality data of a city over the last four years. These results indicate that the merged CNN and MLSTM models achieved higher prediction accuracy than the basic model.
The literature review presented here reports models that are certainly effective but have not been used to recognize and classify different PHPs. Moreover, a comprehensive review of what has already been published shows that there is currently no publicly available dynamic handwriting dataset, especially in Chinese. Therefore, it seems essential to build our own dataset before exploring the application of these models in dynamic handwriting recognition for PHPs. Finally, this work aims to determine how to introduce the MSC model into the field of PHP recognition.
3. Materials and Methods
3.1. Data Collection and Processing
This section details the experimental environment implemented as well as the data collection and processing steps.
3.1.1. Experimental Equipment
The experimental environment includes the following hardware and software equipment:
(1) Hardware environment: As shown in Figure 1, a commercially available dot-matrix digital pen was used to collect the dataset. The high-speed camera on the front of the digital pen captures the movement of the pen tip at any time. The pressure sensor sends the pressure data back to the data processor, which then transmits all sorts of information to the outside world via Bluetooth or a USB cable. This information includes paper type, source, page number, position, handwriting coordinates, movement trajectory, pen tip pressure, processing time, etc. The hardware environment for the handwriting capture software is an octa-core Qualcomm Snapdragon 835 processor clocked at 2.45 GHz. The experimental environment for training the model uses the Windows 11 operating system and the AMD Ryzen 7 5800H processor.
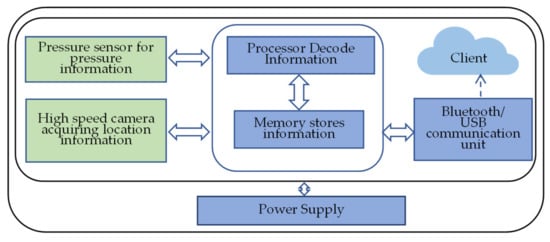
Figure 1.
Functional diagram of the digital pen with dot matrix.
(2) Software environment: The software for collecting the dataset is developed by the user himself and is called Handwriting-collect. It is developed with Android Studio 4.1.3, and the application programming interface (API) version is Android API 29. The library of mathematical operations, numpy 1.19.5, is used for the Python module. Scikit-learn 0.23.2 is used for the machine learning module. For the deep learning module, PyTorch 1.10.2 is used.
3.1.2. Preparation of the Experiment
The following experiments aim at automatically classifying error types in PHP. To do so, we rely on the existing classification in the literature [34]. As shown in Figure 2, we distinguish eight erroneous PHPs from one correct PHP. Table 1 shows the names and corresponding descriptions of the eight erroneous PHPs. The collection of information about the volunteers’ PHPs was performed using worksheets. Each worksheet was divided into nine different writing tasks. These writing tasks required the volunteers to write using one correct PHP and eight incorrect PHPs. The Chinese characters written on each task were the same. Each task included 28 Chinese characters. These Chinese characters include all the strokes in the unification and specification of Chinese character stroke names [35].
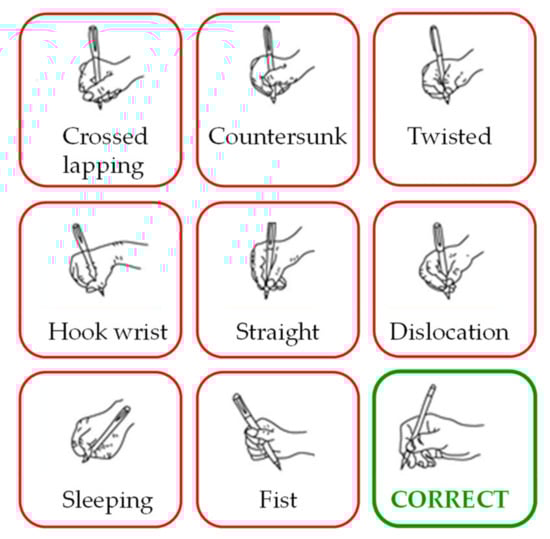
Figure 2.
Eight incorrect PHPs and one correct PHP.

Table 1.
Eight common PHP errors.
3.1.3. Data Collection and Processing
We randomly selected 15 student volunteers, 8 men and 7 women. The volunteers were between 22 and 26 years old. They usually write with the correct PHP and with high frequency. The 15 volunteers were asked to write on a flat table under soft natural light. To enable the volunteers to perform the nine writing tasks thoroughly, they were asked to imitate the writing based on the images of the PHPs and their corresponding descriptions to obtain feature data.
The number of volunteers may seem small, but it generated more than 16,000 samples of handwriting strokes, which is more than sufficient for the small-sample learning experiments conducted in this study.
Once the 15 volunteers have finished writing, the data recorded in the pen is exported. This information includes ( coordinate), ( coordinate), (pressure), (status, including top, move, and bottom), and (timestamp). This information can be retrieved as a matrix of write points using Python’s matplotlib function. A step of search and elimination of the writing noise in the recovered writing is obviously necessary. We identify all write points in the raw data and aggregate the information between adjacent write points. This information extends from the moment the pen touches the paper to the moment it is lifted. For each cluster, we apply 48 feature formulas to obtain a 48-dimensional feature vector that perfectly summarizes the characteristics of each stroke. Our proposed single-stroke model takes a 48-dimensional feature vector as the sampling unit, while the multiple-stroke model takes multiple 48-dimensional feature vectors as the sampling unit.
In the following, we list five representative formulas for these 48 stroke features to explain in detail how handwriting information is converted into features. The average pressure is obtained by (1), where is the number of points generated by the status between the bottom and the top.
The pressure detection is at level 1024, and the value of the pressure entropy is given by (2). Due to the accuracy of pressure sensing, the pressure values of a stroke are divided by 100 in turn in an array before the entropy value is calculated. represents the probability that the current pressure will be divided by 100 after the array value appears.
The values of the coordinates of at the adjacent times of descent and ascent are recorded. The formula to calculate the angle of this stroke (in degrees) is given by (3), where and represent the initial coordinates of a stroke, and and represent the end coordinates of a stroke.
The hover time is given by (4), where the pen remains in the air from the previous stroke up to the next stroke down. In (4), represents the time during which the pen falls under strokes, and represents the time during which the pen rises under strokes.
The length of the stroke (see (5)) is the sum of the distances of all points between adjacent points at the bottom and top. In (5), and represent the distance between the -th point and its previous point in the -axis and -axis directions, respectively.
Using 48 processing formulas, we generate 48 writing features. After labeling their data, they can enter it into the proposed SSC model. For the input data of the MSC, additional processing of single stroke samples is required. Multiple single-line samples with temporal order are grouped according to their sequence length. The writing task consists of 28 Chinese characters broken down into 131 strokes. After taking their average values, they are rounded to 4. Therefore, the MSC in the model considers four strokes as one sample. The data style is shown in Figure 3, where represents the sample and represents the label.
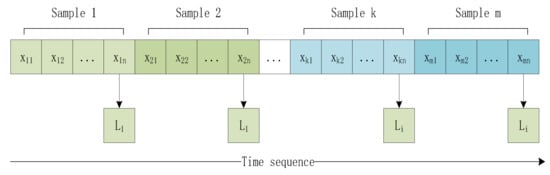
Figure 3.
Diagram illustrating the style of the data.
3.1.4. Dataset
In the SSC, one trait is a sample. In the MSC, four strokes constitute a sample. When the samples of a particular PHP type do not match a multiple of four, we proceed by eliminating the remainder. The number of samples is shown in Table 2.
Table 2.
Number of samples.
3.2. Methods
In order to find the optimal algorithm for PHP recognition, we proposed several recognition algorithms for comparison, including traditional machine learning algorithms and deep learning algorithms.
3.2.1. Traditional Machine Learning Models
The traditional machine learning methods we have used have only been applied to SSC classification problems.
In traditional machine learning, the original data must be filtered. Therefore, the correlation test [36] is used to filter features by combining the and tests [37]. Based on these two different evaluation measures, features with strong correlations can be developed from the 48 original parts.
We divided the original dataset. To avoid random results, the 10 fold cross-validation method [38] is used for each classifier and divides the dataset into ten copies. Nine of these copies are used for training and one for testing. Each test gives the corresponding accuracy (or error rate). The average of the ten results is used to recognize PHP. The traditional classification models used are random forest, XGBoost, and support vector machines (SVM).
3.2.2. SimAM-TabNet
SimAM-TabNet was developed to address the problem of SSC. TabNet is a neural network that focuses on tabular data. It uses the idea of sequential attention to mimic the behavior of decision trees. It can be viewed as a multi-stage neural network that uses two critical operations for each stage: attention and feature transformation. The model can perform end-to-end learning. At the same time, it can also select and process the most useful features to improve interpretability and learning ability.
The feature data enters the batch normalization (BN) layer for data normalization. Normalization is used for feature calculation. Feature selection is then used for weight assignment. A weight matrix filters out the essential features. The result is again imported into the feature transformer. The features are then processed for segmentation. A part of the data is taken as common features by the activation function. The other part is imported into the next step to learn the personality features of each step, until all decision-making steps are completed. SimAM-TabNet is based on the original TabNet with the addition of the SimAM module between the attention and the feature transformer. This allows TabNet to select the parts of the original features that best meet its needs.
SimAM has the advantage of allowing simultaneous attention to the channel and space. To improve attention, this model needs to evaluate the importance of each neuron. Information-rich neurons typically exhibit different discharge patterns than surrounding neurons and inhibit the latter.
Therefore, more emphasis should be placed on neurons with spatial inhibition effects. The minimum energy function is defined by (6).
where:
In the above equations, and are the mean and variance of all neurons except . The lower the energy, the larger the difference between neuron and the surrounding neurons, and the higher the importance. Once the minimum point is obtained by (6), the importance of neurons can be determined by . After evaluating the importance of neurons, the characteristic matrix should be improved by (9), where represents Hadamard’s product.
The complete flowchart of TabNet, incorporating SimAM, is shown in Figure 4.
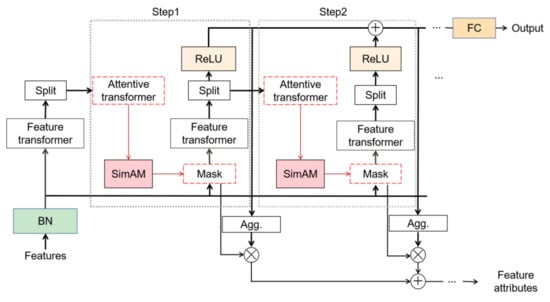
Figure 4.
Block diagram of the SimAM-TabNet model.
3.2.3. SimAM-CNN-MLSTM
The network model first combines several SimAM modules, the number of which is equal to the number of strokes () in a multiple-stroke sample. Four CNN layers that independently extract features to ensure their temporal independence follow each SimAM module. When the input data and the feature vectors of multiple strokes, are fed into multiple identical SimAM-CNNs, 32-dimensional data are formed. By combining MLSTM, the convolution output can be fed sequentially into two MLSTM layers, with the output size of the first MLSTM layer being 256 and that of the second layer being 64. The output of the last state of the second layer is used as the input of the fully connected (FC) layer, and then the FC layer is used to transform the 64-dimensional data into two-dimensional data. Finally, the Softmax activation function is applied to transform the probability distribution vector to recognize PHPs. The data dimension of the SimAM-CNN-MLSTM network for the multi-stroke datasets is shown in Table 3. In Table 3, represents a feature vector consisting of 48 stroke features. The complete flowchart of the SimAM-CNN-MLSTM network is shown in Figure 5, where represents the dimension.
Table 3.
SimAM-CNN-MLSTM network data size for multi-stroke datasets.
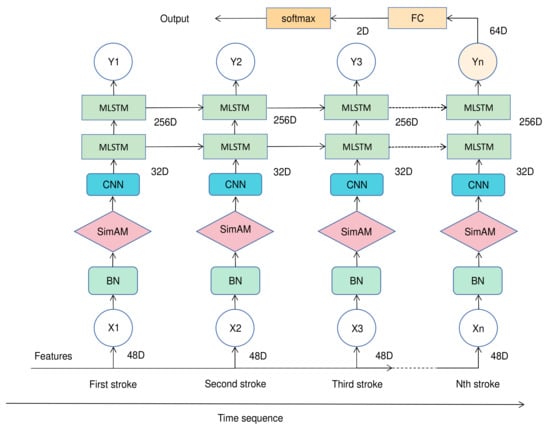
Figure 5.
Complete flowchart of SimAM-CNN-MLSTM.
We will explain in detail the role of each module in SimAM-CNN-MLSTM, knowing that the SimAM module has already been presented in detail in Section 3.2.2.
To further increase the weight of background features before MLSTM input features, this model incorporates SimAM and CNN, whose processes are shown in Figure 6. The samples presented in this paper are textual data. The width is convolved, while the height is not. Once the samples are captured, the data features are normalized, and the results are imported into the convolution layer. Once the convolution is complete, the components extracted by the convolution layer are filtered by maximum clustering. When the multilayer convolution is pooled, it enters the fully connected layer and is passed to the MLSTM.
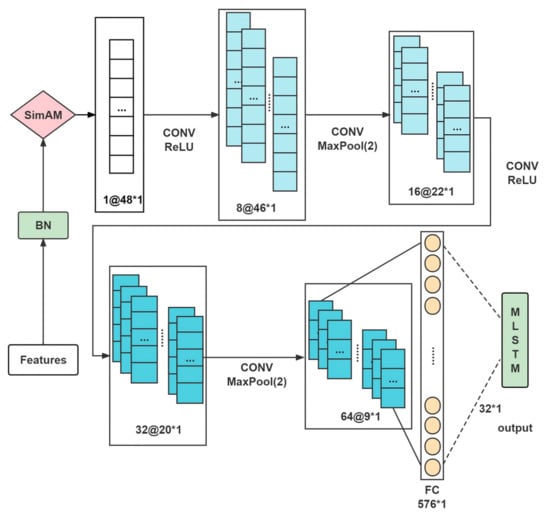
Figure 6.
CNN flow chart.
The LSTM is a short- and long-term memory network, and the model has temporal properties. For this model, we need to continue to process samples from the single-stroke model. Because sample learning is done sequentially, multiple strokes must be linked sequentially in each sample before their order is disturbed to reflect temporality. Then, the new samples are imported into the MSC in temporal order.
LSTM is a powerful alternative to recurrent neural networks (RNNs), which have been widely used for various time-series tasks. As illustrated in Figure 7, its structure is primarily characterized by two parts. The first is the cell state, which transfers information from the previous cell to the next cell. The second is the gate, which includes the input gate, the forget gate, and the output gate. The LSTM produces two outputs: the output value of the LSTM at the current time and the state of the cell at the current time.
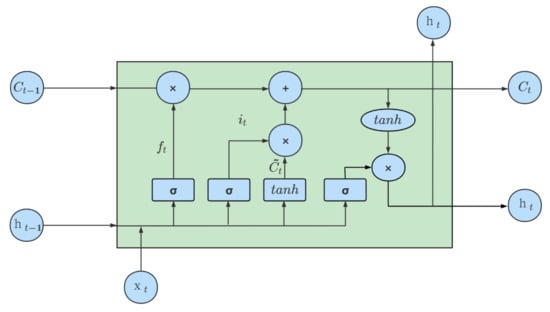
Figure 7.
Block diagram of the LSTM network.
We will detail the blocks of this network.
Forget gate: The output of the previous cell and the input of this cell control the degree of forgetting the state of the last cell through the function. is the weight matrix of the forgetting gate, denotes the joining of two vectors into a longer vector, and is the bias term of the forget gate. The forgetting gate is given by (10).
Input gate: The output of the previous cell and the input of this cell cooperate with the rate function to control the addition of new information. and are the weight matrices of the input gate and cell state, respectively. and represent the bias terms of the input gate and cell state, respectively. The input gate is given by (11). Meanwhile, as explained in (12), the new input information is calculated by the tanh function to generate a new candidate value, which determines the information that will be updated in the cell state.
As explained in (13), the state of cell is determined by the product of the previous state of cell and the output of the forget gate and the new candidate value.
Output gate: This gate controls the degree of filtering of the current cell state. Its operation is described by (14), where is the weight matrix and is the bias term.
MLSTM introduces two control variables, matrices and , to allow interaction between the input information and the previous LSTM state without changing the structure of the LSTM. To align and , it is necessary to align the matrices, which is achieved by using and to align their dimensions. The aligned matrices are then multiplied by element using the Hadamard product. The purpose of this interaction is to improve the context modeling capability, with the hyperparameter representing the number of rounds of interaction. Note that represents the previous state of the LSTM, as does in Figure 5. The interaction is presented in (15) and (16).
Consider the example of the superparameter set to four. In this case, the interaction process between and before each LSTM input is illustrated in Figure 8.
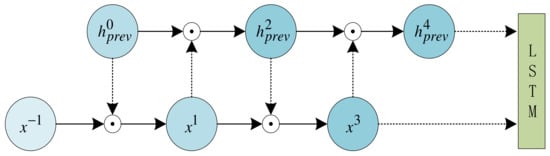
Figure 8.
Example of the interaction between and before each LSTM input.
4. Results
4.1. Evaluation Metrics
The eight incorrect PHPs are combined into negative samples, and the correct PHP is positive. To avoid an excessive difference between the positive and negative samples, subsampling [39] is used to clean up the negative samples to obtain a balanced sample.
We rely on two important metrics, accuracy and F1-score, to assess the performance of the method we implemented.
Accuracy: As described by (17), this is the ratio of correctly classified test samples (CCTS) to all test samples (ATS). All test samples are combined and cleaned of the eight erroneous PHP samples plus the correct PHP samples.
F1-score: This parameter depends on precision () and recall (), whose mathematical expressions are given in (18) and (19). In these equations, , and represent true positives, false positives, and false negatives, respectively. Finally, (20) describes the F1-score.
4.2. Setting the Model Parameters
- (1)
- Traditional Machine Learning Models:
- Random forests: the optimal number of trees is set between 130 and 180;
- SVM: the kernel uses the radial basis function (RBF);
- XGBoost: the number of decision tree estimators (n_estimators) is set to 100. The sum of tree depth and minimum leaf weight is the default parameter of 6 and 1.
- (2)
- SimAM-TabNet:
- SimAM-TabNet: Steps of decision (n_Steps) is set to 4. The number of features in the prediction phase (n_d) is set to 30. The number of characteristics in the attention stage (n_a) is set to 10. The attention updating ratio in Attention is 1.3, Epochs = 300, and Batch size = 100. The training set, test set, and prediction set are 6:2:2. The learning rate is 0.001. Adam is selected as the optimizer. The cross-entropy function is selected as the loss function.
- (3)
- SimAM-CNN-MLSTM:
- SimAM-CNN-MLSTM: Epoch = 300, Dropout = 0.2, and Batch size = 25. The training, test, and verification sets are divided into 6:2:2. The learning rate is 0.0001. Adam is selected as the optimizer. The cross-entropy function is selected as the loss function. The hyperparameter of MLSTM is set to 4. The sequence length of the input model is set to 4.
4.3. Experimental Results
Based on the different algorithms presented in Section 3, we constructed the corresponding optimal models by introducing the optimal parameters obtained from the proposed algorithms. In order to comprehensively evaluate the performance of each model, we also compared the benchmark models before deep learning fusion. Based on the different sample shapes, we divided the experimental results into two categories: the SSC model and the MSC model. The SSC model includes the SSC control model and the model itself. The MSC model, on the other hand, includes the MSC control model and the model itself. The experimental results are summarized in Table 4.
Table 4.
Accuracy and F1-score of different types of experimentally implemented models.
As shown in Table 4, the accuracy of the random forest is the highest among the traditional machine learning models, and it is even higher than that of the CNN model in the deep learning domain. In SSC, the accuracy and F1-score of TabNet are the best among the proposed models. LSTM is proposed to explore the temporal correlation of multiple hits. Time series are added to the dataset to improve its performance. As a result, the accuracy of LSTM is higher than that of TabNet in the SSC. In addition, the parameter-free attention mechanism is added to the proposed models to improve their performance. The accuracy and F1-score of SimAM-CNN-MLSTM are the highest among these classification models.
4.4. Model Analysis
We also examine the performance under different layer structures. As shown in Figure 9, it appears that the accuracy and F1-score are better with a two-layer structure. The other parameters of the model are invariant during the tests.
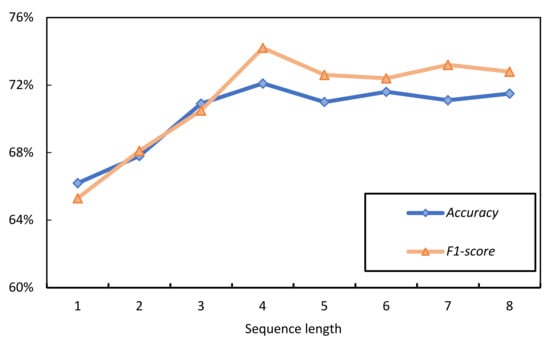
Figure 9.
Performance of the SimAM-CNN-MLSTM model: accuracy and F1-score as a function of the number of layers.
The experiments show that the accuracy increases until it reaches a peak and then tends to decrease when the number of layers in the MLSTM is two. The general direction of the F1-score is similar to that of accuracy. It appears that MLSTM learns better when there are two layers than when there is only one. However, as the number of layers increases, the gradient between layers disappears, resulting in a decrease in accuracy. In addition, increasing the number of layers leads to exponential growth in time and memory. Summarizing the above factors, we chose a two-layer MLSTM in our proposed model.
The SimAM-CNN-MLSTM model shows that in the process of extracting information from the time series, the length of the sequence step can affect the accuracy of the final prediction. If the step length is too short, it will weaken the correlation between strokes. If it is too long, the gradient will disappear or explode. Figure 10 shows the accuracy and F1-score of the predictions for different sequence lengths. The other parameters also remained unchanged during the tests.
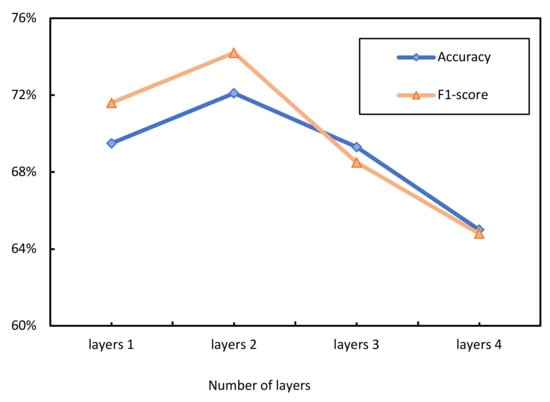
Figure 10.
Performance of the SimAM-CNN-MLSTM model: accuracy and F1-score as a function of sequence length.
All the experiments show that the highest accuracy of the results is 72.1% when the step length is 4. However, when the step length increases in the time dimension, the model learns more redundant data, which leads to a decrease in accuracy. The average of the features of each Chinese character is also taken into account. Therefore, a sequence length of four is chosen in the proposed model.
To comprehensively analyze the stability of SimAM-TabNet and SimAM-CNN-MLSTM, we use the ROC (receiver operating characteristics) and loss curves, shown in Figure 11.
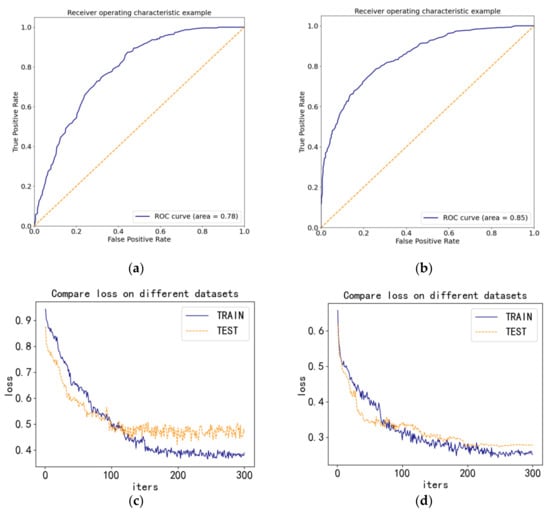
Figure 11.
(a) SimAM-TabNet ROC curve; (b) SimAM-CNN-MLSTM ROC Curve; (c) SimAM-TabNet loss curves; (d) SimAM-CNN-MLSTM loss curves.
Points (a) and (b) in Figure 11 show that the area under the ROC curve (AUC) is 0.78 for SimAM-TabNet and 0.85 for SimAM-CNN-MLSTM. According to the criterion that the higher the AUC value, the higher the accuracy of the prediction model, it can be concluded that the classification performance of the SimAM-CNN-MLSTM prediction model is better than the SimAM-TabNet model. Observing the loss curves in (c) and (d) of Figure 11 shows that the loss of SimAM-TabNet and SimAM-CNN-MLSTM decreases as the number of iterations increases. Fortunately, the loss of SimAM-CNN-MLSTM in the test set decreases more steadily than that of SimAM-TabNet, indicating that SimAM-CNN-MLSTM is stable. Therefore, multiple stroke samples extract better writing characteristics than single stroke samples.
5. Conclusions
This paper proposes and implements an effective method for quickly recognizing and correcting poor writing postures using a digital dot matrix pen to conduct in-depth experiments. First, fifteen volunteers used the digital dot matrix pen to write on dot paper, generating over 16,000 writing strokes. All this data was then exported, the noise was removed, and the data could be processed and used. After obtaining the valid feature data, the pen holding postures (PHPs) are first recognized using traditional machine learning classification models. Additional feature filtering is required before continuing the experiments. We find that tree-based models, such as random forest and XGBoost, perform better than other traditional machine learning classification models. This result is due to the fact that tree models have decision flow shapes close to the hyperplane and have an efficient representation capability for tabular data. In addition, the TabNet model achieved a higher correction rate than the traditional tree model due to its ability to not only mimic tree models but also to learn from one end to the other. Among the different deep learning models, the SimAM integrated model was found to improve the classification effect. Finally, we composed the samples in temporal order using multiple occurrence feature data. These samples are fed into LSTM in order, and their models are better than those of single samples. To boost the accuracy further, an existing parameter-free attention module (SimAM) dedicated to convolutional neural networks (CNNs) is integrated with long short-term memory (LSTM) and applied to a CNN to extract the basic features. We also use Mogrifier long short-term memory (MLSTM) to have the input interact with the output of the previous unit. Finally, it is worth noting that the accuracy of this model reached 72.1%, the F1-score reached 74.2%, and the AUC value reached 0.85, indicating excellent classification performance. All the experiments conducted show that SimAM-CNN-MLSTM performs well and thus allows us to build the corresponding classification models to correct PHPs.
In the experiments, the erroneous PHPs are produced by imitation of the volunteers. The handwriting data were collected based on the description of the posture and the imitation of the image and may deviate slightly from reality. In the future, we will collect more data from volunteers accustomed to erroneous PHPs to build a relevant public dataset. We also note that the current study does not specifically distinguish between types of erroneous PHPs. Therefore, recognizing PHP types will be a new direction for our research. We will focus on this part of our future work.
Author Contributions
Conceptualization, X.W. and H.Q.; methodology, X.W., Y.L. and S.J.; software, Y.L.; validation, X.W., C.Z. and H.Q.; formal analysis, S.J.; investigation, X.W. and C.Z.; resources, X.W. and C.Z.; data curation, X.W. and C.Z.; writing—original draft preparation, X.W. and Y.L.; writing—review and editing, X.W., Y.L. and S.J.; visualization, X.W. and Y.L.; supervision, S.J.; project administration, H.Q.; funding acquisition, H.Q. All authors have read and agreed to the published version of the manuscript.
Funding
This research received no external funding.
Data Availability Statement
Not applicable.
Acknowledgments
These research activities are currently supported by Huzhou University as well as the University of Tours. The authors of this manuscript would like to thank their colleagues from the above-mentioned institutions, who have largely contributed to the success of this work.
Conflicts of Interest
The authors declare no conflict of interest.
Abbreviations
The following abbreviations are used in this paper:
| API | Application programming interface |
| ATS | All test samples |
| AUC | Area under the curve |
| BN | Batch normalization |
| CCTS | Correctly classified test samples |
| CNN | Convolutional neural network |
| FC | Fully connected |
| FN | False negative |
| FP | False positive |
| GAN | Generative adversarial network |
| GRU | Gate recurrent unit |
| LSTM | Long short-term memory |
| MLSTM | Mogrifier long short-term memory |
| MRPROP | Modified resilient backpropagation |
| MSC | Multiple stroke classification |
| PHP | Pen holding posture |
| RBF | Radial basis function |
| RNN | Recurrent neural network |
| ROC | Receiver operating characteristic |
| SSC | Single stroke classification |
| SVM | Support vector machines |
| TP | True positive |
References
- Jiang, D.; Shi, B.; Gao, H.; Guo, Y.; Zhou, S.; Zhang, Y. Associations between Reading and Writing Postures and Myopia among School Students in Ningbo, China. Front. Public Health 2022, 10, 713377. [Google Scholar] [CrossRef] [PubMed]
- Wei, L. The Influence of Pen Holding Posture and Writing Task Length on the Writing Quality of Chinese Characters; Shanghai Normal University: Shanghai, China, 2013. [Google Scholar]
- He, S.; Schomaker, L. Deep Adaptive Learning for Writer Identification Based on Single Handwritten Word Images. Pattern Recognit. 2019, 88, 64–74. [Google Scholar] [CrossRef]
- Yang, B.; Zhang, Y.; Liu, Z.; Jiang, X.; Xu, M. Handwriting Posture Prediction Based on Unsupervised Model. Pattern Recognit. 2020, 100, 107093. [Google Scholar] [CrossRef]
- Lemos, N.; Shah, K.; Rade, R.; Shah, D. Personality Prediction Based on Handwriting Using Machine Learning. In Proceedings of the 2018 International Conference on Computational Techniques, Electronics and Mechanical Systems (CTEMS), Belgaum, India, 21–22 December 2018. [Google Scholar]
- Akhtar, S.; Dipti, M.M.; Tinni, T.A.; Khan, P.; Kabir, R.; Islam, M.R. Analysis on Handwriting Using Pen-Tablet for Identification of Person and Handedness. In Proceedings of the 2021 International Conference on Information and Communication Technology for Sustainable Development (ICICT4SD), Dhaka, Bangladesh, 27–28 February 2021. [Google Scholar]
- Dankovičová, Z.; Hurtuk, J.; Feciľak, P. Evaluation of Digitalized Handwriting for Dysgraphia Detection Using Random Forest Classification Method. In Proceedings of the 2019 IEEE 17th International Symposium on Intelligent Systems and Informatics (SISY), Subotica, Serbia, 12–14 September 2019. [Google Scholar]
- Qi, H.; Zhang, R.; Wei, Z.; Zhang, C.; Wang, L.; Lang, Q.; Zhang, K.; Tian, X. A study of auxiliary screening for Alzheimer’s disease based on handwriting characteristics. Front. Aging Neurosci. 2023, 15, 1117250. [Google Scholar] [CrossRef] [PubMed]
- Lu, J.; Qi, H.; Wu, X.; Zhang, C.; Tang, Q. Research on Authentic Signature Identification Method Integrating Dynamic and Static Features. Appl. Sci. 2022, 12, 9904. [Google Scholar] [CrossRef]
- Breiman, L. Random Forests. Mach. Learn. 2001, 45, 5–32. [Google Scholar] [CrossRef]
- Zhang, Y.; Liu, J.; Shen, W. A Review of Ensemble Learning Algorithms Used in Remote Sensing Applications. Appl. Sci. 2022, 12, 8654. [Google Scholar] [CrossRef]
- Chen, T.; Guestrin, C. XGBoost: A Scalable Tree Boosting System. In Proceedings of the 22nd ACM SIGKDD International Conference on Knowledge Discovery and Data Mining, San Francisco, CA, USA, 13–17 August 2016. [Google Scholar]
- Le, T.-T.-H.; Oktian, Y.E.; Kim, H. XGBoost for Imbalanced Multiclass Classification-Based Industrial Internet of Things Intrusion Detection Systems. Sustainability 2022, 14, 8707. [Google Scholar] [CrossRef]
- Rehman, S.U.; Tu, S.; Huang, Y.; Rehman, O.U. A benchmark dataset and learning high-level semantic embeddings of multimedia for cross-media retrieval. IEEE Access 2018, 6, 67176–67188. [Google Scholar] [CrossRef]
- Rehman, S.U.; Tu, S.; Huang, Y.; Yang, Z. Face recognition: A novel un-supervised convolutional neural network method. In Proceedings of the 2016 IEEE International Conference of Online Analysis and Computing Science (ICOACS), Chongqing, China, 28–29 May 2016. [Google Scholar]
- Arik, S.Ö.; Pfister, T. TabNet: Attentive Interpretable Tabular Learning. In Proceedings of the AAAI Conference on Artificial Intelligence, Virtual, 2–9 February 2021. [Google Scholar]
- Shin, J.; Maniruzzaman, M.; Uchida, Y.; Hasan, M.A.H.; Megumi, A.; Suzuki, A.; Yasumura, A. Important Features Selection and Classification of Adult and Child from Handwriting Using Machine Learning Methods. Appl. Sci. 2022, 12, 5256. [Google Scholar] [CrossRef]
- Yang, L.; Zhang, R.-Y.; Li, L.; Xie, X. SimAM: A Simple, Parameter-Free Attention Module for Convolutional Neural Networks. In Proceedings of the International Conference on Machine Learning, Virtual, 18–24 July 2021. [Google Scholar]
- Wang, Z.; Lu, H.; Jin, J.; Hu, K. Human Action Recognition Based on Improved Two-Stream Convolution Network. Appl. Sci. 2022, 12, 5784. [Google Scholar] [CrossRef]
- Melis, G.; Kočiský, T.; Blunsom, P. Mogrifier LSTM. arXiv 2019, arXiv:1909.01792. [Google Scholar]
- Rehman, S.U.; Tu, S.; Huang, Y.; Liu, G. CSFL: A novel unsupervised convolution neural network approach for visual pattern classification. AI Commun. 2017, 30, 311–324. [Google Scholar] [CrossRef]
- Rehman, S.U.; Tu, S.; Rehman, O.U.; Huang, Y.; Magurawalage, C.M.S.; Chang, C.-C. Optimization of CNN through novel training strategy for visual classification problems. Entropy 2018, 20, 290. [Google Scholar] [CrossRef]
- Qin, X.; Li, N.; Weng, C.; Su, D.; Li, M. Simple Attention Module Based Speaker Verification with Iterative Noisy Label Detectionn. In Proceedings of the ICASSP 2022-2022 IEEE International Conference on Acoustics, Speech and Signal Processing (ICASSP), Singapore, 23–27 May 2022. [Google Scholar]
- Boughorbel, S.; Jarray, F.; Kadri, A. Fairness in TabNet Model by Disentangled Representation for the Prediction of Hospital No-Show. arXiv 2021, arXiv:2103.04048. [Google Scholar]
- Shi, H.; Chikhaoui, B.; Wang, S. Tree-Based Models for Pain Detection from Biomedical Signals. In Proceedings of the Participative Urban Health and Healthy Aging in the Age of AI: 19th International Conference, ICOST 2022, Paris, France, 27–30 June 2022; Springer: Cham, Switzerland, 2022. [Google Scholar]
- Sun, J.; Yang, F. Multi-factor Investment Model Based on TabNet. J. Phys. Conf. Ser. 2022, 2171, 012057. [Google Scholar] [CrossRef]
- Jiang, L.; Yuan, Z.; Zhang, X.; Jiang, H.; Sun, X. 10-Year Prediction of Coronary Heart Disease Based on PCHD-TabNet. Data Analysis and Knowledge Discovery. 2022. Available online: https://manu44.magtech.com.cn/Jwk_infotech_wk3/EN/10.11925/infotech.2096-3467.2022.0603 (accessed on 9 April 2023).
- Huang, C.-J.; Kuo, P.-H. A Deep CNN-LSTM Model for Particulate Matter (PM2.5) Forecasting in Smart Cities. Sensors 2018, 18, 2220. [Google Scholar] [CrossRef]
- Li, J.; Xu, C.; Feng, B.; Zhao, H. Credit Risk Prediction Model for Listed Companies Based on CNN-LSTM and Attention Mechanism. Electronics 2023, 12, 1643. [Google Scholar] [CrossRef]
- Ullah, F.; Chen, X.; Shah, S.B.H.; Mahfoudh, S.; Abul Hassan, M.; Saeed, N. A Novel Approach for Emotion Detection and Sentiment Analysis for Low Resource Urdu Language Based on CNN-LSTM. Electronics 2022, 11, 4096. [Google Scholar] [CrossRef]
- Zhu, L. Emotional Analysis of Brain Waves Based on CNN and Bi-LSTM. J. Appl. Sci. 2022, 40, 12. [Google Scholar]
- Li, H. Human Motion Pattern Recognition Algorithm Based on CNN-Mogrifier LSTM. Electron. Meas. Technol. 2021, 44, 6. [Google Scholar]
- Lian, M.; Liu, J. Single Pollutant Prediction Approach by Fusing MLSTM and CNN. In Knowledge Science, Engineering and Management, Proceedings of the 15th International Conference, KSEM 2022, Singapore, 6–8 August 2022, Part III; Springer: Cham, Switzerland, 2022. [Google Scholar]
- Kushki, A.; Schwellnus, H.; Ilyas, F.; Chau, T. Changes in kinetics and kinematics of handwriting during a prolonged writing task in children with and without dysgraphia. Res. Dev. Disabil. 2011, 32, 1058–1064. [Google Scholar] [CrossRef] [PubMed]
- Wen, X. The Unification and Standardization of Chinese Character Stroke Names. J. Sichuan Univ. Educ. 1999, 109–111. [Google Scholar]
- Lavanya, K.; Bajaj, S.; Tank, P.; Jain, S. Handwritten Digit Recognition Using Hoeffding Tree, Decision Tree, and Random Forests—A Comparative Approach. In Proceedings of the 2017 International Conference on Computational Intelligence in Data Science (ICCIDS), Chennai, India, 2–3 June 2017. [Google Scholar]
- Bandyopadhyay, A.; Hazra, A. A Comparative Study of Classifier Performance on Spatial and Temporal Features of Handwritten Behavioural Data. In Intelligent Human Computer Interaction, Proceedings of the 8th International Conference, IHCI 2016, Pilani, India, 12–13 December 2016; Springer: Cham, Switzerland, 2017; pp. 111–121. [Google Scholar]
- Cheng, H.; Tan, P.-N.; Jin, R. Efficient Algorithm for Localized Support Vector Machine. IEEE Trans. Knowl. Data Eng. 2010, 22, 537–549. [Google Scholar] [CrossRef]
- Ramentol, E.; Caballero, Y.; Bello, R.; Herrera, F. SMOTE-RSB *: A hybrid preprocessing approach based on oversampling and undersampling for high imbalanced data-sets using SMOTE and rough sets theory. Knowl. Inf. Syst. 2012, 33, 245–265. [Google Scholar] [CrossRef]
Disclaimer/Publisher’s Note: The statements, opinions and data contained in all publications are solely those of the individual author(s) and contributor(s) and not of MDPI and/or the editor(s). MDPI and/or the editor(s) disclaim responsibility for any injury to people or property resulting from any ideas, methods, instructions or products referred to in the content. |
© 2023 by the authors. Licensee MDPI, Basel, Switzerland. This article is an open access article distributed under the terms and conditions of the Creative Commons Attribution (CC BY) license (https://creativecommons.org/licenses/by/4.0/).