Article

Multi-Scale Residual Aggregation Feature Pyramid Network for Object Detection

1
Key Laboratory of China’s Ethnic Languages and Information Technology of Ministry of Education, Northwest Minzu University, Lanzhou 730000, China
2
School of Mathematics and Computer Science, Northwest Minzu Univsersity, Lanzhou 730000, China
*
Author to whom correspondence should be addressed.
Electronics 2023, 12(1), 93; https://doi.org/10.3390/electronics12010093
Submission received: 15 November 2022 / Revised: 16 December 2022 / Accepted: 21 December 2022 / Published: 26 December 2022

Abstract

:
The effective use of multi-scale features remains an open problem for object detection tasks. Recently, proposed object detectors have usually used Feature Pyramid Networks (FPN) to fuse multi-scale features. Since Feature Pyramid Networks use a relatively simple feature map fusion approach, it can lead to the loss or misalignment of semantic information in the fusion process. Several works have demonstrated that using a bottom-up structure in a Feature Pyramid Network can shorten the information path between lower layers and the topmost feature, allowing an adequate exchange of semantic information from different layers. We further enhance the bottom-up path by proposing a multi-scale residual aggregation Feature Pyramid Network (MSRA-FPN), which uses a unidirectional cross-layer residual module to aggregate features from multiple layers bottom-up in a triangular structure to the topmost layer. In addition, we introduce a Residual Squeeze and Excitation Module to mitigate the aliasing effects that occur when features from different layers are aggregated. MSRA-FPN enhances the semantic information of the high-level feature maps, mitigates the information decay during feature fusion, and enhances the detection capability of the model for large objects. It is experimentally demonstrated that our proposed MSRA-FPN improves the performance of the three baseline models by 0.5–1.9% on the PASCAL VOC dataset and is also quite competitive with other state-of-the-art FPN methods. On the MS COCO dataset, our proposed method can also improve the performance of the baseline model by 0.8% and the baseline model’s performance for large object detection by 1.8%. To further validate the effectiveness of MSRA-FPN for large object detection, we constructed the Thangka Figure Dataset and conducted comparative experiments. It is experimentally demonstrated that our proposed method improves the performance of the baseline model by 2.9–4.7% on this dataset and can reach up to 71.2%.

1. Introduction

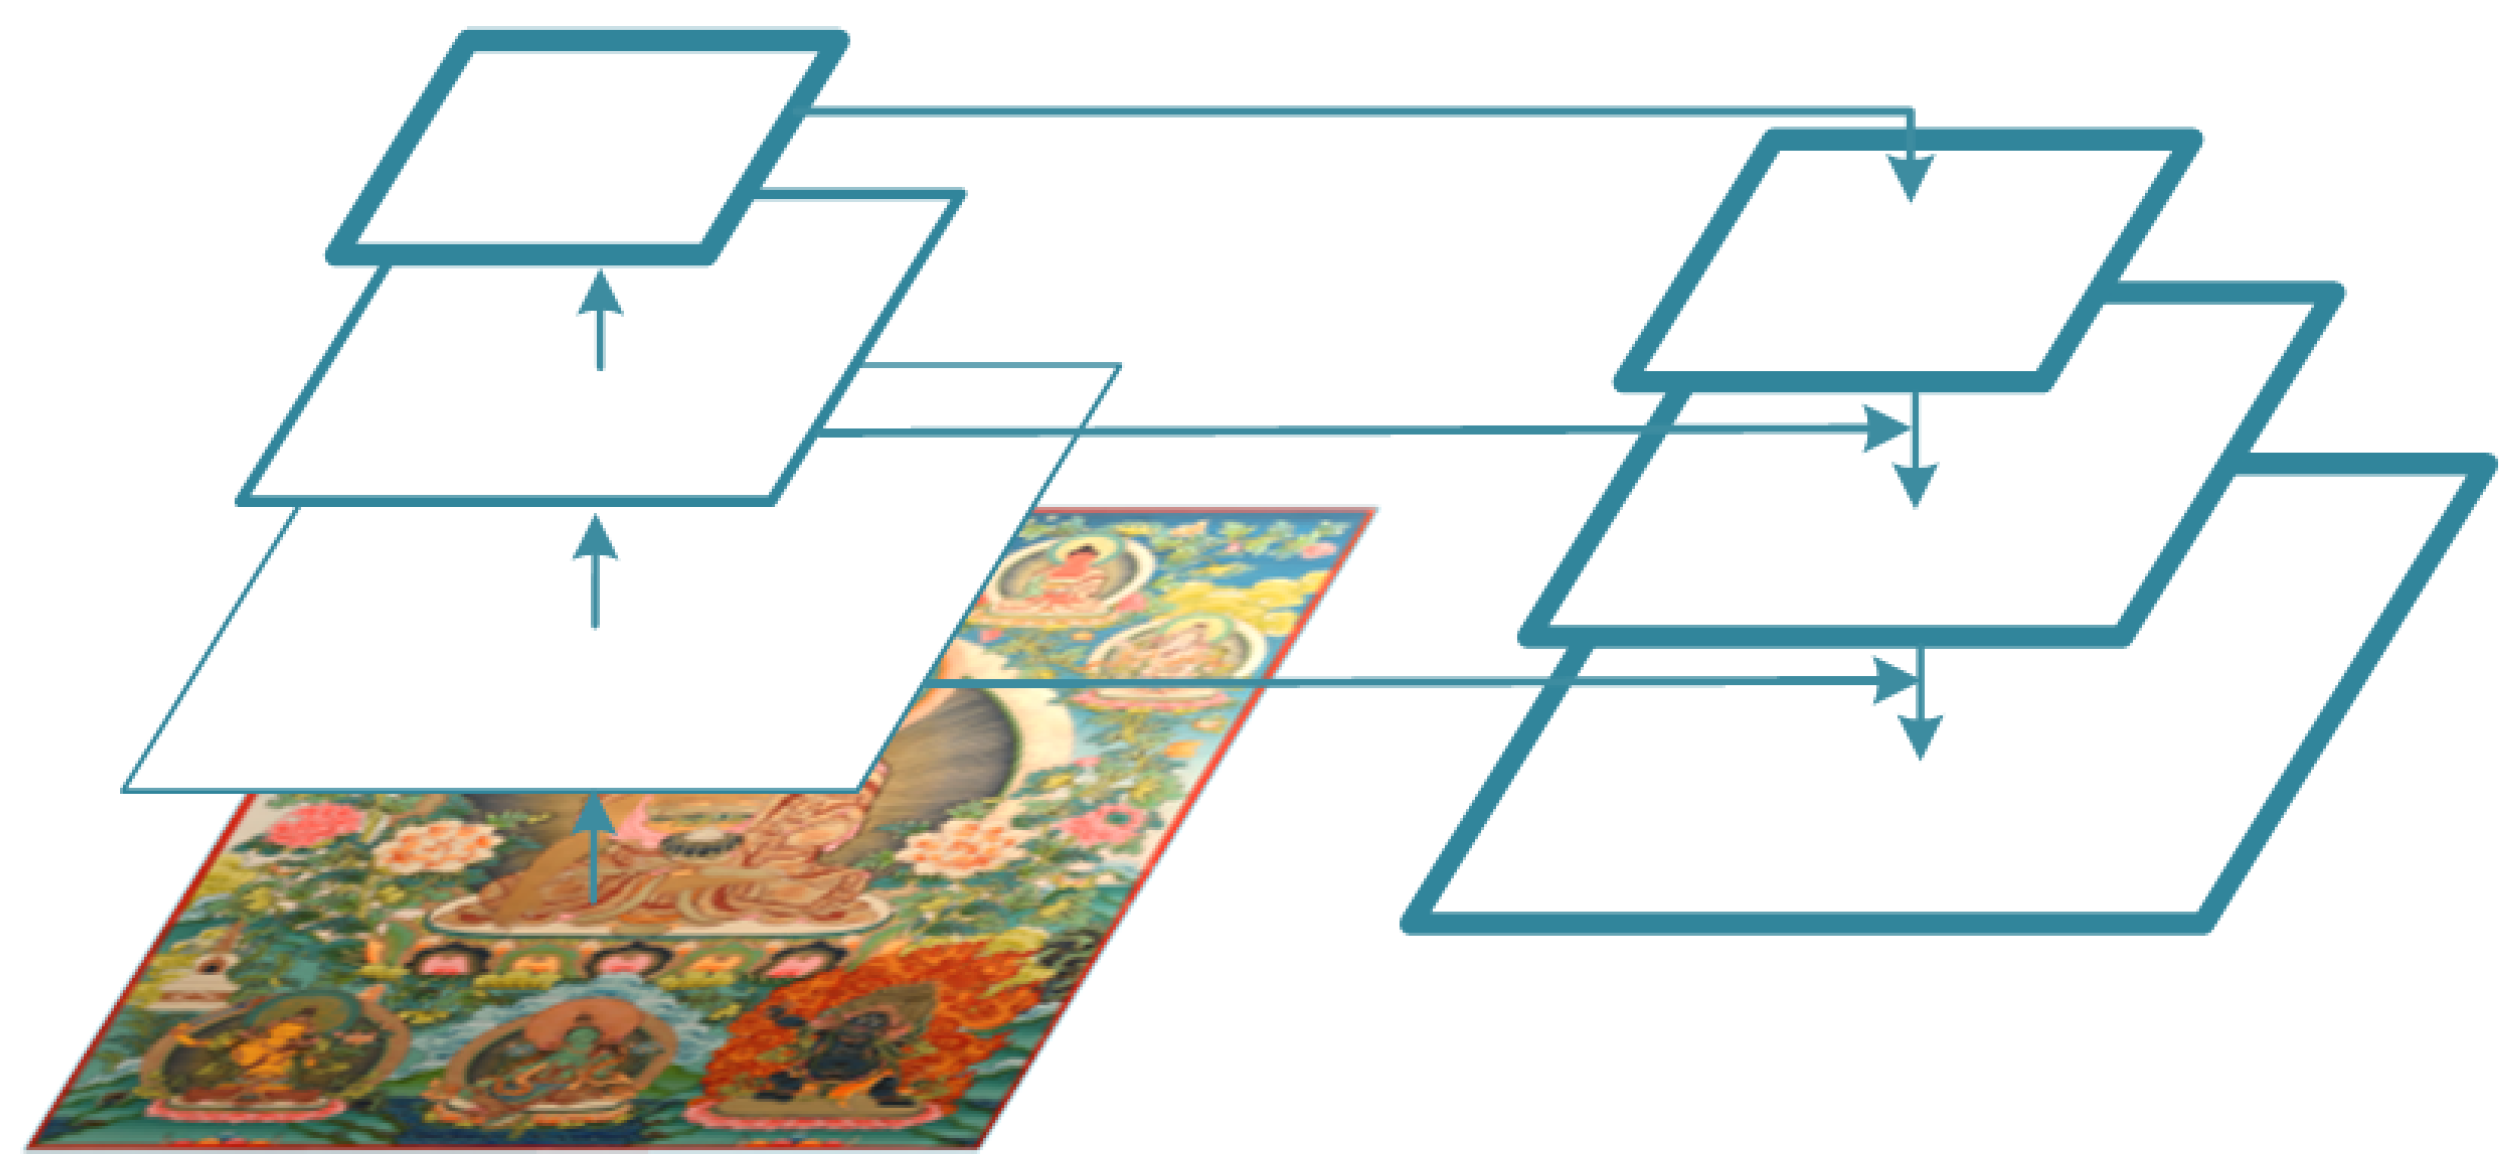
Object detection is one of the most fundamental and challenging problems in computer vision, aiming to predict a bounding box with category labels for objects of interest in images. It has a wide range of applications in many fields, such as autonomous driving [1], face detection [2], remote sensing [3], and medical care [4]. In recent years, significant progress has been made in applying neural networks to image processing, and some researchers have also tried to introduce convolutional neural networks into object detection tasks. The input image of the object detector has to go through several convolutional layers of the backbone to extract features first, in which the scale of the input image is shrinking, the number of channels is increasing, and the semantic information represented becomes more and more abstract. In other words, the feature maps obtained from the shallow layer of the backbone contain more spatial information, which is beneficial for detecting small objects and predicting object locations. In contrast, the deep layer of the backbone contains more abstract semantic information, which is beneficial for detecting large objects and predicting classification, thus causing the problem of semantic imbalance between different feature maps. Some early object detectors use feature maps of different scales obtained from different stages of the backbone for direct prediction to enhance the model’s detection capability. However, this approach does not solve the problem of semantic imbalance between feature maps well. Therefore, the authors of [5] proposed a Feature Pyramid Network (FPN), as shown in Figure 1. As can be seen from the figure, the FPN passes the high-level features of the backbone network to the low-level feature maps through a top-down structure, which complements the low-level semantics, so that a high-resolution, strongly semantic bottom-level feature map can be obtained, which is beneficial for the detection of small objects. The structure achieves the exchange of semantic information between feature maps at different levels, alleviating the imbalance problem between feature maps.
However, the FPN still has some problems. (1) Information decay. When FPN aggregates information from feature maps at different scales, multiple upsampling leads to information decay or misalignment, thus making the semantic information exchange between different feature maps inadequate.
Some methods counteract information decay by enhancing features or introducing new upsampling modules. AugFPN [6] reduces the information loss in the top feature by residual feature enhancement. At the same time, FaPN [7] enhances upsampling by introducing deformable convolution, thereby reducing the misalignment generated by feature map fusion. CARAFE [8] proposed a general and lightweight feature upsampling method to mitigate information loss during upsampling. There are also methods to mitigate information decay by changing the structure of the FPN. In contrast to the single top-down fusion structure of FPN in Figure 2a, the PANet [9] shown in Figure 2b adds a bottom-up structure to FPN. This structure enhances the entire feature hierarchy using accurate low-level spatial information, thus shortening the information path between the low-level and high-level features. The BiFPN [10] in Figure 2c adds residual connections to the PANet, removes the nodes of single input edges, and finally superimposes multiple BiFPN Layers to enhance the perception of multi-scale features of the detector. FPANet [11] augmented the BiFPN with the proposed SeBiFPN. Second, the lateral connection of the FPN directly compresses the feature map channels from the backbone, which also causes a large amount of information fading. CE-FPN [12] mitigates the information decay of lateral connections by introducing sub-pixel convolution, and reference [13] applies deformable convolution to lateral connections with FPN to enhance the semantics. (2) Aliasing effects during fusion. Feature maps obtained at different stages of the backbone have completely different semantic information. A simple additive fusion of these feature maps will result in aliasing effects. Methods such as CE-FPN and FaPN redirect the fused feature maps for channel guidance to mitigate aliasing effects.
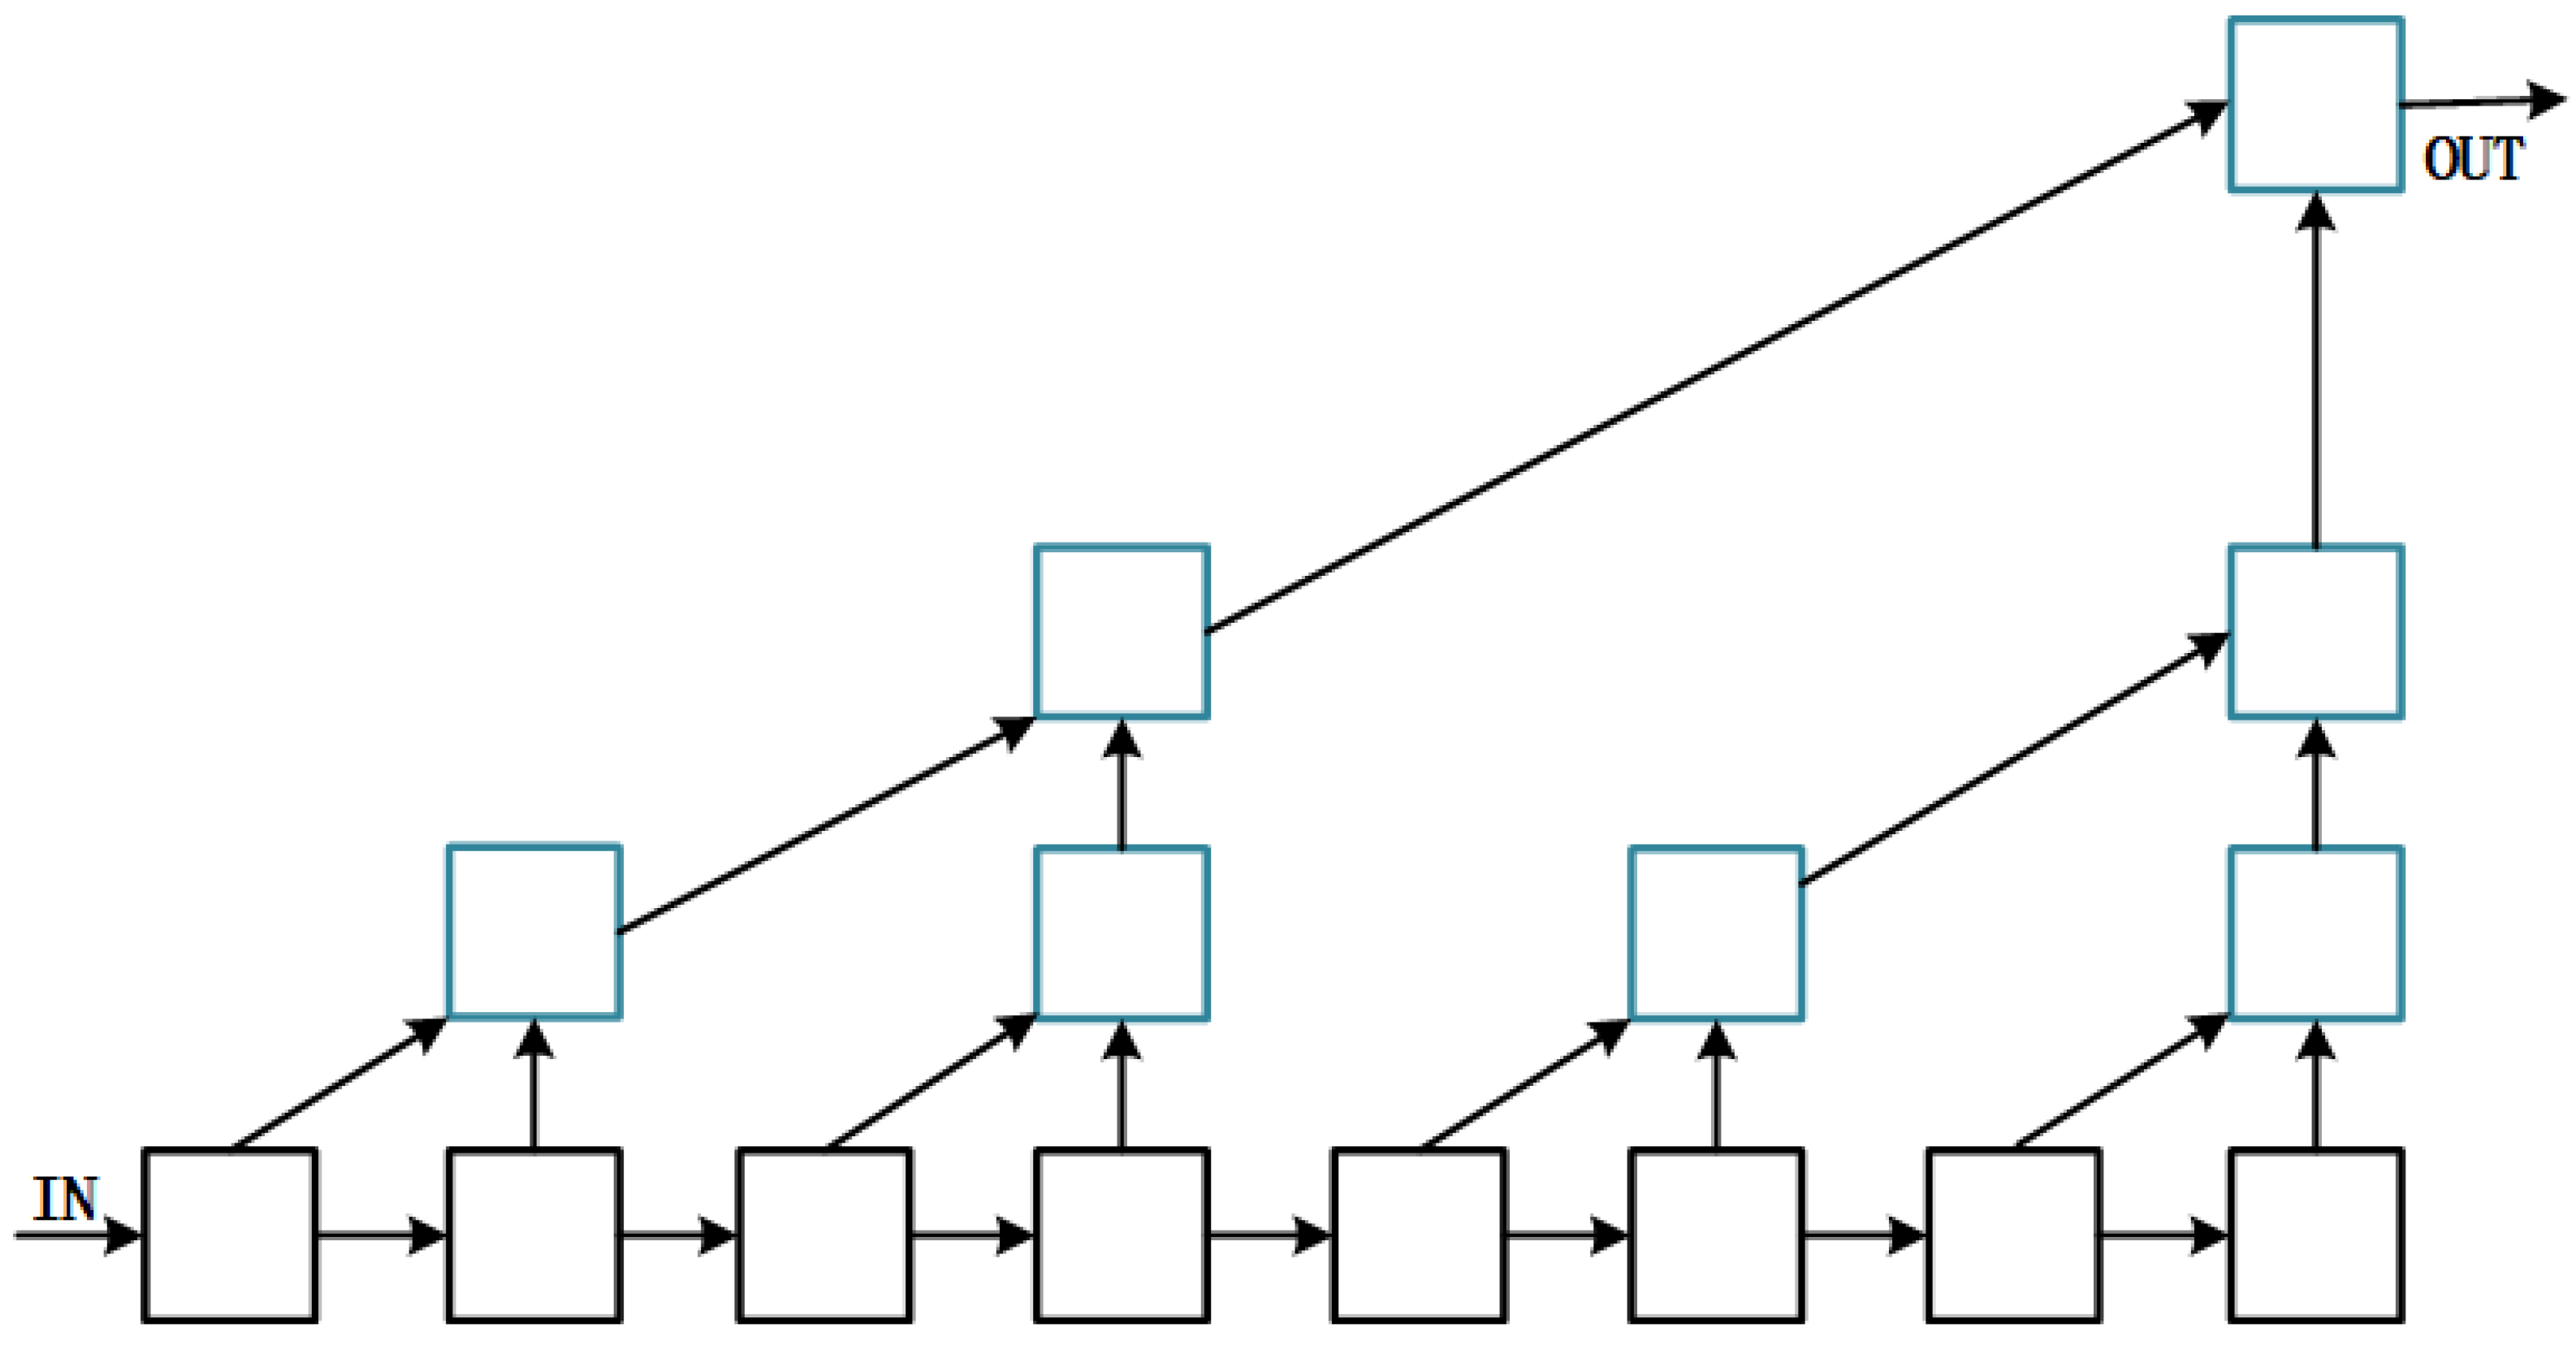
To address these issues, we have made three improvements to the FPN. (1) Unidirectional Cross-Level Residual Aggregation Module (UCLRAM). Models such as PANet and BiFPN have achieved good results in combating information fading using the underlying feature maps. However, we believe it is still possible to improve the scale awareness of FPN by enhancing this bottom-up structure. To this end, we improved the tree-structured aggregation network of DLA [14] (as in Figure 3), which aggregates the features extracted from two adjacent feature extraction blocks in the backbone of a tree structure that can better fuse semantic and spatial information. We only keep the lateral and bottom-up connections of the tree-structured aggregation network, add the bottom-up aggregation connections of the same stage, and finally adjust the overall structure to be better for feature fusion. We name the adjusted aggregation structure UCLRAM. UCLRAM aggregates the semantic information contained in the feature maps from different scales in a triangular structure from the bottom up to the top layer, countering the information decay during upsampling (top-down) by enhancing the semantic information at the topmost layer. (2) Introduction of residual structure. We introduce the information in the high-level of FPN to the bottom layer through the residual structure in upsampling, which also mitigates the information decay to a different extent. (3) Residual Squeeze and Excitation Module (RSEM). In order to mitigate aliasing effects, we designed a Residual Squeeze and Excitation Module and placed it at the three aggregation nodes with the highest degree of fusion to achieve the guidance of global semantic information by weighting the channel information of the feature map.
Regarding the overall fusion structure, there is some similarity between MSRA-FPN and the previously proposed PANet, as well as BiFPN, which both use a bottom-up structure to enhance the FPN. However, the differences in the structure of MSRA-FPN bring unique advantages. First, we front-loaded the bottom-up aggregation structure UCLRAM so that it can directly access the raw features from the backbone network, which can further enhance UCLRAM. Second, the triangular structure of UCLRAM has a more robust aggregation capability than the single-layer structure of PANet and BiFPN, enabling the high-level feature to have richer semantic information to enhance the detector’s ability to detect large objects.
Experimentally, it is demonstrated that on the PASCAL VOC [15] dataset, our proposed method improves 0.5–1.9% compared to the baseline model and has an advantage over other methods. Furthermore, on the MS COCO [16] dataset, our proposed method can also improve the AP of the baseline model by 0.8% and the A P l by 1.8%. On the Thangka Figure Dataset (TKFD), our proposed model improves the performance of the three baseline models by 2.9–4.7%, validating the effectiveness of the MSRA-FPN for Thangka figure detection as well as large object detection.

2. Related Work

2.1. CNN-Based Object Detection

As one of the most fundamental and challenging tasks in computer vision, object detection tasks have received a lot of attention from researchers. Especially after the rise of convolutional neural networks, a large number of excellent object detectors have emerged. Object detection consists of two tasks—classification and regression—where the classification task predicts the class of an object, while the regression task is responsible for predicting the bounding box of that object. Depending on the architecture of the network, the existing detector can be classified into anchor-based and anchor-free detectors.
Anchor-based detectors can be further divided into two-stage detectors and single-stage detectors. Among the representative models of two-stage detectors are Faster R-CNN [17], RFCN [18], and Sparse R-CNN [19], etc. and the representative models of single-stage detectors are RetinaNet [20], SSD [21], and YOLO [22]. The two-stage detectors must first use a Region Proposal Network (RPN) to generate proposals, distinguish between foreground and background, and complete the final detection on top of the proposals. The single-stage detectors locate and recognize objects directly on the feature map, which is more practical because of its uniform model structure and efficient inference speed. The two-stage design ensures the model’s accuracy, but its inference speed is much less than that of the single-stage detectors. All these anchor-base detectors first generate anchors of different sizes on each pixel point of the feature map and then predict the classes corresponding to each anchor and the relative coordinates based on the anchor.
As the anchor itself is a priori data, it has to be redesigned manually for different datasets. In addition, the anchor-based detectors generate many anchors each time, which increases the computational cost of the model and causes a severe imbalance between positive and negative samples, so some researchers have tried to discard anchors and designed anchor-free detectors. Anchor-free detectors can be broadly classified into two types. One approach is based on keypoints, such as Reppoints [23] and CornerNet [24], and CenterNet [25]. Another type of method is dense prediction, such as YOLO, DenseBox [26], FCOS [27], and FoveaBox [28].
In addition, some researchers have introduced Transformers [29] into the object detection task with good results, such as DETR [30], ViT [31], and Swin Transformer [32].

2.2. Multi-Scale Feature Fusion in Object Detection

Early object detectors based on the neural network did not perform multi-scale feature fusion. The Feature Pyramid Network [5] (FPN) constructs a top-down path that allows the high-level feature to be fused downward, enabling the exchange of information between feature maps of adjacent levels to mitigate semantic imbalance between different layers. The deeper features of the backbone contain richer semantic information, while the shallow features contain more spatial information. FPN ignores the importance of the low-level features, while PANet [9] designs an additional bottom-up structure on top of FPN to further exploit the low-level spatial information. BiFPN [10] uses a weighted bi-directional fusion structure to fuse low-level features and high-level abstract semantic features, which effectively improves detection performance.
Meanwhile, since the upsampling process of FPN uses relatively primitive interpolation methods, which causes misalignment and loss of semantic information to a certain extent, some researchers have tried to improve the upsampling method. For example, FaPN [7] introduced deformable convolution [33] during feature fusion to mitigate the offset generated during upsampling. CE-FPN [12] performs feature enhancement through the channel guidance module and introduces sub-pixel convolution to mitigate the information decay during channel compression.
In addition, some studies argue that there are specific semantic differences between feature maps at different scales, and directly fusing them will reduce the representational power of the features. AugFPN [6] proposed a series of methods to reduce this semantic discrepancy. PSPNet [34] proposes pyramid pooling to extract global contextual information for feature enhancement. Other researchers have also focused on the semantic balance of the model, such as Libra R-CNN [35].
Integrating the research on CNN object detection and multi-scale feature fusion with the practical problem of object detection in Thangka images, we design and propose a method MSRA-FPN using a bottom-up structure for FPN enhancement.

3. Method

3.1. OverAll

Adding a Feature Pyramid Network [5] to the object detector is intended to transfer information between multi-level feature maps better. FPN conveys more abstract semantic information from the top to the bottom layer, alleviating the semantic imbalance between different feature maps.
This type of information transfer relies heavily on a top-down fusion structure. This structure requires multiple levels of input P in = ( P 1 i n , P 4 i n ) , where P i i n denotes features with a resolution of the 1 / 2 i level of the input image, and the scale of the feature map increases to twice the original size with each upsampling, as shown in Equation (1).
P 4 o u t = C o n v ( P 4 i n ) P 3 o u t = C o n v ( P 3 i n + Re s i z e ( P 4 o u t ) ) P 2 o u t = C o n v ( P 2 i n + Re s i z e ( P 3 o u t ) ) P 1 o u t = C o n v ( P 1 i n + Re s i z e ( P 2 o u t ) )
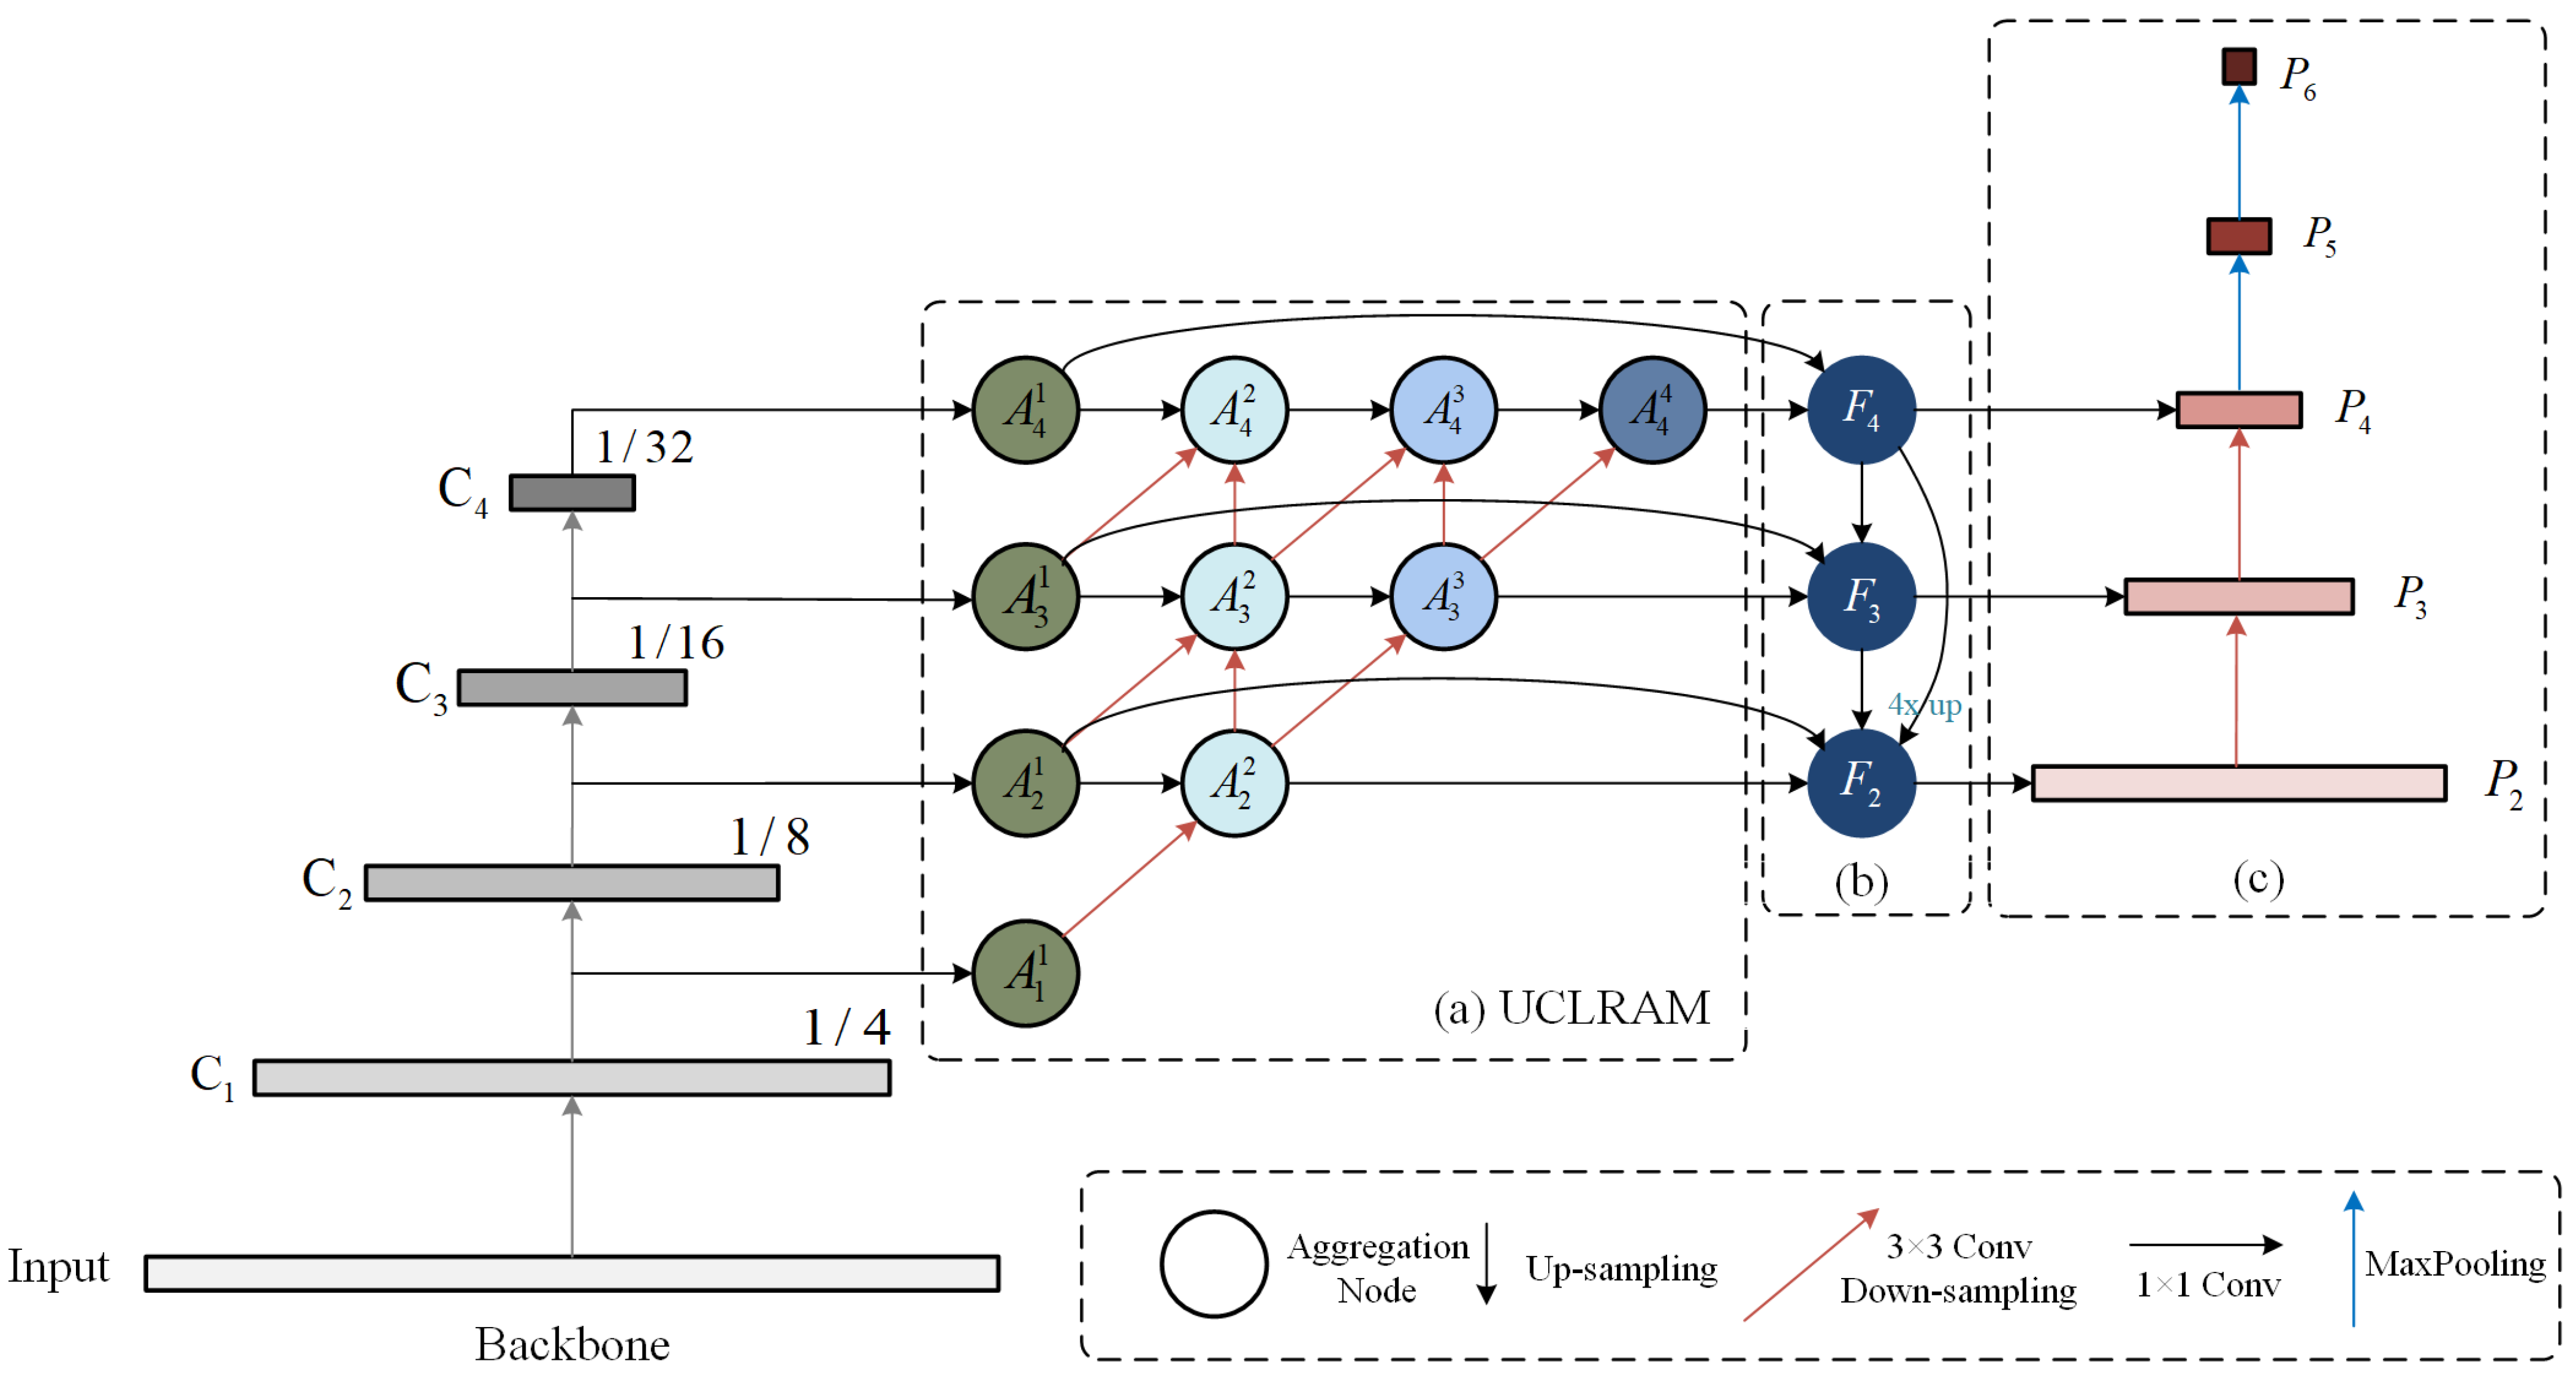
To counteract the semantic loss in upsampling and reduce the confounding phenomenon during feature map fusion, we designed MSRA-FPN based on the structure of FPN. MSRA-FPN consists of a bottom-up unidirectional cross-layer residual aggregation module (a), a top-down fusion module with residual connection (b), and a bottom-up fusion module (c), as shown in Figure 4. The process of feature fusion is as follows.
(1) The MSRA-FPN inputs a four-layer feature map from the backbone, labeling it as { C 1 , C 2 , C 3 , C 4 } . Its channel number is { 256 , 512 , 1024 , 2048 } . To allow feature maps of the same scale to be summed, it is necessary to ensure that their channel numbers are of the same size, so it is necessary to input { C 1 , C 2 , C 3 , C 4 } to a set of 1×1 convolutions first so that the channel numbers are normalized to 256. The normalized { C 1 , C 2 , C 3 , C 4 } is input to the UCLRAM for feature fusion enhancement and output as three new feature maps { A 2 , A 3 , A 4 } , whose number of channels remains 256. We also designed the Residual Squeeze and Excitation Module to mitigate the aliasing effects caused by the fusion of multiple feature maps at different scales.
(2) Input { A 2 , A 3 , A 4 } into the structure of (b) for top-down feature fusion to obtain the feature map { F 2 , F 3 , F 4 } . The up-sampling in the fusion process uses the nearest neighbor interpolation method with a sampling rate of two. After the summation of the upsampled feature map and the feature map obtained from the lateral connection, one branch continues to aggregate downward, and the other branch needs to be summed with the feature map of the first stage of UCLRAM.
(3) Three feature maps { F 2 , F 3 , F 4 } for prediction are obtained after inputting { P 2 , P 3 , P 4 } into the structure of (c) with 256 channels. For better prediction at multiple scales, P 5 and P 6 are obtained after downsampling using Maxpooling in turn, starting from P 4 , and finally { P 2 , P 3 , P 4 , P 5 , P 6 } is input into the detection head module for category and bounding box prediction.

3.2. Unidirectional Cross-Level Residual Aggregation Module

To fully fuse the feature information from multiple layers into the top-level feature map, we designed the unidirectional cross-layer residual aggregation module UCLRAM, as shown in Figure 4a. This module consists of four stages, and each stage aggregates the feature maps of the previous stage to form a new feature map, which we call an aggregation node. The number of aggregation nodes in each stage is reduced by one from front to back, forming a unidirectional triangular aggregation structure. These aggregation nodes are divided into two-input (e.g., A 2 2 ) and three-input (e.g., A 3 2 ) aggregation nodes according to the number of input feature maps.
Figure 5a shows an example of the detailed structure of the two-input aggregation node A 2 2 . We abstract the computation of the two-input aggregation node, as shown in Equation (2).
A j i = C o n v 1 × 1 ( A j i 1 ) + C o n v 3 × 3 ( A j 1 i 1 )
where i denotes the i-th fusion stage, j denotes the j-th aggregation node of the current stage. The feature map A j i 1 from the same layer of the previous stage is through a 1 × 1 convolutional layer to obtain a new feature map A j i 1 ^ with size [ 256 , W , H ] (W denotes the width of the feature map, and H denotes the height of the feature map). The feature map A j 1 i 1 from the lower layer of the previous stage is of size [ 256 , 2 W , 2 H ] . To make them the same size, the fused feature map is then obtained by using cross-layer residual connection (3 × 3 convolutional layer) to downsample A j 1 i 1 into a feature map A j 1 i 1 ^ of size W × H . Afterward, A j i 1 ^ and A j 1 i 1 ^ are added together to obtain the fused feature map.
Figure 5b shows an example of the detailed structure of the computational three-input node A 3 2 . We define the three-input aggregation node as Equation (3).
N = C o n v 1 × 1 ( A j i 1 ) + C o n v 3 × 3 ( A j 1 i ) A j i = F ( N + C o n v 3 × 3 ( A j 1 i 1 ) + A j i 1 )
A j + 1 i = C o n v 3 × 3 ( N )
When computing the feature map A j i of the three-input convergence node, it is necessary to first pass the j-th feature map B from stage A j i 1 through a 1 × 1 convolution layer to obtain a new feature map A j i 1 ^ (whose size is [ 256 , W , H ] ).
The feature map A j 1 i , one layer lower than the current aggregation node, is of size [ 256 , 2 W , 2 H ] . In order to fuse A j i 1 ^ and A j 1 i , we need to use cross-layer residual connectivity (3 × 3 convolution layer) to normalize the feature map A j 1 i ^ to the size of [256, W, H] and then add A j i 1 ^ and A j 1 i ^ to obtain the feature map N. Afterward, A j 1 i 1 is downsampled to obtain the feature map A j 1 i 1 ^ , and N and A j 1 i 1 ^ are summed and then guided by the RSEM module to obtain the aggregation node A j i .
It should be noted that in the calculation of A 3 2 , the feature map N will enter a double branch to continue the aggregation, one of which is consistent with the above and obtains A 3 2 after aggregation, while the other will continue to downsample and complete the aggregation after fusion with the topmost feature map, as shown in the dashed part in Figure 5b, which we define as Equation (4).

3.3. Residual Squeeze and Excitation Module

Different layers in the Feature Pyramid Network have different scales and channels, representing different semantic information. The feature at the deeper layer of the backbone is more abstract and richer in semantic information due to multiple convolution operations. In contrast, the feature map at the bottom layer is less abstract and contains more spatial information. The low-level feature has more spatial information, which helps object localization tasks and small object detection, as well as provides better access to local features of the image. The high-level feature maps are relatively small in scale. After multiple convolutional kernel downsampling of the backbone, most of its spatial information is transformed into abstract semantic information, which is more conducive to object classification and large object detection. At the same time, after the feature map reduces, the receptive field increases due to the rise in the relative area covered by one sliding of the convolutional kernel to focus more on the global information of the image.
Based on the above conclusions, due to the aggregation of a large number of feature maps at different levels in MSRA-FPN, aliasing effects are caused to some extent. To alleviate this problem, we introduced SENet [36] and used a skip connection to add the input feature maps to a weighted feature map. The aliasing effects are mitigated by a guide of global-information-like channels, the structure of which is shown in Figure 6. To balance the performance and parameters of the model, we did not use the module on all aggregation nodes but used RSEM on the three input aggregation nodes of UCLRAM.
In RSEM, the feature map obtained in the previous stage is first changed into a 1 × 1 × C (C is the number of channels) feature map z by an Avgpooling, and this step extracts the global information of the input feature map. Then the weighted vector u of z is obtained using the weighting function f ( ) . Then u is multiplied by the input feature map to obtain the guided feature map C. Finally, add C and the input feature map using the residual connection. The operation is essentially a channel attention mechanism. The process is abstracted, as shown in Equations (5) and (6).
z = A v g p o o l i n g ( m ) u = f ( z ) C = u m C ^ = C + m
f ( z ) = Sigmoid ( C o n v 1 × 1 ( R u l e ( C o n v 1 × 1 ( z ) ) )

4. Experiments

We validated the MSRA-FPN on the publicly available dataset PASCAL VOC [15]. We performed comparison experiments with other state-of-the-art FPN [5] methods and ablation experiments on this dataset for different components of our proposed method. We also conducted comparative experiments on MS COCO. In addition, comparative experiments were carried out on the Thangka figure dataset to verify the effectiveness of MSRA-FPN for detecting large objects in images.

4.1. Implementation Details

We set the training batch size to 8, used a 3080ti for training, set the initial learning rate to 0.001, the momentum to 0.9, the weight decay to 0.0001, and used the first 500 iterations as a warm-up with a warm-up rate of 0.001. A simple random flip was used for data enhancement, with a flip rate of 0.5. It should be noted that we used the backbone parameters pre-trained on ImageNet for the initialization of the model and froze the backbone parameters in the first phase. Secondly, PASCAL VOC2007 and TKFD used the same training strategy for a total of 100 epochs, with a learning rate decay at epochs 60 and 90, with a decay rate of 0.1. Note that we trained a total of 36 epochs on MS COCO, decayed the learning rate by a factor of 0.1 at 30 epochs, and set the initial learning rate to 0.006 and scaled the input size to 320.
We used the Pytorch framework and the open source object detection framework MMDetection2 [37] as experimental platforms and used three classical object detectors with FPN, RetinaNet [20], FoveaBox [28], and Reppoints [23], as baseline models. All hyperparameters of the models in the experiments were kept consistent except for the Feature Pyramid Network part and used the same training strategy and experimental setting.

4.2. Dataset

4.2.1. PASCAL VOC

The PASCAL VOC dataset provides a standardized dataset including 20 object classes for object detection tasks. The comparative experiments section used two datasets to train the model, one using the PASCAL VOC2007 trainval set (5011 images and 12,608 objects in total). The other set was trained using the PASCAL VOC2007 and PASCAL VOC2012 trainval set (a total of 16,551 images and 40,058 objects) together. Both sets of experiments were tested on the test set of VOC2007.

4.2.2. MS COCO

MS COCO has 80 object classes containing 115k images for training (train2017) and 5k images for validation (val2017) and 20k (test-dev) images for testing. We trained the model on train2017 and report the results on val2017 for AP, AP50, AP75 and on small, medium, and large objects ( A P s , A P m , A P l ).

4.2.3. Thangka Figure Dataset

The Thangka is a unique Chinese painting art and an intangible piece of world cultural heritage. Figure 7 shows various types of Thangka images. Our research group has been researching issues related to the digital preservation of Thangka for a long time, among which the object detection of Thangka images is a crucial research problem.
Most Thangkas are depictions of figures in Buddhism, which tend to take up a considerable proportion of the entire canvas, with a high degree of similarity between some of the figures, as in Figure 7a,b, and a large number of figures in some of the Thangka images, as in Figure 7c. In addition, the Thangka images themselves are characterized by bright colors, rich content and complex backgrounds, making them difficult to detect.
We have studied the detection of figures in Thangkas, produced a Thangka figure dataset (TKFD) with 26 types of typical figures as detection objects, and validated our proposed method, MSRA-FPN, on this data.
TKFD uses a total of 1693 Thangka images with 4327 objects, of which there are 1340 in the training set, 156 in the validation set, and 197 in the test set, involving a total of 26 detection categories, whose classes distribution is shown in Figure 8. We classify objects in the dataset with an area less than 32 × 32 as small objects, those with an area greater than 32 × 32 and less than 96 × 96 as medium objects, those with an area greater than 96 × 96 and less than 512 × 512 as large objects, and those with area more than 512 × 512 as huge objects. As can be seen in Figure 9, more than half of the objects in the Thangka figure dataset belong to large objects.

4.3. Main Results

4.3.1. Qualitative Evaluation

We compared the detection results of MSRA-FPN and other state-of-the-art FPN-based methods on PASCAL VOC2007 and TKFD, respectively. ResNet50 [38] is uniformly used here as the backbone as well as the same model hyperparameters and experimental settings to ensure fairness.
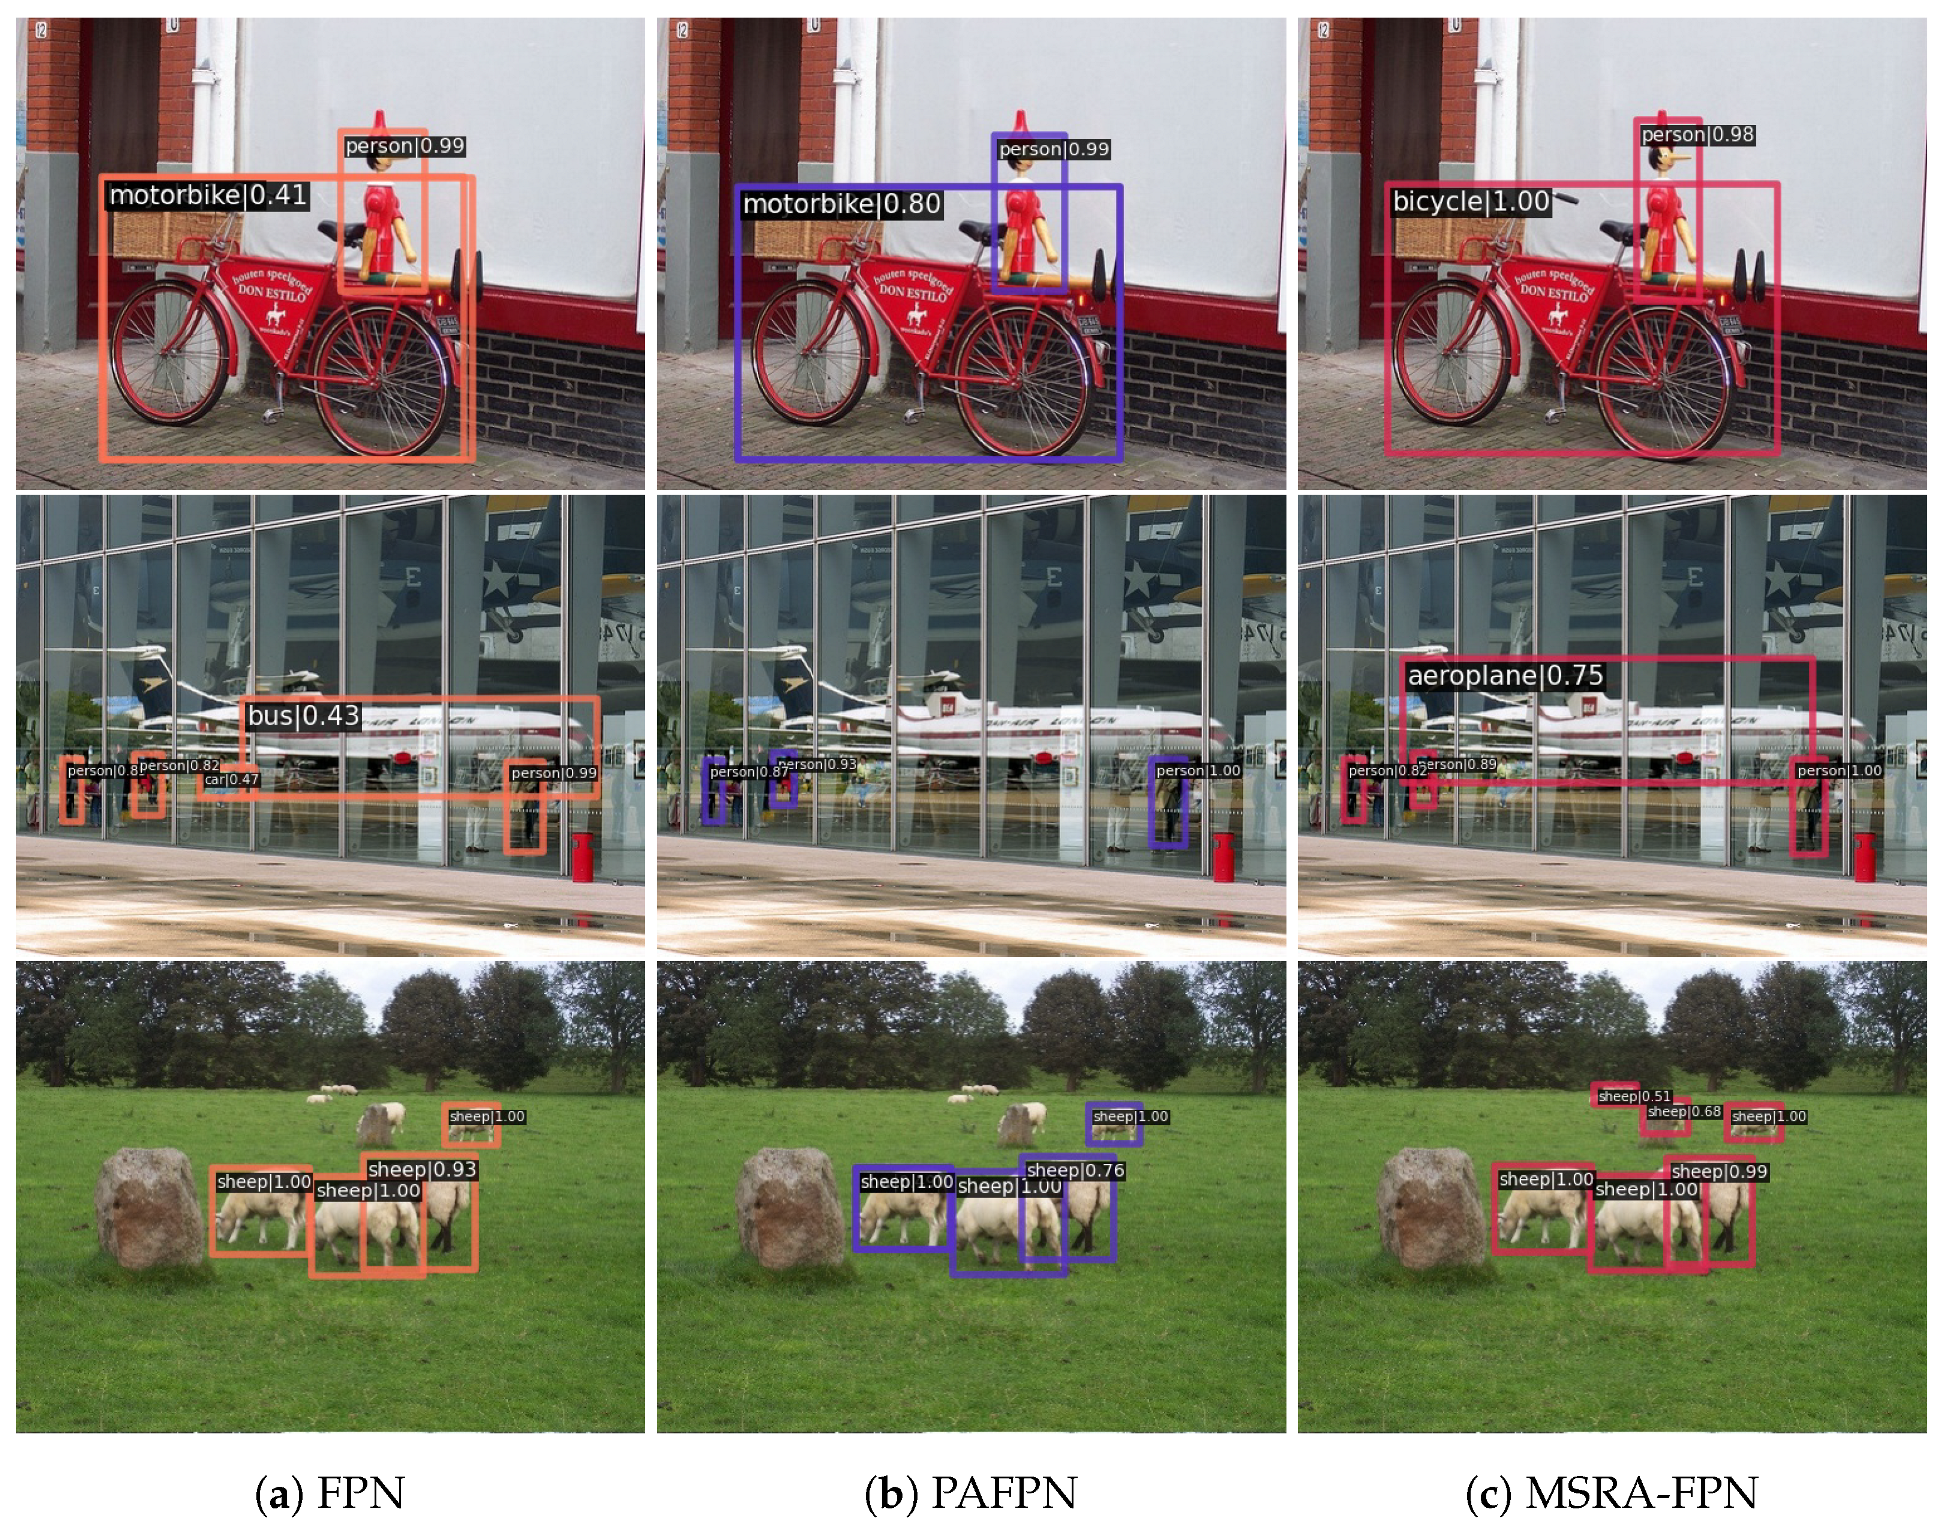
PASCAL VOC: In Figure 10, MSRA-FPN correctly predicts ‘bicycle’ in the figure, while both FPN and PANet [9] detect it as ‘motorbike’; from the second row, it can be seen that MSRA-FPN detected the large object ‘airplane’, while FPN identified it as ‘bus’ and PANet did not identify any object; from the third row, it can be seen that MSRA-FPN detected the small object further away ‘sheep’, which was not detected by FPN or PANet. This demonstrates that our proposed MSRA-FPN has better detection results on large objects and can effectively fuse information on more scales, improving the detection capability and accuracy of the model.
TKFD:The first row of Figure 11 shows a Thangka with a predominantly green color. Due to the background and object’s extremely similar color, FPN and PANet did not detect the ‘green-tara’ in the upper left corner, which MSRA-FPN correctly detected. The second row shows that FPN did not detect ‘manjusri’ and ‘vajradhara’ at the bottom of the Thangka image and missed the ‘bhaishajyaguru’ at the top right of the image, and PANet missed the ‘vajradhara’ at the top left of the image. MSRA-FPN detects the objects not detected by FPN and PANet. It can be seen from the third row that FPN did not detect ‘bhaishajyaguru’ and ‘aksobhya’ at the top left of the image, while PANet missed the ‘green-tara’, and MSRA-FPN detected these three missed figures.

4.3.2. Quantitative Evaluation

PASCAL VOC: We compared the detection performance of the proposed MSRA-FPN with the baseline model and the existing state-of-the-art FPN-based methods. The FPN part of RetinaNet [20] was replaced with other state-of-the-art FPN-based methods, and comparison experiments were conducted with the same backbone, hyperparameters, and other experimental settings. Table 1 reports the results with the PASCAL VOC2007 trainval set alone, and Table 2 reports the results with both the trainval set of PASCAL VOC2007 and PASCAL VOC2012 together. Our proposed method improves the performance of RetinaNet by 1.6% when trained with PASCAL VOC2007 alone compared to the baseline model and by nearly 1% on VOC2007+VOC2012, and it is competitive with other state-of-the-art FPN-based methods.
To better validate the generality of MSRA-FPN, we also conducted comparative experiments using two anchor-free object detectors as baseline models, as shown in Table 1 and Table 2 for the Reppoints and FoveaBox experimental results. As can be seen, MSRA-FPN can improve the performance of both baseline models by 0.5% to 1.9%. Thus, our proposed MSRA-FPN can effectively improve the accuracy of anchor-based and anchor-free detectors.
A strong backbone can better extract the features of the images, and Table 3 reports the performance of MSRA-FPN with different backbones. From Table 3, it can be seen that the overall performance of the model is enhanced as the backbone parameters increase.
In addition, we also verified the performance of MSRA-FPN at different input scales. As seen in Table 4, the model’s performance improves as the image input size increases.
The above four experimental results show that our proposed MSRA-FPN can effectively fuse feature information at different scales and improve the object detection capability of the detector.
MS COCO: We also evaluated MSRA-FPN on MS COCO, as shown in Table 5. MSRA-FPN can improve the performance of the baseline model RetinaNet by 0.8% and can effectively improve the detection performance of large objects. As can be seen from the table, MSRA-FPN improves the baseline model APl value from 39.8% to 41.6%, an improvement of 1.8%. The same can be done to improve the performance of FCOS [27] by 0.6%.
TKFD: In order to verify the effectiveness of MSRA-FPN in detecting figures in Thangka images, we have also conducted comparison experiments with other state-of-the-art FPN-based methods on TKFD. As shown in Table 6, MSRA-FPN can significantly improve the mAP accuracy of several baseline models in TKFD. When using ResNet50 as the backbone, MSRA-FPN improved RetinaNet, Reppoints, and FoveaBox from 64.7%, 65.8%, and 65.3% to 69.4%, 68.7%, and 69.2%, respectively, on the TKFD test set by 4.7%, 2.9%, and 3.9%. After changing the backbone to ResNeXt50 [39] DCN and expanding the input size to 1024×640, the model achieved an mAP value of 71.2%. Furthermore, when compared with two-stage detectors, such as Faster R-CNN, and single-stage detectors, such as YOLOv3 [22], it is found that our proposed algorithm still has a significant advantage.

4.4. Ablation Study

To analyze the performance of each component in our proposed MSRA-FPN, we conducted ablation experiments on PASCAL VOC2007. This experiment was performed on RetinaNet with ResNet-50 as the backbone and an input image size of 640 × 640.

4.4.1. Ablation Studies for UCLRAM

Table 6 reports the number of parameters, FLOPs, and FPS for multiple models on TKFD. It can be seen that the number of RetinaNet parameters using MSRA-FPN increases from the original 36.62M to 45.77M relative to the baseline model when ResNet50 is used as the backbone and the input size is 640 × 640. In order to balance the conflict between accuracy and the number of parameters, the structure of the UCLRAM was ablated on PASCAL VOC2007 and compared with the structure shown in Figure 4, the results of which are shown in Table 7.
In this case, UCLRAM-lite1 removes the three bottom-up convolutional layers of stage2 and stage3 from the UCLRAM on the structure shown in Figure 4, turning the three-input nodes into two-input nodes. The UCLRAM-lite2 version replaces the convolution of all cross-layer residuals with MaxPooling. As seen in Table 7, the accuracy of the UCLRAM-lite2 version is 0.5% different from the original version. However, its number of parameters is essentially the same as that of the FPN. The FPS is also higher than the structure shown in Figure 4, which better balances the contradiction between accuracy and the number of parameters.
In addition, we explored RSEM’s impact on the UCLRAM structure. The UCLRAM-RSEM2 version uses RSEM as a guide behind all aggregation nodes, and as can be seen from the data in Table 7, it is less accurate than the structure shown in Figure 4, and the number of parameters has increased.

4.4.2. Ablation Studies for Each Component

We analyzed two components in MSRA-FPN and performed an ablation study on the PASCAL VOC2007 dataset. The experimental results are shown in Table 8. As can be seen from the results in Table 8, our proposed UCLRAM structure improves by 1.2% compared with FPN, and the addition of CGB structure improves MSRA-FPN by 0.4%. From this, it can be concluded that each module of our proposed method has a meaningful impact on object detection performance.
5. Conclusions

We propose an enhanced Feature Pyramid Network MSRA-FPN that aggregates multi-scale information more effectively to combat attenuation during information propagation and enhances the detection and recognition of large objects. In particular, MSRA-FPN uses UCLRAM to converge feature information from different scales to the top layer through a triangular structure from the bottom to enhance the semantic information of the high-level features and then uses RSEM to mitigate the semantic overlap that occurs during the fusion of multi-scale feature maps. The experimental results show that on the PASCAL VOC dataset, our proposed method improves the performance of the baseline model by 0.5–1.9% and is highly competitive with other state-of-the-art FPN-based methods. We also validate the effectiveness of MSRA-FPN on MS COCO. In addition, experiments have been conducted on TKFD to verify the effectiveness of the proposed method for detecting figure objects in Thangkas. However, there are still some problems with the MSRA-FPN. For example, its performance on a two-stage detector is much inferior to that on a single-stage detector. In future work, we will attempt to continue to improve MSRA-FPN for a variety of different types of tasks and detectors and to validate its performance on a larger object detection dataset.

Author Contributions

Conceptualization, H.W.; data curation, H.W.; methodology, H.W.; writing—original draft, H.W.; writing—review and editing, T.W.; funding acquisition, T.W.; supervision, T.W. All authors have read and agreed to the published version of the manuscript.

Funding

This work was supported by the National Natural Science Foundation of China (62166035); Natural Science Foundation of Gansu Province (21R7RA163); Innovation Project for Young Teachers supported by fundamental Research Funds for the Central Universities (31920210090).

Institutional Review Board Statement

Not applicable.

Informed Consent Statement

Not applicable.

Data Availability Statement

The datasets used in this study are available from the email: [email protected] upon request.

Conflicts of Interest

The authors declare no conflict of interest.

References

  1. Chen, X.; Kundu, K.; Zhang, Z.; Ma, H.; Fidler, S.; Urtasun, R. Monocular 3d object detection for autonomous driving. In Proceedings of the IEEE Conference on Computer Vision and Pattern Recognition, Las Vegas, NV, USA, 27–30 June 2016; pp. 2147–2156. [Google Scholar] [CrossRef]
  2. Deng, J.; Guo, J.; Ververas, E.; Kotsia, I.; Zafeiriou, S. Retinaface: Single-shot multi-level face localisation in the wild. In Proceedings of the IEEE/CVF Conference on Computer Vision and Pattern Recognition, Seattle, WA, USA, 13–19 June 2020; pp. 5203–5212. [Google Scholar] [CrossRef]
  3. Zhang, Z.; Zhang, L.; Wang, Y.; Feng, P.; He, R. ShipRSImageNet: A large-scale fine-grained dataset for ship detection in high-resolution optical remote sensing images. IEEE J. Sel. Top. Appl. Earth Obs. Remote. Sens. 2021, 14, 8458–8472. [Google Scholar] [CrossRef]
  4. Wang, X.; Peng, Y.; Lu, L.; Lu, Z.; Bagheri, M.; Summers, R. Hospital-scale chest x-ray database and benchmarks on weakly-supervised classification and localization of common thorax diseases. In Proceedings of the IEEE CVPR, Honolulu, HI, USA, 21–26 July 2017; Volume 7. [Google Scholar] [CrossRef] [Green Version]
  5. Lin, T.Y.; Dollár, P.; Girshick, R.; He, K.; Hariharan, B.; Belongie, S. Feature pyramid networks for object detection. In Proceedings of the IEEE Conference on Computer Vision and Pattern Recognition, Honolulu, HI, USA, 21–26 July 2017; pp. 2117–2125. [Google Scholar] [CrossRef] [Green Version]
  6. Guo, C.; Fan, B.; Zhang, Q.; Xiang, S.; Pan, C. Augfpn: Improving multi-scale feature learning for object detection. In Proceedings of the IEEE/CVF Conference on Computer Vision and Pattern Recognition, Seattle, WA, USA, 13–19 June 2020; pp. 12595–12604. [Google Scholar] [CrossRef]
  7. Huang, S.; Lu, Z.; Cheng, R.; He, C. FaPN: Feature-aligned pyramid network for dense image prediction. In Proceedings of the IEEE/CVF International Conference on Computer Vision, Virtual Event, 11–17 October 2021; pp. 864–873. [Google Scholar] [CrossRef]
  8. Wang, J.; Chen, K.; Xu, R.; Liu, Z.; Loy, C.C.; Lin, D. Carafe: Content-aware reassembly of features. In Proceedings of the IEEE/CVF International Conference on Computer Vision, Seoul, Korea, 27 October–2 November 2019; pp. 3007–3016. [Google Scholar] [CrossRef] [Green Version]
  9. Liu, S.; Qi, L.; Qin, H.; Shi, J.; Jia, J. Path aggregation network for instance segmentation. In Proceedings of the IEEE Conference on Computer Vision and Pattern Recognition, Salt Lake City, UT, USA, 18–23 June 2018; pp. 8759–8768. [Google Scholar] [CrossRef] [Green Version]
  10. Tan, M.; Pang, R.; Le, Q.V. Efficientdet: Scalable and efficient object detection. In Proceedings of the IEEE/CVF Conference on Computer Vision and Pattern Recognition, Seattle, WA, USA, 13–19 June 2020; pp. 10781–10790. [Google Scholar] [CrossRef]
  11. Wu, Y.; Jiang, J.; Huang, Z.; Tian, Y. FPANet: Feature pyramid aggregation network for real-time semantic segmentation. Appl. Intell. 2022, 52, 3319–3336. [Google Scholar] [CrossRef]
  12. Luo, Y.; Cao, X.; Zhang, J.; Guo, J.; Shen, H.; Wang, T.; Feng, Q. CE-FPN: Enhancing channel information for object detection. Multimed. Tools Appl. 2022, 81, 30685–30704. [Google Scholar] [CrossRef]
  13. Park, H.; Paik, J. Pyramid Attention Upsampling Module for Object Detection. IEEE Access 2022, 10, 38742–38749. [Google Scholar] [CrossRef]
  14. Yu, F.; Wang, D.; Shelhamer, E.; Darrell, T. Deep layer aggregation. In Proceedings of the IEEE Conference on Computer Vision and Pattern Recognition, Salt Lake City, UT, USA, 18–23 June 2018; pp. 2403–2412. [Google Scholar] [CrossRef]
  15. Everingham, M.; Van Gool, L.; Williams, C.K.; Winn, J.; Zisserman, A. The pascal visual object classes (voc) challenge. Int. J. Comput. Vis. 2010, 88, 303–338. [Google Scholar] [CrossRef] [Green Version]
  16. Lin, T.Y.; Maire, M.; Belongie, S.; Hays, J.; Perona, P.; Ramanan, D.; Dollár, P.; Zitnick, C.L. Microsoft coco: Common objects in context. In Proceedings of the European Conference on Computer Vision; Springer: Berlin/Heidelberg, Germany, 2014; pp. 740–755. [Google Scholar] [CrossRef] [Green Version]
  17. Ren, S.; He, K.; Girshick, R.; Sun, J. Faster R-CNN: Towards Real-Time Object Detection with Region Proposal Networks. IEEE Trans. Pattern Anal. Mach. Intell. 2017, 39, 1137–1149. [Google Scholar] [CrossRef] [Green Version]
  18. Dai, J.; Li, Y.; He, K.; Sun, J. R-FCN: Object Detection via Region-Based Fully Convolutional Networks. In Proceedings of the 30th International Conference on Neural Information Processing Systems; Curran Associates Inc.: Red Hook, NY, USA, 2016; NIPS’16; pp. 379–387. [Google Scholar] [CrossRef]
  19. Sun, P.; Zhang, R.; Jiang, Y.; Kong, T.; Xu, C.; Zhan, W.; Tomizuka, M.; Li, L.; Yuan, Z.; Wang, C.; et al. Sparse r-cnn: End-to-end object detection with learnable proposals. In Proceedings of the IEEE/CVF Conference on Computer Vision and Pattern Recognition, Nashville, TN, USA, 20–25 June 2021; pp. 14454–14463. [Google Scholar] [CrossRef]
  20. Lin, T.Y.; Goyal, P.; Girshick, R.; He, K.; Dollár, P. Focal loss for dense object detection. In Proceedings of the IEEE International Conference on Computer Vision, Venice, Italy, 22–29 October 2017; pp. 2980–2988. [Google Scholar]
  21. Liu, W.; Anguelov, D.; Erhan, D.; Szegedy, C.; Reed, S.; Fu, C.Y.; Berg, A.C. Ssd: Single shot multibox detector. In Proceedings of the European Conference on Computer Vision; Springer: Berlin/Heidelberg, Germany, 2016; pp. 21–37. [Google Scholar]
  22. Redmon, J.; Divvala, S.; Girshick, R.; Farhadi, A. You only look once: Unified, real-time object detection. In Proceedings of the IEEE Conference on Computer Vision and Pattern Recognition, Las Vegas, NV, USA, 27–30 June 2016; pp. 779–788. [Google Scholar] [CrossRef]
  23. Yang, Z.; Liu, S.; Hu, H.; Wang, L.; Lin, S. Reppoints: Point set representation for object detection. In Proceedings of the IEEE/CVF International Conference on Computer Vision, Seoul, Korea, 27 October–2 November 2019; pp. 9657–9666. [Google Scholar] [CrossRef] [Green Version]
  24. Law, H.; Deng, J. Cornernet: Detecting objects as paired keypoints. In Proceedings of the European Conference on Computer Vision (ECCV), Munich, Germany, 8–14 September 2018; pp. 734–750. [Google Scholar] [CrossRef] [Green Version]
  25. Zhou, X.; Koltun, V.; Krähenbühl, P. Tracking objects as points. In Proceedings of the European Conference on Computer Vision; Springer: Berlin/Heidelberg, Germany, 2020; pp. 474–490. [Google Scholar] [CrossRef]
  26. Huang, L.; Yang, Y.; Deng, Y.; Yu, Y. Densebox: Unifying landmark localization with end to end object detection. arXiv 2015, arXiv:1509.04874. [Google Scholar]
  27. Tian, Z.; Shen, C.; Chen, H.; He, T. Fcos: Fully convolutional one-stage object detection. In Proceedings of the IEEE/CVF International Conference on Computer Vision, Seoul, Korea, 27 October–2 November 2019; pp. 9627–9636. [Google Scholar] [CrossRef] [Green Version]
  28. Kong, T.; Sun, F.; Liu, H.; Jiang, Y.; Li, L.; Shi, J. Foveabox: Beyound anchor-based object detection. IEEE Trans. Image Process. 2020, 29, 7389–7398. [Google Scholar] [CrossRef]
  29. Vaswani, A.; Shazeer, N.; Parmar, N.; Uszkoreit, J.; Jones, L.; Gomez, A.N.; Kaiser, Ł.; Polosukhin, I. Attention is all you need. In Proceedings of the 31st Conference on Neural Information Processing Systems (NIPS 2017), Long Beach, CA, USA, 4–9 December 2017. [Google Scholar]
  30. Carion, N.; Massa, F.; Synnaeve, G.; Usunier, N.; Kirillov, A.; Zagoruyko, S. End-to-end object detection with transformers. In Proceedings of the European Conference on Computer Vision; Springer: Berlin/Heidelberg, Germany, 2020; pp. 213–229. [Google Scholar]
  31. Dosovitskiy, A.; Beyer, L.; Kolesnikov, A.; Weissenborn, D.; Zhai, X.; Unterthiner, T.; Dehghani, M.; Minderer, M.; Heigold, G.; Gelly, S.; et al. An image is worth 16x16 words: Transformers for image recognition at scale. arXiv 2020, arXiv:2010.11929. [Google Scholar]
  32. Liu, Z.; Lin, Y.; Cao, Y.; Hu, H.; Wei, Y.; Zhang, Z.; Lin, S.; Guo, B. Swin transformer: Hierarchical vision transformer using shifted windows. In Proceedings of the IEEE/CVF International Conference on Computer Vision, Virtual Event, 11–17 October 2021; pp. 10012–10022. [Google Scholar] [CrossRef]
  33. Zhu, X.; Hu, H.; Lin, S.; Dai, J. Deformable convnets v2: More deformable, better results. In Proceedings of the IEEE/CVF Conference on Computer Vision and Pattern Recognition, Long Beach, CA, USA, 15–20 June 2019; pp. 9308–9316. [Google Scholar] [CrossRef] [Green Version]
  34. Zhao, H.; Shi, J.; Qi, X.; Wang, X.; Jia, J. Pyramid scene parsing network. In Proceedings of the IEEE Conference on Computer Vision and Pattern Recognition, Honolulu, HI, USA, 21–26 July 2017; pp. 2881–2890. [Google Scholar] [CrossRef] [Green Version]
  35. Pang, J.; Chen, K.; Shi, J.; Feng, H.; Ouyang, W.; Lin, D. Libra r-cnn: Towards balanced learning for object detection. In Proceedings of the IEEE/CVF Conference on Computer Vision and Pattern Recognition, Long Beach, CA, USA, 15–20 June 2019; pp. 821–830. [Google Scholar] [CrossRef] [Green Version]
  36. Hu, J.; Shen, L.; Sun, G. Squeeze-and-excitation networks. In Proceedings of the IEEE Conference on Computer Vision and Pattern Recognition, Salt Lake City, UT, USA, 18–23 June 2018; pp. 7132–7141. [Google Scholar] [CrossRef]
  37. Chen, K.; Wang, J.; Pang, J.; Cao, Y.; Xiong, Y.; Li, X.; Sun, S.; Feng, W.; Liu, Z.; Xu, J.; et al. MMDetection: Open mmlab detection toolbox and benchmark. arXiv 2019, arXiv:1906.07155. [Google Scholar]
  38. He, K.; Zhang, X.; Ren, S.; Sun, J. Deep residual learning for image recognition. In Proceedings of the IEEE Conference on Computer Vision and Pattern Recognition, Las Vegas, NV, USA, 27–30 June 2016; pp. 770–778. [Google Scholar] [CrossRef] [Green Version]
  39. Xie, S.; Girshick, R.; Dollár, P.; Tu, Z.; He, K. Aggregated residual transformations for deep neural networks. In Proceedings of the IEEE Conference on Computer Vision and Pattern Recognition, Honolulu, HI, USA, 21–26 July 2017; pp. 1492–1500. [Google Scholar] [CrossRef] [Green Version]
  40. Cai, Z.; Vasconcelos, N. Cascade r-cnn: Delving into high quality object detection. In Proceedings of the IEEE Conference on Computer Vision and Pattern Recognition, Salt Lake City, UT, USA, 18–23 June 2018; pp. 6154–6162. [Google Scholar] [CrossRef]
Figure 1. Feature Pyramid Network.
Electronics 12 00093 g001
Figure 2. Comparison of FPN, PANet, and BiFPN fusion processes (a) FPN introduces a top-down structure to fuse multi-scale features; (b) PANet introduces a bottom-up structure on top of FPN. (c) BiFPN combines alternating top-down and bottom-up structures.
Electronics 12 00093 g002
Figure 3. Tree-structured aggregation.
Electronics 12 00093 g003
Figure 4. Overall structure of MSRA-FPN, where (a) is a three-input node as an example of computation, (b) is a two-input node as an example of computation, and (c) is a down-sampling fusion as an example of computation.
Electronics 12 00093 g004
Figure 5. Detailed structure of the aggregation node. (a) Two-input aggregation node A 2 2 ; (b) Three-input aggregation node A 3 2 .
Electronics 12 00093 g005
Figure 6. Residual squeeze and excitation module.
Electronics 12 00093 g006
Figure 7. Images of various types of Thangka. (a) Amitabha; (b) Sakyamuni; (c) Five Dhyani Buddha; (d) Green Tara.
Electronics 12 00093 g007
Figure 8. Distribution of the number of object categories in TKFD.
Electronics 12 00093 g008
Figure 9. Scale distribution of objects in TKFD.
Electronics 12 00093 g009
Figure 10. Detection results of FPN, PANet and MSRA-FPN on PASCAL 2007. (a) Detection results for FPN. (b) Detection results for PANet. (c) Detection results for MSRA-FPN.
Electronics 12 00093 g010
Figure 11. Detection results of FPN, PANet and MSRA-FPN on TKFD. (a) Detection results for FPN. (b) Detection results for PANet. (c) Detection results for MSRA-FPN.
Electronics 12 00093 g011
Table 1. Experimental results of comparison with different FPN-based methods and baseline models on PASCASL VOC2007.
MethodBackboneInput SizemAP
Faster R-CNN [17]+FPNResNet50640 × 64072.1
Faster R-CNN+PANet [9]ResNet50640 × 64072.4
Libra R-CNN [35]+BFPResNet50640 × 64072.4
RetinaNet+FPNResNet50640 × 64071.8
Reppoints [23]+FPNResNet50640 × 64073.1
FoveaBox [28]+FPNResNet50640 × 64068.9
RetinaNet+CARAFE [8]ResNet50640 × 64072.3
RetinaNet+AugFPN [6]ResNet50640 × 64071.5
RetinaNet+PANetResNet50640 × 64072.8
RetinaNet+CE-FPN [12]ResNet50640 × 64072.1
RetinaNet+MSRA-FPNResNet50640 × 64073.4
Reppoints+MSRA-FPNResNet50640 × 64074.2
FoveaBox+MSRA-FPNResNet50640 × 64070.8
Table 2. Experimental results of comparison with different FPN-based methods and baseline models on PASCASL VOC2007+VOC2012.
MethodBackboneInput SizemAP
Faster R-CNN+FPNResNet50640 × 64076.5
Libra R-CNN+BFPResNet50640 × 64076.3
RetinaNet+FPNResNet50640 × 64078.1
FoveaBox+FPNResNet50640 × 64074.6
Reppoints+FPNResNet50640 × 64078.2
RetinaNet+CARAFEResNet50640 × 64077.3
RetinaNet+PANetResNet50640 × 64078.4
RetinaNet+CE-FPNResNet50640 × 64078.1
RetinaNet+MSRA-FPNResNet50640 × 64078.9
FoveaBox+MSRA-FPNResNet50640 × 64075.8
Reppoints+MSRA-FPNResNet50640 × 64079
Table 3. Experimental results of different backbones.
MethodBackboneInput SizemAPFLOPsParams (M)
RetinaNet+FPNResNet50640 × 64071.8234.8731.85
RetinaNet+MSRA-FPNEfficientNetB3640 × 64073.255.9530.83
RetinaNet+MSRA-FPNResNet50640 × 64073.492.0845.65
RetinaNet+MSRA-FPNResNet101640 × 64073.8118.7859.17
RetinaNet+MSRA-FPNResNeXt50640 × 64073.693.3145.13
RetinaNet+MSRA-FPNResNeXt50-DCN640 × 64074.193.8346.29
Table 4. Experimental results for different input sizes.
MethodBackboneInput SizemAPFLOPs
RetinaNet+MSRA-FPNResNet50320 × 32065.423.03
RetinaNet+MSRA-FPNResNet50640 × 64073.492.08
RetinaNet+MSRA-FPNResNet501024 × 64073.9230.28
Table 5. Comparison of the proposed method and the baseline model on the MS COCO dataset.
MethodBackboneInput SizeAPAP50AP75APsAPmAPl
RetinaNet+FPNResNet50320 × 32021.435.922.12.122.239.8
FCOS+FPNResNet50320 × 32018.532.118.63.118.234.2
RetinaNet+OursResNet50320 × 32022.237.322.32.122.941.6
FCOS+OursResNet50320 × 32019.133.219.43.619.634.8
Table 6. Comparison of experimental results on the TKFD validation and test sets. The MSRA-FPN is compared with the baseline model and compared with several FPN-based methods. In addition to this paper, we also try to use some other object detection methods to compare with RetinaNet-MSRA-FPN and also compare their respective number of parameters, inference times, and FLOPs.
MethodBackboneInput SizeValidation Set mAPTest Set mAPFLOPsParams (M)FPS
Faster R-CNN+FPNResNet50640 × 64061.768.578.341.2525.7
Libra R-CNN+BFPResNet50640 × 64060.769.278.741.5122.9
Cascade R-CNN [40]+FPNResNet50640 × 64063.369.91196918.2
RetinaNet+FPNResNet50640 × 64054.164.786.136.6226.8
FoveaBox+FPNResNet50640 × 64059.365.381.436.0727.7
Reppoints+FPNResNet50640 × 64057.365.875.936.6124.7
RetinaNet+PANetResNet50640 × 64060.965.424935.5116.4
RetinaNet+CE-FPNResNet50640 × 64057.565.622857.2116.7
YOLOV3+YOLOv3NeckDarkNet53640 × 64059.266.477.861.6633.8
FCOS+FPNResNet50640 × 64059.364.679.131.927.9
SSD [21]+SSDNeckVGG16300 × 30052.458.735.627.0914.8
FoveaBox+MSRA-FPNResNet50640 × 64063.169.28539.4226.3
Reppoints+MSRA-FPNResNet50640 × 6406168.782.945.7522.9
RetinaNet+MSRA-FPNResNet50640 × 64062.169.493.145.7724.6
RetinaNet+MSRA-FPNResNet50-DCN640 × 64065.1698749.2622.7
RetinaNet+MSRA-FPNResNet501024 × 64063.868.914945.7724.5
RetinaNet+MSRA-FPNResNeXt50-DCN1024 × 64064.571.215246.4118.7
Table 7. Ablation studies of the structure of UCLRAM on PASCAL VOC2007.
VersionmAPFLOPsParams (M)FPS
UCLRAM-lite172.790.6638.3424.6
UCLRAM-lite272.985.7136.5924.9
UCLRAM-RSEM173.292.0851.1823.6
UCLRAM73.489.2545.3124.1
Table 8. Ablation studies of each component of MSRA-FPN on PASCAL VOC2007.
UCLRAMRSEMmAPGFLOPsParams (M)FPS
71.885.0536.526.1
73.092.0840.1124.4
73.489.2545.3124.1
Disclaimer/Publisher’s Note: The statements, opinions and data contained in all publications are solely those of the individual author(s) and contributor(s) and not of MDPI and/or the editor(s). MDPI and/or the editor(s) disclaim responsibility for any injury to people or property resulting from any ideas, methods, instructions or products referred to in the content.