Abstract
The most mysterious question humans have ever attempted to answer for centuries is, “What is beauty, and how does the brain decide what beauty is?”. The main problem is that beauty is subjective, and the concept changes across cultures and generations; thus, subjective observation is necessary to derive a general conclusion. In this research, we propose a novel approach utilizing deep learning and image processing to investigate how humans perceive beauty and make decisions in a quantifiable manner. We propose a novel approach using uncertainty-based ensemble voting to determine the specific features that the brain most likely depends on to make beauty-related decisions. Furthermore, we propose a novel approach to prove the relation between golden ratio and facial beauty. The results show that beauty is more correlated with the right side of the face and specifically with the right eye. Our study and findings push boundaries between different scientific fields in addition to enabling numerous industrial applications in variant fields such as medicine and plastic surgery, cosmetics, social applications, personalized treatment, and entertainment.
1. Introduction
Plato once wrote in the Symposium that “if there is anything worth living for, it is to behold beauty”. For centuries, beauty has captivated humans, and philosophers have attempted to explain this mysterious human phenomenon without any appropriate means of measuring and comprehending beauty. Facial attractiveness (or facial beauty) profoundly affects numerous facets of a person’s social life. In the US alone, money spent on beauty products exceeds what is spent on both social services and education [1]. Researchers from many different disciplines, including engineering, human science, and medicine, have been interested in beauty [2]. The field of computing has only recently begun studying facial beauty. However, the psychological community has thoroughly researched this [3]. Gustav Fechner, a pioneer in experimental psychology, was interested in quantifying beauty [4]. However, in contemporary models of aesthetic experiences, beauty still remains a mysterious aesthetic response [5,6].
With advancements in psychology, scientists have detected internal and external factors that affect beauty judgment. Fertility and hormone levels are examples of internal influences, whereas social contexts, temporal contexts (e.g., long-term versus short-term relationships), environmental contexts, and visual experiences (e.g., parental familiarity) are examples of external elements [7,8]. Another study has found that facial symmetry is a major factor in determining facial beauty, as the human brain is sensitive to symmetry [9]. Furthermore [10], in addition to facial symmetry and averageness, the major attributes that affect facial attractiveness are full lips, thin eyebrows, tiny nose, high forehead, high cheekbones, and thick hair, which are probably applicable in the case of the attractiveness of men as well. However, the face is more feminine and attractive because of certain major characteristics, such as large lips, a small nose, and high cheekbones, which are indicators of youth, fertility, and high estrogen levels [10].
Existing studies explain the common features that contribute to beauty perception, but fail to explain and quantify the reasons why the human brain decides for a specific face to be beautiful, and why two persons could argue whether full lips are beautiful.
A pioneer neurobiologist Semir Zeki, who has extensively researched the question of beauty from a neuroscience perspective for many years, has defined beauty as, “Beauty is an experience that correlates quantitatively with neural activity in a specific part of the emotional brain, namely, in the field A1 of the medial orbito-frontal cortex (A1mOFC); the more intense the declared experience of beauty, the more intense the neural activity there” [11].
In one recent fMRI-based study [12], Zeki et al. [11] investigated how beautiful faces are manifested in the brain and whether beauty can be decoded on the basis of pattern activity. They showed 120 faces to seventeen volunteers, who rated the attractiveness of each face on a seven-point Likert scale while having their brain activity measured. They discovered that the emergence of various patterns of activity in the fusiform face area (FFA) and occipital face area (OFA), and the concurrent emergence of activity in the medial orbital frontal cortex are the results of the sense of beauty (mOFC). The right FFA (61.17%) and the mOFC (62.35%) exhibited the highest cross-participant classifications of the brain’s activity. However, researchers have concluded their research as, “The precise features that render a face beautiful, beyond the accepted general properties of symmetry, proportions, and precise relationships—which are not in themselves necessarily sufficient to render a face beautiful—may be unknown”.
The irrational integer of order 1.618 known as the golden ratio, symbolized by the symbol Φ (phi), was first referenced in writing in Euclid’s Elements in 300 BC [13].
Many have considered the golden ratio, commonly referred to as the divine proportion, to be the solution to the phenomenon of aesthetics; regularity; alignment; and human physiology, psychology, and beauty [14,15,16]. The golden ratio has been also used in surgical anatomy [17], dental and maxillofacial surgery [18,19], and in cosmetic surgery as a paradigm to measure aesthetics in both soft tissue or hard tissue (cephalometric) levels [20,21]. However, is the face that perfectly matches the golden ratio considered to be beautiful, and who decides whether the face is beautiful or not? Holland’s research [22] shows that there are no sufficient studies supporting the relationship between the golden ratio and facial beauty.
Owing to extensive advancements in the artificial intelligence field and strong links between deep learning techniques and the human brain [23,24], in recent years, the automatic human-like facial attractiveness prediction (FAP) or face beauty prediction (FBP) and its applications in machine learning and computer vision have attracted considerable research interest [25]. Despite significant advancements in determining and estimating the beauty of faces, the majority of studies have concentrated on predicting beauty without a thorough grasp of what constitutes beauty. A machine approach to understanding how the human brain processes such deep human concepts is necessary, as it is still not comprehensively understood in almost all fields [26]. Few studies [3,27,28] have attempted to investigate the constituents of beauty and understand the human brain’s judgments of beauty. However, such studies are all based on objective datasets obtained by either voting or average scores.
To appropriately understand beauty, we propose a novel methodology to train the machine regarding beauty and a new framework to explain the features it depends on in deciding beautiful faces. Table 1 summarizes the related studies. The research is organized as follows: Section 2 presents the details of the proposed approach, Section 3 presents the experimental results, Section 4 discusses the results, and Section 5 concludes the research and mentions future studies. In summary, the major contributions of this paper include the following:

Table 1.
Review of certain existing research on facial beauty models.
- We extract objective general patterns of facial beauty attributes learned subjectively by deep convolutional neural networks (CNNs).
- This is the first study, wherein correlations between beauty and facial attributes are subjectively analyzed based on a quantitative approach. We conclude general patterns of statistically significant attributes of attractiveness.
- We propose a novel framework and algorithm to train CNNs, visualize and extract the learnings of the machine about beauty, and automatically explain every machine decision in the entire dataset.
- We validate existing psychological, biological, and neurobiological studies of beauty and discover new patterns.
- We propose a novel method to prove the relationship between the golden ratio and facial beauty.
2. Related Work
In a recent study [35], researchers used deep learning to build a facial attractiveness assessment model by training a CNN on the SCUT-FBP5500 dataset [34], and they used transfer learning techniques to improve the training accuracy. SCUT-FBP5500 [34] is a new dataset that contains 5500 Asian and Caucasian male and female faces for a multi-paradigm facial beauty prediction. In addition to a shallow prediction model with hand-crafted features, a deep learning model is used to predict facial beauty scores based on the input of 60 volunteers who labelled faces with a score ranging from 0 to 5, where 5 represents the most attractive face. However, does the perception of the 60 volunteers adequately represent beauty in general? Does the predicted score of 5 accurately indicate an extremely beautiful face and a lower score a less beautiful face? What does less beauty mean and according to whom? The main issue with this approach is that it attempts to establish a general beauty prediction model while the concept of beauty is not addressed. First, we need to understand why each volunteer judges a face to be beautiful or not and draw conclusions and establish a model upon this. In addition, the dataset used to train the machine would never manifest how the majority perceive beauty, and considering an average score does not satisfy anyone, including the 60 volunteers themselves, which causes the prediction output to be random and meaningless.
A geometry-based beauty assessment has been proposed to test the effect of geometric shape representation on facial beauty, regardless of other appearance features [28]. Apart from the fact that the proposed method is based on average score data, two faces can have similar geometric shapes; yet the beauty decision is different.
In addition to building beauty prediction models, researchers have attempted to visualize the research on beauty by CNNs trained on Asian faces through visualization of filters for understanding the reasons behind beauty decisions. However, the visualization of filters did not explain the reasons behind beauty decisions or show features of beauty because filters alone are uninterpretable [32]. The correlation between facial features was investigated by a different approach [3]. In this approach, researchers pre-assumed that the correlation between facial features renders a face beautiful; accordingly, their neural network was trained not to learn beauty but extract and estimate facial features based on majority voting and average score datasets, without investigating the reasons behind beauty decisions. Recent research [27] used an effective approach based on the gradient-weighted class activation mapping (Grad-CAM) technique [36] to visualize the learnings of neural networks about beautiful faces. This study used the previously mentioned dataset SCUT-FBP5500 [34] to train the CNN model and obtain activation maps, and the top 50 images with the highest attractiveness scores were averaged by overlaying images of the face activation maps. However, this approach has two limitations: first, training is based on average score data; second, an average of activation maps cannot convey how the machine determines beauty for each face and based on what features.
3. Methods
Deep human feelings, such as beauty, are common and highly subjective and are affected by many internal and external factors such as hormones, media, and environment, or even certain scenes, sounds, and smells [37,38]. The way these experiences evolve and accumulate causes an individual’s decisions to be unique and subjective. Therefore, to study such human phenomena and arrive at a general pattern and conclusion, we propose closely investigating each decision subjectively.
In our approach, we assume that beauty decisions are the result of brain cognition and perception and inherit all the accumulated information that eventually leads to such decisions. Since there is no sufficient information on the constituents of beauty in different fields of science, and since there is a strong relation between deep learning and the human brain, if we successfully train a deep learning network to mimic the human brain by identifying and classifying beauty subjective to a specific person, then we can claim that studying the learnings of the machine can explain what the individual’s brain learned.
To perform this study, data were subjectively collected and fed to the machine to teach it to mimic each participant’s brain decisions using deep learning. Once the machine successfully adopts the human brain’s decisions, we can study the human brain by studying the machine. Instead of assuming predefined features, the machine completely learns the features that contribute to beauty decisions. The proposed methodology is illustrated in Figure 1.
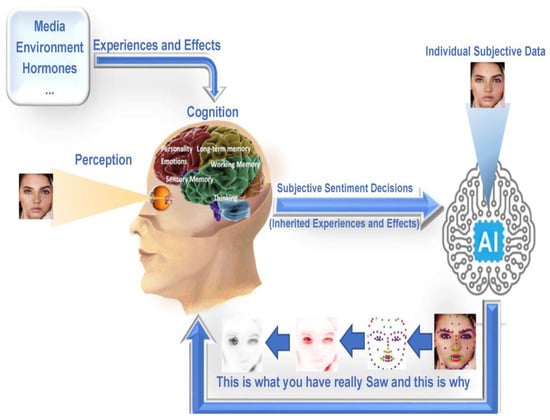
Figure 1.
An illustration of research methodology.
3.1. Data Preparation
In previous studies, the datasets used in training CNNs, determining facial ratios, and assessing facial geometric features were based on either group voting or average score rating, by assuming that beauty is universal, which is not necessarily true. Figure 2 illustrates the problem of such an approach, which can be summarized as follows:
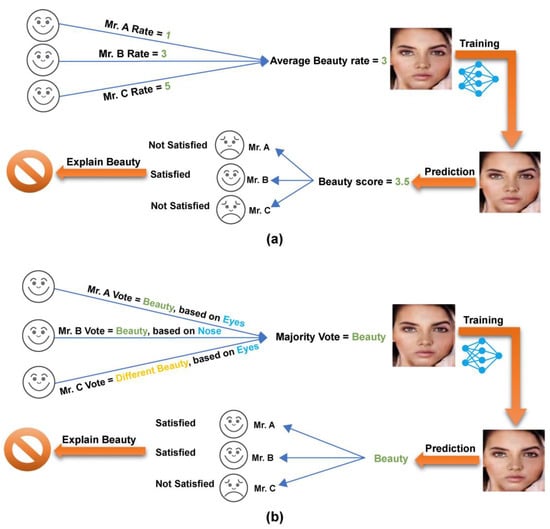
Figure 2.
Illustration of the objective approach problem. (a) Approach based on average scores. (b) Approach based on voting.
- Predictions are not satisfactory and meaningless.
- However, when the majority rate or vote for a face is beautiful, they still disagree on the reason behind voting, which aggravates the problem that renders predictions meaningless.
- Because the model is trained on average scores and/or voting and produces meaningless predictions, the model learning is ambiguous, and it is impossible to interpret neurons to explain beauty, as there is no basis to justify beauty accordingly.
Since “beauty lies in the eyes of the beholder”, we believe every face is beautiful, at least to someone. Thus, in this study, we use the terms “Beauty” and “Different Beauty” that indicate the subjectivity of beauty. In this study, we collected 50,000 female faces’ images and included 10 male participants. The participants were from the Middle East and were aged between 25 and 35 years. The dataset contained different ethnicities, ages, accessories, and backgrounds. Images were crawled from sources under permissive licenses and automatically aligned and cropped using image processing techniques. To avoid any potential ethical or copyright issues, all faces illustrated in this paper have been synthetically generated by a computer and do not belong to any real person. We developed an interactive GUI application that all participants utilized to automate the classification process and data collection. This resulted in a clear and simple classification approach in which all participants employed the same classification strategy for the same dataset and were provided the same instructions. They were told to base their judgment solely on facial beauty. To avoid order effects, photos were shown on separate pages, each in random order. Participants could look at a face without time limits and were free to return to faces that they had already seen and changed their evaluation. The GUI is programmed to show each face with three labels: “Beauty”, “Different Beauty”, and “Another”, which a participant can choose if the face is perceived to neither belong to the “Beauty” or “Different Beauty” category. Every participant collected 3000 female face images for each class; the total number of faces per participant was 6000, and the average labeling time was 28 h. Since the 50,000 dataset was randomly displayed for each participant, it was not necessary that all participants rated the same faces, as our main objective was to construct a subjective dataset for each person and subsequently derive a general pattern at the end of the study.
3.2. Ensemble Learning
Ensemble learning promotes the “wisdom of crowds”, which holds that the judgment of a larger group of people is often superior to that of a single expert. Similarly, ensemble learning describes a collection (or ensemble) of basic learners or models who collaborate to produce a more accurate final prediction. A single model, also known as a base or weak learner, may not function effectively alone, owing to excessive variation or strong bias. However, weak learners can collaborate to build a strong learner, which outperforms any individual base model, since their combination minimizes bias or variation [39,40].
Let be a sample space containing samples and belong to classes which comprises class set . Consider independent voters (basic classifiers) as Given sample , the prediction (vote) by is . Accordingly, the simple ensemble voter (classifier) system is described as
where represents the threshold for voting, and implies the logic operator AND. In this approach, each voter has the same weight, regardless of their performance. However, by examining each voter’s strengths in recognizing and assigning different weights, the ensemble system judges more accurately and produces considerably better performance. The ensemble-weighted majority voting system is described as follows:
where represents the weight of voter voting to for a given , and represents all weight lists of the majority votes of winner voters . For optimum learning, we propose using varied training data with k-fold cross-validation for each voter, wherein for each fold model , we create snapshots. The primary idea behind creating model snapshots is to train a single model while continuously lowering the learning rate to reach a local minimum and to save a snapshot of the weight of the current model. Later, to move away from the current local minimum, it will be essential to actively accelerate learning. The process continues until all cycles are completed. Using cyclic cosine annealing, one of the primary techniques for producing model snapshots for CNN is to gather multiple models during a single training session [41]. The cyclic cosine annealing approach begins with the initial learning rate, progressively drops to the bare minimum, and then rapidly shoots back up. Each epoch’s learning rate for cyclic cosine annealing is given by the following expression:
where is the entire count of the training iterations, the count of cycles, is the learning rate at epoch , and is the initial learning rate. The weight of the snapshot model is defined as the weight at the bottom of each cycle. The next learning rate cycle makes use of these weights but permits the learning algorithm to reach various conclusions, thereby producing a variety of snapshot models. We obtained model snapshots when s training cycles were completed, each of which was used for ensemble prediction. By using model snapshot predictions, we applied simple average ensemble predictions for each fold model m of each base classifier (voter). The output of the simple average ensemble predictions for each voter was used to obtain the final weighted voting ensemble, as illustrated in Algorithm 1. In the next section, we discuss the use of different policies as voting weights.
| Algorithm 1: Machine-weighted voting algorithm |
| ; K base learning algorithms Output: Machines Vote Initialization; do 1: Split D into do for ith split. End Concatenate m Apply weighted class voting (4). End |
3.3. Optimal Voting Weights
3.3.1. Best Combination
Grid searching for weight values between 0 and 1 for each ensemble member, such that the weights across all ensemble members add to one, is the simplest and possibly the most exhaustive approach. According to a study [39], however, using the optimization model proposed by Perrone et al. (1992) that aims to combine predictions from fundamental classifiers by choosing the most appropriate weight to combine them, such that the resulting ensemble reduces the overall expected prediction error (MSE) is a more effective approach than other methods [42].
where denotes the vector of the basic classifier predictions on the cross-validation samples; is the vector of true response values, and is the weight corresponding to the base model . Assuming that is the total number of instances, the optimization model is as follows: is the true value of observation , and is the prediction of observation of the base model .
The aforementioned formulation is a nonlinear convex optimization problem. Computing the Hessian matrix shows that the objective function is convex since the constraints are linear. Therefore, the best solution to this problem is shown to be the global best solution because the local optimum of a convex function (the objective function) in a convex feasible region (the feasible region of the preceding formulation) is guaranteed to be a global optimum [43].
3.3.2. Priori Recognition Performance Statistics
A basic classifier is assigned more weight based on how well it recognizes patterns [40] Let the confusion matrix of voter be
When , denotes the count of samples that belong to class and are classified accurately as by voter . When , represents the number of samples belonging to class that are misclassified as by voter . The instances classified as become
Consequently, the conditional likelihood that this sample belongs to class is reflected as
When classifier classifies instance as class , its voting weight for class is .
3.3.3. Model Calibration
Neural networks are usually calibrated inadequately [44], implying that they are overconfident in their predictions. In the classification process, neural networks produce “confidence” scores along with the predictions. These confidence levels ideally coincide with the actual likelihood of correctness. For instance, if we provide 100 predictions with a confidence level of 80%, we would anticipate that 80% of the predictions will come true. If such a case, the network is calibrated. Model calibration is the process of obtaining a trained model and applying a post-processing procedure to enhance its probability estimation.
Let input images and class labels be random variables following the joint ground-truth distribution , and let be a CNN with , where is the predicted class, and is the attributed confidence level. The objective is to calibrate , such that it represents the true class probability. In practice, the accuracy of deep learning networks is typically lower than confidence. Perfect calibration is defined as
The calibration error which describes the deviation in expectation between confidence and accuracy is
Calibration techniques for classifiers seek to convert an uncalibrated classifier’s confidence score to a calibrated one that corresponds to the precision for a specific level of confidence [45]. This calibration technique is a post-processing technique that requires a separate learning phase to establish a mapping along with which denotes the calibration parameters and can be considered a probabilistic model . The calibration parameters are typically estimated using the maximum likelihood (ML) for all scaling methods while minimizing the NLL loss. The calibration parameter can be calculated in this case by applying an uninformative Gaussian prior with a wide variance over the parameters and inferring the posterior by
where is the likelihood. We can map a new input with the posterior predictive distribution defined by
We modeled the epistemic uncertainty of calibration mapping as opposed to Bayesian neural networks (BNNs). The distribution acquired by calibration for a sample with index rather reflects the uncertainty of the classifier for a specific degree of confidence than the model uncertainty for a particular prediction. A distribution is obtained as a calibrated estimate. We utilized stochastic variational inference (SVI) as an approximation because the posterior cannot be calculated analytically. SVI uses a variational distribution (often a Gaussian distribution) whose structure is simple to evaluate [45]. We sample sets of weights and utilize them to construct a sample distribution consisting of estimates for a new single input , with the parameters of the variational distribution optimized to match the true posterior using the evidence lower bound (ELBO) loss.
We utilized the vector scaling method which is an extension of Platt scaling [46]. Temperature scaling is a popular method for calibrating deep learning models [44]. Temperature scaling is a parametric calibration approach optimized with respect to negative-log-likelihood (NLL) on validation data [44]. It learns a single parameter temperature ( for all classes to produce the calibrated confidences:
where is the class label , is the logit vector, and is the predicted confidence. As , approaches the minimum that indicates maximum uncertainty.
Calibration Evaluation
A typical metric for determining the calibration error of neural networks is expected calibration error (ECE) [44]. Let be the set of sample indices whose predicted confidence falls within the range , . The accuracy of is
where and are the true label and predicted value of the instance . The average predicted confidence of bin can be formulated as
where is the confidence of sample .
The expected calibration error (ECE) takes the weighted average of the bins’ accuracy/confidence differences of number of samples:
The maximum calibration error (MCE) [44] focuses more on high-risk applications, where the maximum accuracy/confidence difference is more important than the average which represents the worst-case scenario.
Uncertainty Evaluation
Prediction interval coverage probability (PICP) is a metric used for Bayesian models to determine the quality of uncertainty estimates, that is, the likelihood that an instance’s true value falls within the predictive range. The mean prediction interval width (MPIW) is another metric used to measure the mean width of all prediction intervals to evaluate the sharpness of the uncertainty estimates.
A prediction interval around the mean estimate can be used to express epistemic uncertainty. We obtained the interval boundaries by selecting quantile-based constraints of the range for a specific confidence level , while assuming a normal distribution.
where represents the observed precision of sample for specific . If all samples of the measured accuracies lie in a prediction interval (PI) around of the time, the uncertainty is appropriately calibrated [45], with being a calibration model that produces a PDF for input with index out of samples. The PICP was calculated as follows:
The definition of the PICP is usually applied when performing calibrated regression, and when the true target value is known. However, the true precision of the classification is not easily obtainable. As a result, we apply a binning method to all available quantities with samples to estimate the precision for each sample. It is necessary for PICP as for flawless uncertainty calibration. Using this concept, we can calculate the uncertainty by measuring the difference between PICP and . The PI width for a certain is averaged over all N samples to obtain the MPIW, which is a complementary metric. With regard to the two metrics, we want the models to have larger PICP values while reducing the MPIW. By utilizing PICP and MPIW, we can assess both the quality of the calibration mapping and epistemic uncertainty quantification. In our study, we propose using PICP as an ensemble voting weight.
3.4. Proposed Framework to Explain CNNs
Even though CNN achieves extremely high accuracy in many detection and classification problems, the CNN is considered a “Black box”. Although we understand the CNN architecture and process and how features are extracted, it is still difficult for humans to know how the network decides its classification and based on what features the decision is made. This is extremely important in vital areas where the decision reason is important, such as in military operations and medicine fields. Explainable AI (XAI) research has grown significantly in recent years owing to the rapid advancement in deep learning and the need for reliable machine decisions. Deep Taylor decomposition is a powerful technique for explaining CNN decisions by identifying the features in an input vector that have the greatest impact on a neural network’s output based on redistributed relevance [47]. In a recent Alzheimer’s disease detection study, deep Taylor decomposition produced more reasonable and accurate results than Grad-CAM [48]. Layer-wise relevance propagation (LRP) is the foundation for deep Taylor decomposition [49] that seeks to create a relevance metric R over the input vector, such that we can represent the network output as the sum of the values of R, , where is the neural network forward pass function. We can use the deep Taylor decomposition function in terms of its partial derivatives to approximate the relevance propagation function illustrated in Figure 3.
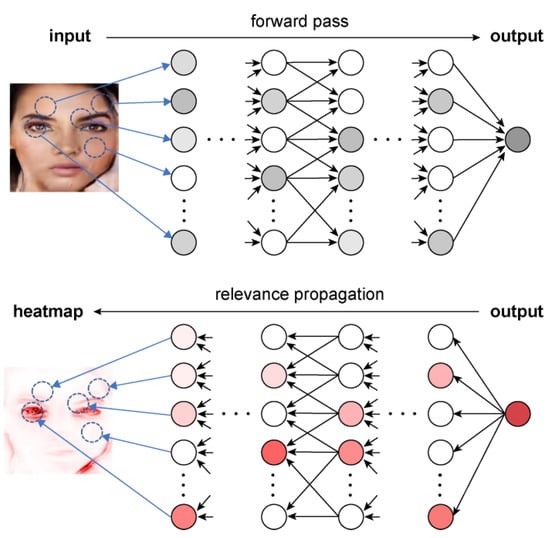
Figure 3.
Computational flow of deep Taylor decomposition.
Consider a neuron taking input vector that outputs
To decompose the neuron output in terms of the input variables, the output is rewritten as a first-order Taylor expansion:
where is the root point of the forward-propagation function. The local decision boundary is where the root points of the forward propagation function are; therefore, the gradients along that boundary point provide the greatest details regarding how the function categorizes the input. The deep Taylor decomposition equation can be rewritten as follows:
By searching the root point in the direction of the input space, we obtain the explicit decomposition equation
Another contemporary XAI method based on popular local interpretable model-agnostic explanations (LIME) [50] is the Bayesian local interpretable model-agnostic explanations (BayLIME) [51]. This method can be used with any machine-learning model because it is model-agnostic. By changing the input of the data samples and observing how the predictions vary, the technique aims to understand the model. The output of the LIME is a list of explanations indicating the contribution of each characteristic to the prediction of a data sample. This offers local interpretability and makes it possible to identify feature changes that have the greatest influence on the prediction. Let be the input set with samples, where is instance with features (i.e., ), and let be the corresponding target values. Accordingly, the maximum likelihood estimates of the weighted samples for the linear regression model is , and is the diagonal matrix, which is determined by a kernel function based on the proximity of the new samples to the original instance. BayLIME proposes embedding prior knowledge as follows:
where is the mean vector matrix to be estimated, is the “pseudo-count” of the prior sample size based on which we form our prior estimates of ( is identity matrix), and is the “accurate-actual-count” of observation data size, i.e., the true inference of the perturbed data scaled by precision . Let which symbolizes one feature instance with a simpler kernel function that yields a constant weight then becomes
Using point data prior to our new experiment, we created our prior estimate of . We collected samples in the experiments and obtained the MLE estimate by considering the precision and weights of the new samples. Depending on the distributions of the efficient data size employed, that is,
and
, we combine and . Finally, all of the effective samples employed capture the confidence in our new posterior estimate, that is, (the posterior precision).
In our research, we also use another effective method that uses perturbation masks to alter Sobol indices in the context of black-box models to determine whether parts of the sample have an impact on output predictions [52]. Let be independent variables, and assume that . Let is , its complementary and is the expectation over the perturbation space.
Hoeffding decomposition enables the expression of the function as sums of increasing dimensions, with the symbol signifying the partial contribution of the variables to the score :
Following the constraint,
The sensitivity index which quantifies the contribution of the variable set contributed. to the model response in terms of fluctuation are given by Sobol indices:
With regard to the model decision, Sobol indices provide a quantification of the significance of any subset of features where .
The total Sobol index which quantifies the contribution of variable to the variance of the output of the model and its interactions of any order with any other input variables are as follows:
A more efficient estimator uses the Jansen estimator with the quasi-Monte Carlo (QMC) sampling strategy. Let and be the elements of the matrices, such that represents the number of variables investigated, and is the number of instances in matrices A and B obtained in the same size as the perturbed inputs. The new matrix formed is similar to A, except that the column of replaced the corresponding column of variable i. We express and the empirical variance . The empirical estimators for the first order () and total order () can be formulated as
3.5. Proposed Approach to Explain Facial Beauty
XAI techniques are excellent tools for inferring and visualizing the learnings of neurons; however, examining every output manually is a tedious process, and it is an almost impossible task in the case of enormous datasets. Furthermore, examining only some samples provides less information about the learning of the machine, and in some cases, it can be extremely dangerous, as in medical diagnosis and army equipment. In general, to have a reliable machine system, we need to know what the neurons learned and how they made their decision for every input before a real application deployment. To overcome this challenge and visualize and understand what the machine learned about beauty, we propose the most voted feature (MVF) algorithm, Algorithm 2: a novel approach that enables explanation of every decision a machine makes and determination of a general learned pattern by considering the dataset as an input and the learned features that the machine decision depends on in the entire dataset as the output. The proposed MVF algorithm acting as an independent component can be applied as part of any CNN and XAI method, and it has the possibility of being deployed to different machine learning tasks.
The MVF algorithm starts the process by reading an image as input data in RGB channels and obtaining the coordination points of the interesting area using object and landmark detection techniques. Subsequently, these coordination points are encoded and grouped into all possible and interesting features to examine . The possible beauty features are presented in Table 2. The next process is based on the output of the XAI technique. For the activation of visualization-based methods such as Sobol and Deep Taylor, we predict the class and subsequently obtain the learned features using a pre-trained model. The output is normalized and converted into a new grayscale image, where Gaussian convolution is applied (Equation (35)). Gaussian convolution is used to average the image pixels and obtain the coordination of the maximum pixel values that represent the most learned feature coordinate (Equation (36)).

Table 2.
Facial features.
For segmentation visualization-based methods such as BayLIME, we first obtain the contours [53] as objects , and subsequently, calculate the raw moments. For a 2D continuous function , the moment of order is defined as
for; adapting this to a scalar (grayscale) image with pixel intensities , raw image moments for a segment are calculated by
Once we calculate the raw moments for each object, we can obtain the maximum contour area { and derive different image properties, such as the centroid coordinate .
After obtaining the most learned feature coordinate , we calculate all distances between interesting features and the most learned feature using (Equation (39)). All calculations are based on the Cartesian pixel coordinate system, where the origin (0, 0) is in the upper-left corner. The final step is to obtain the most dependent feature (MVF) which is the minimum distance (Equation (40)).
Beauty Feature Voting
After obtaining the learned features of each voter, we propose weighted feature voting. Let be the output features set by each voter for a given sample . Equation (4) becomes
where represents the weight of the voter voting for feature explained by explainer. The framework of the proposed method is shown in Figure 4 and Algorithm 2.
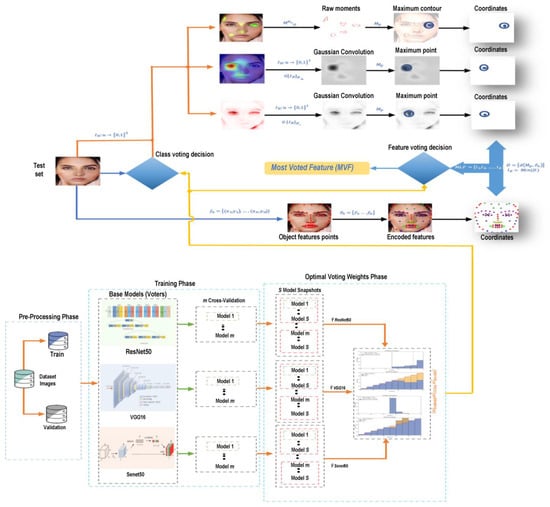
Figure 4.
Framework of the proposed method.
| Algorithm 2: Most voted feature (MVF) algorithm |
| ; Landmarks Detector initialization; do do . ; ; 4: Get class using Voters If Activations based method do ; ; ; Else if Segmentation based method do . 8: Get { 12: Apply weighted feature voting and get The Most Voted Feature (MVF) (4). end |
3.6. Golden Ratio
The golden ratio of the two-line segments equals the ratio of their sum to the longer segment, which equals their ratio [54], as illustrated in Figure 5. To investigate the golden ratio effect and its relation to facial beauty, we propose to calculate 23 golden facial geometric features in addition to the main facial features, including the eyes, nose, and mouth, as illustrated in Figure 6 and Table 3. Unlike previous studies that examined facial symmetry, the 23 geometric features contained almost all possible facial features that provided sufficient information to test feature symmetry based on the golden ratio and provided a suitable assessment of the overall facial symmetry.
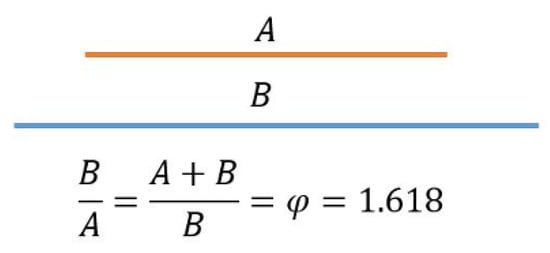
Figure 5.
Golden Ratio.
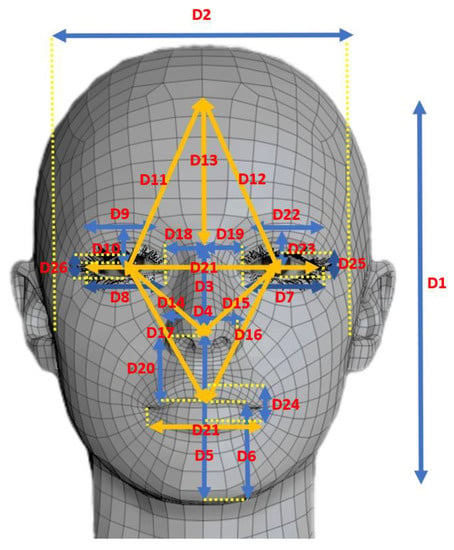
Figure 6.
Facial geometrics features used in Table 3.

Table 3.
Proposed 23 golden facial geometric features.
3.7. Evaluation Metrics
During classification training, the evaluation metric is crucial for obtaining the best classifier. Therefore, choosing an appropriate assessment measure is crucial for differentiating and achieving the best classifier [55]. To statistically evaluate our proposed methods, we used multiple metrics to evaluate both performance and correlation. To measure the correlation between features and beauty, we applied the point-biserial correlation coefficient (rpb) [56] which can be considered a case of the Pearson correlation coefficient (PCC) in the case of a dichotomous variable. The dichotomous variable Y is assumed by rpb to have two values, 0 and 1, which in our study correspond to the two binary classes of Beauty and Different Beauty. The point-biserial correlation coefficient is calculated as follows: the data set is divided into two groups: the Beauty group, which received the value “1” on Y, and the Different Beauty group, which received the value “0” on Y.
where represents the mean value of the continuous variable X for the total sample points in Group 2, is the mean value of the continuous variable X for the total sample points in Group 1, and is the standard deviation. The number of data samples in Group 1 is , those in Group 2 are , and the overall sample size is . The point-biserial correlation coefficient, which ranges from −1 to +1, assesses the degree of relationship between two variables. A value of −1 denotes a perfect negative association, a value of +1 denotes a perfect positive association, and a value of 0 indicates no association.
For performance evaluation, we applied the Matthews correlation coefficient (MCC) [57] to evaluate how well binary (two-class) classifications were performed. The MCC returns a number between 1 and +1 and is essentially a correlation coefficient between the observed and anticipated binary classifications. A coefficient of +1 denotes a correct prediction, 0 denotes a prediction that is no better than chance, and 1 denotes a complete discrepancy between prediction and observation. In addition, we considered the following evaluation measures to statistically assess the efficacy of our suggested method: area under the curve (AUC), a popular ranking metric; accuracy, which measures the ratio of correct predictions over the total number of instances evaluated; precision, which measures the proportion of positive patterns that are correctly classified; recall, which measures the proportion of positive patterns that are correctly predicted; and F1-score, which represents the harmonic mean between recall and precision values [55]. Let represent true positive and true negative, respectively, and represent false positive and false negative, respectively. Accordingly, the performance metrics are calculated as follows:
4. Empirical Results
4.1. Learning Beauty
Quantitative evaluations of the proposed approach were performed for both beauty classifications and explanations. In our study, we deployed ResNet50 [58], SENet [59], and VGG16 [60] as base models. A convolutional neural network (CNN) architecture VGG16 was employed to win the 2014 ILSVR (ImageNet) competition. This is regarded as one of the best vision model architectures created to date. The most distinctive feature of VGG16 is that it emphasizes having convolution layers of 3 × 3 filters with a stride of 1 and always utilizes the same padding and MaxPool layer of 2 × 2 filters with a stride of 2. Throughout the entire architecture, the convolution and max pool layers are arranged in the same manner. It ends with two fully connected layers (FC) and a softmax layer for the output. The 16 layers in VGG16 indicate that there are 16 layers with weights. This network incorporates 138.4 million parameters, rendering it sizable. ResNet50 comprises 48 convolutional layers, one MaxPool layer, and one average pool layer. The framework ResNets introduced enabled the training of extremely deep neural networks, implying that the network may include hundreds or thousands of layers and still function suitably. The squeeze and excitation network (SENet), which adds a channel-wise transform to the current deep neural network (DNN) building blocks, such as the residual unit, has achieved outstanding image classification results. SENet provides CNNs with a novel channel-wise attention technique to enhance channel interdependencies. The network includes a parameter that adjusts each channel weight, such that it is more responsive to important features and less sensitive to unimportant features.
To accomplish the model formulation and evaluation processes, we used three-fold cross-validation. For each fold cross-validation, three snapshot models were established, which resulted in nine models for the three folds, and the data were split into three equivalent subsets that were mutually exclusive for the three-fold cross-validation. Two of the three subsets were used as the training set in each iteration, and the third subset was used as the validation set. The final evaluation of each model depended on the average ensemble performance of nine snapshots created for each model. Before the final weighted voting ensemble stage, each base model was calibrated to obtain the base model performance, calibration errors, model confidence, and uncertainty. All experiments were repeated 10 times in order to reduce statistical variability. The calibration output and performance of our experiments are reported in Table 4, Table 5, Table 6 and Table 7.

Table 4.
Average calibration output of each voter for all participants.

Table 5.
Average performance of each voter for all participants.

Table 6.
Calibration output of the ensembled models on the test data.

Table 7.
Performance of the ensembled models on the test data.
4.2. Most Dependent Features
In the previous section, we enabled the machine in understanding beauty, and here, we expect the machine to teach us what leads to beauty decisions. We must study the pattern and understand why and how the machine made its decisions based on what information. Using our proposed Algorithm 2, we are able to detect which features the model mostly depends on for each face in the entire dataset in both Beauty and Different Beauty classes. Table 8 shows the Top-5 facial attribute correlations with beauty decisions. Figure 7 shows the output of Algorithm 2: the most dependent feature (MVF) for both classes.

Table 8.
Top-five facial attributes correlation with beauty decision.
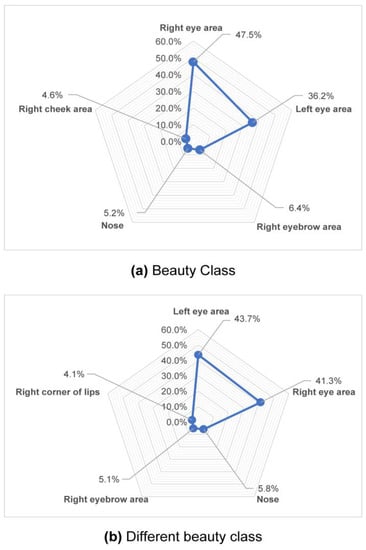
Figure 7.
Most Dependent Feature (MVF). (a) Shows the Top-5 features the machine was depending on when making Beauty class decision. (b) Shows the Top-5 features the machine was depending on when making Different beauty class decision.
Figure 8 shows the face’s side correlation with the machine’s sentimental decisions based on the side of the face the machine paid more attention to while deciding and categorizing into Beauty and Different Beauty classes.
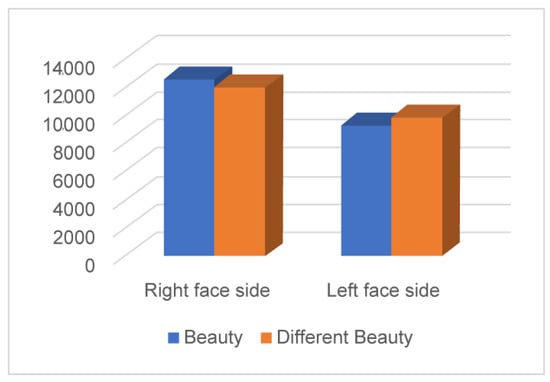
Figure 8.
Face’s side correlation with machine’s sentiment decisions.
4.3. Golden Beauty
In this section, we investigate the relationship between the golden ratio and beauty by calculating the golden ratios of the proposed 23 golden facial geometric features for every face in the datasets in both classes. The results of the golden ratio for every feature are shown in Figure 9, and the total mean golden ratio of both classes for each participant is shown in Figure 10.
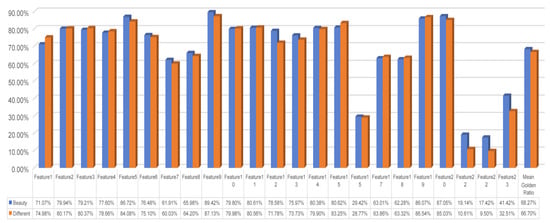
Figure 9.
Features golden ratios.
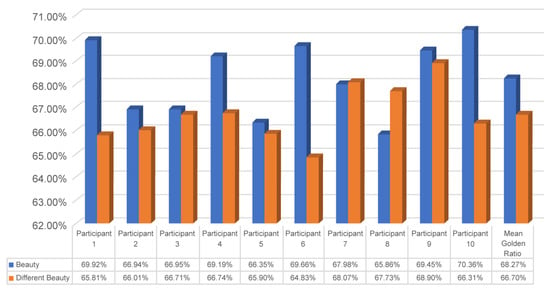
Figure 10.
Mean of total golden ratio for both classes.
Using the MVF in the previous section, we found that beauty is correlated more with the right side of the face and specifically to the right eye. The golden ratio correlates more with beauty face decisions. However, it is not understood what causes the right eye to be more influential in beauty decisions than the left eye. To investigate this further, we calculated the average golden ratio of both the right and left eyes of all datasets of the participants. The results of the average eye representation, along with its golden ratio, are shown in Table 9.

Table 9.
Beauty class average eye golden ratio of 10 participants.
5. Discussion
The experimental results presented in the previous section show a unique and interesting pattern of beauty. We noticed that most attention was paid to the eyes for both classes of Beauty and Different Beauty. This is extremely interesting as a recent social psychology study concluded that eyes are not only a “window to the soul, but also a benchmark of beauty” [61]. However, in our study, we were able not only to detect the most important feature in beauty decisions, but also to identify which sides of the eyes the beauty decision depends on. The decisions pertaining to the Beauty class were mostly based on the right eye area, while the decisions pertaining to the Different Beauty class were based on the left eye area beside the nose and lip areas. Another interesting finding is the side of the face on which beauty decisions mostly depend. The decisions pertaining to the Beauty class correlated with the right side of the face, while those regarding the Different Beauty class correlated more with the left side of the face. Interestingly, the fMRI-based study mentioned earlier in the Introduction [12] concluded that the cross-participant classification of the activity in the brain was higher on the right side of the fusiform face area (FFA). In another recent fMRI-based study, researchers found that the left dorsal lateral prefrontal cortex (dlPFC) strongly correlates with the Different Beauty class [62]. In the second part of the experiment, we investigated facial symmetry based on the golden ratio. The results show that a specific feature-based golden ratio is not necessarily an indicator of beauty. However, the overall golden ratio confirms a strong relationship between beauty and the golden ratio. In addition, the most interesting finding is that the right eye features a higher golden ratio than the left eye in both classes. Unlike previous approaches that classify beauty based on the golden ratio, we claim that our approach is a novel empirical approach that proves the correlation between beauty and the golden ratio without any previous assumption of beauty and is based on subjective pre-classified faces. These results could be affected by dataset quality, participant bias, and other factors such as education, environment, and personality characteristics of left-handed versus right-handed persons. A single source of face images of the same quality and poses should be considered in future studies. In addition, having different participants of different ethnicities and including additional metadata regarding participants in the study can produce more informative results. Reproducible results are available at https://github.com/waleed-aldhahi/LSLS/ (accessed on 20 December 2022).
6. Conclusions and Future Work
Existing psychological and biological studies explain the common features that contribute to beauty perception but fail to explain and quantify the reasons behind a person’s judgement of a specific face to be beautiful and why two persons could argue about whether full lips are beautiful. Despite considerable progress in estimating and predicting facial beauty, most studies have focused on predicting beauty without an adequate understanding of beauty. In this research, we propose a novel approach based on deep learning to address the question of beauty and how people process and perceive beauty. We evaluated state-of-the-art related research in psychology, neuroscience, biology, and engineering. To explain how the brain determines beauty, we proposed a subjective approach to teaching the machine to learn beauty using uncertainty-based ensemble machine voting. To obtain a quantifiable measure of beauty, we propose a novel algorithm and framework that addresses the limitations of the current explainable AI (XAI) and provides us the ability to understand every decision the machine makes and obtain the general learned patterns. In addition, we propose a novel approach to prove the relationship between beauty and facial symmetry based on the golden ratio. In future work, we will develop an additional dataset with male faces, conduct a larger experiment involving more participants of both genders and diverse ethnicities and ages, and apply our approach to obtain a deeper and general conclusion of beauty decision patterns. In deep learning, the network weights are updated and accumulated by each input; analogically, accumulated human experiences render beauty decisions highly subjective and distinct, even for the same person. Thus, there might be no ultimate truth or absolute correctness of the essence of beauty.
Author Contributions
Conceptualization, W.A.; methodology, W.A. and T.A.; software, W.A.; validation, W.A., T.A., and S.S.; formal analysis, W.A.; investigation, W.A. and T.A.; resources, W.A.; data curation, W.A.; writing—original draft preparation, W.A.; writing—review and editing, W.A. and T.A.; visualization, W.A.; supervision, S.S.; project administration, W.A. and S.S.; funding acquisition, S.S. All authors have read and agreed to the published version of the manuscript.
Funding
This research received no external funding.
Data Availability Statement
The datasets used and/or analyzed during the current study are available from the corresponding author upon reasonable request.
Acknowledgments
The authors would like to acknowledge the Saudi Arabian Ministry of Higher Education and Korea University. The authors are thankful to the editor and anonymous reviewers for their time and critical reading and are specifically grateful to all the participants in this study.
Conflicts of Interest
The authors declare no conflict of interest.
References
- Adamson, P.A.; Doud Galli, S.K. Modern Concepts of Beauty. Plast. Surg. Nurs. 2009, 29, 5–9. [Google Scholar] [CrossRef] [PubMed]
- Liu, S.; Fan, Y.-Y.; Samal, A.; Guo, Z. Advances in Computational Facial Attractiveness Methods. Multimed. Tools Appl. 2016, 75, 16633–16663. [Google Scholar] [CrossRef]
- Liu, X.; Li, T.; Peng, H.; Ouyang, I.C.; Kim, T.; Wang, R. Understanding Beauty via Deep Facial Features. In Proceedings of the 2019 IEEE/CVF Conference on Computer Vision and Pattern Recognition (CVPR) Workshops (CVPRW), Long Beach, CA, USA, 16–17 June 2019. [Google Scholar]
- Ortlieb, S.A.; Kügel, W.A.; Carbon, C.-C. Fechner (1866): The Aesthetic Association Principle—A Commented Translation. i-Perception 2020, 11. [Google Scholar] [CrossRef] [PubMed]
- Pelowski, M.; Markey, P.S.; Forster, M.; Gerger, G.; Leder, H. Move Me, Astonish Me… Delight My Eyes and Brain: The Vienna Integrated Model of Top-down and Bottom-up Processes in Art Perception (VIMAP) and Corresponding Affective, Evaluative, and Neurophysiological Correlates. Phys. Life Rev. 2017, 21, 80–125. [Google Scholar] [CrossRef]
- Leder, H.; Nadal, M. Ten Years of a Model of Aesthetic Appreciation and Aesthetic Judgments: The Aesthetic Episode—Developments and Challenges in Empirical Aesthetics. Br. J. Psychol. 2014, 105, 443–464. [Google Scholar] [CrossRef]
- Baker, S.B.; Patel, P.K.; Weinzweig, J. Aesthetic Surgery of the Facial Skeleton; Elsevier: London, UK, 2021. [Google Scholar]
- Little, A.C.; Jones, B.C.; DeBruine, L.M. Facial Attractiveness: Evolutionary Based Research. Philos. Trans. R. Soc. B Biol. Sci. 2011, 366, 1638–1659. [Google Scholar] [CrossRef]
- Little, A.C.; Jones, B.C. Attraction Independent of Detection Suggests Special Mechanisms for Symmetry Preferences in Human Face Perception. Proc. Biol. Sci. 2006, 273, 3093–3099. [Google Scholar] [CrossRef]
- Buggio, L.; Vercellini, P.; Somigliana, E.; Viganò, P.; Frattaruolo, M.P.; Fedele, L. “You Are so Beautiful”: Behind Women’s Attractiveness towards the Biology of Reproduction: A Narrative Review. Gynaecol. Endocrinol. 2012, 28, 753–757. [Google Scholar] [CrossRef]
- Zeki, S. Notes towards a (Neurobiological) Definition of Beauty. Gestalt Theory 2019, 41, 107–112. [Google Scholar] [CrossRef]
- Yang, T.; Formuli, A.; Paolini, M.; Zeki, S. The Neural Determinants of Beauty. bioRxiv 2021, 4999. [Google Scholar] [CrossRef]
- Vegter, F.; Hage, J.J. Clinical Anthropometry and Canons of the Face in Historical Perspective. Plast. Reconstr. Surg. 2000, 106, 1090–1096. [Google Scholar] [CrossRef] [PubMed]
- Bashour, M. History and Current Concepts in the Analysis of Facial Attractiveness. Plast. Reconstr. Surg. 2006, 118, 741–756. [Google Scholar] [CrossRef] [PubMed]
- Marquardt, S.R. Stephen, R. Marquardt on the Golden Decagon and Human Facial Beauty. Interview by Dr. Gottlieb. J. Clin. Orthod. 2002, 36, 339–347. [Google Scholar]
- Iosa, M.; Morone, G.; Paolucci, S. Phi in Physiology, Psychology and Biomechanics: The Golden Ratio between Myth and Science. Biosystem 2018, 165, 31–39. [Google Scholar] [CrossRef] [PubMed]
- Petekkaya, E.; Ulusoy, M.; Bagheri, H.; Şanlı, Ş.; Ceylan, M.S.; Dokur, M.; Karadağ, M. Evaluation of the Golden Ratio in Nasal Conchae for Surgical Anatomy. Ear Nose Throat J. 2021, 100, NP57–NP61. [Google Scholar] [CrossRef] [PubMed]
- Bragatto, F.P.; Chicarelli, M.; Kasuya, A.V.; Takeshita, W.M.; Iwaki-Filho, L.; Iwaki, L.C. Golden Proportion Analysis of Dental–Skeletal Patterns of Class II and III Patients Pre and Post Orthodontic-Orthognathic Treatment. J. Contemp. Dent. Pract. 2016, 17, 728–733. [Google Scholar] [CrossRef]
- Kawakami, S.; Tsukada, S.; Hayashi, H.; Takada, Y.; Koubayashi, S. Golden Proportion for Maxillofacial Surgery in Orientals. Ann. Plast. Surg. 1989, 23, 95. [Google Scholar] [CrossRef]
- Stein, R.; Holds, J.B.; Wulc, A.E.; Swift, A.; Hartstein, M.E. Phi, Fat, and the Mathematics of a Beautiful Midface. Ophthal. Plast. Reconstr. Surg. 2018, 34, 491–496. [Google Scholar] [CrossRef]
- Jefferson, Y. Facial Beauty—Establishing a Universal Standard. Int. J. Orthod. Milwaukee 2004, 15, 9–22. [Google Scholar]
- Holland, E. Marquardt’s Phi Mask: Pitfalls of Relying on Fashion Models and the Golden Ratio to Describe a Beautiful Face. Aesthetic Plast. Surg. 2008, 32, 200–208. [Google Scholar] [CrossRef]
- Krauss, P.; Maier, A. Will We Ever Have Conscious Machines? Front. Comput. Neurosci. 2020, 14. [Google Scholar] [CrossRef] [PubMed]
- Kuzovkin, I.; Vicente, R.; Petton, M.; Lachaux, J.-P.; Baciu, M.; Kahane, P.; Rheims, S.; Vidal, J.R.; Aru, J. Activations of Deep Convolutional Neural Networks Are Aligned with Gamma Band Activity of Human Visual Cortex. Commun. Biol. 2018, 1, 107. [Google Scholar] [CrossRef] [PubMed]
- Bougourzi, F.; Dornaika, F.; Taleb-Ahmed, A. Deep Learning Based Face Beauty Prediction via Dynamic Robust Losses and Ensemble Regression. Knowl.-Based Syst. 2022, 242, 108246. [Google Scholar] [CrossRef]
- Savage, N. How AI and Neuroscience Drive Each Other Forwards. Nature 2019, 571, S15–S17. [Google Scholar] [CrossRef] [PubMed]
- Sano, T. Visualization of Facial Attractiveness Factors Using Gradient-weighted Class Activation Mapping to Understand the Connection between Facial Features and Perception of Attractiveness. Int. J. Affect. Eng. 2022, 21, 111–116. [Google Scholar] [CrossRef]
- Zhang, L.; Zhang, D.; Sun, M.-M.; Chen, F.-M. Facial Beauty Analysis Based on Geometric Feature: Toward Attractiveness Assessment Application. Expert Syst. Appl. 2017, 82, 252–265. [Google Scholar] [CrossRef]
- Gunes, H.; Piccardi, M. Assessing Facial Beauty through Proportion Analysis by Image Processing and Supervised Learning. Int. J. Hum. Comput. Stud. 2006, 64, 1184–1199. [Google Scholar] [CrossRef]
- Chen, F.; Zhang, D. A Benchmark for Geometric Facial Beauty Study. In Lecture Notes in Computer Science; Springer: Berlin/Heidelberg, Germany, 2010; pp. 21–32. [Google Scholar]
- Fan, J.; Chau, K.P.; Wan, X.; Zhai, L.; Lau, E. Prediction of Facial Attractiveness from Facial Proportions. Pattern Recognit. 2012, 45, 2326–2334. [Google Scholar] [CrossRef]
- Xu, J.; Jin, L.; Liang, L.; Feng, Z.; Xie, D. A New Humanlike Facial Attractiveness Predictor with Cascaded Fine-Tuning Deep Learning Model. arXiv 2015, arXiv:1511.02465. [Google Scholar]
- Zhang, D.; Chen, F.; Xu, Y. Computer Models for Facial Beauty Analysis; Springer International Publishing: Cham, Switzerland, 2016; pp. 143–163. [Google Scholar] [CrossRef]
- Liang, L.; Lin, L.; Jin, L.; Xie, D.; Li, M. SCUT-FBP5500: A Diverse Benchmark Dataset for Multi-Paradigm Facial Beauty Prediction. In Proceedings of the 2018 24th International Conference on Pattern Recognition (ICPR), Beijing, China, 20–24 August 2018; pp. 1598–1603. [Google Scholar]
- Lebedeva, I.; Guo, Y.; Ying, F. Transfer Learning Adaptive Facial Attractiveness Assessment. J. Phys. Conf. Ser. 2021, 1922, 012004. [Google Scholar] [CrossRef]
- Selvaraju, R.R.; Cogswell, M.; Das, A.; Vedantam, R.; Parikh, D.; Batra, D. Grad-CAM: Visual Explanations from Deep Networks via Gradient-Based Localization. Int. J. Comput. Vis. 2020, 128, 336–359. [Google Scholar] [CrossRef]
- Feng, G.; Lei, J. The Effect of Odor Valence on Facial Attractiveness Judgment: A Preliminary Experiment. Brain Sci. 2022, 12, 665. [Google Scholar] [CrossRef] [PubMed]
- He, D.; Workman, C.I.; He, X.; Chatterje, A. What Is Good Is Beautiful (and What Isn’t, Isn’t): How Moral Character Affects Perceived Facial Attractiveness. Psychol. Aesthet. Creat. Arts 2022. [CrossRef]
- Shahhosseini, M.; Hu, G.; Pham, H. Optimizing Ensemble Weights and Hyperparameters of Machine Learning Models for Regression Problems. Mach. Learn. Appl. 2022, 7, 100251. [Google Scholar] [CrossRef]
- Sun, J.; Li, H. Listed Companies’ Financial Distress Prediction Based on Weighted Majority Voting Combination of Multiple Classifiers. Expert Syst. Appl. 2008, 35, 818–827. [Google Scholar] [CrossRef]
- Huang, G.; Li, Y.; Pleiss, G.; Liu, Z.; Hopcroft, J.E.; Weinberger, K.Q. Snapshot Ensembles: Train 1, Get M for Free. arXiv 2017, arXiv:1704.00109. [Google Scholar]
- Perrone, M.P.; Cooper, L.N.; National Science Foundation U.S. When Networks Disagree: Ensemble Methods for Hybrid Neural Networks; U.S. Army Research Office: Research Triangle Park, NC, USA, 1992. [Google Scholar]
- Boyd, S. Convex Optimization; Cambridge University Press: Cambridge, UK, 2004. [Google Scholar]
- Liang, G.; Zhang, Y.; Wang, X.; Jacobs, N. Improved Trainable Calibration Method for Neural Networks on Medical Imaging Classification. arXiv 2020, arXiv:2009.04057. [Google Scholar]
- Küppers, F.; Kronenberger, J.; Schneider, J.; Haselhoff, A. Bayesian Confidence Calibration for Epistemic Uncertainty Modelling. In Proceedings of the 2021 IEEE Intelligent Vehicles Symposium (IV), Nagoya, Japan, 11–17 July 2021; pp. 466–472. [Google Scholar] [CrossRef]
- Guo, C.; Pleiss, G.; Sun, Y.; Weinberger, K.Q. On Calibration of Modern Neural Networks. In Proceedings of the 34th International Conference on Machine Learning, PMLR, Sydney, Australia, 6–11 August 2017; Volume 70, pp. 1321–1330. [Google Scholar] [CrossRef]
- Kauffmann, J.; Müller, K.-R.; Montavon, G. Towards Explaining Anomalies: A Deep Taylor Decomposition of One-Class Models. Pattern Recognit. 2020, 101, 107198. [Google Scholar] [CrossRef]
- Dyrba, M.; Pallath, A.H.; Marzban, E.N. Comparison of CNN Visualization Methods to Aid Model Interpretability for Detecting Alzheimer’s Disease. In Informatik Aktuell; Springer Fachmedien Wiesbaden: Wiesbaden, Germany, 2020; pp. 307–312. [Google Scholar]
- Bach, S.; Binder, A.; Montavon, G.; Klauschen, F.; Müller, K.-R.; Samek, W. On Pixel-Wise Explanations for Non-Linear Classifier Decisions by Layer-Wise Relevance Propagation. PLoS ONE 2015, 10, e0130140. [Google Scholar] [CrossRef]
- Ribeiro, M.T.; Singh, S.; Guestrin, C. “Why Should I Trust You? In ” Explaining the Predictions of Any Classifier. In Proceedings of the 22nd ACM SIGKDD International Conference on Knowledge Discovery and Data Mining, San Francisco, CA, USA, 13–17 August 2016; pp. 1135–1144. [Google Scholar] [CrossRef]
- Zhao, X.; Huang, W.; Huang, X.; Robu, V.; Flynn, D. BayLIME: Bayesian Local Interpretable Model-Agnostic Explanations. In Proceedings of the Uncertainty in Artificial Intelligence, PMLR, Virtual Event, 7–8 April 2022; pp. 887–896. [Google Scholar]
- Fel, T.; Cadène, R.; Chalvidal, M.; Cord, M.; Vigouroux, D.; Serre, T. Look at the Variance! Efficient Black-Box Explanations with Sobol-Based Sensitivity Analysis. Adv. Neural Inf. Process Syst. 2021, 34. [Google Scholar] [CrossRef]
- Suzuki, S.; Abe, K. Topological Structural Analysis of Digitized Binary Images by Border Following. Comput. Vis. Graph. Image Process. 1985, 29, 396. [Google Scholar] [CrossRef]
- Weisstein, E.W. Golden Ratio. Available online: https://mathworld.wolfram.com/GoldenRatio.html (accessed on 29 October 2020).
- Hossin, M.; Sulaiman, M.N. A Review on Evaluation Metrics for Data Classification Evaluations. Int. J. Data Min. Knowl. Manag. Process 2015, 5. [Google Scholar] [CrossRef]
- Linacre, J.M.; Rasch, G. The expected value of a point-biserial (or similar) correlation. Rasch Meas. Trans. 2008, 22, 1154. [Google Scholar]
- Chicco, D.; Jurman, G. The Advantages of the Matthews Correlation Coefficient (MCC) over F1 Score and Accuracy in Binary Classification Evaluation. BMC Genom. 2020, 21, 6. [Google Scholar] [CrossRef]
- Xie, S.; Girshick, R.; Dollár, P.; Tu, Z.; He, K. Aggregated residual transformations for deep neural networks. In Proceedings of the IEEE Conference on Computer Vision and Pattern Recognition, Honolulu, HI, USA, 21–26 July 2017. [Google Scholar] [CrossRef]
- Hu, J.; Shen, L.; Sun, G. Squeeze-And-Excitation Networks. In Proceedings of the IEEE Conference on Computer Vision and Pattern Recognition, Salt Lake City, UT, USA, 18–23 June 2018; pp. 7132–7141. [Google Scholar] [CrossRef]
- Parkhi, O.M.; Vedaldi, A.; Zisserman, A. Deep Face Recognition. In Proceedings of the British Machine Vision Conference (BMVC), Swansea, UK, 7–11 September 2015. [Google Scholar] [CrossRef]
- Zhang, P.; Chen, Y.; Zhu, Y.; Wang, H. Eye Region as a Predictor of Holistic Facial Aesthetic Judgment: An Eventrelated Potential Study. Soc. Behav. Pers. 2021, 49. [Google Scholar] [CrossRef]
- Lan, M.; Peng, M.; Zhao, X.; Li, H.; Yang, J. Neural Processing of the Physical Attractiveness Stereotype: Ugliness Is Bad vs. Beauty Is Good. Neuropsychologia 2021, 155, 107824. [Google Scholar] [CrossRef]
Disclaimer/Publisher’s Note: The statements, opinions and data contained in all publications are solely those of the individual author(s) and contributor(s) and not of MDPI and/or the editor(s). MDPI and/or the editor(s) disclaim responsibility for any injury to people or property resulting from any ideas, methods, instructions or products referred to in the content. |
© 2022 by the authors. Licensee MDPI, Basel, Switzerland. This article is an open access article distributed under the terms and conditions of the Creative Commons Attribution (CC BY) license (https://creativecommons.org/licenses/by/4.0/).


