Abstract
Recently, human activity recognition (HAR) techniques have made remarkable developments in the field of machine learning. In this paper, we classify human gestures using data collected from a curved piezoelectric sensor, including elbow movement, wrist turning, wrist bending, coughing, and neck bending. The classification process relies on data collected from a sensor. Machine learning algorithms enabled with K-mer are developed and optimized to perform human gesture recognition (HGR) from the acquired data to achieve the best results. Three machine learning algorithms, namely support vector machine (SVM), random forest (RF), and k-nearest neighbor (k-NN), are performed and analyzed with K-mer. The input parameters such as subsequence length (K), number of cuts, penalty parameter (C), number of trees (n_estimators), maximum depth of the tree (max_depth), and nearest neighbors (k) for the three machine learning algorithms are modified and analyzed for classification accuracy. The proposed model was evaluated using its accuracy percentage, recall score, precision score, and F-score value. We achieve promising results with accuracy of 94.11 ± 0.3%, 97.18 ± 0.4%, and 96.90 ± 0.5% for SVM, RF, and k-NN, respectively. The execution time to run the program with optimal parameters is 19.395 ± 1 s, 5.941 ± 1 s, and 3.832 ± 1 s for SVM, RF, and k-NN, respectively.
1. Introduction
Human activity recognition (HAR), which recognizes human actions such as walking, and sitting/lying, has sparked a lot of interest in mobile computing. Consequently, a significant amount of work is being done to analyze the information gathered from the sensors of cell phones [1,2]. The HAR is classified into two types: video-based HAR and sensor-based HAR. Video-based HAR examines videos or images from the camera that contain human motions [3,4,5], whereas sensor-based HAR examines motion data from smart sensors such as an accelerometer, gyroscope, and sound sensors [6,7,8]. In recent years, sensor technologies have seen significant advantages, particularly low power, low cost, high capacity, compact sensors, wired and wireless communication networks, and data processing methods [9,10]. Human activities are classified using various sensors. Accelerometers and gyroscopes are the two most commonly used sensors for HAR. An accelerometer is an electrical sensor that measures the acceleration forces acting on an object to calculate its position in space and track its movement. A gyroscope is a device that determines and maintains the orientation and angular velocity of an object. These two sensors, which are commonly obtained in smartphones, were used to gather data for HAR. According to the methodology, one or more sensors can be positioned in various body parts to collect the data. The positioning of wearable sensors directly impacts the monitoring of physiological movements. Sensors are often positioned on the chest, lower back, and waist. Machine learning algorithms then analyze these sensor data to recognize human activities.
In the past decades, several researchers have surveyed HAR [11,12]. For instance, the activities may include walking, running, exercising, etc. The activities may be categorized into three main classes based on their length and complexity: short activities, basic activities, and complicated activities. Activities with very short duration, such as standing up from a sitting position and human gestures, are included in the category of short activities. The basic activities include walking, running, and walking upstairs. The complicated activities are the combinations of fundamental activity progressions and interaction with other things and persons. It is important to note that these three activities have produced a different pattern. However, some research has produced better results for short and basic activities using a single triaxial accelerometer and gyroscope based on their used method and how many sensors they employed. In this paper, we focus on recognizing some short activities based on data collected from a curved piezoelectric sensor. The huge amount of sensor data cannot be easily analyzed without the help of a machine-learning algorithm. Machine learning is the most effective approach for entering a huge amount of data and classifying them, and it can easily identify the patterns present in the data and classify them based on the pattern. Meanwhile, with the fast development of wearable sensor technologies, high-accuracy data classification is required and increasing exponentially. Machine learning algorithms are also used in wearable sensors with an activity recognition element that captures various activities for health monitoring. Several machine learning algorithms were fed on collected data and their results were compared.
Machine learning algorithms such as SVM [13], RF [14], Markov model [15], and k-NN [16] have been used for a while to tackle the HAR problem. SVM chooses the extreme points/vectors that help in creating the hyperplane. These extreme cases are called support vectors, and hence the algorithm is termed SVM. Technically, the primary objective of the SVM algorithm is to find a hyperplane that discriminates data points of different classes. Depending on which side of the hyperplane a data point falls, it might belong to a different class. The amount of input characteristics in the dataset determines the hyperplane’s dimension. A random forest algorithm is composed of a set of decision trees, and each tree in the ensemble consists of a data sample taken from the training set with a replacement called a bootstrap sample. The term “bootstrap” refers to “re-sampling the original data to build new data in a proper and repeatable manner.” The idea of RF method is to merge many “weak learners” to create a more robust model i.e., “strong learner”. k-NN is used for both regression and classification, by computing the distance between the test data and all of the training sets, k-NN may identify the correct class for the test data. The k-NN works like a lazy learning algorithm; it only stores the data of the training part. The saved data are to be used to evaluate new search data.
K-mers are often used in bioinformatics to control the quality of generated sequences [17], classify metagenomics [18], and estimate genome size [19]. Haodong yan et al. [20] developed a method called DeepTE that uses CNNs to classify unknown transposable elements. K-mer counts were implemented by DeepTE to transfer sequences into input vectors and can be identified domains inside TEs to correct misclassification. F.P. Breitwieser et al. [18] present an approach that integrates fast K-mer-based classification with an effective algorithm for calculating the number of distinct K-mers present in each species in metagenomics samples. They demonstrated that applying distinct K-mer counts improves species identification accuracy and that K-mer counts seem to be very effective for detecting false positives. Machine learning approaches with K-mer have recently been found to perform better on pattern recognition problems [21,22,23,24]. These methods are created by extracting the frequency of fixed-length k from DNA sequences. This research will focus on combining the K-mer frequencies with certain supervised machine-learning algorithms to enhance efficiency. We believe that integrating K-mer with machine learning algorithms will increase the classification accuracy of the sensor data.
In this paper, we introduce machine learning algorithms enabled with K-mer. For human gesture recognition (HGR), such as elbow movement, wrist turning, wrist bending, coughing, and neck bending, we used a curved piezoelectric sensor to collect the data. Each human gesture exhibits a different pattern in the sensor signals. Further, the collected sensor data from human gestures were analyzed and performed to investigate the pattern’s recognition. Our aims were
- (i).
- To determine whether our sensor could be used to classify human gestures.
- (ii).
- To develop various machine learning algorithms with K-mer frequencies and modify the input parameters, then compare the performance of each classifier.
- (iii).
- Based on the classification performance, choose the best parameter combination for high accuracy and sensor data classification.
The structure of the paper is as follows. Section 2 provides information about the related studies. The procedure for data collection and processing is described in Section 3, while Section 4 shows the results of various machine-learning approaches with varying parameters for gesture detection and classification. Section 5 represents the performance and accuracy of the model. Section 6 concludes the article.
2. Related Work
Serkan Ball et al. [25] developed a method that combines principal component analysis (PCA) and machine learning algorithms (RF, SVM, C4.5, and k-NN) and compared their performances. The combination of PCA and RF provides an effective clustering feature extraction approach as well as better classification accuracy. The PCA approach was used to reduce the dimensionality of features, to improve an RF classifier’s classification performance, and reduce the variance of features in datasets.
Nadeem Ahmed et al. [26] developed a hybrid feature selection approach that employs a filter and wrapper method. The process uses SFFS (sequential floating forward search) to extract desirable features for enhanced activity recognition. Features are then fed to a multiclass support vector machine (SVM) to create nonlinear classifiers using the kernel method for training and testing purposes.
Enda Wista Sinuraya et al. [27] used ensemble empirical mode decomposition (EEMD) and Hilbert–Huang transform (HHT) process to enhance the feature extraction approach. This technique applies a nonlinear approach in the frequency domain. The data were classified using SVM, Naive Bayes, and RF. The RF classifier produced the best accuracy compared to others.
B Vidhya et al. [28] presented a wearable multi-sensor HAR system using discrete wavelet transform (DWT), and empirical mode decomposition (EMD) approaches for feature vector extraction. The four machine learning algorithms, namely SVM, KNN, ensemble classifier (EC), and decision tree (DT), were trained to identify a variety of human activities using the discriminative statistical data from DWT along with the entropy features from EMD.
Ashhim et al. [1] created prediction models using sample data provided by smartphone sensors and supervised machine learning techniques. The logistic regression technique achieved the best classification rate in their experiment, which was 95.995%.
Ahmad Jalal et al. [29] proposed a method for recognizing human activities in the video using skeletal joints. The depth camera was used to collect data and train the hidden Markov models for each activity. Their experimental results showed better performance, with mean recognition rates of 93.58%.
Akram Bayat et al. [30] proposed SVM, MLP, random forest, and a combination of classifiers. They got a best accuracy of 91.15%.
Lu xu et al. [31] employed the RF model for recognizing human activity in which accelerometer data from a wearable device are gathered and utilized as input data. The RF model for human activity recognition was constructed, and the algorithm was designed and analyzed. They achieved an overall accuracy of 90%.
Song-Mi Lee et al. [32] provided a 1D CNN-based technique for identifying human activity using triaxial accelerometer data collected from a smartphone. The acceleration values for 3 axes are converted into vector magnitude data and employed as input for 1D learning CNN. The accuracy of their 1D CNN-based technique was 92.71%.
Zong Liu et al. [33] developed an effective approach called reduced kernel k-nearest neighbors. The k-NN model is modified in this work to improve the classification accuracy. The input data are transformed into high-dimensional features using the kernel approach, which significantly improves the classification performance. Human activity data accuracy is 91.60% for the human activities and postural transitions dataset (HAPT) and 92.67% for smartphones.
Agus Eko Minatno at el. [34] used a public HAR dataset with static and dynamic activities. A smartphone with 563 features, 561 of which were selected, the accelerometer and gyroscope sensor embedded with a smartphone is used to retrieve data. They used various machine learning algorithms for HAR, such as logistic regression, decision tree, RF, SVM, and k-NN. The accuracy of 98.96% was achieved by SVM with RBF kernel.
Michele Alessandrini et al. [35] used accelerometer and PPG sensor data from a publicly accessible data collection and constructed an RNN for the detection of human activity. The RNN was subsequently transferred to an embedded system based on an STM32 microcontroller, using a particular toolkit for porting the network model to a specific architecture. The results indicate that the classification of test data is achieved with an accuracy of more than 95%.
Lin-Tao Duan et al. [36] built a motion tracker using two motion sensors to capture five types of limb activity. The fast Fourier transform was employed to separate the motion features from the frequency domain of the sensor data and choose a subset of the features as a feature vector. Three supervised algorithms such as naive Bayes (NB), k-nearest neighbor (k-NN), and artificial neural networks (ANNs) were used to classify the human lower limb movements with a recognition rate of 97.01%, 96.12%, and 98.21%.
Yu-Ta Yao et al. [22] developed K-mer-based pattern recognition (KPR) for keyboard inspection. This paper analyzed the image patterns and classified them based on the K-mer frequency. Based on the K-mer frequencies, KPR was applied to encrypt the image patterns of the light-emitting letters on the keyboard.
Yu-Ta Yao et al. [24] proposed a novel way to enhance the efficiency of finding KPR parameters through a two-stage multi-fidelity design optimization. As a result, the proposed strategy method was more efficient than finding the best design parameters based on the entire range of input images.
3. Experimental Section
This part shows how to implement machine-learning algorithms for human gesture classification using sensor data. We must first get the data, and after that, we carry out the data analysis to identify informative features. Finally, we train a model using this data based on the chosen features and validate it.
Data Collection
Human activities can be classified into various types, ranging from simple acts such as hand gestures to complicated group activities based on the difficulty level and duration of the activity. A gesture is a simple movement of the hands or other parts of the human body, such as hand-waving, head-shaking, etc. A gesture is often performed in a short period. The data were collected from a curved piezoelectric sensor for five distinct labeled activities at a consistent frequency. The five different labels were elbow movement, wrist turning, wrist bending, coughing, and neck bending. It should be noted that the data used for this work do not have the same number of samples for training and testing various activities. Some activities have a huge amount of data, whereas others have a limited amount of data.
The proposed method consists of three major parts: sensor data collection, implementation of K-mer frequency, and pattern recognition. Sensor data are collected through basic human gestures. For this study, a piezoelectric curved sensor was used for data collection. In the second part, we implement the machine learning models embedded with K-mer, which cuts the signal into several parts along with the subsequence length of K to analyze the data. Finally, recognition is a process of finding similarities or patterns in data using the machine learning method and classifying the data based on their pattern. Figure 1 shows the schematic diagram of the data collection and extraction.
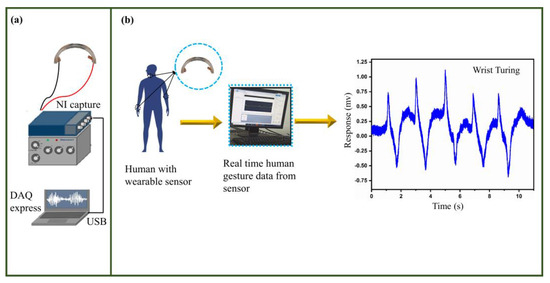
Figure 1.
Schematic of the data collection. (a) Experimental setup of the sensor. (b) Data collection and extraction from the sensor.
The proposed models were trained and cross-validated using the Python programming language built-in Anaconda package (open-source), which includes important programs such as csv, matplotlib, numpy, and StratifiedKFold (“sklearn.ensemble. SVM, RF, and k-NN classifier”). The most significant of the selected parameters were penalty coefficient (C) used in SVM, number of trees (n_estimators), maximum depth of the tree (max_depth) used in the RF model, and nearest neighbor (k) used in k-NN. All of these parameters were optimized to increase the classification accuracy. Figure 2 explains the details of our proposed model, such as how it works and how we can change the hyperparameter values.
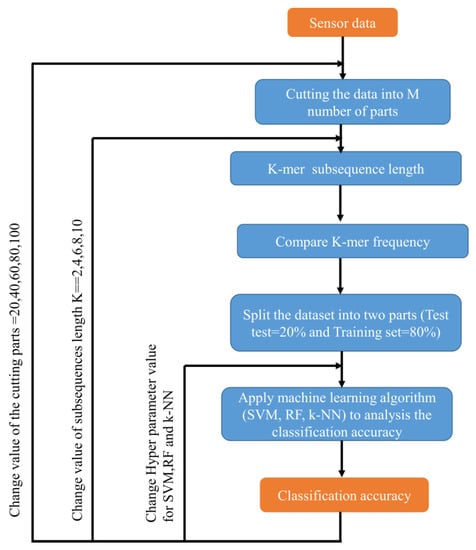
Figure 2.
Flowchart of the proposed model.
4. Results
K-mers are substrings of length k contained within a biological sequence in bioinformatics. Herein, we developed machine learning models embedded with K-mer for signal classification based on pattern recognition. For example, if we choose a K-mer subsequences length of 4 and slide it from left to right, switching one character at a time, the length of the DNA sequence is L; then, we obtain L – K + 1 K-mers. Binarization is the method to reduce unnecessary data, and we adopted this binarization method to convert the signal data into 0 and 1. The binarized data are then extracted using K-mer frequency analysis and examine the accuracy of the results. Figure 3 shows the schematic diagram of K-mer-based signal encoding process.
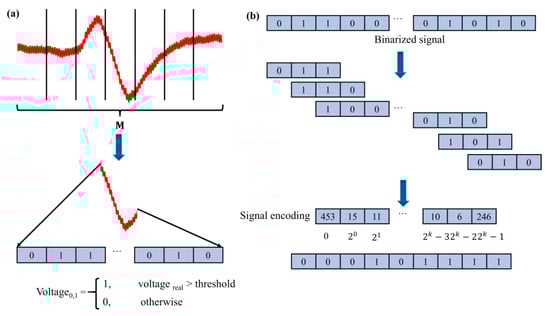
Figure 3.
Schematic diagram of K-mer-based signal encoding process. (a) Signal binarization. (b) K-mer signal encoding.
We started the data processing with SVM, RF, and k-NN through K-mer frequency analysis. Herein, we cut the data into several parts, such as 20, 40, 60, 80, and 100, to increase the input samples. Different subsequence lengths, such as 2, 4, 6, 8, and 10, were employed to analyze the data. Then, we run the proposed algorithms with different combinations of input parameter values and analyzed their classification accuracy. The algorithms in machine learning must be trained to update each model parameter. Consequently, it is essential to import the test set and training set. In this work, the k-fold cross-validation method was used to evaluate the classification accuracy of the proposed model. In this approach, k determines how many times the dataset will be split. In most cases, the value of k = 10. (In detail, the dataset is divided into k equal samples, in which the first sample is used as a test set and the remaining (K − 1) are training sets (20% was used for test data, and 80% was used for training data, i.e., a test-train split of 20–80). Figure 4 depicts the schematic diagram of 10-fold cross-validation. Table 1 shows the accuracy of the 10-fold cross-validation for each fold.
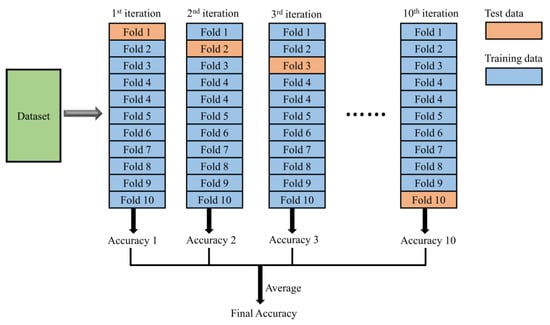
Figure 4.
Schematic diagram of 10-fold cross-validation.

Table 1.
Accuracy percentage 10-fold cross-validation for each fold.
SVM is a supervised machine learning technique that builds a hyperplane with the maximum possible margin to classify the data [37]. A kernel function might be introduced to project the data into a higher dimension to make the data linearly separable. The penalty coefficient (C) is a parameter used to tune the SVM accuracy. There is no rule for selecting a C value; it depends entirely on testing data. We used different C values and selected the value which gave the best classification accuracy. Initially, we selected a value of C = 0.01, which provides very low accuracy of results, while increasing the C value from 0.01 to 0.1, 1, 10, the accuracy was also increased. Finally, 94.11 ± 0.3% of the accuracy result was achieved at the value of C = 10. The average precision, recall, and F-score values for K-mer-based SVM were 0.941 ± 0.003, 0.941 ± 0.003, and 0.941 ± 0.003. Figure 5 shows the accuracy results for the K-mer-based SVM model with the various numbers of cuts, different subsequence lengths, and different C values.
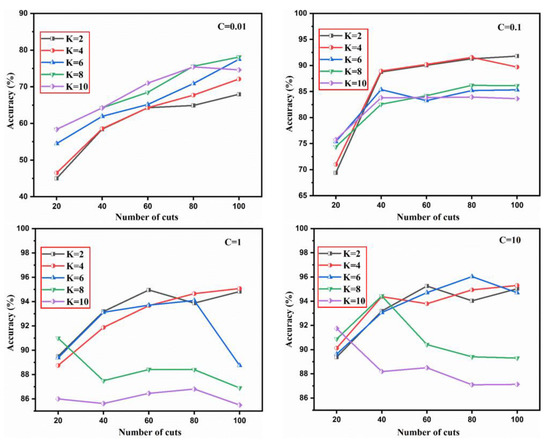
Figure 5.
Accuracy percentage achieved with K-mer-based SVM model with different parameters.
The RF method is made up of a group of trees, each of which is built using randomly collected data with the same statistical distribution as the trees in the forest [38]. Voting is often used to decide class labels in the forest tree for classification. We used the different n_estimators values (20, 40, 60, 80, 100) and max_depth values (10, 20, 30, 40, 50) to determine which gives the best classification accuracy. Finally, 97.18 ± 0.4% of the accuracy result was achieved at n_estimators = 100 and max_depth = 50. The average precision, recall, and F-score value for the K-mer-based RF model were 0.9718 ± 0.004, 0.9718 ± 0.004, and 0.9718 ± 0.004. Figure 6 shows the accuracy results for the K-mer-based RF model with various numbers of cuts, different subsequence lengths, various n_estimators, and max_depth values.
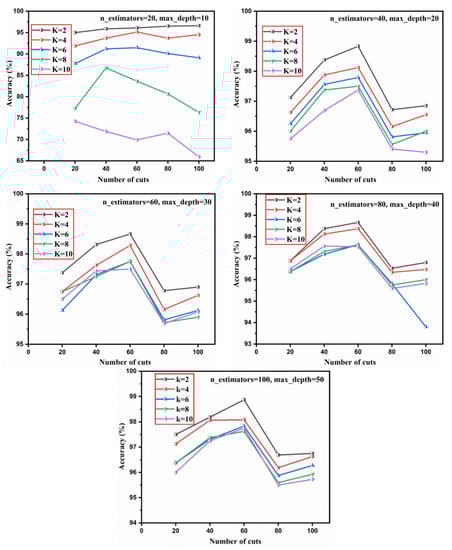
Figure 6.
Accuracy percentage achieved with K-mer-based RF model with different parameters.
k-NN classifies the new dataset into a class that closely resembles the current data by comparing it to the existing dataset [39]. The k-NN uses the concept of similarity between the training set and new data to classify the data. The k-NN algorithm stores all existing data and identifies new data points based on similarities. We used K values of 1, 3, 5, 7, 9, and 10 to determine the best classification accuracy. Finally, 96.90 ± 0.5% of the accuracy result was achieved at the value of K = 1. The average precision, recall, and F-score value for the K-mer-based k-NN model were 0.969 ± 0.005, 0.969 ± 0.005, and 0.969 ± 0.005. Figure 7 shows the accuracy results for the K-mer-based k-NN model with the various number of cuts, different subsequence lengths, and different k values. We used the public domain dataset [40], including running and walking, and analyzed its classification performance with our algorithms that provide better accuracy results of 91.62 ± 0.4%, 91.85 ± 0.4%, and 92.45 ± 0.5% for SVM, RF, and k-NN. Moreover, to test its robustness, we used the ECG detector data [41] from the public domain, combined it with our sensor dataset, and analyzed its classification performance. We achieved promising results with accuracy of 95.41 ± 0.5%, 98.01 ± 0.3%, and 98.12 ± 0.4% for SVM, RF, and k-NN, respectively. Table 2 provides the best classification performance parameters used for the final models and accuracy analysis of the machine learning algorithms with and without the subsequence length. Furthermore, Table 3 shows a comparative analysis of HAR using various machine learning algorithms.
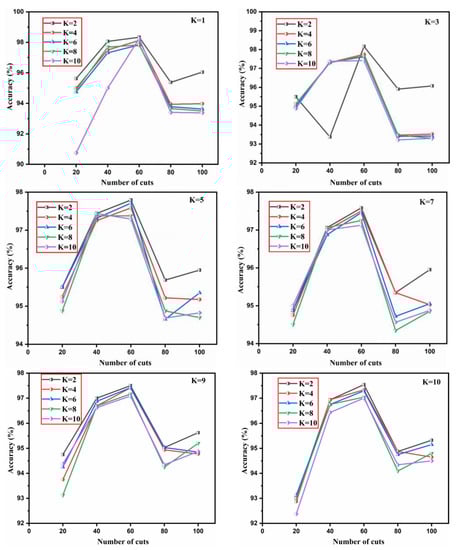
Figure 7.
Accuracy percentage achieved with K-mer-based k-NN model with different parameters.
Table 2.
Best classification performance parameters used for final models and accuracy analysis with and without the subsequence length.
Table 3.
Comparison analysis of HAR using various machine learning algorithms.
5. Discussion
Recognition of Human Gestures
The piezoelectric sensor is very sensitive to the recognition of human gestures. The working mechanism of the piezoelectric sensor is simple: when an external stimulus acts on the sensor, the entire crystal structure of the sensor component is deformed, which produces a high potential difference. For example, the sensor was mounted to a human hand wrist to identify the signal response about its bending condition. With a sudden motion during a downward, the static tensile strain was exerted on the sensor resulting in the voltage increased overall, and it was recovered by straightening the wrist to its original position. Figure 8 shows the sensor signal recorded from various human gestures.
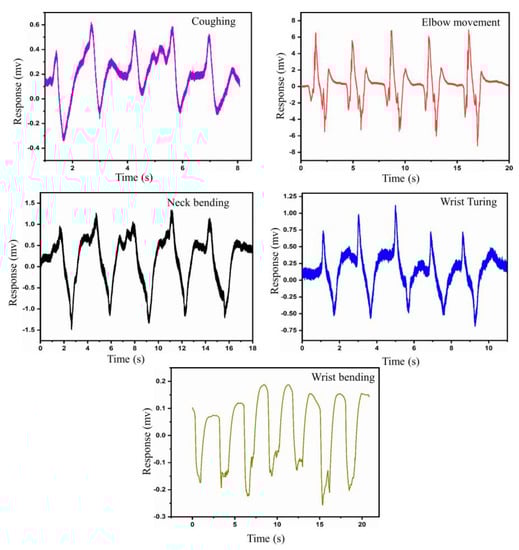
Figure 8.
Signal recorded from various human gestures.
In human gesture recognition, we have a different set of data for each gesture. Some gestures have a huge amount of data, whereas others have a limited amount of data. In order to increase the input sample, we randomly cut the data into several parts. For example, if we cut one sample into 100 parts, then one sample was increased to 100 samples, and this is the better way to increase the input sample and analyze it. Table 4 provides detailed information about the dataset after several cuts.
Table 4.
Detail information about the dataset after several cuts.
The confusion matrix depicts the accuracy of the classifier by comparing the true and predicted labels. A predicted label is associated with each row, and a true label is associated with each column, of the matrix. A confusion matrix contains true negative (TN), true positive (TP), false negative (FN), and false positive (FP). A good model is one with low FP and FN rates and high TP and TN rates. When working with an unbalanced dataset, we cannot rely on a single value of accuracy in classification. In unbalanced datasets, the accuracy is skewed in favor of the majority classes. The class proportions in our data are not well balanced since the number of transitional activities samples is too small. Thus, it is typically better to use F-score, precision, and recall value to analyze the data. Figure 9 depicts the precision, recall, and F-score value for all methods. The number of accurate and inaccurate predictions made by a classifier are presented in a confusion matrix. It may be used to evaluate the efficiency of a classification model by calculating performance indicators such as accuracy, precision, recall, and F-score through the following Equations (1)–(4).
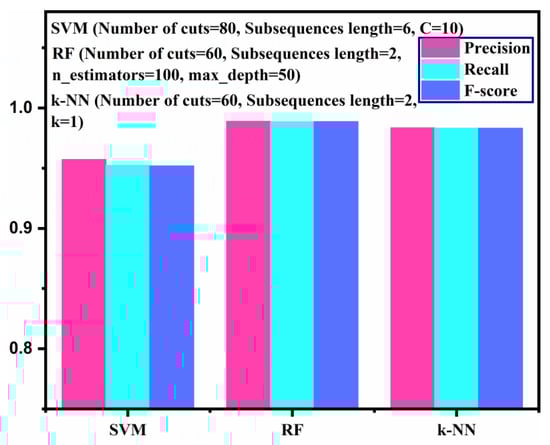
Figure 9.
Precision, recall, and F-score results for K-mer-based machine learning algorithms.
- True positive (TP)—The model correctly predicts the positive class (predicted label and true label both are positive).
- True negative (TN)—The model correctly predicts the negative class (predicted label and true label both are negative).
- False positive (FP)—The model incorrectly predicts the negative class (predicted label—positive, true label—negative).
- False negative (FN)—The model incorrectly predicts the positive class (predicted label—negative, true label—positive).
Herein, we can run one program for all three proposed models to find the optimal parameter value. The processing time to run the program for all the models together is shown in Table 5. The parameters chosen for the execution time were the number of cuts = 60, subsequence length = 2, C = 10, n_estimators = 100, max_depth = 50, and k = 1. The processing time was increased by increasing the number of cuts, i.e., input samples and subsequence length. The execution time for a program with a confusion matrix takes approximately 5 s more compared to a program without a confusion matrix. For example, if we run the program one by one for all the models with a confusion matrix, the SVM takes 5.258 s, RF takes 5.941 s, and the k-NN takes 3.832 s. The total execution time is 15.024 s. However, we run one program for all the models, which takes only 10.387 s. The time difference is almost 4.637 s (1.446%). Meanwhile, if we go for 100 cuts and a subsequence length of 9, the SVM model takes 193.707 s, the RF model takes 203.892 s, and the k-NN model takes 204.584 s, respectively. The total execution time is 602.183 s. The time difference is almost 178.741 s (3.369%). Finally, to find the optimal parameter value, we can effectively run one program for all models with less execution time instead of running the program for each model separately. A general observation from our analysis is when the number of samples and subsequences length increased, the computation time also increased. Thus, the K-mer length has a significant impact on program execution time. The computer specification used for our proposed algorithms were processor—Intel(R) Core(TM) i7-8700K CPU @ 3.70GHz, 3696Mhz 6 Core(s), installed RAM—16.0 GB, system type–64-bit operating system, x64-based processor.
Table 5.
Program processing time for the K-mer-based machine learning models.
Table 6 presents the confusion matrices of K-mer-based SVM with 80 number of cuts and a subsequence length of 6. It shows that “coughing” has 72 samples, “elbow movements” has 32 samples, “neck bending” has 32 samples, “wrist bending” has 144 samples, and “wrist turning” has 40 samples. In the SVM model, the “neck bending” has a total of 32 samples, out of which 14 sample is classified as “wrist bending”. The execution time to run the program for SVM is 19.395 ± 1 s. Table 7 presents the confusion matrices of K-mer-based RF with 60 number of cuts and a subsequence length of 2. It shows that “coughing” has 54 samples, “elbow movements” has 24 samples, “neck bending” has 24 samples, “wrist bending” has 108 samples, and “wrist turning” has 30 samples. Due to the different number of cuts, the algorithm generated a different number of samples. The RF model predicts all the labels correctly without any bias. The execution time to run the program for RF is 5.941 ± 1 s. The execution time to run the program for k-NN is 3.832 ± 1 s. Table 8 presents the confusion matrices of the K-mer-based k-NN with 60 cuts and a subsequence length of 2. The k-NN model also predicts all the labels correctly without any bias.
Table 6.
Confusion matrix obtained with K-mer-based SVM (number of cuts = 80 and subsequence length = 6).
Table 7.
Confusion matrix obtained with K-mer-based RF (number of cuts = 60 and subsequence length = 2).
Table 8.
Confusion matrix obtained with K-mer-based k-NN (number of cuts = 60 and subsequence length = 2).
6. Conclusions
The primary goal of this work was to develop a trustworthy approach for HGR using wearable sensors. We developed a novel piezoelectric sensor for HGR, such as elbow movement, wrist turning, wrist bending, coughing, and neck bending. The dataset collected from the piezoelectric sensor was used as input for the classifiers. We classified these human gestures using three different machine learning models enabled with K-mer. Fine-tuned machine learning models were executed on the data with different parameters to obtain the best model. The proposed method provided remarkable accuracy results of 94.11 ± 0.3%, 97.18 ± 0.4%, and 96.90 ± 0.5% for SVM, RF, and k-NN. The confusion matrices were performed for the classification of the HGR. Finally, human gestures can be correctly recognized using our proposed model. As a result, we plan to develop a dataset with even more complicated activities in the future and analyze its pattern recognition, and we would like to apply these algorithms to a huge dataset, preferably with different sensor data. Furthermore, future research can focus on developing real-time data classification on different environments and robust human activity recognition systems.
Author Contributions
Conceptualization, P.T.L.; methodology, P.T.L. and W.-S.H.; software, S.S. and C.-H.Y.; formal analysis, S.S., C.-H.Y. and T.-H.H.; investigation, P.T.L., W.-S.H. and C.-Y.C.; writing—original draft preparation, S.S.; writing—review and editing, P.T.L. and B.P.; visualization, S.S. and P.T.L.; supervision, P.T.L., W.-S.H., C.-Y.C. and Y.-W.W.; project administration, P.T.L.; funding acquisition, P.T.L. All authors have read and agreed to the published version of the manuscript.
Funding
This research was funded by National Science and Technology Council (NSTC), Taiwan (grant numbers MOST 111-2811-E-011-007-MY3 and MOST 111-2221-E-011-102) and Taipei Medical University-National Taiwan University of Science and Technology Joint Research Program (grant number TMU-NTUST-108-08) are appreciated.
Data Availability Statement
The data presented in this study are available on request from the corresponding author. The data are not publicly available due to privacy.
Conflicts of Interest
The authors declare no conflict of interest.
References
- Saha, A.; Sharma, T.; Batra, H.; Jain, A.; Pal, V. Human action recognition using smartphone sensors. In Proceedings of the 2020 International Conference on Computational Performance Evaluation (ComPE), Shillong, Meghalaya, India, 2–4 July 2020; pp. 238–243. [Google Scholar]
- Liming, C.; Hoey, J.; Nugent, C.D.; Cook, D.J.; Zhiwen, Y. Sensor-Based Activity Recognition. IEEE Trans. Syst. Man Cybern. Part C Appl. Rev. 2012, 42, 790–808. [Google Scholar] [CrossRef]
- Ke, S.-R.; Thuc, H.; Lee, Y.-J.; Hwang, J.-N.; Yoo, J.-H.; Choi, K.-H. A Review on Video-Based Human Activity Recognition. Computers 2013, 2, 88–131. [Google Scholar] [CrossRef]
- Pareek, P.; Thakkar, A. A survey on video-based Human Action Recognition: Recent updates, datasets, challenges, and applications. Artif. Intell. Rev. 2020, 54, 2259–2322. [Google Scholar] [CrossRef]
- Gharahbagh, A.A.; Hajihashemi, V.; Ferreira, M.C.; Machado, J.J.M.; Tavares, J.M.R.S. Best Frame Selection to Enhance Training Step Efficiency in Video-Based Human Action Recognition. Appl. Sci. 2022, 12, 1830. [Google Scholar] [CrossRef]
- Muralidharan, K.; Ramesh, A.; Rithvik, G.; Prem, S.; Reghunaath, A.A.; Gopinath, M.P. 1D Convolution approach to human activity recognition using sensor data and comparison with machine learning algorithms. Int. J. Cogn. Comput. Eng. 2021, 2, 130–143. [Google Scholar] [CrossRef]
- Ahamed, N.U.; Kobsar, D.; Benson, L.C.; Clermont, C.A.; Osis, S.T.; Ferber, R. Subject-specific and group-based running pattern classification using a single wearable sensor. J. Biomech. 2019, 84, 227–233. [Google Scholar] [CrossRef]
- Zhan, Y.; Kuroda, T. Wearable sensor-based human activity recognition from environmental background sounds. J. Ambient Intell. Humaniz. Comput. 2012, 5, 77–89. [Google Scholar] [CrossRef]
- Pantelopoulos, A.; Bourbakis, N. A survey on wearable biosensor systems for health monitoring. In Proceedings of the 2008 30th Annual International Conference of the IEEE Engineering in Medicine and Biology Society, Vancouver, BC, Canada, 20–24 August 2008; pp. 4887–4890. [Google Scholar]
- Ding, D.; Cooper, R.A.; Pasquina, P.F.; Fici-Pasquina, L. Sensor technology for smart homes. Maturitas 2011, 69, 131–136. [Google Scholar] [CrossRef]
- Lara, O.D.; Labrador, M.A. A survey on human activity recognition using wearable sensors. IEEE Commun. Surv. 2012, 15, 1192–1209. [Google Scholar] [CrossRef]
- Poppe, R. A survey on vision-based human action recognition. Image Vis. Comput. 2010, 28, 976–990. [Google Scholar] [CrossRef]
- Abidine, B.M.h.; Fergani, L.; Fergani, B.; Oussalah, M. The joint use of sequence features combination and modified weighted SVM for improving daily activity recognition. Pattern Anal. Appl. 2016, 21, 119–138. [Google Scholar] [CrossRef]
- Hu, C.; Chen, Y.; Hu, L.; Peng, X. A novel random forests based class incremental learning method for activity recognition. Pattern Recognit. 2018, 78, 277–290. [Google Scholar] [CrossRef]
- Sok, P.; Xiao, T.; Azeze, Y.; Jayaraman, A.; Albert, M.V. Activity Recognition for Incomplete Spinal Cord Injury Subjects Using Hidden Markov Models. IEEE Sens. J. 2018, 18, 6369–6374. [Google Scholar] [CrossRef]
- Mohsen, S.; Elkaseer, A.; Scholz, S.G. Human activity recognition using K-nearest neighbor machine learning algorithm. In Proceedings of the International Conference on Sustainable Design and Manufacturing, Split, Croatia, 15–17 September 2021; pp. 304–313. [Google Scholar]
- Mapleson, D.; Garcia Accinelli, G.; Kettleborough, G.; Wright, J.; Clavijo, B.J. KAT: A K-mer analysis toolkit to quality control NGS datasets and genome assemblies. Bioinformatics 2017, 33, 574–576. [Google Scholar] [CrossRef] [PubMed]
- Breitwieser, F.P.; Baker, D.N.; Salzberg, S.L. KrakenUniq: Confident and fast metagenomics classification using unique k-mer counts. Genome Biol. 2018, 19, 1–10. [Google Scholar] [CrossRef]
- Sun, H.; Ding, J.; Piednoël, M.; Schneeberger, K. findGSE: Estimating genome size variation within human and Arabidopsis using k-mer frequencies. Bioinformatics 2018, 34, 550–557. [Google Scholar] [CrossRef]
- Yan, H.; Bombarely, A.; Li, S. DeepTE: A computational method for de novo classification of transposons with convolutional neural network. Bioinformatics 2020, 36, 4269–4275. [Google Scholar] [CrossRef]
- Yeh, C.-H.; Subburaj, S.; Hung, W.-S.; Chang, C.-Y.; Lin, P.T. Classification of Piezoelectric Signals from PVDF/Graphene Membrane Sensors Using K-mer-based Sensing Recognition (KSR). In Proceedings of the 2020 The 45th National Conference on Theoretical and Applied Mechanics (CTAM 2021), Taipei, Taiwan, 18–19 November 2021; p. 256. [Google Scholar]
- Yao, Y.-T.; Wu, Y.-W.; Lin, P.T. K-mer-based Pattern Recognition (KPR) for the Keyboard Inspection. In Proceedings of the 2020 20th World Congress on Non-Destructive Testing (WCNDT 2020), Seoul, Korea, 8–12 June 2020; pp. A20190276–A20191001. [Google Scholar]
- Yao, Y.-T.; Lin, P.T. Multi-Fidelity Design Optimization for K-mer-based Pattern Recognition (KPR) of Handwritten Characters. In Proceedings of the 2020 Asian Congress of Structural and Multidisciplinary Optimization (ACSMO 2020), Seoul, Korea, 23–25 November 2020; p. P00267. [Google Scholar]
- Yao, Y.-T.; Wu, Y.-W.; Lin, P.T. A two-stage multi-fidelity design optimization for K-mer-based pattern recognition (KPR) in image processing. In Proceedings of the 2020 International Design Engineering Technical Conferences and Computers and Information in Engineering Conference (IDETC/CIE 2020), St. Lousi, MO, USA, 16–19 August 2020; p. V11BT11A031. [Google Scholar]
- Balli, S.; Sağbaş, E.A.; Peker, M. Human activity recognition from smart watch sensor data using a hybrid of principal component analysis and random forest algorithm. Meas. Control 2019, 52, 37–45. [Google Scholar] [CrossRef]
- Ahmed, N.; Rafiq, J.I.; Islam, M.R. Enhanced human activity recognition based on smartphone sensor data using hybrid feature selection model. Sensors 2020, 20, 317. [Google Scholar] [CrossRef]
- Sinuraya, E.W.; Rizal, A.; Soetrisno, Y.A.A. Performance improvement of human activity recognition based on ensemble empirical mode decomposition (EEMD). In Proceedings of the 2018 5th International Conference on Information Technology, Computer, and Electrical Engineering (ICITACEE), Semarang, Indonesia, 26–28 September 2018; pp. 359–364. [Google Scholar]
- Vidya, B.; Sasikumar, P. Wearable multi-sensor data fusion approach for human activity recognition using machine learning algorithms. Sens. Actuators A Phys. 2022, 341, 113557. [Google Scholar] [CrossRef]
- Jalal, A.; Kamal, S.; Kim, D. A depth video sensor-based life-logging human activity recognition system for elderly care in smart indoor environments. Sensors 2014, 14, 11735–11759. [Google Scholar] [CrossRef] [PubMed]
- Bayat, A.; Pomplun, M.; Tran, D.A. A Study on Human Activity Recognition Using Accelerometer Data from Smartphones. Procedia Comput. Sci. 2014, 34, 450–457. [Google Scholar] [CrossRef]
- Xu, L.; Yang, W.; Cao, Y.; Li, Q. Human activity recognition based on random forests. In Proceedings of the 2017 13th International Conference on Natural Computation, Fuzzy Systems and Knowledge Discovery (ICNC-FSKD), Guilin, China, 29–31 July 2017; pp. 548–553. [Google Scholar]
- Lee, S.-M.; Yoon, S.M.; Cho, H. Human activity recognition from accelerometer data using Convolutional Neural Network. In Proceedings of the 2017 Ieee International Conference on Big Data and Smart Computing (BigComp), Jeju Island, Korea, 13–16 February 2017; pp. 131–134. [Google Scholar]
- Liu, Z.; Li, S.; Hao, J.; Hu, J.; Pan, M.; Han, C. An Efficient and Fast Model Reduced Kernel KNN for Human Activity Recognition. J. Adv. Transp. 2021, 2021, 2026895. [Google Scholar] [CrossRef]
- Minarno, A.E.; Kusuma, W.A.; Wibowo, H. Performance comparisson activity recognition using logistic regression and support vector machine. In Proceedings of the 2020 3rd International Conference on Intelligent Autonomous Systems (ICoIAS), Singapore, 26–29 February 2020; pp. 19–24. [Google Scholar]
- Alessandrini, M.; Biagetti, G.; Crippa, P.; Falaschetti, L.; Turchetti, C. Recurrent Neural Network for Human Activity Recognition in Embedded Systems Using PPG and Accelerometer Data. Electronics 2021, 10, 1715. [Google Scholar] [CrossRef]
- Duan, L.T.; Lawo, M.; Wang, Z.G.; Wang, H.Y. Human Lower Limb Motion Capture and Recognition Based on Smartphones. Sensors 2022, 22, 5273. [Google Scholar] [CrossRef] [PubMed]
- Amarappa, S.; Sathyanarayana, S. Data classification using Support vector Machine (SVM), a simplified approach. Int. J. Electron. Comput. Sci. Eng 2014, 3, 435–445. [Google Scholar]
- Breiman, L.J.M.l. Random forests. Mach. Learn. 2001, 45, 5–32. [Google Scholar] [CrossRef]
- Arif, M.; Bilal, M.; Kattan, A.; Ahamed, S.I. Better physical activity classification using smartphone acceleration sensor. J. Med. Syst. 2014, 38, 1–10. [Google Scholar] [CrossRef]
- Kaggle. Available online: https://www.kaggle.com/ (accessed on 22 December 2022).
- Github. Available online: https://github.com/ (accessed on 22 December 2022).
Disclaimer/Publisher’s Note: The statements, opinions and data contained in all publications are solely those of the individual author(s) and contributor(s) and not of MDPI and/or the editor(s). MDPI and/or the editor(s) disclaim responsibility for any injury to people or property resulting from any ideas, methods, instructions or products referred to in the content. |
© 2023 by the authors. Licensee MDPI, Basel, Switzerland. This article is an open access article distributed under the terms and conditions of the Creative Commons Attribution (CC BY) license (https://creativecommons.org/licenses/by/4.0/).