Article

An Indoor Multi-Environment Sensor System Based on Intelligent Edge Computing

Contents Convergence Research Center, Korea Electronics Technology Institute, Seoul 03924, Republic of Korea
*
Author to whom correspondence should be addressed.
Electronics 2023, 12(1), 137; https://doi.org/10.3390/electronics12010137
Submission received: 5 December 2022 / Revised: 21 December 2022 / Accepted: 24 December 2022 / Published: 28 December 2022
(This article belongs to the Section Artificial Intelligence)

Abstract

:
Monitoring and predicting the environment in an indoor space plays an important role in securing big data and detecting abnormal conditions in the industrial environment and living space. This study proposes an indoor multi-environment sensor system based on intelligent edge computing that collects and predicts environmental data. The system collects data using 14 types of environmental sensors and object detection technology models and implements a model that predicts indoor air quality based on the bi-directional LSTM network. The trained model shows high performance in predicting indoor air quality (IAQ) factors, such as CO 2 , PM2.5, and total volatile organic compounds (TVOC). The indoor multi-environment sensor system based on intelligent edge computing is available for data collection and environmental prediction in various spaces without restrictions on specific locations. This study proposes an integrated approach with various functions by applying edge computing to indoor environment monitoring. We verify the proposed system through various experiments.

1. Introduction

Development in the technology of sensors, such as Microelectromechanical systems (MEMS), embedded systems, wireless communications, and distributed processing, have improved work performance in both industry and our daily lives. Othman et al. mentioned that environmental monitoring in particular has become a primary area of control and protection which can provide real-time system and control communications with the physical world. Therefore, it was proposed that intelligent and smart wireless sensor network systems can collect and process large amounts of data and manage air quality, traffic conditions, etc. [1]. As a result, they found that effective monitoring systems can be used to replace the use of traditional human power. In particular, measuring indoor environmental data such as carbon dioxide, fine dust, and indoor air quality is very important in modern society. An increase in mechanical and electronic components harms the indoor environment and occurs in various spaces, such as factories, hospitals, and daycare centers, which can be a health and accident risk for workers, indoor workers, and even young children. Although various environmental monitoring systems have been built in society, it is impossible to solve the problem because it deals only with a limited space or specific data. Therefore, Peng et al. proposed a volatile organic compounds (VOC)-centered indoor air quality monitoring system, and Dan et al. implemented an intelligent agricultural greenhouse monitoring system to monitor temperature, illuminance, and carbon dioxide in the greenhouse environment [2,3]. However, a simple monitoring system without a predictive model has limitations in detecting and preventing prior risks. To solve these problems, Qian et al., based on artificial intelligence technology, predicted the predicted mean vote (PMV), CO 2 , and PM2.5 using multiple data such as classroom occupancy, number of people, external airflow, PMV, CO 2 , temperature, and PM2.5 in a school building [4]. However, they were not able to apply this model to other environments because it is difficult to collect qualitative information such as space occupancy and external air inflow in real time. It is difficult to use universally because it is a model that predicts the environment when certain conditions are given. Therefore, we developed a system capable of predicting data under universal conditions. In this paper, we develop a multi-environment data collection and monitoring system that can be extended to various environments using only quantitative data. We propose a deep learning model that can predict indoor air quality after 10 min by referencing 600 histories based on the collected environmental data.
As the amount of data collected and processed by systems increases, and the need for intelligent models with real-time computation capabilities increases, the more edge computing technology, a new computing paradigm, is being focused on rather than server clouds [5]. Edge computing is a technology that facilitates rapid calculation by enabling real-time artificial intelligence inference from sensors without an internet connection, unlike conventional cloud-based artificial intelligence technology. As people pay more and more attention to the quality of the environment, indoor environment monitoring combining the Internet of Things with edge computing has become an important branch of study. Sophisticated indoor environment monitoring can increase energy efficiency and inform people of dangerous situations. In 2017, Tu et al. presented a series of lightweight intelligent solutions for computer room management by applying the IoT [6]. They proposed a system that could use sensors that obtain environment information and work with Raspberry Pi controllers to provide adaptive responses such as air conditioning control and alarm alerts. Their proposed system smartly changed specific spaces by being installed in underdeveloped rooms. Assante et al. developed a low-cost sensor network system to achieve high indoor environment quality [7]. They increased the possibility of saving energy in indoor space by creating a system that automatically controls heating, ventilation, and air conditioning systems by measuring the temperature and humidity through an Arduino board. In this way, by integrating the Internet of Things and indoor environment monitoring, which can collect sensor data, indoor energy efficiency could be increased, and the space could be changed smartly. Therefore, this technology is suitable for systems that collect diverse data without constraints on the installed environment and require immediate response through real-time analysis in the field. In this study, we build a system with edge computing technology as shown in Figure 1 and Figure 2 because it aims to collect more than a dozen kinds of different environmental sensor data and operate a real-time indoor air quality prediction model based on artificial intelligence.
In summary, the main contributions of this study are as follows:
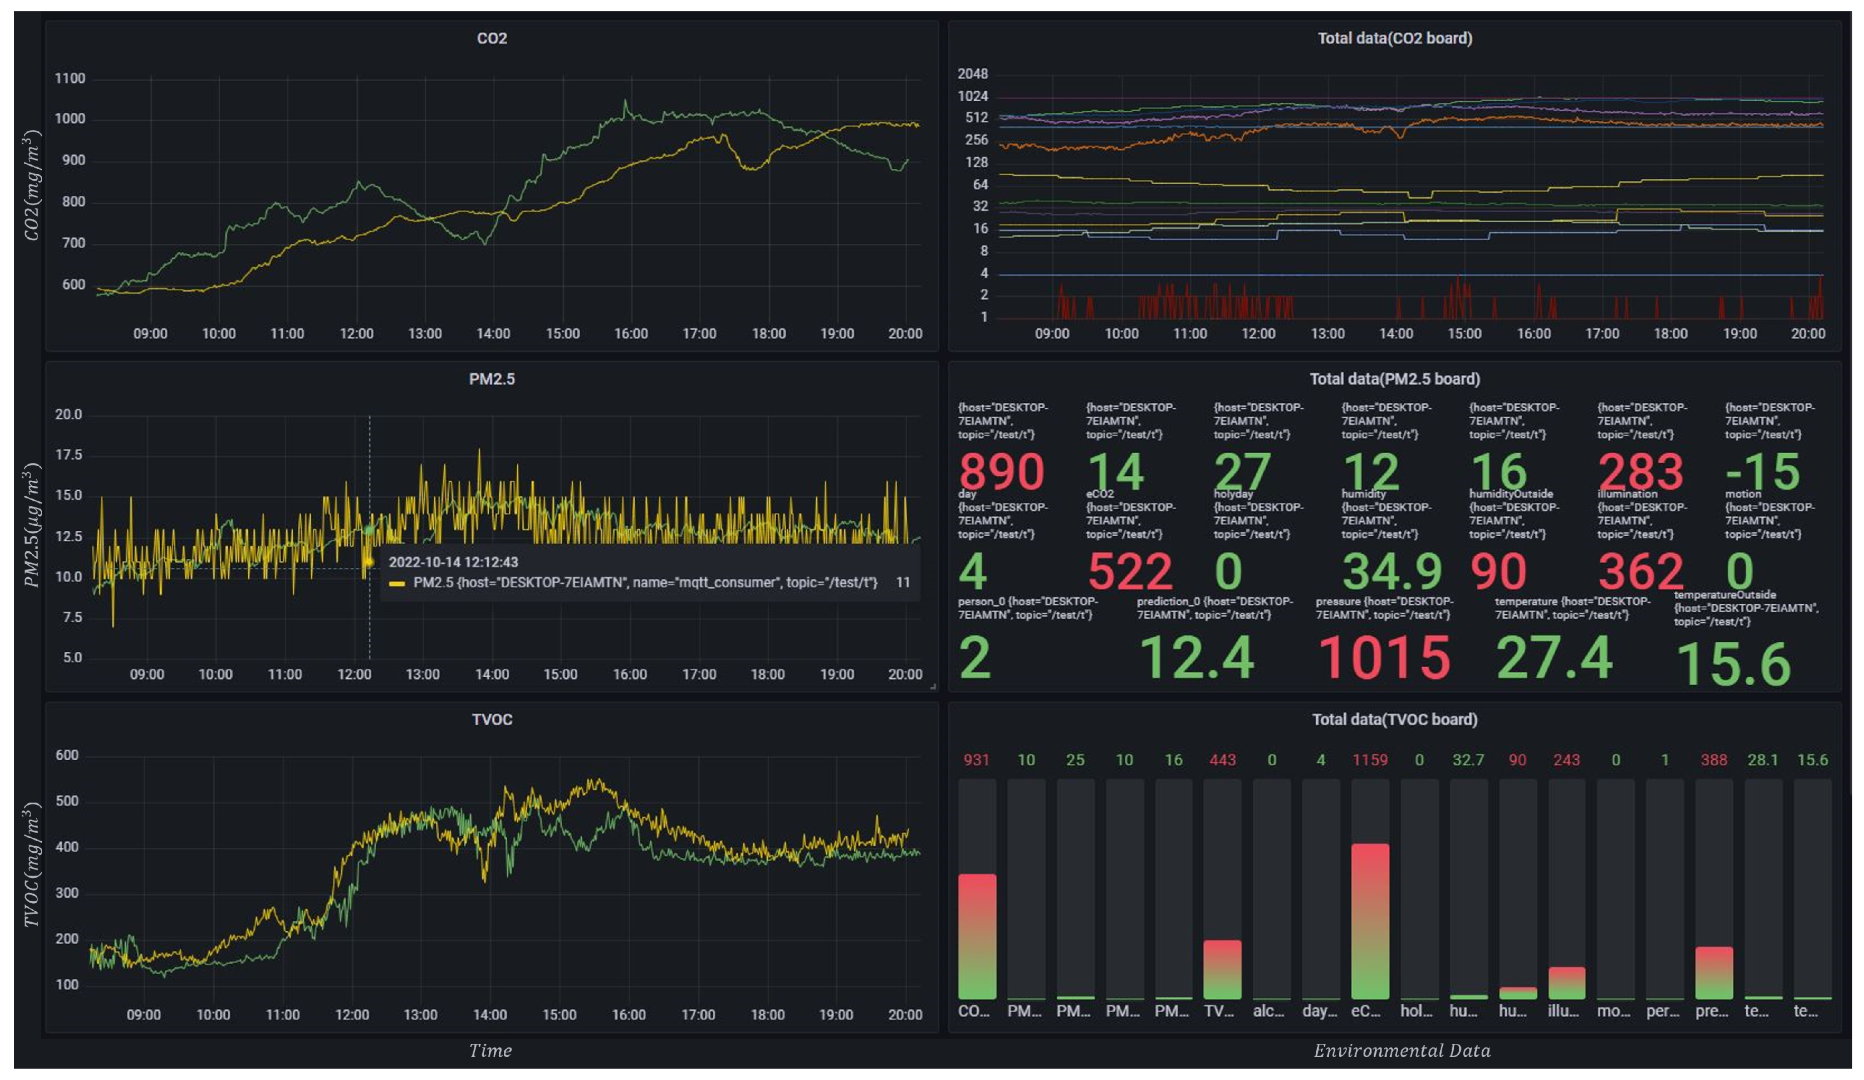
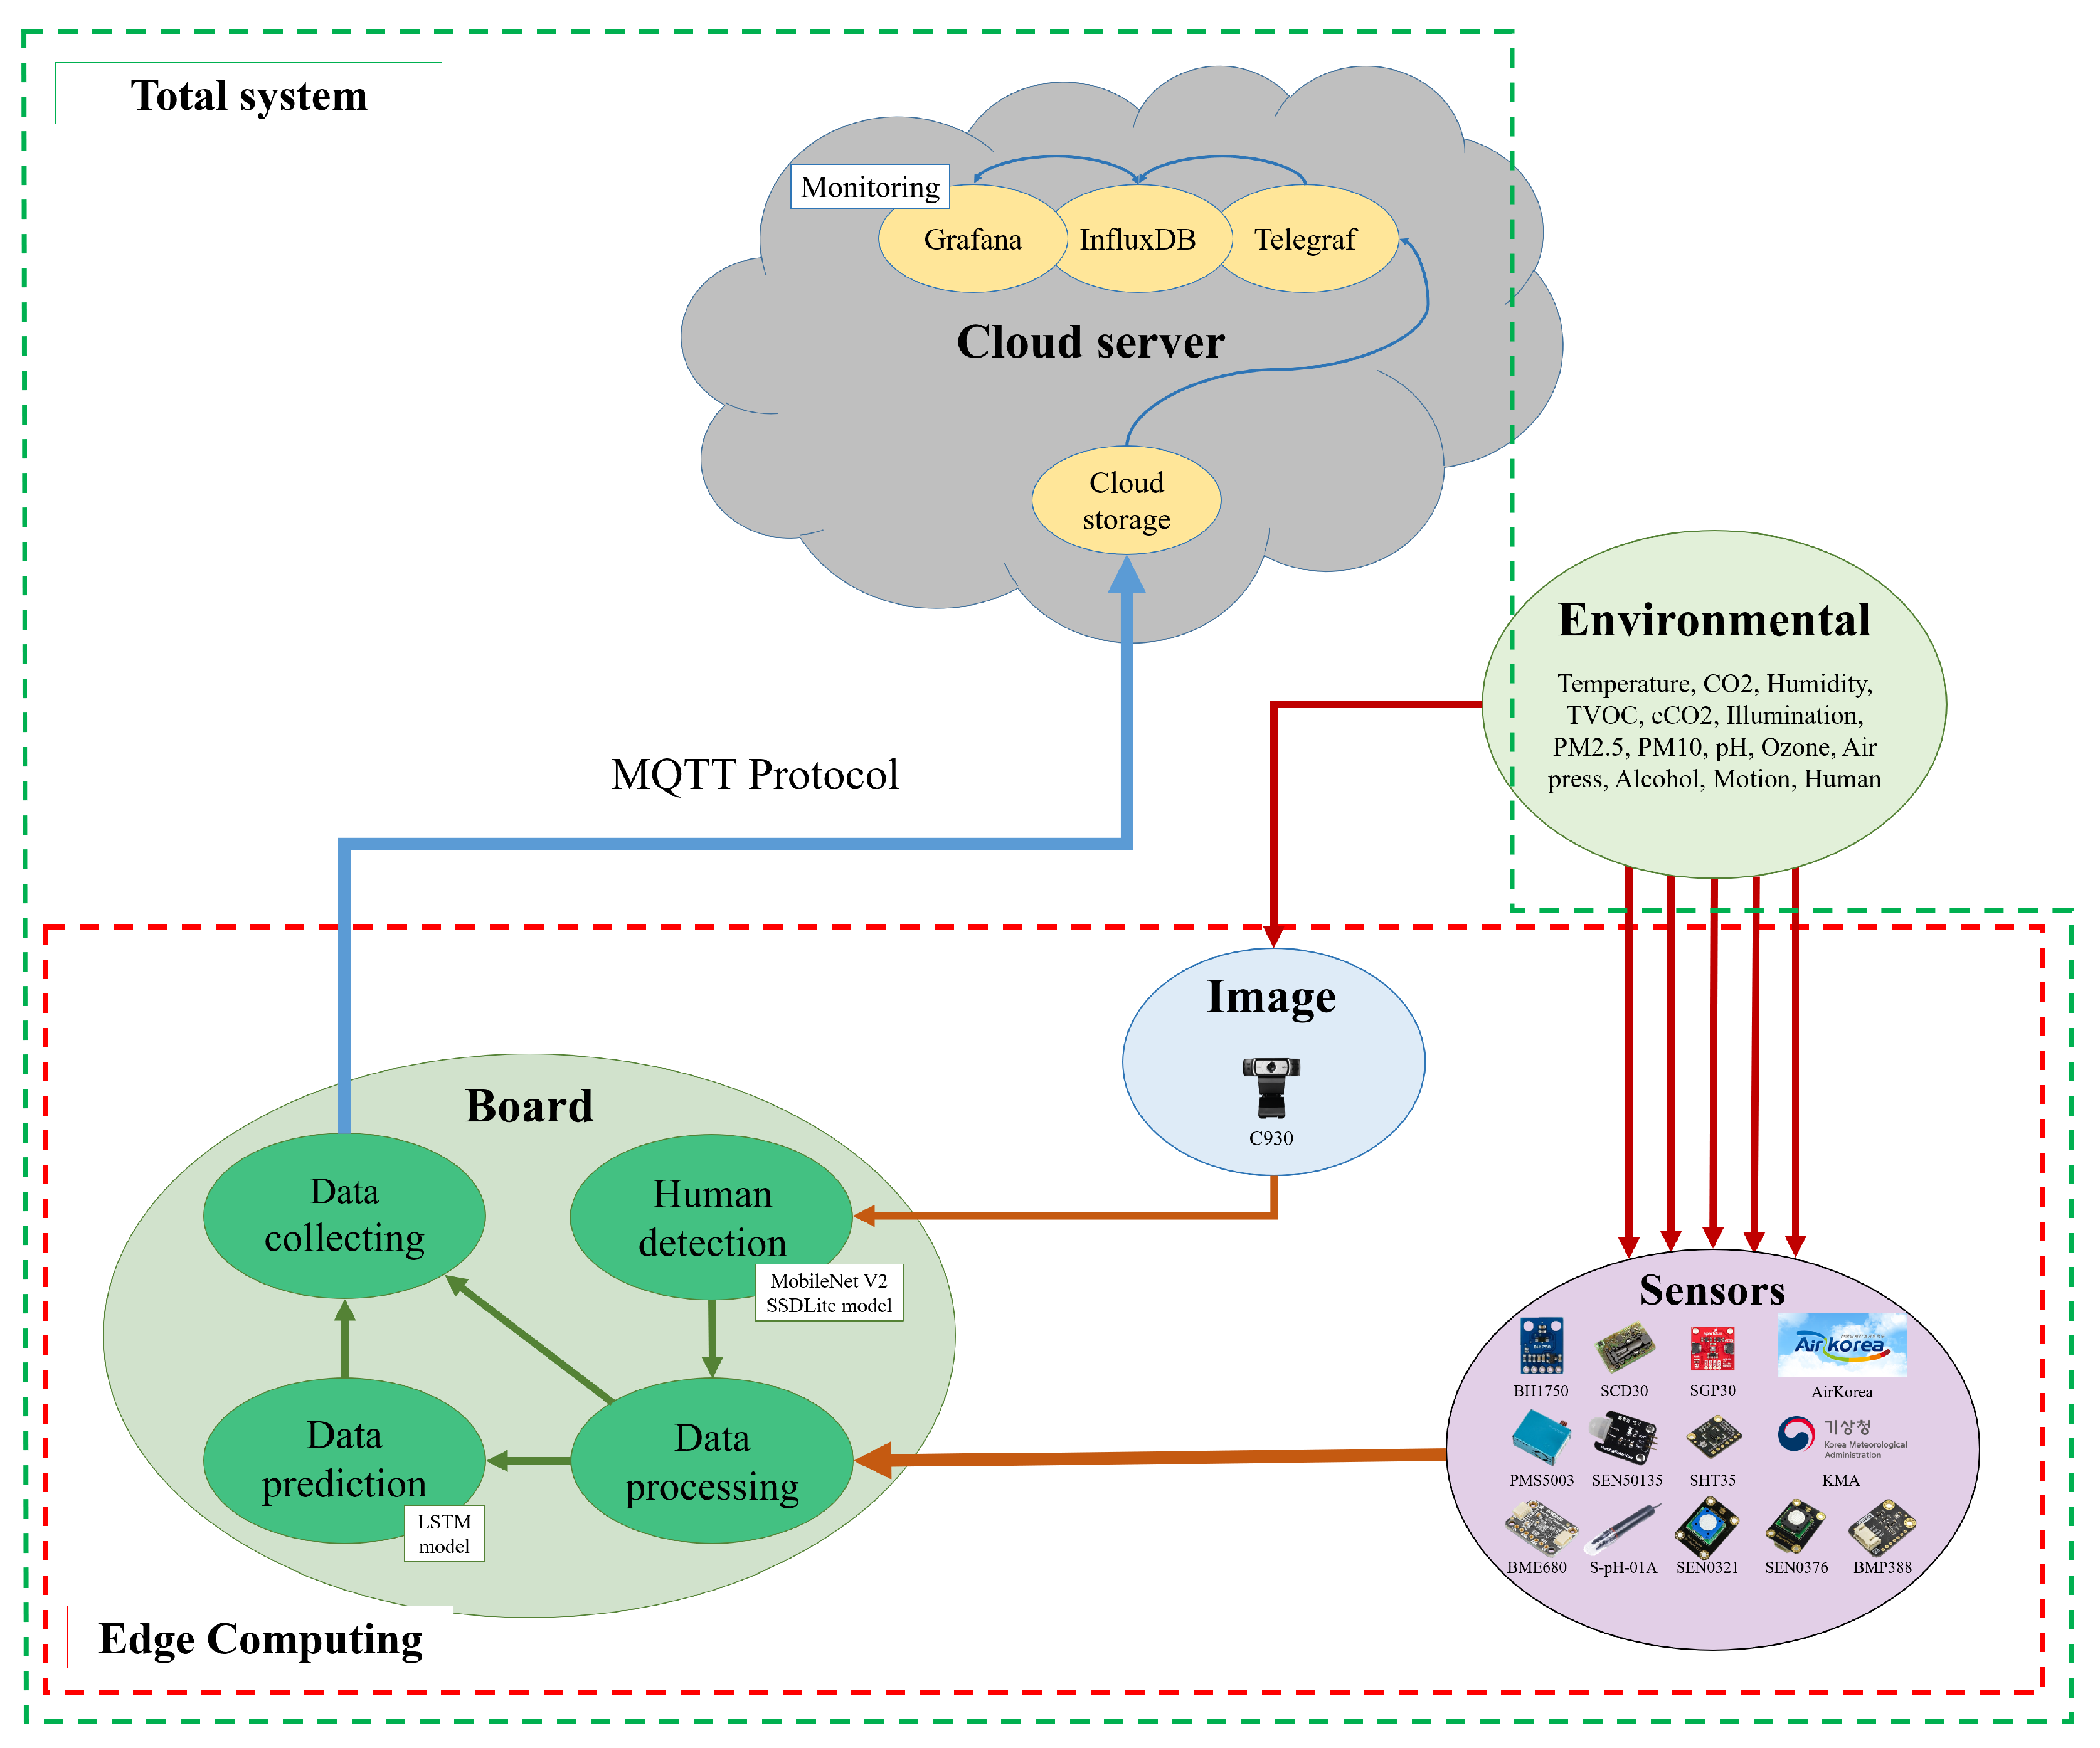
  • The proposed system collects and monitors data simultaneously via 14 general-purpose sensors. Furthermore, the user may set a data collection cycle and prediction target data.
  • The proposed indoor human detection model is implemented with the MobileNet structure and collects the number of humans. Aside from that, we construct and evaluate indoor human object datasets for accurate object detection.
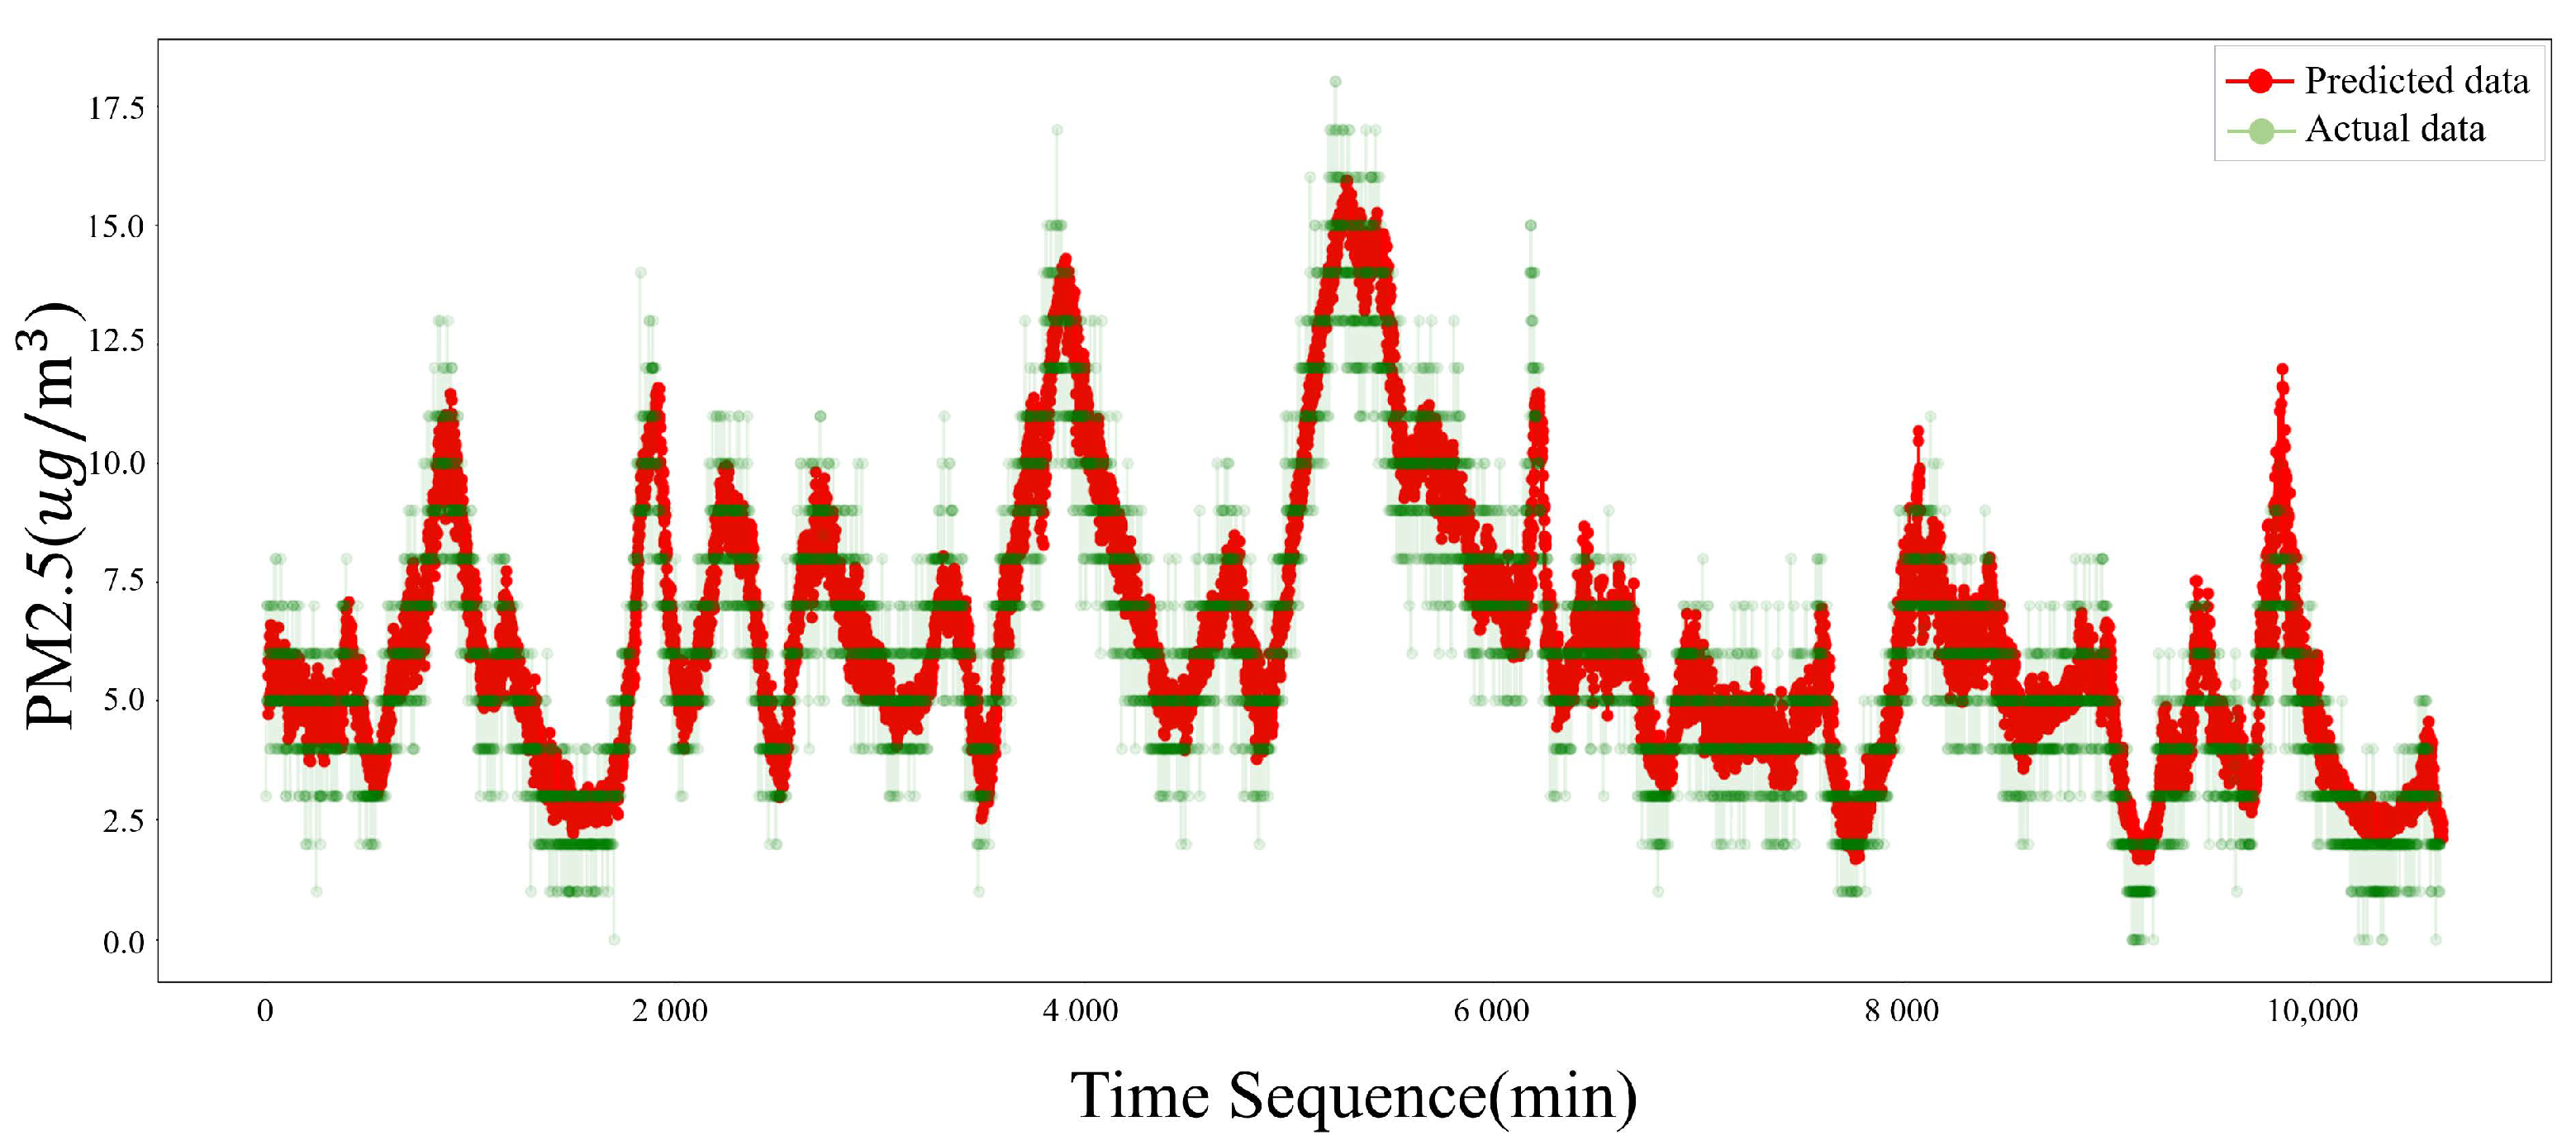
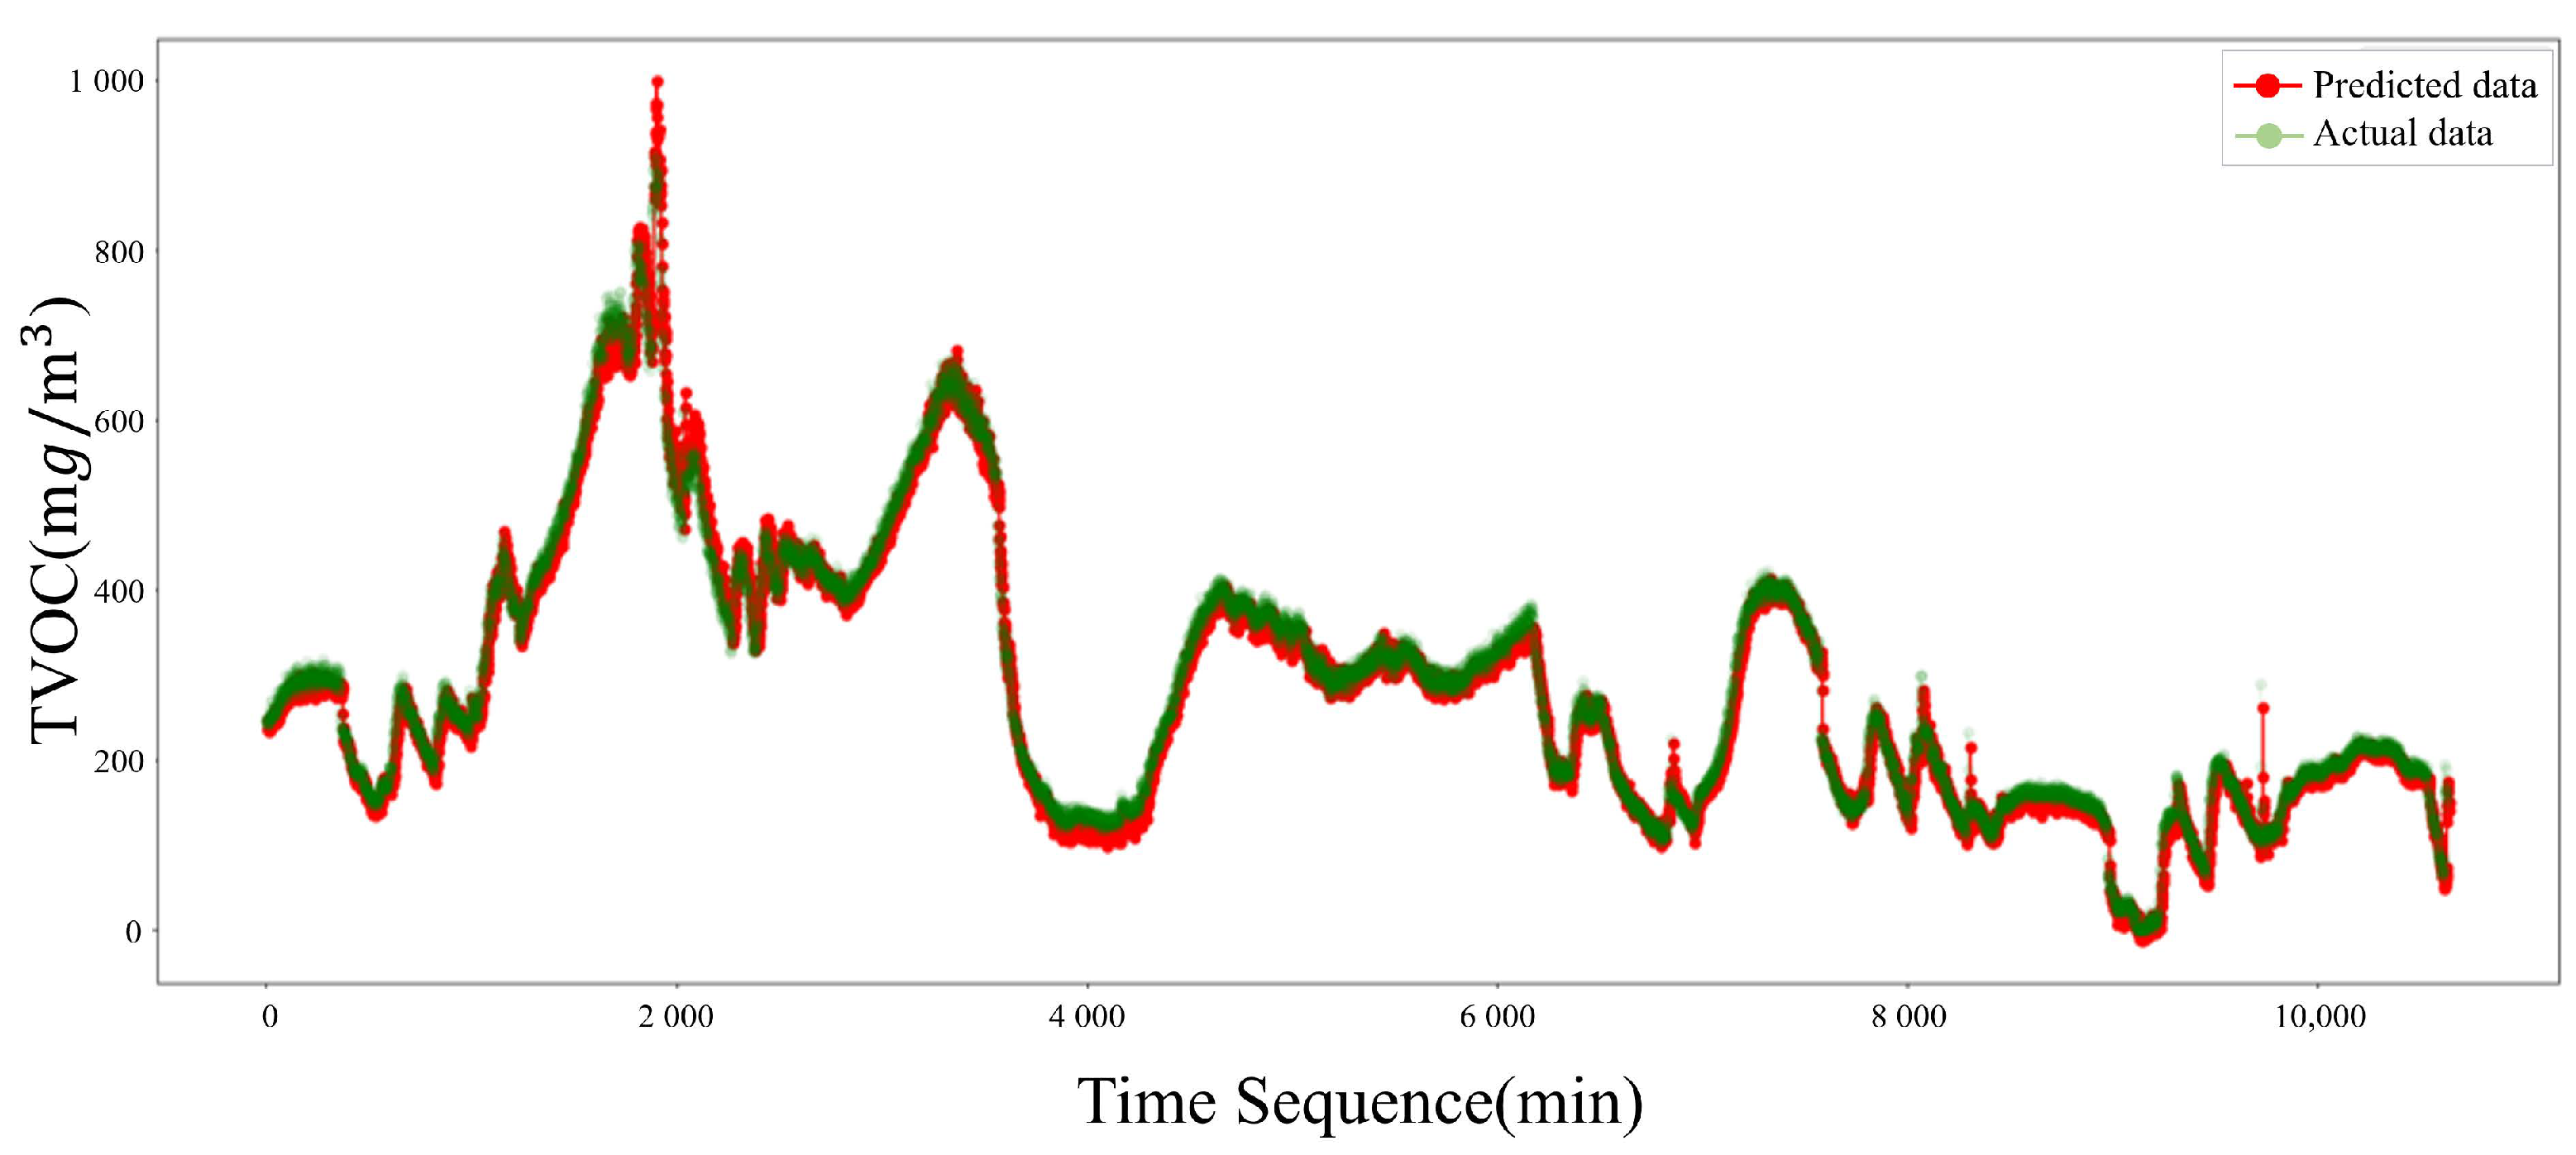
  • The proposed environmental prediction model is implemented based on the bi-directional LSTM structure and predicts PM2.5, TVOC, and CO 2 . We also validate our prediction performance by comparing its performance with gated recurrent units (GRU), bi-directional GRU, and LSTM.
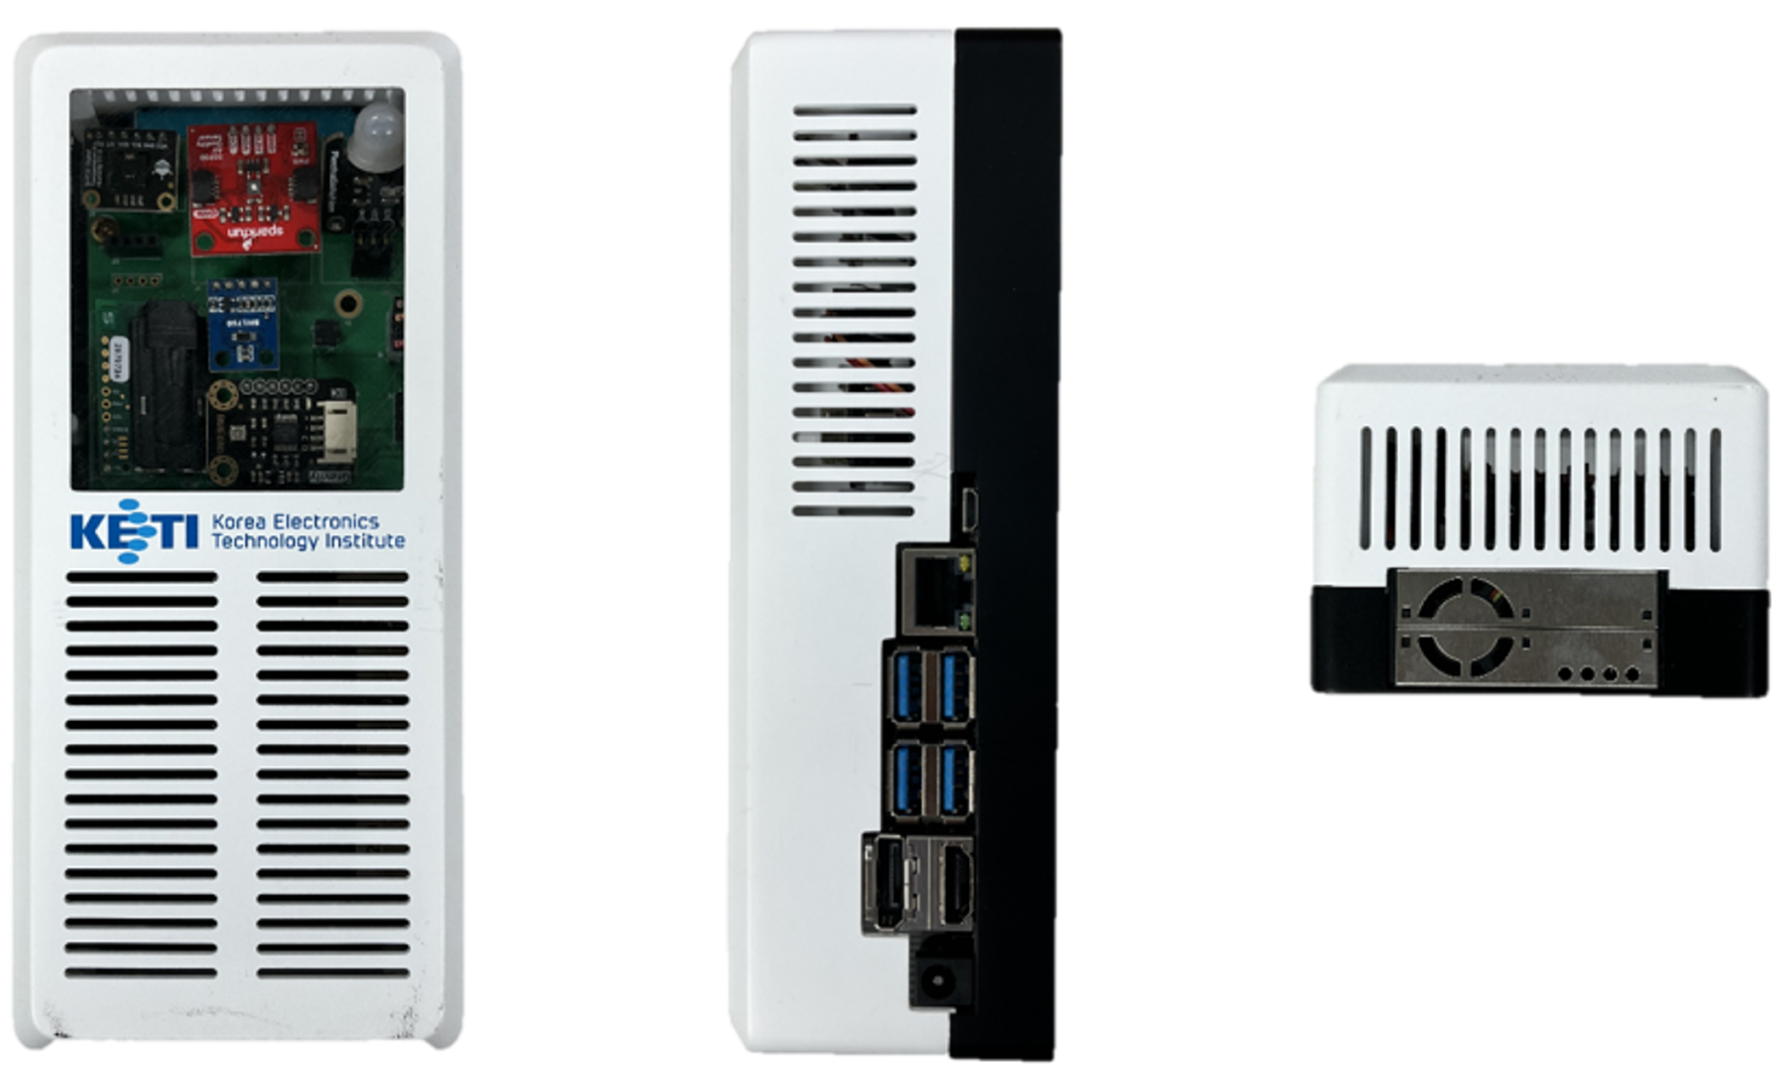
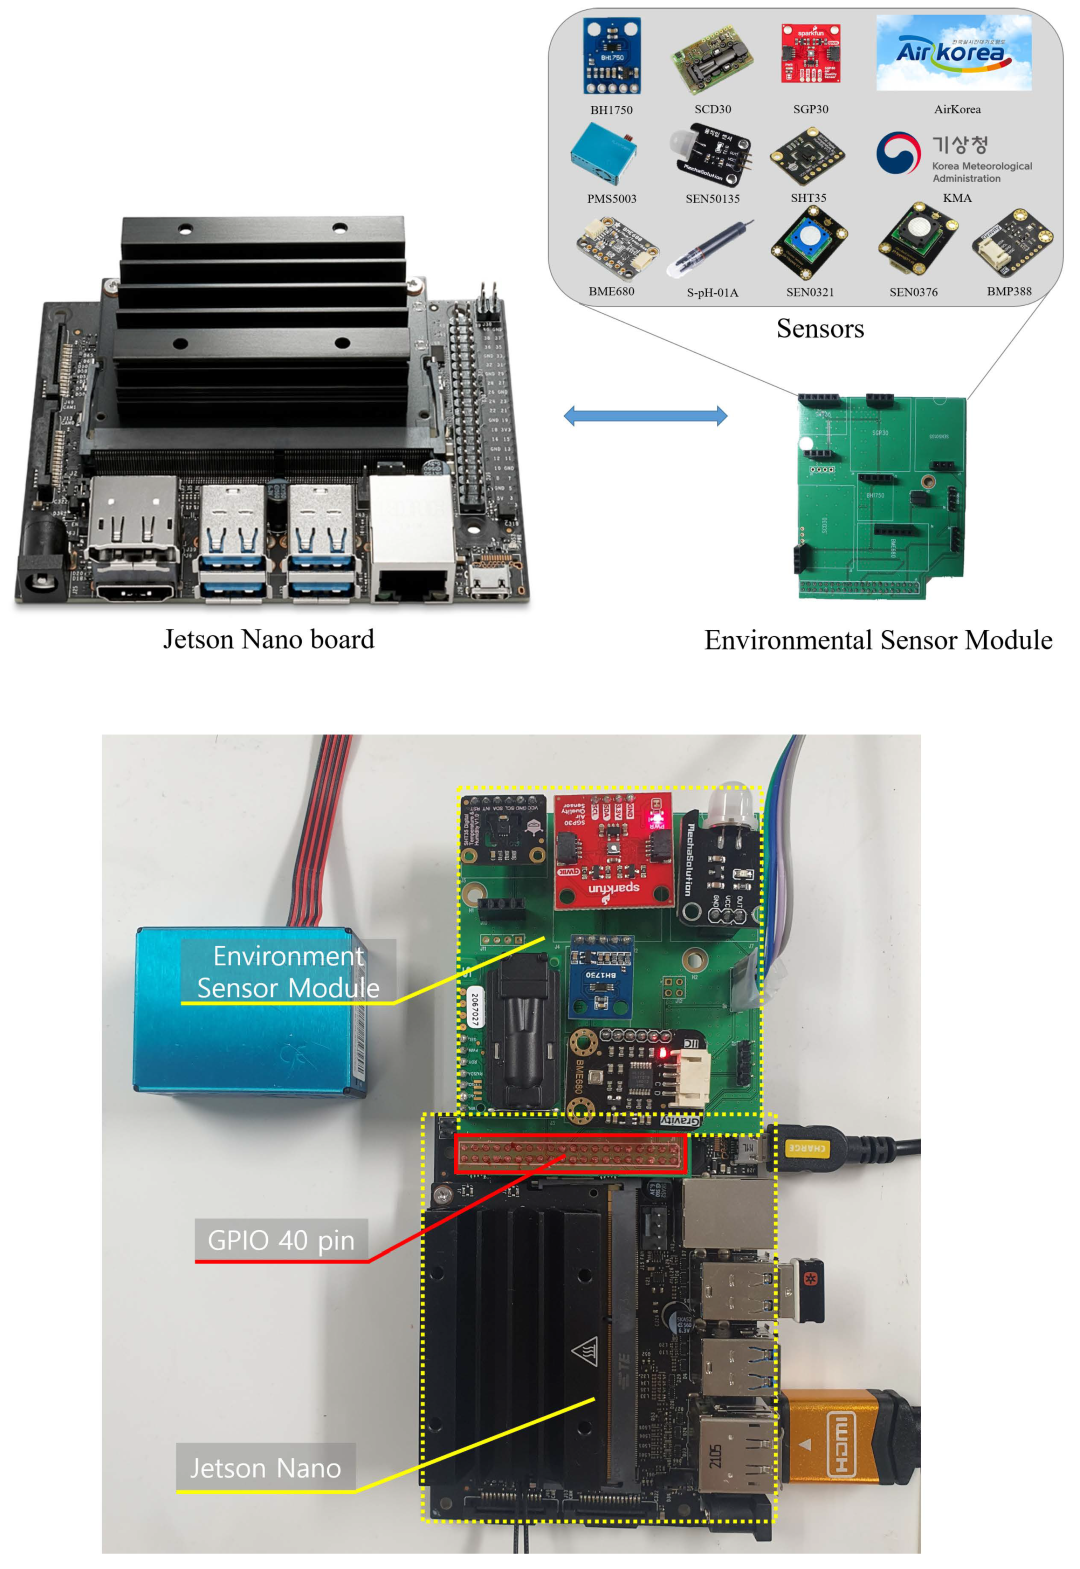
  • This study proposes an integrated system through various experiments and builds a multi-environment sensor system based on the NVIDIA Jetson Nano board, which is the representative edge computing environment.
Figure 1. Intelligent multi-environment sensor module: (left) front of the module (center), side of the module, and (right) top of the module.
Electronics 12 00137 g001
Figure 2. Multi-environment sensor monitoring dashboard.
Electronics 12 00137 g002
Recently, environmental monitoring has evolved into a primary area apart from safety and pollution control. In 2022, Bhoi et al. mentioned environmental monitoring as being unstable and inaccurate because it has been performed by physical models of the atmosphere [8]. They proposed a cost-effective standardized environment-monitoring system in a computing environment by capturing the dynamics of the environment using machine learning technologies such as MLP, k-NN, multiple regression, and SVM. Environmental monitoring fields such as the IoT, edge computing, and greenhouse continue to develop [9,10,11,12], and research has been carried out to expand novel tasks such as ensuring students’ safety and air quality measurement using machine learning technology [13,14]. Research is also being conducted to monitor the environment using qualitative data such as human occupancy [4,15]. In particular, it was revealed that CO 2 emitted by humans is closely related to the number of people in the office space by correlating their presence and concentration, since CO 2 is exhaled by human beings [16,17,18]. Therefore, environmental monitoring research can find innovative contributions in various aspects by combining environmental data, qualitative data, and machine learning. Based on these related studies, we apply edge computing to indoor environment monitoring and mount an artificial intelligence model for environment data collection and prediction. It collects diverse indoor data by mounting an artificial intelligence (AI) model and not just a system that collects data through sensors. In addition, the environmental prediction model implemented in our proposed system can increase the efficiency of energy saving, pollution prediction, and safety in indoor spaces by predicting future environments based on indoor environment monitoring data. Ultimately, our study demonstrates an integrated approach to intelligent monitoring by showing the system and experimental results of applying edge computing to indoor environment monitoring.

2. Proposed Multi-Environment Sensor System

This study proposes an indoor multi-environment sensor system based on intelligent edge computing that is applicable to various general-purpose spaces such as hospitals, offices, and kindergartens. Therefore, we used NVIDIA’s Jetson Nano board to build the entire system with a low-cost, high-performance board capable of edge computing. Jetson Nano is a representative single-board computer developed by NVIDIA for AI systems. Recently, it has been used as the main board for projects applying AI by loading high-performance Maxwell GPUs for artificial intelligence operations. The indoor multi-environment sensor system based on intelligent edge computing comprises a data collection unit and a data processing unit, both of which are implemented in an edge computing environment.

2.1. Data Collection Unit

The data collection unit is implemented to be linked with 14 sensors and supports 6 communication interfaces (I2C, Digital TTL, UART, RS485, USB, and Ethernet). Table 1 shows the whole communication interface and the data in our system. We manufactured a module dedicated to a multi-environment sensor which could connect to the GPIO 40 pin of the Jetson Nano board, as shown in Figure 3. When the system was driven, each sensor measured data according to their sampling frequency and collected integrated data according to the user’s settings; that is, the sensors measured data individually, and when the period set by the user became a period, the data of each sensor were simultaneously received and stored in the database. Every sensor datum was collected at default 1-minute intervals, which could be changed according to the user’s settings, as mentioned earlier.
Serial communication (I2C, Digital TTL, UART, and RS-485) sensors were connected to the multi-environment sensor module to measure environmental data around the sensor in real time. Additionally, we received data measured by external monitoring stations through Air Korea and Korea Meteorological Administration APIs and transmitted them to the data collection unit using Ethernet communication. Therefore, the proposed system is designed to allow users to set data collection locations for external fine dust-, temperature-, and humidity-monitoring stations. In addition, to collect the number of people [19,20] around the sensor module, which is directly related to the indoor environment data, the multi-environment sensor module was loaded with our indoor human object detection model. We obtained RGB images of a 1280 × 720 resolution around the sensor via a C930 USB camera and obtained quantitative data of the number of people calculated in our AI model. The input image was used only for human detection and was not stored as data in the module. The measured number of people is stored in the multi-environment database according to the period set by the user.
We used a low-cost Jetson Nano board to make it easy for anyone to use our system. However, Jetson Nano has limited hardware performance, so it needed a lightweight network. For this reason, the human object detection model was composed of networks based on MobileNet V2, showing both high performance and light memory usage in object recognition studies [21]. In detail, we used SSDLite, which replaced all the convolution layers of the SSD object detection network with the separable convolution used in MobileNet V1. In addition, through it replacing the backbone of SSDLite with MobileNet V2, we used a MobileNet V2 + SSDLite network. This study builds its own human dataset for high-accuracy human object tracking indoors, as shown in Figure 4. The dataset collected RGB images with a 1280 × 720 resolution using cameras installed in the center of the indoor office space and built a VOC-style dataset using camera capture tools provided by NVIDIA. Our own human dataset contained bounding box information and human classes about many people in the image frame. The human object contained both the whole body and the upper body, and the dataset consisted of a total of 1433 images with a bounding box for 3459 people. Our own human dataset compared them in PennFudan [22] and Aihub [23]. The PennFudan dataset is a representative human object dataset produced by the University of Pennsylvania and the University of Fudan, and the Aihub dataset is a human motion open dataset consisting of 2 million images. In Table 2, it is shown that our own model based on our dataset showed higher performance than other datasets (learning rate = 0.01, momentum = 0.9, weight decay = 5 × 10 4 , gamma = 0.1, initial learning rate = 0.001, scheduler = cosine, and batch = 32).

2.2. Data Processing Unit

One of the proposed embedded system’s significant features is predicting indoor air quality (IAQ) [24,25,26,27]. IAQ is one of the most integral components of wellness at home and in the workplace. Our device can collect versatile air quality-related data sequentially from the installed sensors. According to the collected time series information, the proposed system predicts three primary vital values of IAQ, which are as follows:
  • PM2.5 (Fine dust 2.5): Fine dust is classified into PM10 and PM2.5. PM10 is dust less than 10/1000 mm in size, and PM2.5 is dust less than 2.5/1000 mm in size [28]. Fine dust is emitted as a mixture of solid and liquid particles in the air and is produced by chemical reactions or naturally. Fine dust worsens respiratory diseases such as asthma and causes a decrease in lung function. PM2.5 is not filtered through the nasal mucosa due to its fine particles, but it directly penetrates the alveoli during inhalation, increasing the prevalence and early mortality due to asthma or lung diseases [29]. In addition, fine dust worsens visibility, deposits on the leaf surfaces of plants, interferes with metabolism, and deposits on buildings, historical sites, and statues, causing corrosion [30].
  • TVOC (Total volatile organic compounds): Total volatile organic compounds (TVOC) is a generic term for liquid or gaseous organic compounds that are easily evaporated into the atmosphere (benzene, toluene, ethylbenzene, xylene, styrene, etc.) [31]. These volatile organic compounds usually cause odors even at low concentrations, and the compounds themselves are directly harmful to the environment and the human body or participate in photochemical reactions in the atmosphere to produce secondary pollutants such as photochemical oxides [32]. They mainly occur in petrochemical oil refining, the manufacturing and storage process of paint, automobile exhaust, construction materials such as paint and adhesives, and storage tanks at gas stations. The main sources of indoor occurrence are building materials, laundry solvents, paints, and pesticides, which are mainly absorbed by the human body through breathing and the skin, and acute poisoning can cause difficulty breathing, lethargy, headaches, and vomiting, while chronic poisoning can cause blood disorders and anemia [33].
  • CO 2 (Carbon dioxide): This is a colorless and tasteless gas and has little toxicity, but if it exists in large quantities, it can increase the breathing speed of a person, resulting in respiratory disorders, headaches, tinnitus, and increased blood pressure due to inhalation of many harmful gases [34,35,36]. Indoor carbon dioxide is mainly generated during human respiration, heating, and cooking, and it is influenced by the indoor volume, indoor personnel, heating status, and ventilation, so it is used as a major indicator of indoor pollution. The carbon dioxide concentration is expressed in ppm, which means parts per million, and this is used to indicate the toxic gas ratio for an amount of fresh air. A typical indoor level of CO 2 is about 400 ppm, and an indoor level of CO 2 above 3000 ppm causes health problems [37,38].
In order to predict the above three critical IAQ metrics, the proposed data processing unit utilizes long short-term memory (LSTM), a gated recurrent neural network, for training the time series data [39,40]. Conventional recurrent neural networks (RNNs) train the time series data via backpropagation through time (BPTT). However, when processing the large-scale time step, the RNN suffers the vanishing and exploding gradient problem. To alleviate this problem in BPTT, truncated BPTT is proposed, dividing the total time step into sections of a certain size and computing the backpropagation. However, the truncated BPTT disturbs the training of long-term patterns, which is called the long-term dependency problem. The reason for the long-term dependency problem is that the input data are converted through specific operations through the RNN cell, and some information disappears at each time step.
Long short-term memory (LSTM) cells not only solve the long-term dependence problem of RNN cells but also accelerate learning convergence [41,42,43]. The LSTM cell divides a state into two vectors: h t and c t , where h t denotes a short-term state and c t denotes a long-term state. The key to LSTM is to learn what the network will remember, what to delete, and what to read in the long-term state c t . Long-term memory passes through the forget gate through the LSTM, loses some memory (information), and then adds some new memory from the input gate through an addition operation. The c t created in this way is immediately output without additional operations, and this long-term memory c t goes through a process of deleting and adding some memories at each time step. Then, after the addition operation, c t is copied and transferred to the tanh function of the output gate to produce the short-term state and the output of the cell h t [44,45,46]. Therefore, LSTM networks are well-suited to making predictions based on time series data, since there can be lags of unknown durations between important events in a time series.
Based on the Pearson correlation analysis, we set the input values concerning the prediction values. These analysis results are reported in Table 3. Several LSTM-based time series data prediction studies showed that the bi-directional LSTM architecture enhances the performance of the standard LSTM model [40,47,48,49,50]. Following this neural architecture design trend, the proposed system adopts the bi-directional LSTM architecture, which entirely makes the LSTM model understand sequential data.

3. Experimental Results

3.1. Implementation Details

For environmental prediction, AI models were actualized using TensorFlow and Keras in a GPU implementation. For human object detection, our MobileNet V2 SSDLite model was pretrained on MS COCO object detection and downloaded from NVIDIA Jetson. We trained all models on an RTX 2080 Ti 11-GB GPU and AMD Ryzen 7 3800× CPU. The trained models were mounted on the NVIDIA Jetson Nano board with a Maxwell GPU and ARM Cortex A57 CPU. All data collected on the board were delivered to the server using the MQTT protocol. Then, to visualize the data received on the server, we used Telegraf, InfluxDB, and Grafana.

3.2. Unified System

We manufactured a multi-environment sensor module running in an edge computing environment and built an integrated monitoring system that checked the collected data and predicted the results. As shown in Figure 5, various environmental data were measured through the sensors and transmitted to the board. In addition, images received by the C930 camera calculated the number of real-time people through the MobileNet V2 SSDLite Human detection algorithm mounted on the board. Information on the time and day of the week when the data were collected was stored in the database. The collected data performed a z-score preprocessing process, and then the results were derived through a trained prediction model based on bi-directional LSTM. All data were delivered to the server using the MQTT protocol [51].
We created a real-time visualization tool for users to monitor the data delivered to the server via MQTT. We used a Telegraf agent, InfluxDB, and Grafana for visualization [52,53,54]. The Telegraf agent, which was used to collect and process the desired indicators, stored the collected data on the server as a metric in InfluxDB and Time-series DB, which provided the ability to store and view the data in chronological order. This database works with Grafana, the most optimized tool for visualizing time series data, to create a real-time multi-environment data monitoring system.

4. Results

To learn the indoor air quality (IAQ) prediction model, we collected environmental data in an indoor office space (280 m 2 ) with much foot traffic through the data collection system introduced above. The collected dataset was the time series dataset introduced in Section 3.1. The dataset used for learning and evaluation had training (145,920), validation (21,888), and test sets (11,240). Because the range of input features varied, the data were preprocessed using the z-score normalization technique, which is defined as
Z = x μ σ ,
where x is the score, μ is the mean, and σ denotes the standard deviation.
We used an R 2 score, an indicator of how well independent variables explain dependent variables in regression models, for performance evaluation of the predictive models [55]. The R 2 score ranges from 0 to 1, and the closer it is to 1, the more relevant the linear regression model is to the actual value, which is defined as follows:
R 2 score = SSE SST = 1 SSR SST ,
where the total sum of squares (SST) is i = 1 n ( y i y ¯ ) 2 , the sum of squared estimate of error (SSE) is i = 1 n ( y ^ i y ¯ ) 2 , the sum of squares due to regression (SSR) is i = 1 n ( y i y ^ i ) 2 , y ¯ is the average of the observed data, and y ^ is the approximated value based on regression.
In this study, we constructed a model that predicted the IAQ using the bi-directional structure mentioned in Section 3.2. We preprocessed and composed the data to predict the 10th datum using the past 600 historical entries. Assuming that T was the current data, the data from T 600 to T, which consisted of the input features shown in Table 3, were labeled as the input data, and the T + 10 target data were labeled as the ground truth; that is, the proposed model was able to predict future environment data after 10 min.
We further implemented a predictive model based on LSTM, GRU, and bi-directional GRU, which are widely used in regression tasks, and compared the performance with the proposed bi-directional LSTM. Table 4 shows the R-squared ( R 2 ) and mean absolute error (MAE) benchmarks of the models predicting PM2.5, TVOC, and CO 2 values, and as a result, we found that the bi-directional LSTM showed the best performance. Figure 6, Figure 7 and Figure 8 show the prediction results for PM2.5 (indoor), TVOC, and CO 2 . In the figures, the red line signifies predicted data, and the green line indicates the actual data. The CO 2 model showed the highest similarity ( R 2 = 0.996, MAE = 0.053), followed by TVOC ( R 2 = 0.990, MAE = 0.088) and PM2.5 (indoor) ( R 2 = 0.836, MAE = 0.329). This model worked on the data processing unit that was an edge computing environment. Therefore, our system yielded IAQ prediction data simultaneously with multi-environment data collection.
Finally, the data collected in the indoor multi-environment sensor system and the IAQ prediction results were transmitted to the server using the MQTT protocol and output to the real-time composite environmental sensor monitoring system produced in Section 3.2. The system can visualize data from multiple intelligent embedded boards as well as configure a visual dashboard by selecting the data the user wants. Figure 9 shows the monitoring UI of the collected total data through Grafana, and Figure 10 shows the IAQ (CO 2 , PM2.5, and TVOC) predicted by three different modules.

5. Discussion

This work proposed an indoor multi-environment sensor system based on intelligent edge computing with a data collection unit and a data processor unit. The proposed system simultaneously performs environmental data collection, human detection modeling, environmental data prediction modeling, and data transmission on the NVIDIA Jetson Nano board. In order to collect multiple environmental data, 14 types of general-purpose sensors were linked with our system and human detection models, which were implemented as MobileNet, and mounted to measure the number of people. We built our own dataset to improve the accuracy of the human detection models indoors and demonstrated high performance compared with other datasets. Our own dataset showed a higher mAP than the Aihub and PennFudan dataset because it included the upper body and the whole body. The Aihub and PennFudan datasets showed low accuracy due to being obscured indoors because they built datasets with only the whole human body. The prediction model mounted in the system may predict environmental data with a bi-directional LSTM structure using data collected in real time. Our model demonstrated the hypothesis with the highest performance compared with the traditional LSTM, GRU, and bi-directional GRU approaches. Our system has three learned prediction models and can predict one thing—PM2.5, TVOC, and CO 2 —depending on the user’s settings. The monitoring results shown in Figure 2 show the results of predicting different data from each of the three modules simultaneously. After data collection, calculation of the number of people, and data prediction were completed, all data were transferred to the server using communication through MQTT. Finally, the data delivered appeared in the integrated monitoring system via Telegraf, InfluxDB, and Grafana.

6. Conclusions

Indoor environment monitoring research focuses on measuring data in real time to provide information to users or control adaptive systems such as air conditioners and heaters. Environment monitoring can provide efficient energy saving and safety in indoor spaces. In this study, we implemented an integrated system that predicted specific environmental data as well as performing real-time environmental measurement by applying edge computing that could be equipped with an artificial intelligence model to expand the function of indoor environment monitoring.
This paper proposed an indoor multi-environment sensor system based on intelligent edge computing for predicting PM2.5, TVOC, and CO 2 , which are representative data of IAQ. This system not only stores various kinds of environmental data but also digitizes the number of people around the module by implementing a human object detection model based on the indoor human dataset. In addition, our system can detect environmental change with an AI model that predicts indoor air quality based on the collected data. Therefore, applying edge computing to indoor environment monitoring is of great significance to the practical use and future development of indoor environment monitoring and prediction systems. In the future, we will conduct research to predict and verify air quality in various indoor industrial spaces based on multi-environmental sensor systems.

Author Contributions

Conceptualization, M.K. and S.P.; methodology, M.K.; software, M.K.; validation, M.K., T.K. and S.P.; formal analysis, T.K.; investigation, M.K.; resources, M.K.; data curation, M.K.; writing—original draft preparation, M.K. and T.K.; visualization, M.K. and T.K.; supervision, M.K., T.K. and S.P.; project administration, S.P. and K.L.; funding acquisition, S.P. and K.L. All authors have read and agreed to the published version of the manuscript.

Funding

This work was supported by the IT R&D program of MOTIE/KEIT. (20010525, Development of intelligent complex environmental sensor technology capable of flexible reconfiguration).

Institutional Review Board Statement

Not applicable.

Informed Consent Statement

Not applicable.

Data Availability Statement

Not applicable.

Conflicts of Interest

The authors declare no conflict of interest.

References

  1. Othman, M.F.; Khairunnisa, S. Wireless sensor network applications: A study in environment monitoring system. Procedia Eng. 2012, 41, 1204–1210. [Google Scholar] [CrossRef] [Green Version]
  2. Peng, I.H.; Chu, Y.Y.; Kong, C.Y.; Su, Y.S. Implementation of indoor VOC air pollution monitoring system with sensor network. In Proceedings of the 2013 Seventh International Conference on Complex, Intelligent, and Software Intensive Systems, Taichung, Taiwan, 3–5 July 2013. [Google Scholar]
  3. Liu, D.; Cao, X.; Huang, C.; Ji, L. Intelligent agriculture greenhouse environment monitoring system based on IOT technology. In Proceedings of the 2015 International Conference on Intelligent Transportation, Big Data and Smart City, Halong Bay, Vietnam, 19–20 December 2015. [Google Scholar]
  4. Qian, G.; Lu, S.; Pan, D.; Tang, H.; Liu, Y.; Wang, Q. Edge computing: A promising framework for real-time fault diagnosis and dynamic control of rotating machines using multi-sensor data. IEEE Sens. J. 2019, 19, 4211–4220. [Google Scholar] [CrossRef]
  5. Evans, D. The Internet of Things: How the Next Evolution of the Internet Is Changing Everything; White Paper; CISCO: San Jose, CA, USA, 2011; Volume 1, pp. 1–11. [Google Scholar]
  6. Tu, Z.X.; Hong, C.C.; Feng, H. EMACS: Design and implementation of indoor environment monitoring and control system. In Proceedings of the 2017 IEEE/ACIS 16th International Conference on Computer and Information Science (ICIS), Wuhan, China, 24–26 May 2017. [Google Scholar]
  7. Assante, D.; Fornaro, C. An educational iot-based indoor environment monitoring system. In Proceedings of the 2019 IEEE Global Engineering Education Conference (EDUCON), Dubai, United Arab Emirates, 8–11 April 2019. [Google Scholar]
  8. Bhoi, S.K.; Panda, S.K.; Jena, K.K.; Sahoo, K.S.; Jhanjhi, N.; Masud, M.; Aljahdali, S. IoT-EMS: An internet of things based environment monitoring system in volunteer computing environment. Intell. Autom. Soft Comput 2022, 32, 1493–1507. [Google Scholar] [CrossRef]
  9. Chen, X.; Wang, X.; Shen, H. Design of greenhouse environment monitoring system based on NB-IoT and edge computing. In Proceedings of the 2021 IEEE 5th Advanced Information Technology, Electronic and Automation Control Conference (IAEAC), Chongqing, China, 12–14 March 2021; Volume 5. [Google Scholar]
  10. Yu, Q.; Xiong, F.; Wang, Y. Integration of wireless sensor network and IoT for smart environment monitoring system. J. Interconnect. Netw. 2022, 22 (Suppl. 2), 2143010. [Google Scholar] [CrossRef]
  11. Zhang, S.; Guo, Y.; Li, S.; Ke, Z.; Zhao, H.; Yang, J.; Wang, Y.; Li, D.; Wang, L.; Yang, W. Investigation on environment monitoring system for a combination of hydroponics and aquaculture in greenhouse. Inf. Process. Agric. 2022, 9, 123–134. [Google Scholar] [CrossRef]
  12. Borkar, P.S.; Thakur, R. Smart Environment Monitoring Models Using Cloud-Based Data Analytics: A Comprehensive Study. Mach. Learn. Approach Cloud Data Anal. IoT 2021, 227–271. [Google Scholar] [CrossRef]
  13. Sivasankar, G.; Balaji, S.; Vignesh, N. Internet of Things based Smart Students’ body Temperature Monitoring System for a Safe Campus. In Proceedings of the 2022 6th International Conference on Intelligent Computing and Control Systems (ICICCS), Madurai, India, 25–27 May 2022. [Google Scholar]
  14. Pramanik, J.; Samal, A.K.; Pani, S.K.; Chakraborty, C. Elementary framework for an IoT based diverse ambient air quality monitoring system. Multimed. Tools Appl. 2022, 81, 36983–37005. [Google Scholar] [CrossRef]
  15. Akhter, F.; Khadiviz, S.; Siddiquei, H.R.; Alahi, M.E.E.; Mukhopadhyay, S. IoT enabled intelligent sensor node for smart city: Pedestrian counting and ambient monitoring. Sensors 2019, 19, 3374. [Google Scholar] [CrossRef] [Green Version]
  16. Nassif, N. A robust CO2-based demand-controlled ventilation control strategy for multi-zone HVAC systems. Energy Build. 2012, 45, 72–81. [Google Scholar] [CrossRef]
  17. Mumma, S.A. Transient occupancy ventilation by monitoring CO2. ASHRAE IAQ Appl. 2004, 5, 21–23. [Google Scholar]
  18. Meyn, S.; Surana, A.; Lin, Y.; Oggianu, S.M.; Narayanan, S.; Frewen, T.A. A sensor-utility-network method for estimation of occupancy in buildings. In Proceedings of the 48h IEEE Conference on Decision and Control (CDC) Held Jointly with 2009 28th Chinese Control Conference, Shanghai, China, 15–18 December 2009. [Google Scholar]
  19. Kamal, U.; Ahmed, S.; Toha, T.R.; Islam, N.; Al Islam, A.B.M. Intelligent human counting through environmental sensing in closed indoor settings. Mob. Netw. Appl. 2020, 25, 474–490. [Google Scholar] [CrossRef]
  20. Li, T.; Fong, S.; Yang, L. Counting passengers in public buses by sensing carbon dioxide concentration: Data collection and machine learning. In Proceedings of the 2018 2nd International Conference on Big Data and Internet of Things, Beijing, China, 24–26 October 2018. [Google Scholar]
  21. Ler, M.; Howard, A.; Zhu, M.; Zhmoginov, A.; Chen, L.C. Mobilenetv2: Inverted residuals and linear bottlenecks. In Proceedings of the IEEE Conference on Computer Vision and Pattern Recognition, Salt Lake City, UT, USA, 18–23 June 2018. [Google Scholar]
  22. Wang, L.; Shi, J.; Song, G.; Shen, I.F. Object detection combining recognition and segmentation. In Asian Conference on Computer Vision; Springer: Berlin/Heidelberg, Germany, 2007. [Google Scholar]
  23. Available online: https://www.aihub.or.kr/ (accessed on 14 December 2022).
  24. Tran, V.V.; Park, D.; Lee, Y.C. Indoor air pollution, related human diseases, and recent trends in the control and improvement of indoor air quality. Int. J. Environ. Res. Public Health 2020, 17, 2927. [Google Scholar] [CrossRef] [PubMed] [Green Version]
  25. Megahed, N.A.; Ghoneim, E.M. Indoor Air Quality: Rethinking rules of building design strategies in post-pandemic architecture. Environ. Res. 2021, 193, 110471. [Google Scholar] [CrossRef] [PubMed]
  26. Mannan, M.; Al-Ghamdi, S.G. Indoor air quality in buildings: A comprehensive review on the factors influencing air pollution in residential and commercial structure. Int. J. Environ. Res. Public Health 2021, 18, 3276. [Google Scholar] [CrossRef] [PubMed]
  27. Settimo, G.; Manigrasso, M.; Avino, P. Indoor air quality: A focus on the European legislation and state-of-the-art research in Italy. Atmosphere 2020, 11, 370. [Google Scholar] [CrossRef] [Green Version]
  28. Fang, G.C.; Peng, Y.P.; Kao, C.L.; Zhuang, Y.J. Measurements of ambient air fine (PM ≤ 2.5) and coarse (PM > 2.5) particulates concentrations by using of a dust monitoring system. Environ. Forensics 2021, 1–8. [Google Scholar] [CrossRef]
  29. Zhang, M. Transboundary Fine Dust and “PM 2.5 Diplomacy” in Northeast Asia: Cooperation and Future Challenges. In Risk Management in East Asia; Palgrave Macmillan: Singapore, 2021; pp. 223–246. [Google Scholar]
  30. Seong, N. Deep spatiotemporal attention network for fine particle matter 2.5 concentration prediction with causality analysis. IEEE Access 2021, 9, 73230–73239. [Google Scholar] [CrossRef]
  31. Jin, L.; Griffith, S.M.; Sun, Z.; Yu, J.Z.; Chan, W. On the flip side of mask wearing: Increased exposure to volatile organic compounds and a risk-reducing solution. Environ. Sci. Technol. 2021, 55, 14095–14104. [Google Scholar] [CrossRef]
  32. Suárez-Cáceres, G.P.; Fernández-Cañero, R.; Fernández-Espinosa, A.J.; Rossini-Oliva, S.; Franco-Salas, A.; Pérez-Urrestarazu, L. Volatile organic compounds removal by means of a felt-based living wall to improve indoor air quality. Atmos. Pollut. Res. 2021, 12, 224–229. [Google Scholar] [CrossRef]
  33. Alford, K.L.; Kumar, N. Pulmonary Health Effects of Indoor Volatile Organic Compounds—A Meta-Analysis. Int. J. Environ. Res. Public Health 2021, 18, 1578. [Google Scholar] [CrossRef]
  34. Hou, J.; Sun, Y.; Dai, X.; Liu, J.; Shen, X.; Tan, H.; Yin, H.; Huang, K.; Gao, Y.; Lai, D.; et al. Associations of indoor carbon dioxide concentrations, air temperature, and humidity with perceived air quality and sick building syndrome symptoms in Chinese homes. Indoor Air 2021, 31, 1018–1028. [Google Scholar] [CrossRef] [PubMed]
  35. Prakash, K.B.; Subramaniayan, C.; Ch, R.M.; Kumar, P.M.; Saravanakumar, S. Development of mathematical model to study the effect of indoor air quality parameters and optimization using response surface methodology. Mater. Today Proc. 2021, 45, 8195–8198. [Google Scholar] [CrossRef]
  36. Canha, N.; Teixeira, C.; Figueira, M.; Correia, C. How is indoor air quality during sleep? A review of field studies. Atmosphere 2021, 12, 110. [Google Scholar] [CrossRef]
  37. Geiss, O. Effect of wearing face masks on the carbon dioxide concentration in the breathing zone. Aerosol Air Qual. Res. 2021, 21, 200403. [Google Scholar] [CrossRef]
  38. Xu, X.; Lian, Z.; Shen, J.; Cao, T.; Zhu, J.; Lin, X.; Qing, K.; Zhang, W.; Zhang, T. Experimental study on sleep quality affected by carbon dioxide concentration. Indoor Air 2021, 31, 440–453. [Google Scholar] [CrossRef]
  39. Yu, Y.; Si, X.; Hu, C.; Zhang, J. A review of recurrent neural networks: LSTM cells and network architectures. Neural Comput. 2019, 31, 1235–1270. [Google Scholar] [CrossRef]
  40. Huang, Z.; Xu, W.; Yu, K. Bidirectional LSTM-CRF models for sequence tagging. arXiv 2015, arXiv:1508.01991. [Google Scholar]
  41. Sherstinsky, A. Fundamentals of recurrent neural network (RNN) and long short-term memory (LSTM) network. Phys. D Nonlinear Phenom. 2020, 404, 132306. [Google Scholar] [CrossRef] [Green Version]
  42. Smagulova, K.; James, A.P. A survey on LSTM memristive neural network architectures and applications. Eur. Phys. J. Spec. Top. 2019, 228, 2313–2324. [Google Scholar] [CrossRef]
  43. Gers, F.A.; Nicol, N. Schraudolph, and Jürgen Schmidhuber. Learning precise timing with LSTM recurrent networks. J. Mach. Learn. Res. 2002, 3, 115–143. [Google Scholar]
  44. Mikolov, T.; Karafiát, M.; Burget, L.; Cernocký, J.; Khudanpur, S. Recurrent neural network based language model. Interspeech 2010, 2, 1045–1048. [Google Scholar]
  45. Wang, J. Analysis and design of a recurrent neural network for linear programming. IEEE Trans. Circuits Syst. I Fundam. Theory Appl. 1993, 40, 613–618. [Google Scholar] [CrossRef]
  46. Lukoševičius, M.; Jaeger, H. Reservoir computing approaches to recurrent neural network training. Comput. Sci. Rev. 2009, 3, 127–149. [Google Scholar] [CrossRef]
  47. Graves, A.; Jaitly, N.; Abdel-Rahman, M. Hybrid speech recognition with deep bidirectional LSTM. In Proceedings of the 2013 IEEE Workshop on Automatic Speech Recognition and Understanding, Olomouc, Czech Republic, 8–12 December 2013. [Google Scholar]
  48. Graves, A.; Schmidhuber, J. Framewise phoneme classification with bidirectional LSTM and other neural network architectures. Neural Netw. 2005, 18, 602–610. [Google Scholar] [CrossRef]
  49. Graves, A.; Fernández, S.; Schmidhuber, J. Bidirectional LSTM networks for improved phoneme classification and recognition. In International Conference on Artificial Neural Networks; Springer: Berlin/Heidelberg, Germany, 2005. [Google Scholar]
  50. Chiu, J.P.C.; Nichols, E. Named entity recognition with bidirectional LSTM-CNNs. Trans. Assoc. Comput. Linguist. 2016, 4, 357–370. [Google Scholar] [CrossRef]
  51. Light, R.A. Mosquitto: Server and client implementation of the MQTT protocol. J. Open Source Softw. 2017, 2, 265. [Google Scholar] [CrossRef]
  52. Rattanatamrong, P.; Boonpalit, Y.; Suwanjinda, S.; Mangmeesap, A.; Subraties, K.; Daneshmand, V.; Smallen, S.; Haga, J. Overhead study of telegraf as a real-time monitoring agent. In Proceedings of the 2020 17th International Joint Conference on Computer Science and Software Engineering (JCSSE), Bangkok, Thailand, 4–6 November 2020. [Google Scholar]
  53. Naqvi, S.N.Z.; Yfantidou, S.; Zimányi, E. Time series databases and influxdb. Stud. Univ. Libre Brux. 2017, 12, 1–44. [Google Scholar]
  54. Chakraborty, M.; Kundan, A.P. Grafana. In Monitoring Cloud-Native Applications; Apress: Berkeley, CA, USA, 2021; pp. 187–240. [Google Scholar]
  55. Ash, A.; Shwartz, M. R2: A useful measure of model performance when predicting a dichotomous outcome. Stat. Med. 1999, 18, 375–384. [Google Scholar] [CrossRef]
Figure 3. Designed environment sensor module.
Electronics 12 00137 g003
Figure 4. Indoor human object detection model’s implemented data collection unit.
Electronics 12 00137 g004
Figure 5. Structure of indoor multi-environment sensor system based on intelligent edge computing.
Electronics 12 00137 g005
Figure 6. PM2.5 (indoor) prediction model.
Electronics 12 00137 g006
Figure 7. TVOC prediction model.
Electronics 12 00137 g007
Figure 8. CO 2 Prediction Model.
Electronics 12 00137 g008
Figure 9. Total environmental data monitoring system.
Electronics 12 00137 g009
Figure 10. Indoor air quality monitoring system (CO 2 , PM2.5, and TVOC). Green line: predicted data; yellow line: actual data.
Electronics 12 00137 g010
Table 1. Types and details of sensors linked to intelligent multi-environment sensor modules.
SensorsInterfaceData
SCD30I2CTemperature, humidity, CO 2
SHT35I2CTemperature, humidity
BME680I2CTemperature, humidity
SGP30I2CTVOC, eCO 2
BH1750I2CIllumination
BMP388I2CAir pressure
SEN0376I2CAlcohol
SEN0321I2COzone
SEN50135Digital TTLMotion
PMS5003UARTPM2.5, PM10 (indoor)
S-pH-01ARS-485pH
C930USBThe number of people
AirKoreaEthernetPM2.5, PM10 (outdoor)
Korea Meteorological AdministrationEthernetTemperature, humidity (outdoor)
Table 2. Human object detection benchmark.
MobileNet V2 + SSDLite
Train DatasetTest DatasetmAP
Own human datasetOwn human dataset0.62
Own human datasetAihub0.79
Own human datasetPennFudan0.80
PennFudanOwn human dataset0.19
PennFudanAihub0.76
PennFudanPennFudan0.95
AihubOwn human dataset0.10
AihubAihub0.91
AihubPennFudan0.65
Table 3. Input data of the proposed IAQ prediction model.
Prediction ModelInput ValuesUnit
PM2.5 (indoor)UTC time, day, humidity, PM10 (indoor or outdoor), PM2.5 (indoor or outdoor) μ g/m 3
TVOCUTC time, day, temperature, TVOC, PM2.5 (indoor), PM10 (indoor), eCO 2 mg/m 3
CO 2 UTC time, day, temperature, CO 2 , TVOC, PM2.5 (outdoor), PM10 (outdoor), the number of peoplemg/m 3
Table 4. Environment prediction model benchmark based on LSTM and GRU.
ArchitectureBi-Directional LSTMLSTMBi-Directional GRUGRU
Metric R 2 MAE R 2 MAE R 2 MAE R 2 MAE
PM2.50.8360.3290.8300.3330.8100.3440.8150.340
TVOC0.9900.0880.9860.1050.9870.1020.9720.147
CO 2 0.9960.0530.9910.0780.9900.0700.9900.070
Disclaimer/Publisher’s Note: The statements, opinions and data contained in all publications are solely those of the individual author(s) and contributor(s) and not of MDPI and/or the editor(s). MDPI and/or the editor(s) disclaim responsibility for any injury to people or property resulting from any ideas, methods, instructions or products referred to in the content.

