
EmSM: Ensemble Mixed Sampling Method for Classifying Imbalanced Intrusion Detection Data


Abstract
:1. Introduction
- A hybrid resampling and bagging ensemble technique that improves the prediction accuracy of the minority class while maintaining that of the majority class (Section 3);
- A method for measuring improvements to the machine learning performance on imbalanced datasets using binary and multi-classification (Section 4);
- A first-of-its-kind imbalanced data handling method that accurately identifies rare types of intrusion detection (Section 4);
- Identification of the effects of the data distribution of extracted features, applied algorithm, and class ratio on the efficiency of handling imbalanced datasets (Section 4).
2. Related Work
2.1. Intrusion Detection Data
2.2. Sampling Techniques for Handling Imbalanced Classes
2.2.1. Data-Level Methods
2.2.2. Algorithm-Level Methods
2.3. Studies on Class Imbalances in the Field of Intrusion Detection

| Year | Author | Dataset | Proposed Sampling Methods | Algorithms |
|---|---|---|---|---|
| 2016 | Sun and Liu [27] | KDD Cup 99 | SMOTE-NCL | KNN, SVM, C4.5, NB |
| 2017 | Yan et al. [28] | NSL-KDD | RA-SMOTE | SVM, BPNN, RF |
| 2019 | Tripathi and Makwana [15] | KDD Cup 99 | SMOTE+Ensemble | AdaBoost, RF |
| 2019 | Lee and Park [29] | CICIDS2017 | GAN | RF |
| 2019 | Merino et al. [30] | UGR16 | GAN | MLP |
| 2020 | Zhang et al. [31] | UNSW-NB15, CICIDS2017 | SGM_CNN | CNN, RF, MLP |
| 2020 | Bedi et al. [32] | NSL-KDD | Siamese-NN | CNN, DNN |
| 2020 | Zhang et al. [33] | NSL-KDD | ReliefF+B-SMOTE | KNN, C4.5, NB |
| 2020 | Ma and Shi [14] | NSL-KDD | AESMOTE | - |
| 2021 | Liu et al. [34] | NSL-KDD, CICIDS2018 | DSSTE | RF, SVM, XGBoost, LSTM etc. |
3. Proposed Method
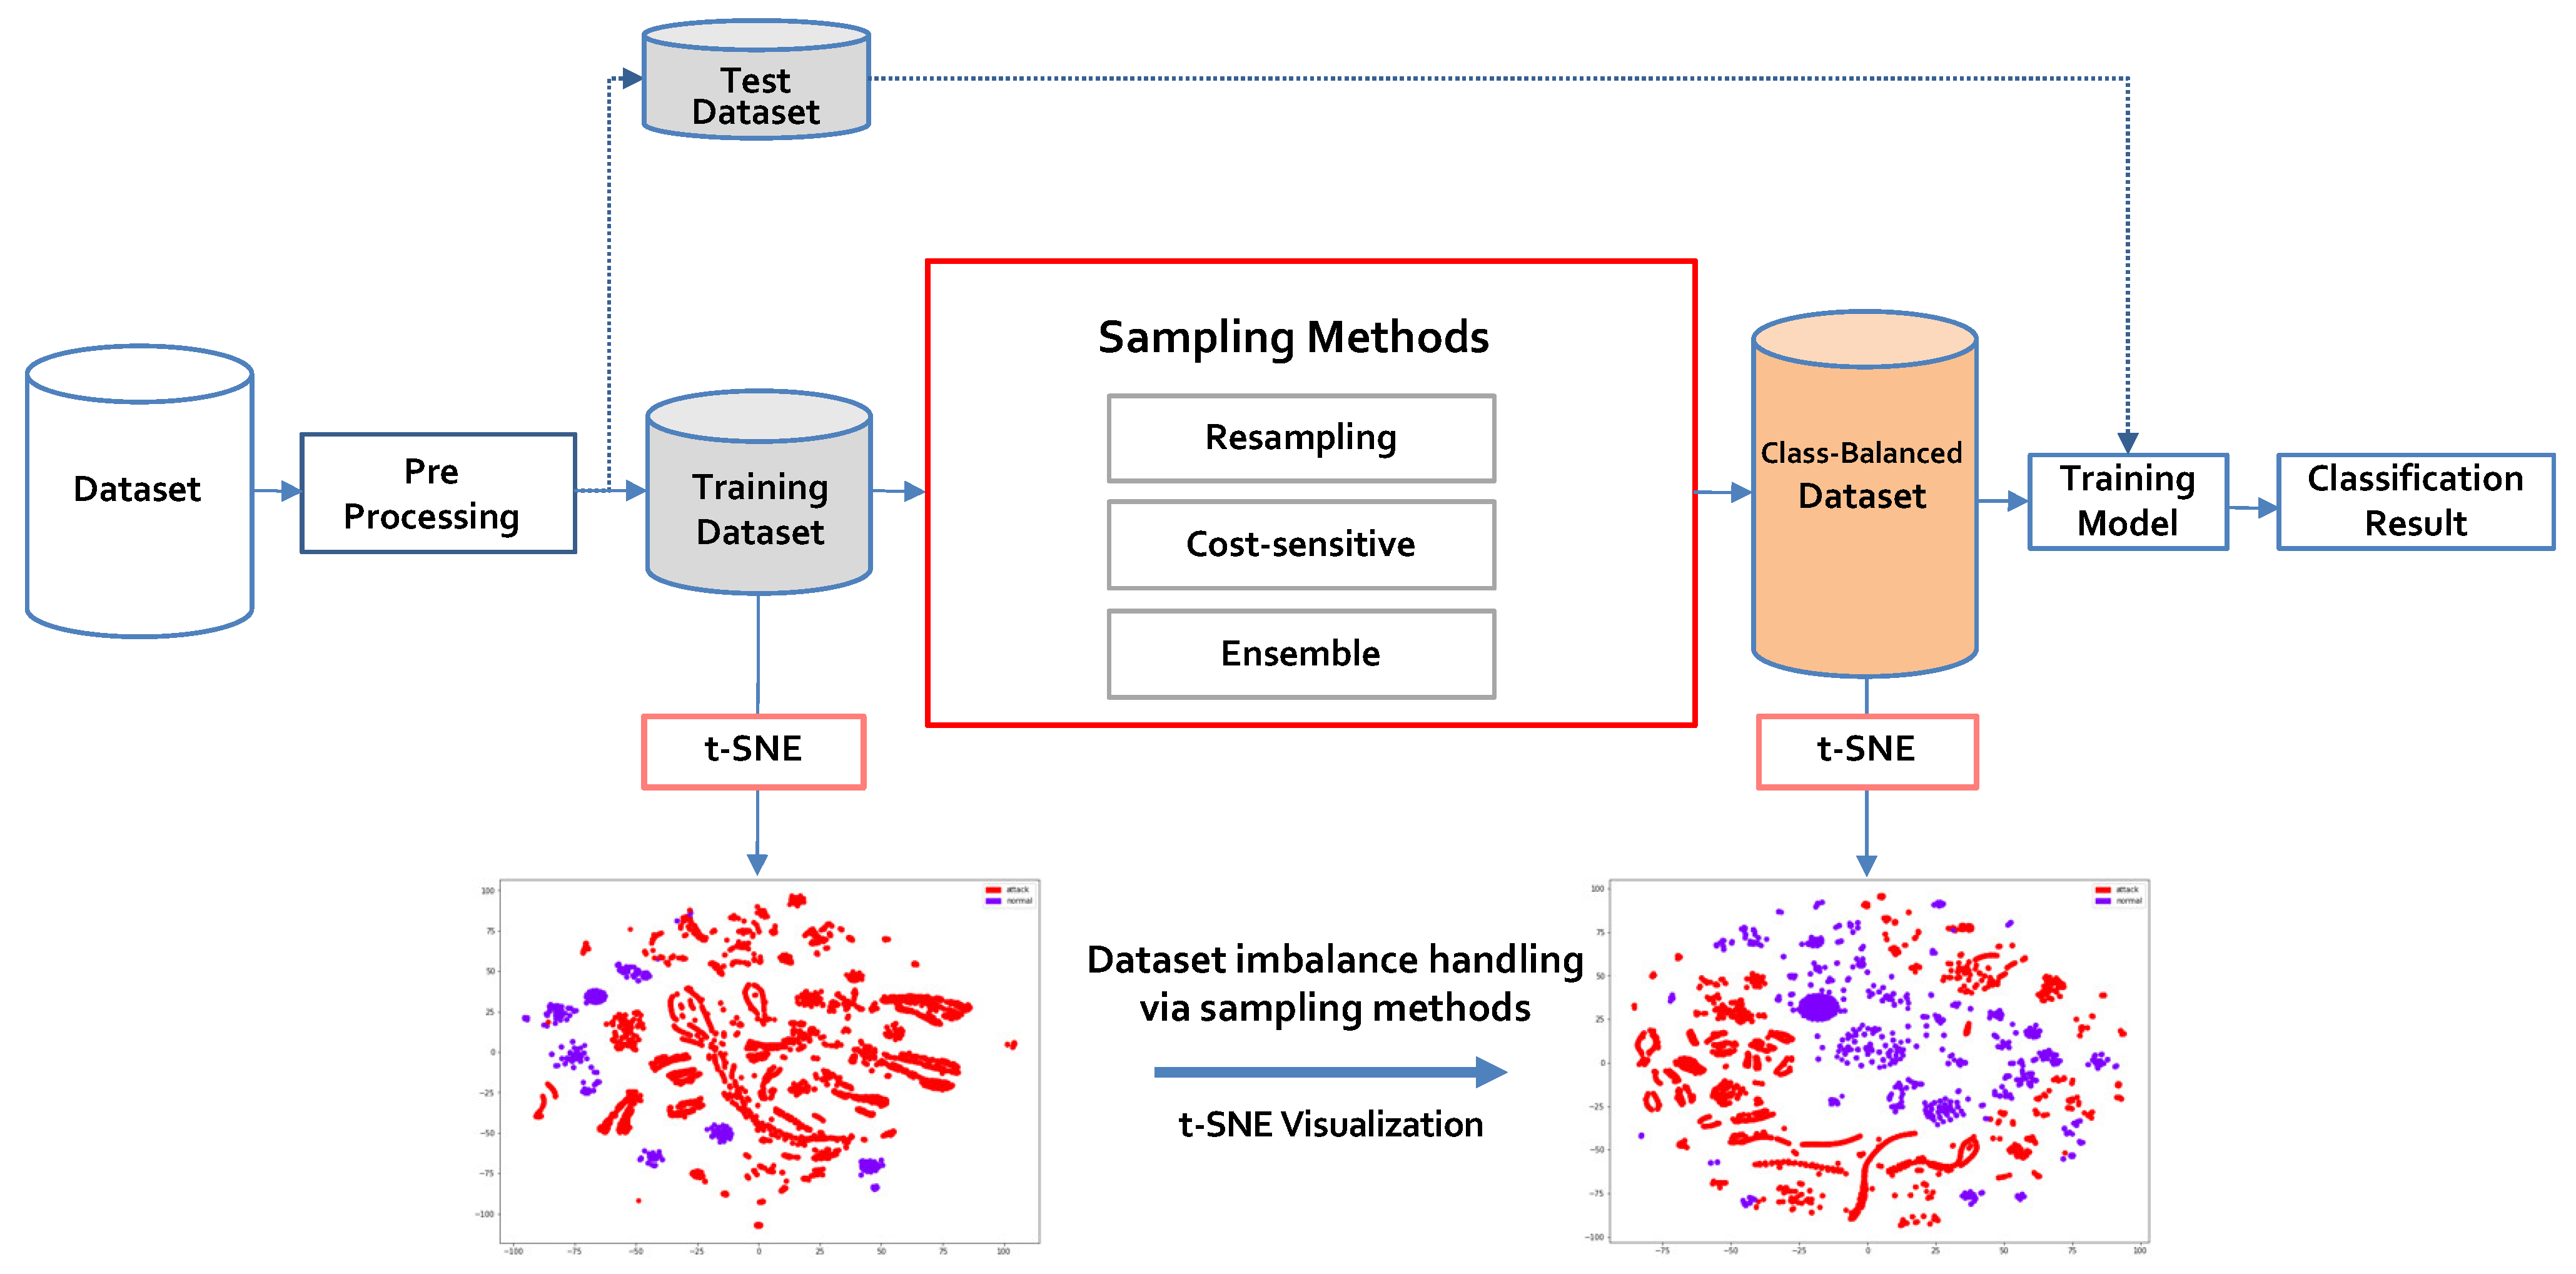
3.1. Process of the Proposed Approach
3.2. Ensemble Mixed Sampling Method
4. Experiments and Evaluation
4.1. Datasets
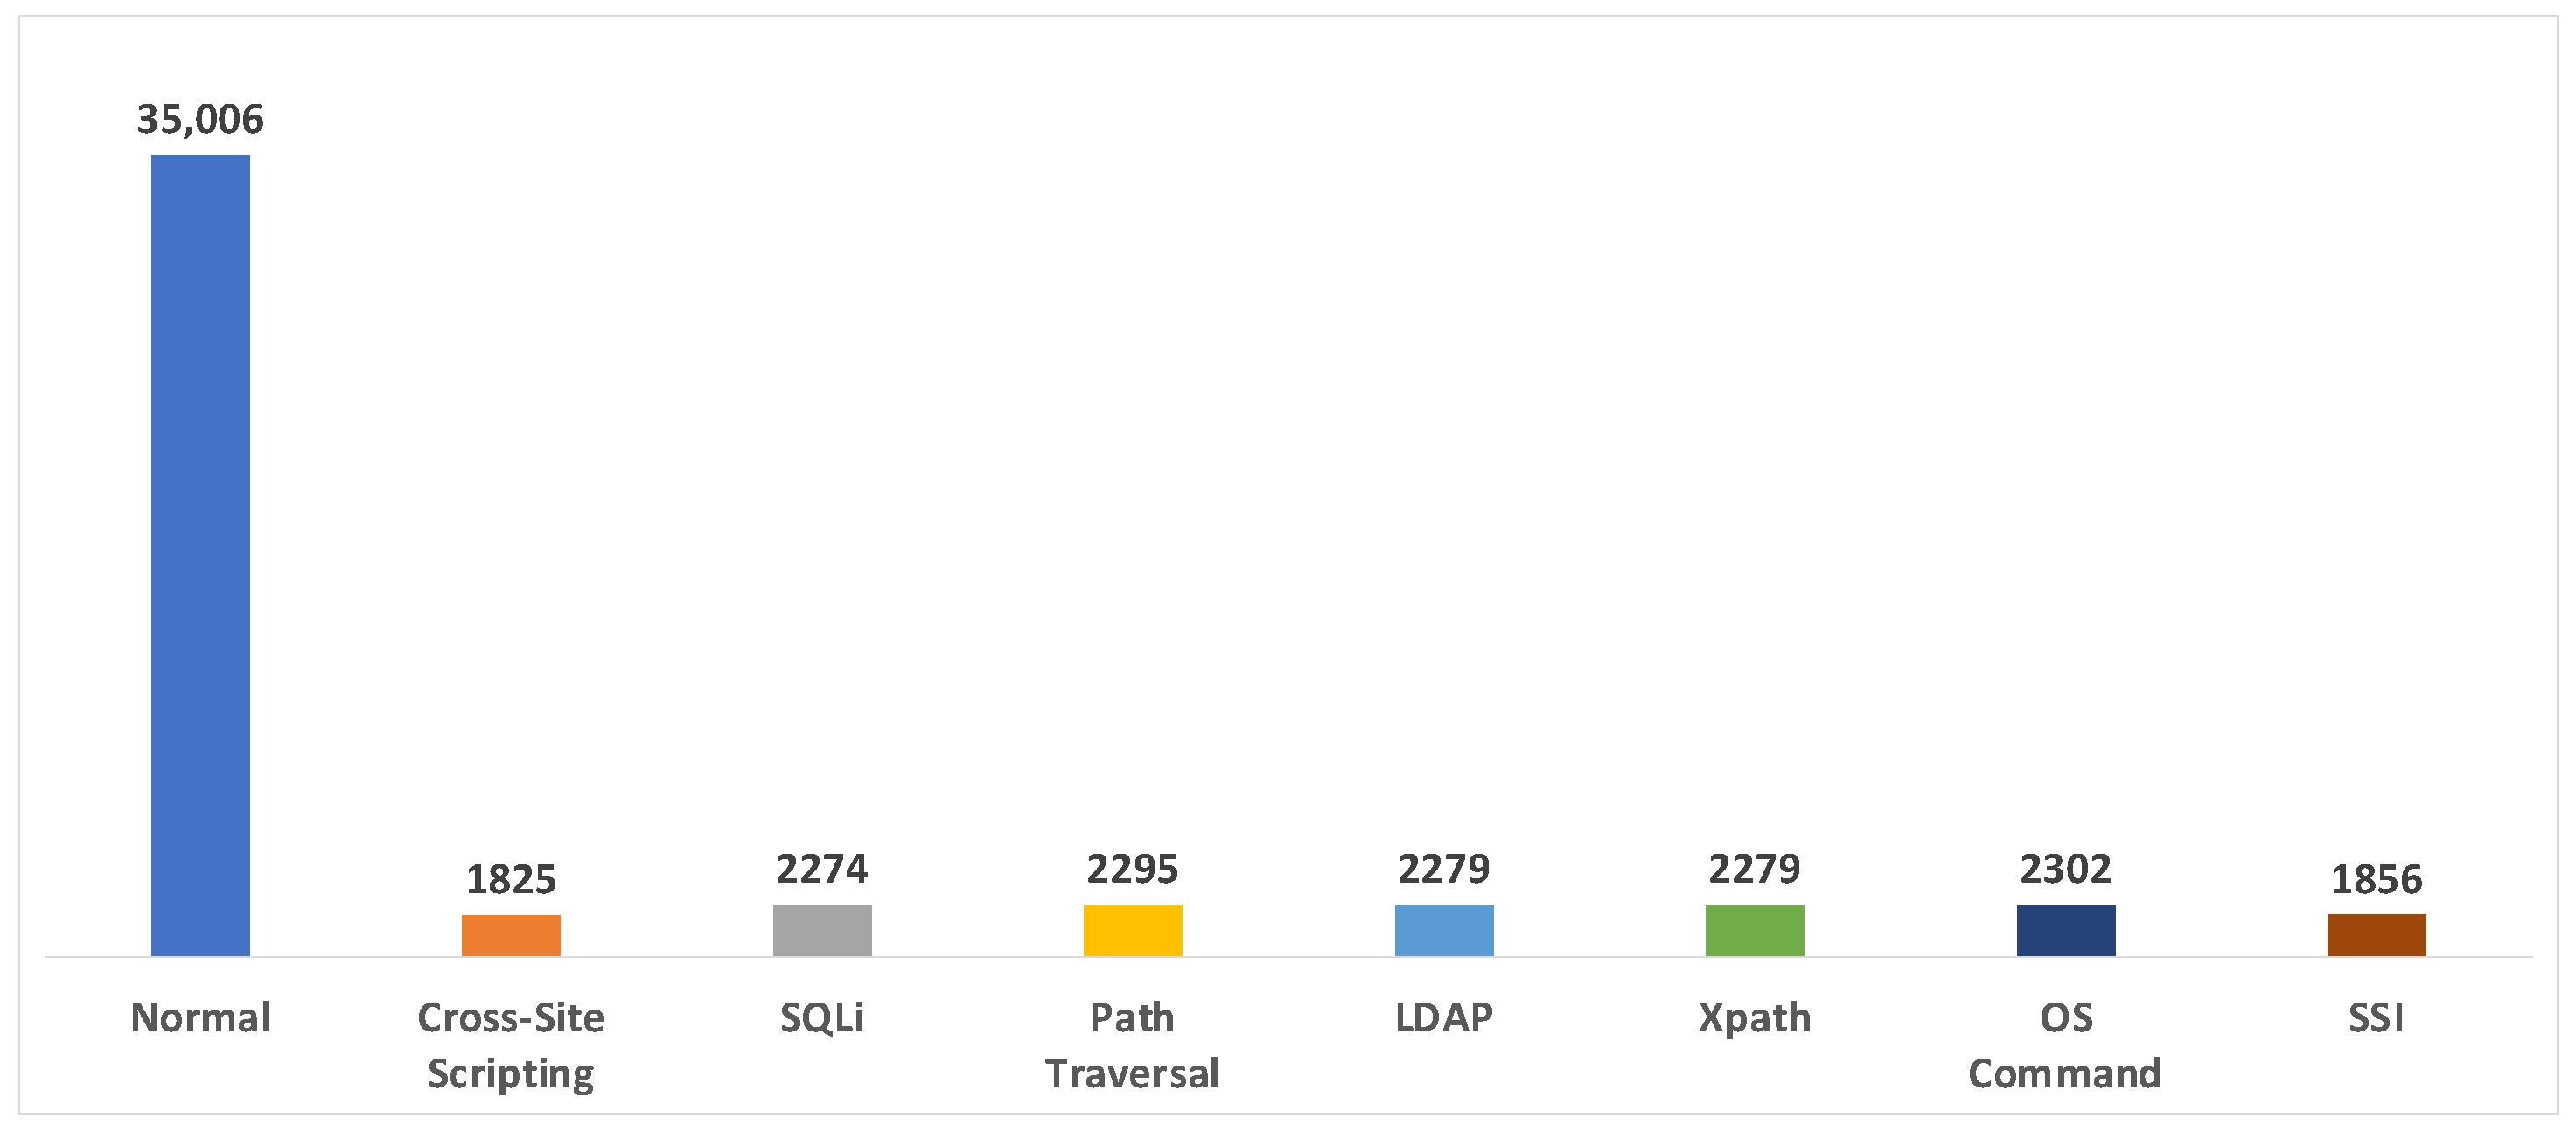
4.1.1. PKDD2007
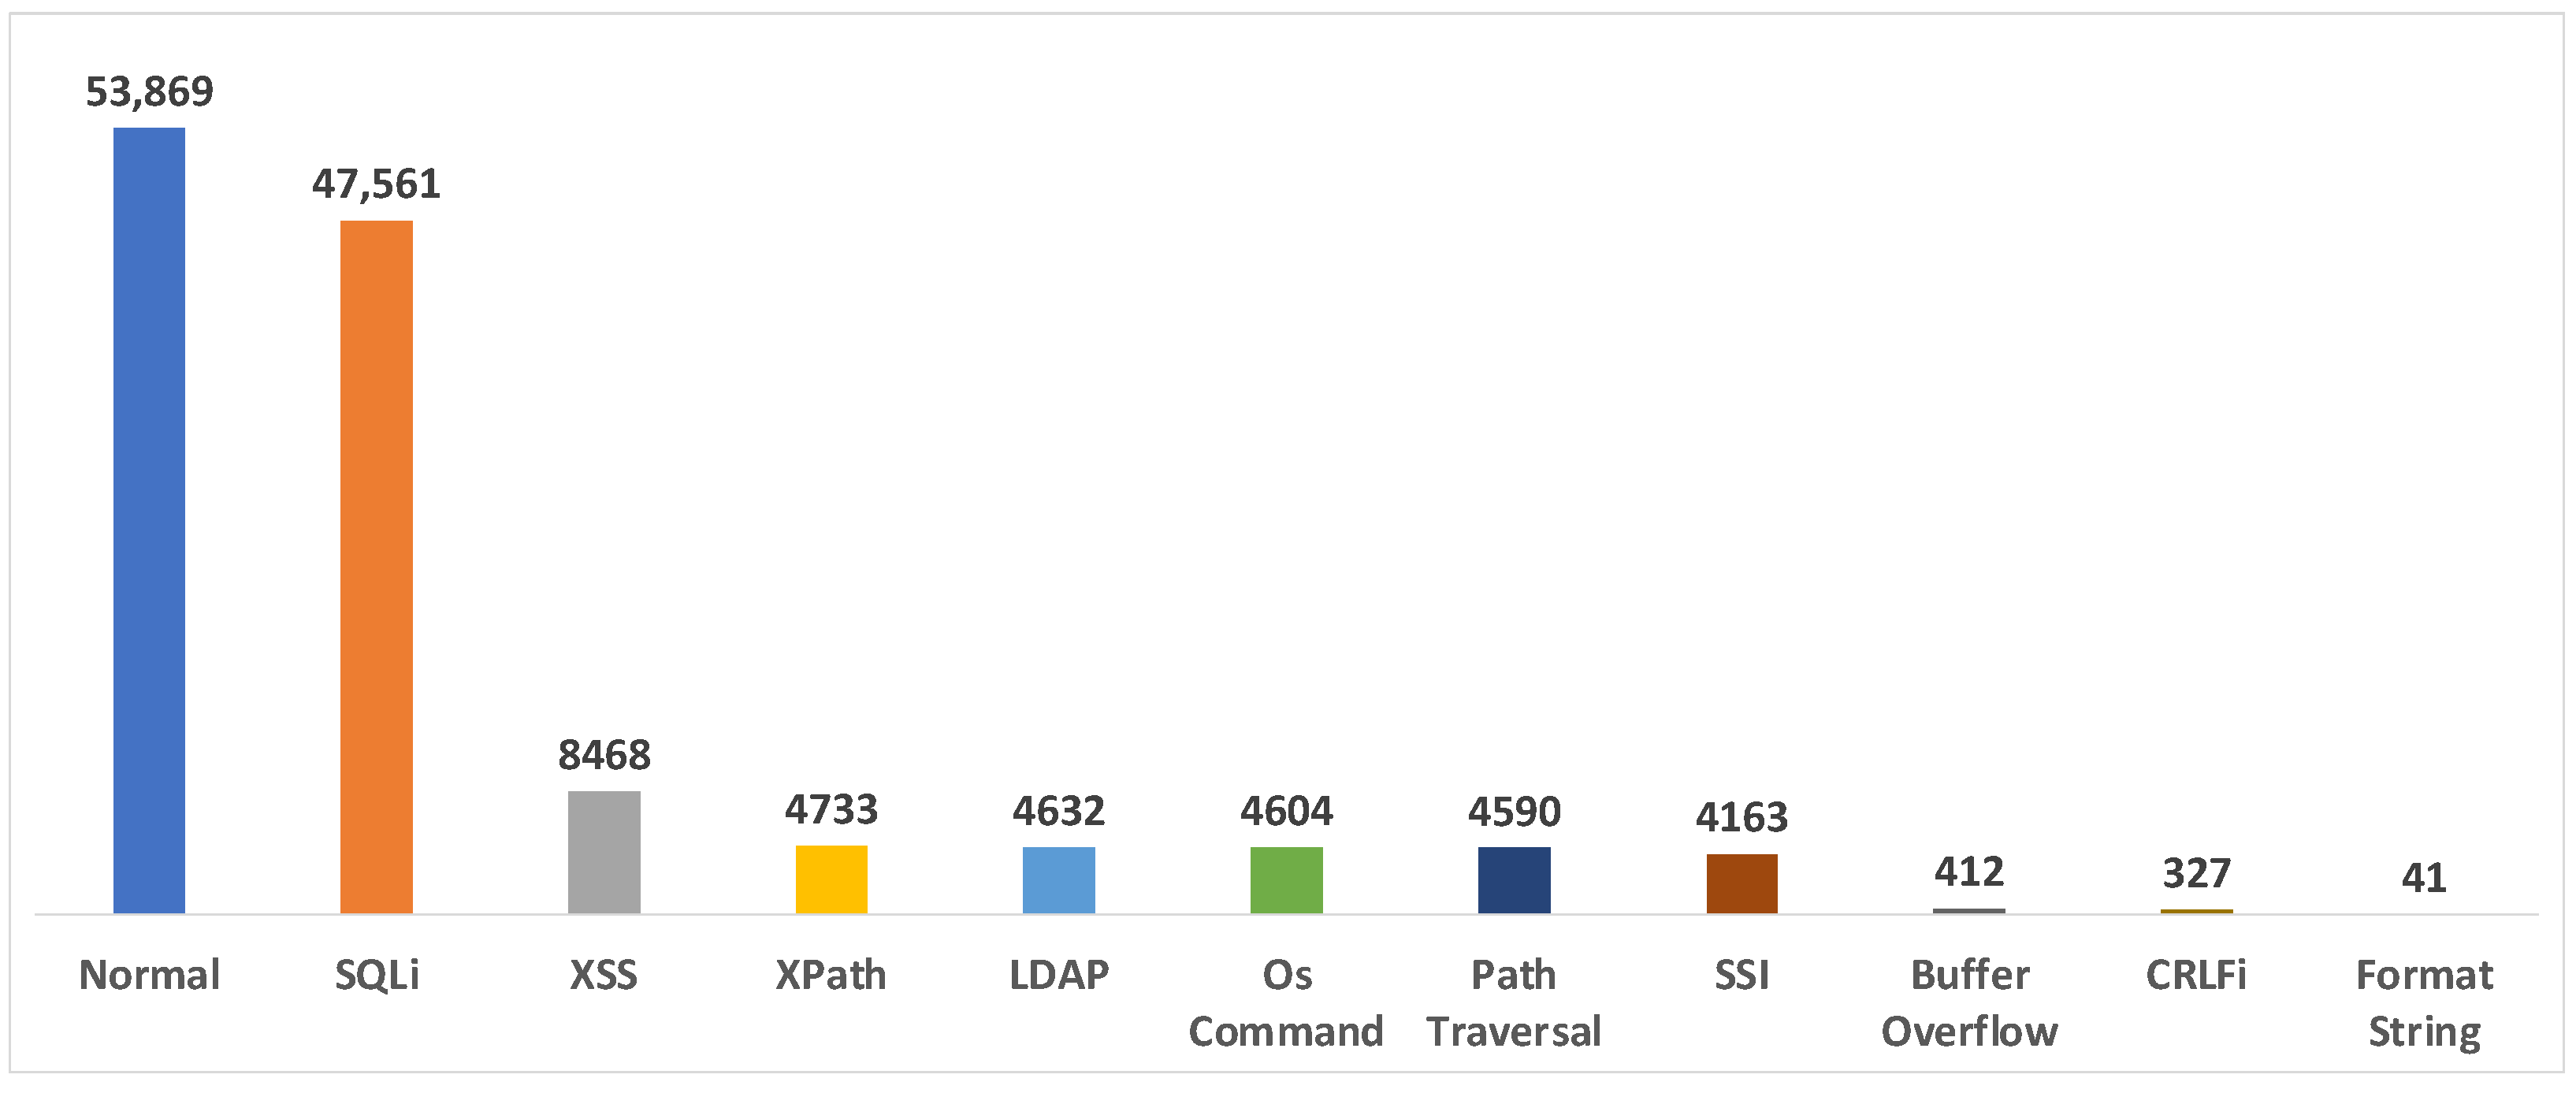
4.1.2. CSIC2012
4.2. Data Preprocessing
4.2.1. Normalization
4.2.2. Field Selection
4.2.3. Feature Extraction and Selection
4.3. Evaluation Environment and Metrics
4.4. Experimental Results
4.4.1. Scenario 1: Binary Classification
4.4.2. Scenario 2: Multi-Classification
4.4.3. Scenario 3: Comparison with Ensemble Based Algorithms
4.5. Results and Discussion
4.5.1. Results of Each Algorithm before and after Sampling
4.5.2. Results According to Attack Ratio
4.5.3. Results According to Data Distribution
5. Conclusions and Future Work
Author Contributions
Funding
Data Availability Statement
Conflicts of Interest
References
- Hussain, A.; Mohamed, A.; Razali, S. A Review on Cybersecurity: Challenges & Emerging Threats. In Proceedings of the 3rd International Conference on Networking, Information Systems & Security, ACM, Marrakech, Morocco, 31 March 2020; pp. 1–7. [Google Scholar]
- Ibor, A.E.; Oladeji, F.A.; Okunoye, O.B. A survey of cyber security approaches for attack detection, prediction, and prevention. Int. J. Secur. Its Appl. 2018, 12, 15–28. [Google Scholar] [CrossRef]
- Khraisat, A.; Gondal, I.; Vamplew, P.; Kamruzzaman, J. Survey of intrusion detection systems: Techniques, datasets and challenges. Cybersecurity 2019, 2, 20. [Google Scholar] [CrossRef]
- Pachghare, V.K.; Khatavkar, V.K.; Kulkarni, P.A. Pattern based network security using semi-supervised learning. International J. Inf. Netw. Secur. 2012, 1, 228–234. [Google Scholar] [CrossRef]
- Lateef, A.A.A.; Al-Janabi, S.T.F.; Al-Khateeb, B. Survey on intrusion detection systems based on deep learning. Period. Eng. Nat. Sci. 2019, 7, 1074. [Google Scholar] [CrossRef] [Green Version]
- Johnson, J.M.; Khoshgoftaar, T.M. Survey on deep learning with class imbalance. J. Big Data 2019, 6, 27. [Google Scholar] [CrossRef]
- KDD Cup 1999 Data. Available online: http://kdd.ics.uci.edu/databases/kddcup99/kddcup99.html (accessed on 27 February 2022).
- IDS 2017 Datasets Research Canadian Institute for Cybersecurity UNB. Available online: https://www.unb.ca/cic/datasets/ids-2017.html (accessed on 27 February 2022).
- CSIC2012. Available online: https://www.tic.itefi.csic.es/torpeda/datasets.html (accessed on 27 February 2022).
- The NSL-KDD Data Set. Available online: https://web.archive.org/web/20150205070216/http:/nsl.cs.unb.ca/NSL-KDD/ (accessed on 28 February 2022).
- ECML/PKDD Workshop. Available online: http://www.lirmm.fr/pkdd2007-challenge/index.html#dataset (accessed on 28 February 2022).
- Fernández, A.; García, S.; Galar, M.; Prati, R.C.; Krawczyk, B.; Herrera, F. Learning from Imbalanced Data Sets; Springer International Publishing: Cham, Switzerland, 2018; ISBN 978-3-319-98073-7. [Google Scholar]
- Tavassoli, S.; Koosha, H. Hybrid Ensemble Learning Approaches to Customer Churn Prediction. Kybernetes 2022, 51, 1062–1088. [Google Scholar] [CrossRef]
- Ma, X.; Shi, W. AESMOTE: Adversarial reinforcement learning with SMOTE for anomaly detection. IEEE Trans. Netw. Sci. Eng. 2021, 8, 943–956. [Google Scholar] [CrossRef]
- Tripathi, P.; Makwana, R.R.S. An ensemble classification approach with selective under and over sampling of imbalance intrusion detection dataset. Int. J. Secur. Its Appl. 2019, 13, 41–50. [Google Scholar] [CrossRef]
- Zhang, G.; Wang, X.; Li, R.; Song, Y.; He, J.; Lai, J. Network intrusion detection based on conditional Wasserstein generative adversarial network and cost-sensitive stacked autoencoder. IEEE Access 2020, 8, 190431–190447. [Google Scholar] [CrossRef]
- Two Modifications of CNN. IEEE Trans. Syst. Man Cybern. 1976, SMC-6, 769–772. [CrossRef] [Green Version]
- Sáez, J.A.; Luengo, J.; Stefanowski, J.; Herrera, F. SMOTE–IPF: Addressing the noisy and borderline examples problem in imbalanced classification by a re-sampling method with filtering. Inf. Sci. 2015, 291, 184–203. [Google Scholar] [CrossRef]
- Dong, Y.; Wang, X. A New Over-Sampling Approach: Random-SMOTE for Learning from Imbalanced Data Sets. In Knowledge Science, Engineering and Management; Xiong, H., Lee, W.B., Eds.; Lecture Notes in Computer Science; Springer: Berlin/Heidelberg, Germany, 2011; Volume 7091, pp. 343–352. ISBN 978-3-642-25974-6. [Google Scholar]
- Han, H.; Wang, W.-Y.; Mao, B.-H. Borderline-SMOTE: A New Over-Sampling Method in Imbalanced Data Sets Learning. In Advances in Intelligent Computing; Huang, D.-S., Zhang, X.-P., Huang, G.-B., Eds.; Lecture Notes in Computer Science; Springer: Berlin/Heidelberg, Germany, 2005; Volume 3644, pp. 878–887. ISBN 978-3-540-28226-6. [Google Scholar]
- He, H.; Bai, Y.; Garcia, E.A. Shutao Li ADASYN: Adaptive Synthetic Sampling Approach for Imbalanced Learning. In Proceedings of the 2008 IEEE International Joint Conference on Neural Networks (IEEE World Congress on Computational Intelligence), Hong Kong, China, 1–8 June 2008; IEEE: Piscataway, NJ, USA; pp. 1322–1328. [Google Scholar]
- Chawla, N.V.; Lazarevic, A.; Hall, L.O.; Bowyer, K.W. SMOTEBoost: Improving Prediction of the Minority Class in Boosting. In Knowledge Discovery in Databases: PKDD 2003; Lavrač, N., Gamberger, D., Todorovski, L., Blockeel, H., Eds.; Lecture Notes in Computer Science; Springer: Berlin/Heidelberg, Germany, 2003; Volume 2838, pp. 107–119. ISBN 978-3-540-20085-7. [Google Scholar]
- Freund, Y.; Schapire, R. A Short Introduction to Boosting. J.-Jpn. Soc. Artif. Intell. 1999, 14, 1612. [Google Scholar]
- Fan, W.; Stolfo, S.; Zhang, J.; Chan, P. AdaCost: Misclassification Cost-Sensitive Boosting. Int. Conf. Mach. Learn. 1999, 99, 97–105. [Google Scholar]
- Joshi, M.V.; Kumar, V.; Agarwal, R.C. Evaluating Boosting Algorithms to Classify Rare Classes: Comparison and Improvements. In Proceedings of the 2001 IEEE International Conference on Data Mining, San Jose, CA, USA, 29 November–2 December 2001; IEEE: Piscataway, NJ, USA; pp. 257–264. [Google Scholar]
- Wu, G.; Chang, E.Y. Class-Boundary Alignment for Imbalanced Dataset Learning. In Proceedings of the ICML 2003 Workshop on Learning from Imbalanced Data Sets II, Washington, DC, USA, 21 August 2003; pp. 49–56. [Google Scholar]
- Sun, Y.; Liu, F. SMOTE-NCL: A Re-Sampling Method with Filter for Network Intrusion Detection. In Proceedings of the 2nd IEEE International Conference on Computer and Communications (ICCC), Chengdu, China, 14–17 October 2016; pp. 1157–1161. [Google Scholar]
- Yan, B.; Han, G.; Sun, M.; Ye, S. A Novel Region Adaptive SMOTE Algorithm for Intrusion Detection on Imbalanced Problem. In Proceedings of the 3rd IEEE International Conference on Computer and Communications (ICCC), Chengdu, China, 13–16 December 2017; pp. 1281–1286. [Google Scholar]
- Lee, J.; Park, K. GAN-based imbalanced data intrusion detection system. Pers. Ubiquitous Comput. 2021, 25, 121–128. [Google Scholar] [CrossRef]
- Merino, T.; Stillwell, M.; Steele, M.; Coplan, M.; Patton, J.; Stoyanov, A.; Deng, L. Expansion of Cyber Attack Data from Unbalanced Datasets Using Generative Adversarial Networks. In Software Engineering Research, Management and Applications; Lee, R., Ed.; Studies in Computational Intelligence; Springer International Publishing: Cham, Switzerland, 2019; Volume 845, pp. 131–145. ISBN 978-3-030-24343-2. [Google Scholar]
- Zhang, H.; Huang, L.; Wu, C.Q.; Li, Z. An effective convolutional neural network based on SMOTE and Gaussian mixture model for intrusion detection in imbalanced dataset. Comput. Netw. 2020, 177, 107315. [Google Scholar] [CrossRef]
- Bedi, P.; Gupta, N.; Jindal, V. Siam-IDS: Handling class imbalance problem in intrusion detection systems using Siamese neural network. Proc. Comput. Sci. 2020, 171, 780–789. [Google Scholar] [CrossRef]
- Zhang, J.; Zhang, Y.; Li, K. A Network Intrusion Detection Model Based on the Combination of ReliefF and Borderline-SMOTE. In Proceedings of the 4th High Performance Computing and Cluster Technologies Conference & 3rd International Conference on Big Data and Artificial Intelligence, ACM, Qingdao, China, 3 July 2020; pp. 199–203. [Google Scholar]
- Liu, L.; Wang, P.; Lin, J.; Liu, L. Intrusion detection of imbalanced network traffic based on machine learning and deep learning. IEEE Access 2021, 9, 7550–7563. [Google Scholar] [CrossRef]
- Jung, I.; Lim, J.; Kim, H.K. PF-TL: Payload feature-based transfer learning for dealing with the lack of training data. Electronics 2021, 10, 1148. [Google Scholar] [CrossRef]
- Pastrana, S.; Torrano-Gimenez, C.; Nguyen, H.T.; Orfila, A. Anomalous Web Payload Detection: Evaluating the Resilience of 1-Grams Based Classifiers. In Intelligent Distributed Computing VIII; Camacho, D., Braubach, L., Venticinque, S., Badica, C., Eds.; Studies in Computational Intelligence; Springer International Publishing: Cham, Switzerland, 2015; Volume 570, pp. 195–200. ISBN 978-3-319-10421-8. [Google Scholar]
- Torrano-Gimenez, C.; Nguyen, H.T.; Alvarez, G.; Petrovic, S.; Franke, K. Applying Feature Selection to Payload-Based Web Application Firewalls. In Proceedings of the 2011 Third International Workshop on Security and Communication Networks (IWSCN), Gjovik, Norway, 18–20 May 2011; IEEE: Piscataway, NJ, USA; pp. 75–81. [Google Scholar]
- Kubat, M.; Matwin, S. Addressing the curse of imbalanced training sets: One-sided selection. In Proceedings of the 14th International Conference on Machine Learning, San Francisco, CA, USA, 8–12 July 1997; Volume 7, pp. 179–186. [Google Scholar]


| Dataset | Imbalance Ratio |
|---|---|
| DARPA/KDD Cup 99 [7] | 36,725 |
| CICIDS2017 [8] | 112,287 |
| CSIC2012 [9] | 1160 |
| NSL-KDD [10] | 648 |
| PKDD2007 [11] | 18 |
| Dataset | Public | HTTP | Labeled | Payload | Class | Metadata | Year | Balance | IR * |
|---|---|---|---|---|---|---|---|---|---|
| DARPA/KDD Cup 99 [7] | O | - | O | X | 4 | X | 1998 | X | 36,725 |
| NSL-KDD [10] | O | - | O | X | 4 | X | 2009 | X | 648 |
| CICIDS2017 [8] | O | △ | O | △ | 6 | O | 2017 | X | 112,287 |
| PKDD2007 [11] | O | O | O | O | 8 | O | 2007 | O | 18 |
| CSIC2010 [9] | O | O | O | O | 2 | O | 2010 | X | 1160 |
| CSIC2012 [9] | O | O | O | O | 10 | O | 2012 | X | 1160 |
| Datasets | Category | Payload | Labeled | Binary Class (Normal/Attack) | Multi Class (Attack Type) | Source | Balanced | IR |
|---|---|---|---|---|---|---|---|---|
| PKDD2007 | WAF * | O | O | 50,116 (35,006/15,110) | XSS SQL Injection LDAP Injection XPATH Injection Path Traversal Command Extraction SSL Attack | ECML/PKDD | O | 18 |
| CSIC2012 | WAF * | O | O | 65,767 (8363/57,404) | XSS SQLi Buffer Overflow LDAP XPath FormatString SSI CRLFi Anomalous | CSIC/TORPEDA | X | 1160 |
| DATASET | Label | BASE | RUS | ENN | TOMEK | ROS | SMOTE | B-SMOTE | ADASYN | SMOTE +ENN | SMOTE +TOMEK |
|---|---|---|---|---|---|---|---|---|---|---|---|
| CSIC2012 | Attack | 39,449 | 6691 | 6685 | 39,449 | 39,449 | 39,449 | 39,449 | 39,449 | 39,446 | 39,449 |
| Normal | 6691 | 6691 | 6691 | 6691 | 39,449 | 39,449 | 39,449 | 39,451 | 39,449 | 39,449 | |
| PKDD2007 | Attack | 36,405 | 24,179 | 25,239 | 35,789 | 36,405 | 36,405 | 36,405 | 36,405 | 23,630 | 35,906 |
| Normal | 24,179 | 24,179 | 24,179 | 24,179 | 36,405 | 36,405 | 36,405 | 37,296 | 26,009 | 35,906 |
| DATASET | Label | BASE | RUS | ENN | TOMEK | ROS | SMOTE | B-SMOTE | ADASYN | SMOTE +ENN | SMOTE +TOMEK |
|---|---|---|---|---|---|---|---|---|---|---|---|
| CSIC2012 | Accuracy | 0.9994 | 0.9991 | 0.9992 | 0.9990 | 0.9999 | 0.9999 | 0.9997 | 0.9997 | 0.9997 | 0.9999 |
| FPR | 0.0024 | 0.0006 | 0.0036 | 0.0054 | 0.0000 | 0.0000 | 0.0000 | 0.0000 | 0.0000 | 0.0000 | |
| G-mean | 0.9987 | 0.9992 | 0.9981 | 0.9972 | 0.9999 | 0.9999 | 0.9998 | 0.9998 | 0.9998 | 0.9999 | |
| F1-score | 0.9996 | 0.9995 | 0.9995 | 0.9994 | 0.9999 | 0.9999 | 0.9998 | 0.9998 | 0.9998 | 0.9999 | |
| PKDD2007 | Accuracy | 0.8865 | 0.8741 | 0.8524 | 0.8857 | 0.8749 | 0.8544 | 0.8400 | 0.8772 | 0.8718 | 0.8809 |
| FPR | 0.0203 | 0.0596 | 0.1182 | 0.0160 | 0.0682 | 0.1137 | 0.1521 | 0.0441 | 0.6054 | 0.0343 | |
| G-mean | 0.8549 | 0.8532 | 0.8442 | 0.8520 | 0.8575 | 0.8454 | 0.8380 | 0.8515 | 0.8481 | 0.8529 | |
| F1-score | 0.8398 | 0.8306 | 0.8137 | 0.8375 | 0.8342 | 0.8154 | 0.8051 | 0.8313 | 0.8256 | 0.8346 |
| DATASET | Label | BASE | RUS | ENN | TOMEK | ROS | SMOTE | B-SMOTE | ADASYN | SMOTE +ENN | SMOTE +TOMEK |
|---|---|---|---|---|---|---|---|---|---|---|---|
| CSIC2012 | XPath | 143 | 33 | 75 | 142 | 34,351 | 34,351 | 34,351 | 34,343 | 32,701 | 34,351 |
| XSS | 3907 | 33 | 3382 | 3894 | 34,351 | 34,351 | 34,351 | 34,326 | 33,532 | 34,351 | |
| B/O * | 324 | 33 | 228 | 319 | 34,351 | 34,351 | 34,351 | 34,344 | 31,650 | 34,351 | |
| SQLi | 34.351 | 33 | 34,128 | 34,350 | 34,351 | 34,351 | 34,351 | 34,351 | 34,079 | 34,351 | |
| SSI | 371 | 33 | 126 | 366 | 34,351 | 34,351 | 34,351 | 34,377 | 33,676 | 34,351 | |
| F/S * | 33 | 33 | 33 | 33 | 34,351 | 34,351 | 34,351 | 34,355 | 32,917 | 34,351 | |
| LDAPi | 62 | 33 | 8 | 56 | 34,351 | 34,351 | 34,351 | 34,359 | 30,899 | 34,351 | |
| CRLFi | 258 | 33 | 65 | 256 | 34,351 | 34,351 | 34,351 | 34,326 | 33,751 | 34,351 |
| BASE | RUS | ENN | TOMEK | ROS | SMOTE | B-SMOTE | ADASYN | SMOTE +ENN | SMOTE +TOMEK | |
|---|---|---|---|---|---|---|---|---|---|---|
| F/S_RF * | 0.8655 | 0.9983 | 0.8656 | 0.9991 | 0.8657 | 0.9997 | 0.9997 | 0.9997 | 0.9998 | 0.9997 |
| LDAPi_RF | 0.9253 | 0.9245 | 0.8864 | 0.8861 | 0.9258 | 0.8864 | 0.8864 | 0.8452 | 0.8864 | 0.8864 |
| SQLi_RF | 0.9886 | 0.9588 | 0.9981 | 0.9853 | 0.9986 | 0.9988 | 0.9988 | 0.9988 | 0.9988 | 0.9988 |
| XSS_RF | 0.9479 | 0.8693 | 0.9851 | 0.9452 | 0.9878 | 0.9894 | 0.9893 | 0.9894 | 0.9909 | 0.9894 |
| F/S_XGBoost * | 0.8660 | 0.7785 | 1.0000 | 0.7906 | 1.0000 | 1.0000 | 1.0000 | 0.9999 | 0.9999 | 1.0000 |
| LDAPi_XGBoost | 0.9258 | 0.9192 | 0.9258 | 0.9258 | 0.9258 | 0.8864 | 0.9258 | 0.6545 | 0.8864 | 0.8864 |
| SQLi_XGBoost | 0.9986 | 0.8724 | 0.9976 | 0.9969 | 0.999 | 0.9991 | 0.9991 | 0.9972 | 0.9991 | 0.9991 |
| XSS_XGBoost | 0.9922 | 0.9488 | 0.9868 | 0.9869 | 0.9885 | 0.9896 | 0.9917 | 0.9844 | 0.9922 | 0.9896 |
| F/S_MLP * | 0.5000 | 0.5587 | 0.7071 | 0.3535 | 0.9998 | 0.9997 | 0.999 | 0.7905 | 0.9998 | 0.9997 |
| LDAPi_MLP | 0.8864 | 0.5695 | 0.8863 | 0.8863 | 0.8864 | 0.8864 | 0.7071 | 0.6546 | 0.8858 | 0.8863 |
| SQLi_MLP | 0.9988 | 0.0000 | 0.9985 | 0.9985 | 0.999 | 0.9991 | 0.9984 | 0.9985 | 0.999 | 0.9991 |
| XSS_MLP | 0.9841 | 0.5793 | 0.9793 | 0.9831 | 0.9821 | 0.9801 | 0.9728 | 0.984 | 0.9801 | 0.9790 |
| BASE | RUS | ENN | TOMEK | ROS | SMOTE | B-SMOTE | ADASYN | SMOTE +ENN | SMOTE +TOMEK | |
|---|---|---|---|---|---|---|---|---|---|---|
| F/S_RF | 0.4444 | 0.2857 | 0.4615 | 0.4324 | 0.5217 | 0.6667 | 0.6667 | 0.6957 | 0.7619 | 0.6667 |
| LDAPi_RF | 0.6154 | 0.4068 | 0.8800 | 0.6875 | 0.9231 | 0.8800 | 0.8800 | 0.8333 | 0.8800 | 0.8800 |
| SQLi_RF | 0.9890 | 0.9579 | 0.9994 | 0.9856 | 0.9990 | 0.9990 | 0.9990 | 0.9990 | 0.9990 | 0.9990 |
| XSS_RF | 0.9418 | 0.8590 | 0.9821 | 0.9339 | 0.9853 | 0.9880 | 0.9869 | 0.9874 | 0.9880 | 0.9880 |
| F/S_XGBoost | 0.8571 | 0.0277 | 1.0000 | 0.7692 | 0.9412 | 0.9412 | 1.0000 | 0.8889 | 0.8889 | 0.9412 |
| LDAPi_XGBoost | 0.9231 | 0.1257 | 0.9231 | 0.9231 | 0.9231 | 0.8462 | 0.9231 | 0.4444 | 0.8462 | 0.8800 |
| SQLi_XGBoost | 0.9995 | 0.8647 | 0.9992 | 0.9990 | 0.9991 | 0.9991 | 0.9991 | 0.9974 | 0.9991 | 0.9991 |
| XSS_XGBoost | 0.9870 | 0.9475 | 0.9853 | 0.9817 | 0.9884 | 0.9895 | 0.9916 | 0.9694 | 0.9895 | 0.9895 |
| F/S_MLP | 0.3636 | 0.0031 | 0.6154 | 0.2000 | 0.8000 | 0.6667 | 0.4103 | 0.6250 | 0.8000 | 0.6957 |
| LDAPi_MLP | 0.8462 | 0.0093 | 0.8148 | 0.8148 | 0.8800 | 0.8462 | 0.6364 | 0.5217 | 0.5366 | 0.7857 |
| SQLi_MLP | 0.9996 | 0.0000 | 0.9995 | 0.9995 | 0.9991 | 0.9991 | 0.9984 | 0.9985 | 0.9990 | 0.9991 |
| XSS_MLP | 0.9714 | 0.1873 | 0.9767 | 0.9759 | 0.9815 | 0.9799 | 0.9636 | 0.9704 | 0.9799 | 0.9783 |
Publisher’s Note: MDPI stays neutral with regard to jurisdictional claims in published maps and institutional affiliations. |
© 2022 by the authors. Licensee MDPI, Basel, Switzerland. This article is an open access article distributed under the terms and conditions of the Creative Commons Attribution (CC BY) license (https://creativecommons.org/licenses/by/4.0/).
Share and Cite
Jung, I.; Ji, J.; Cho, C. EmSM: Ensemble Mixed Sampling Method for Classifying Imbalanced Intrusion Detection Data. Electronics 2022, 11, 1346. https://doi.org/10.3390/electronics11091346
Jung I, Ji J, Cho C. EmSM: Ensemble Mixed Sampling Method for Classifying Imbalanced Intrusion Detection Data. Electronics. 2022; 11(9):1346. https://doi.org/10.3390/electronics11091346
Chicago/Turabian StyleJung, Ilok, Jaewon Ji, and Changseob Cho. 2022. "EmSM: Ensemble Mixed Sampling Method for Classifying Imbalanced Intrusion Detection Data" Electronics 11, no. 9: 1346. https://doi.org/10.3390/electronics11091346
APA StyleJung, I., Ji, J., & Cho, C. (2022). EmSM: Ensemble Mixed Sampling Method for Classifying Imbalanced Intrusion Detection Data. Electronics, 11(9), 1346. https://doi.org/10.3390/electronics11091346