Article

PM2.5 Concentration Measurement Based on Image Perception

1
School of Transportation and Civil Engineering, Nantong University, Nantong 226019, China
2
School of Computer Science, Wuhan University, Wuhan 430072, China
*
Author to whom correspondence should be addressed.
Electronics 2022, 11(9), 1298; https://doi.org/10.3390/electronics11091298
Submission received: 14 March 2022 / Revised: 4 April 2022 / Accepted: 5 April 2022 / Published: 20 April 2022

Abstract

:
PM2.5 in the atmosphere causes severe air pollution and dramatically affects the normal production and lives of residents. The real-time monitoring of PM2.5 concentrations has important practical significance for the construction of ecological civilization. The mainstream PM2.5 concentration prediction algorithms based on electrochemical sensors have some disadvantages, such as high economic cost, high labor cost, time delay, and more. To this end, we propose a simple and effective PM2.5 concentration prediction algorithm based on image perception. Specifically, the proposed method develops a natural scene statistical prior to estimating the saturation loss caused by the ’haze’ formed by PM2.5. After extracting the prior features, this paper uses the feedforward neural network to achieve the mapping function from the proposed prior features to the PM2.5 concentration values. Experiments constructed on the public Air Quality Image Dataset (AQID) show the superiority of our proposed PM2.5 concentration measurement method compared to state-of-the-art related PM2.5 concentration monitoring methods.

1. Introduction

With the rapid development of society and the further acceleration of energy consumption, the atmospheric environmental quality is also severely affected. Particulate matter is one of the major pollutants causing air pollution, especially PM2.5, which has become the primary pollutant in most cities. PM2.5 is seriously harmful to both people’s health and the ecological environment [1,2,3,4]. The complex chemical composition of PM2.5 can cause a wide variety of health hazards [5]. PM2.5 will cause serious irritation to the respiratory tract when it enters the bronchial tubes of the human body and will have a serious impact on the gas exchange in the lungs, causing coughing, breathing difficulties, asthma, bronchitis, and other problems. In serious cases, it can cause heart arrhythmia, and heart disease [6,7,8]. People with low resistance, such as the elderly and children, are particularly vulnerable to the effects of PM2.5 [9,10]. Therefore, effective monitoring and control of PM2.5 concentration has a positive role in improving human health [11,12,13]. Moreover, the picture-based PM2.5 concentration estimation methods can also be applied to other visual tasks, such as PM2.5 concentration, which can be used to assess the credibility of person re-identification results in hazy weather [14,15,16]. In the rain and fog image enhancement task, the suitable image defogging and rain removal algorithms can be selected adaptively for different rain and fog concentration images based on PM2.5 concentration [17,18].
To monitor PM2.5 concentration effectively, many high-precision electronic instruments have been designed and applied to daily life. Figure 1 shows part of the PM2.5 electronic monitoring equipment. The professional electronic equipment can usually obtain accurate PM2.5 monitoring results. However, high economic and labor costs are required to purchase and maintain electronic equipment, which limits the application scenarios of this equipment. Thus, it is of great significance to design a more convenient PM2.5 concentration prediction solution. To this end, in recent years, some researchers have proposed some photo-based PM2.5 concentration prediction algorithms. With the popularization of intelligent devices with the photo-taking function, such as driving recorders and smartphones, people can access high-quality photos anytime and anywhere. Therefore, the picture-based PM2.5 monitoring measurement is more convenient for people to use in their daily lives. Liu et al. extracted six image features of transmission—sky smoothness, color, global and local contrast, and entropy—to measure PM2.5 concentration [19]. In the literature [20], Gu et al. found that the entropy features of high and low PM2.5 concentration images are statistically different in the spatial and transform domains and mapped the deviation degree to PM2.5 concentration values by a nonlinear function. Zhang et al. introduced visual saliency to build a PM2.5 concentration detector [21]. The method first obtains the non-salient regions of the photo through the saliency detection technique. Then, the entropy and intensity values of the saturation map of the image non-salient regions are extracted to detect the PM2.5 concentration. All the abovementioned PM2.5 monitors based on the image entropy and energy features are usually influenced by the diversity of image content, thus limiting the performance of these PM2.5 concentration monitors. To alleviate the problem, Yue et al. calculate the gradient and Weibull distribution of image saturation map to quantify the loss of PM2.5 to the image and use it to estimate the PM2.5 concentration [22]. However, this also ignores the image content loss caused by particulate matter. Sun et al. designed a discrepancy learning-based PM2.5 concentration estimator [23]. The method first uses discrepancy learning to obtain the ability to capture the error map due to particulate matter from a large number of fog images with their corresponding clean images, and then estimates PM2.5 concentration via the structure, color, and energy features of the error map. The method inevitably learns information about the image itself besides particulate matter, which is also the main factor in the method producing PM2.5 concentration measurement error. To further solve the shortcomings of the above works, this paper designs a prior to measure the color loss introduced by particulate matter during imaging from the perspective of natural scene statistics. The key to the effectiveness of the developed algorithm is that the color loss features based on natural scene statistics are able to effectively attenuate the adverse impact of image content diversity on the performance of the photo-based PM2.5 concentration measurement model.
To measure the PM2.5 concentration more effectively based on image perception, this paper develops a natural scene statistical prior to estimating the image color saturation loss due to the ‘haze’ formed by PM2.5. The natural scene statistical prior for the color saturation loss (NSSP-CSL) consists of two steps: (a) obtaining the image saturation map by performing hue-saturation-value (HSV) transformation on the PM2.5 image; and (2) using the asymmetric generalized Gaussian distribution (AGGD) function to fit the mean subtracted contrast normalized coefficients (MSCN) of the saturation map. Then, to implement the final PM2.5 concentration monitor, we employ a feedforward neural network (FNN) model to learn the mapping of the obtained prior features to PM2.5 concentration values. Extensive experiments on the public Air Quality Image Database (AQID) [20] show that the proposed method has great advantages over mainstream photo-based PM2.5 monitoring benchmark methods.
The remaining sections of this paper are outlined as follows. Section 2 describes the natural scene statistical prior designed for image color loss and the FNN-based PM2.5 monitoring model. Section 3 validates the effectiveness of our PM2.5 concentration measurement method. Section 4 summarizes the whole paper.

2. Proposed Method

This section elaborates the proposed photo-based PM2.5 concentration monitor in terms of both the natural scene statistical prior extraction and the FNN-based PM2.5 concentration monitoring model. As shown in Figure 2a, the increase in PM2.5 concentration is most intuitively represented in an image as reduced color richness. For this purpose, we propose a natural scene statistical prior, namely NSSP-CSL, for the color loss of PM2.5 images.

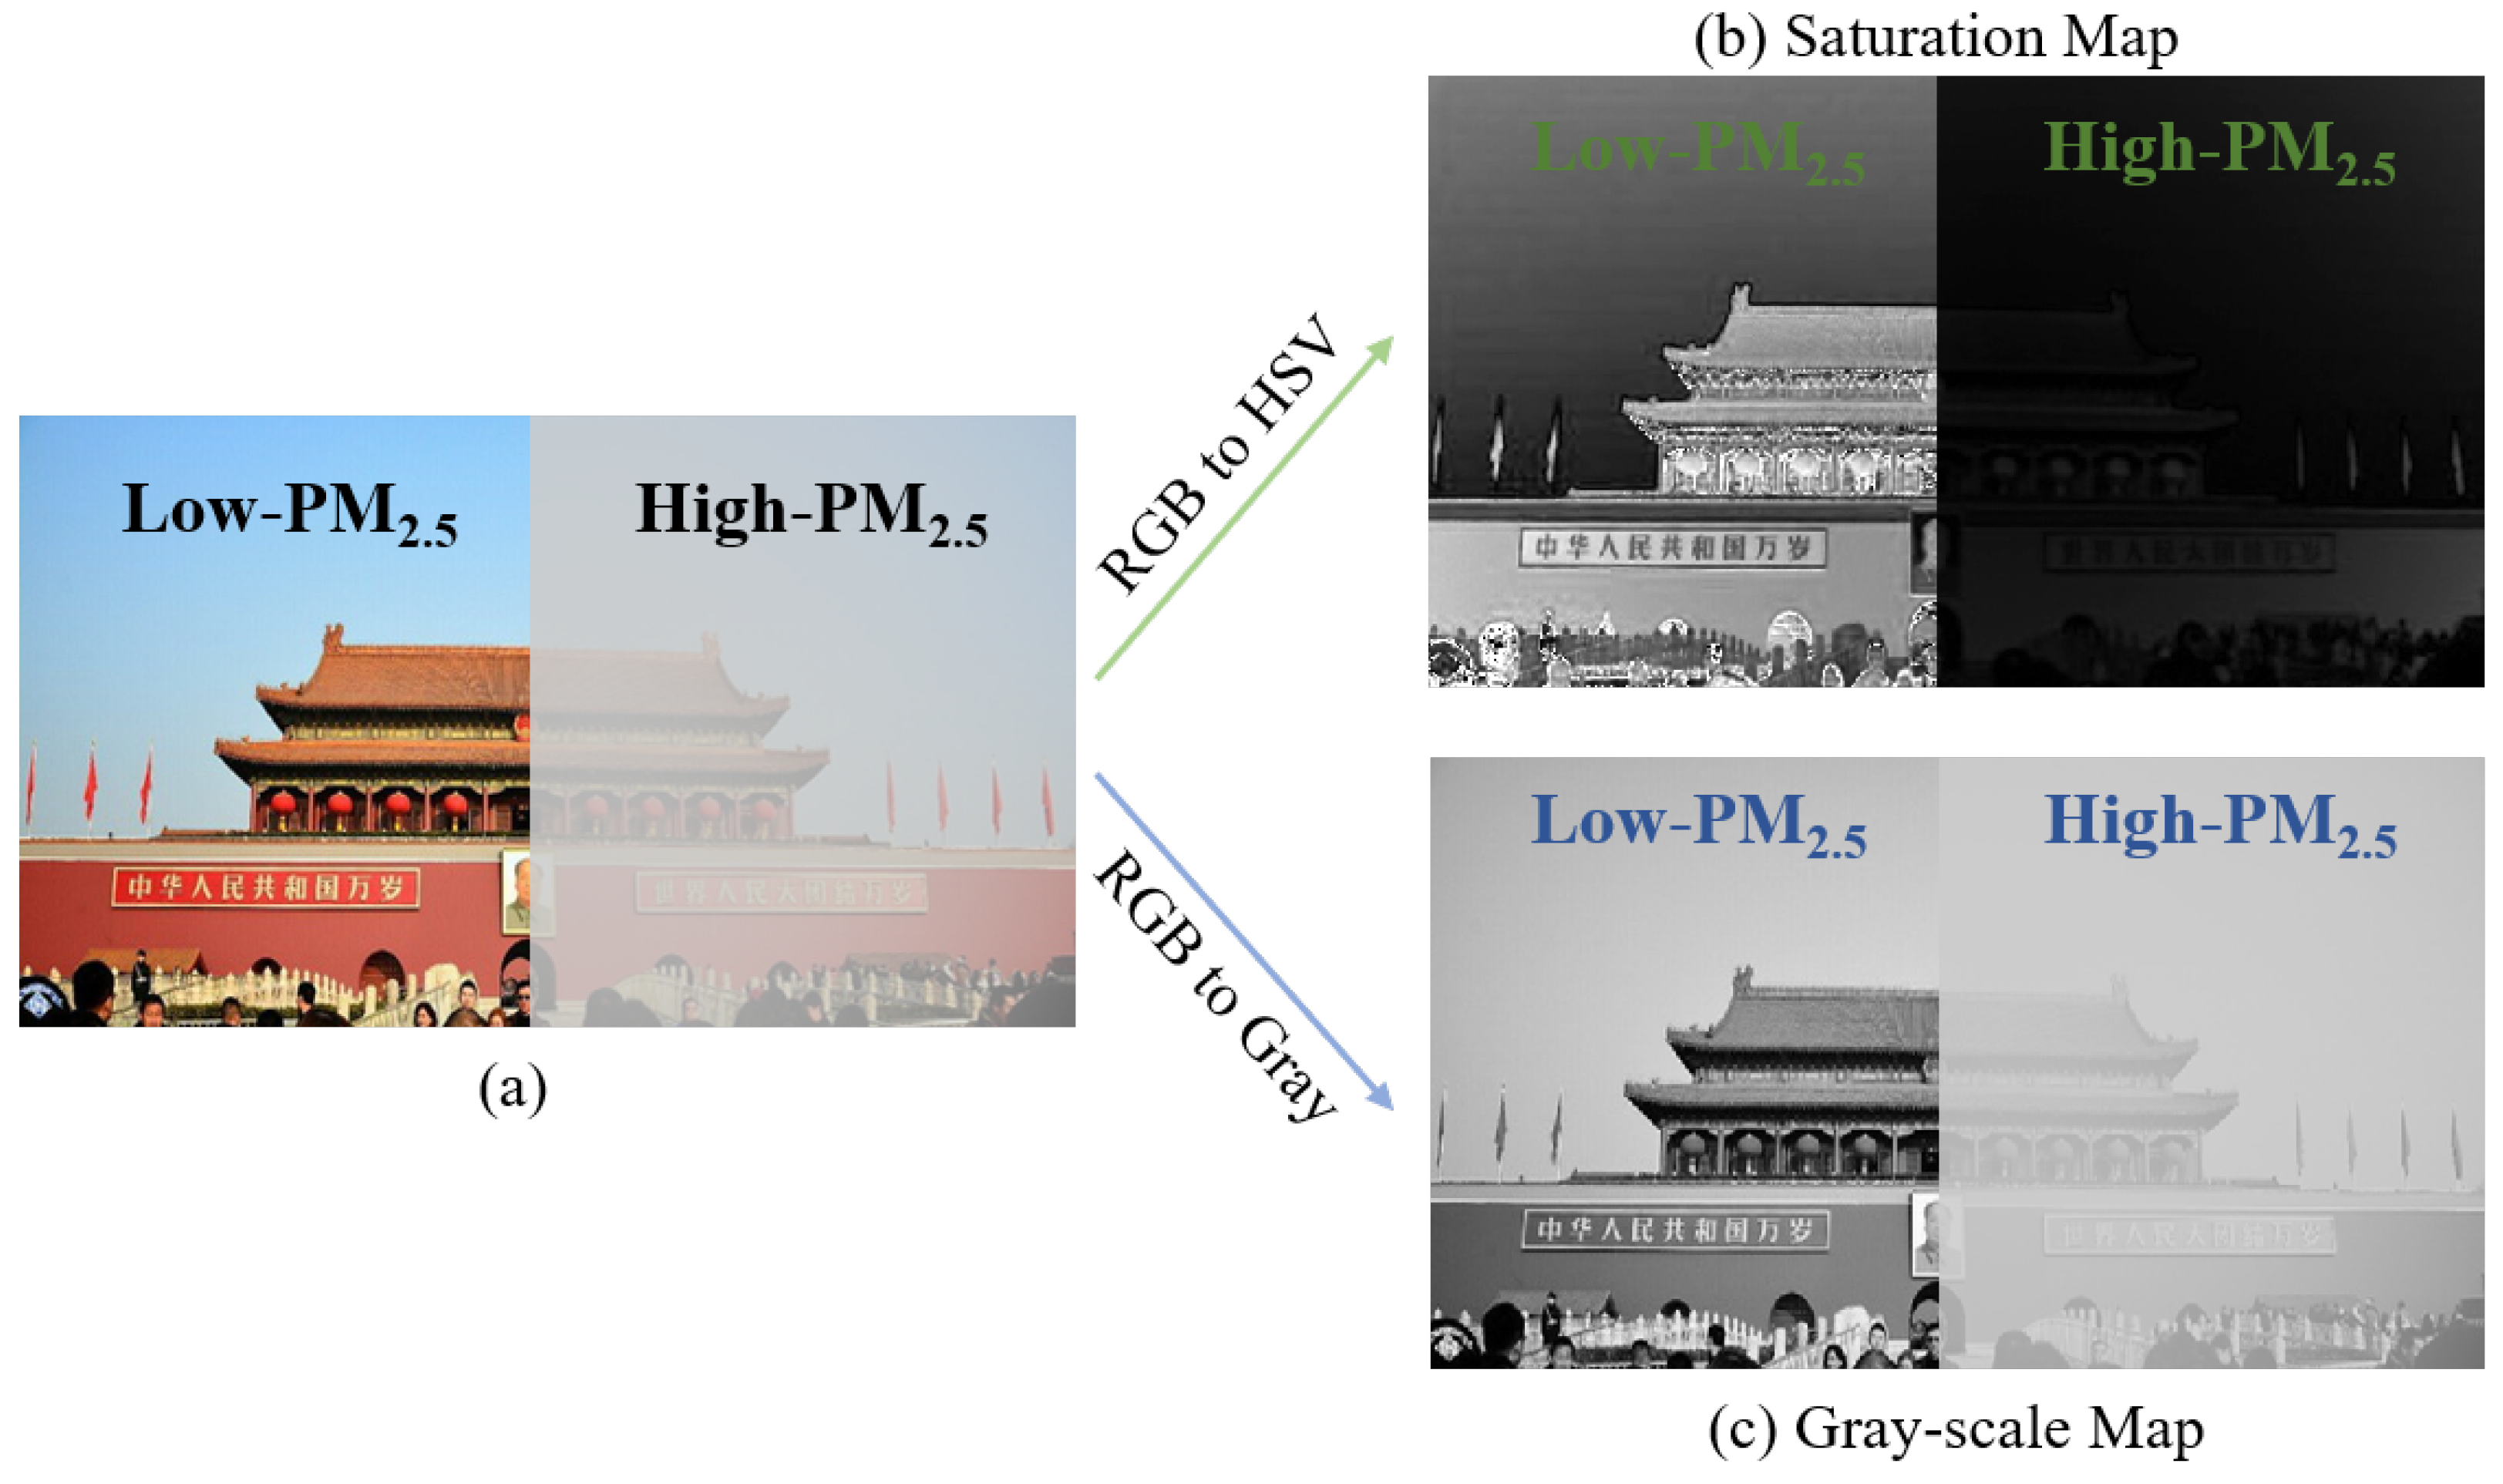
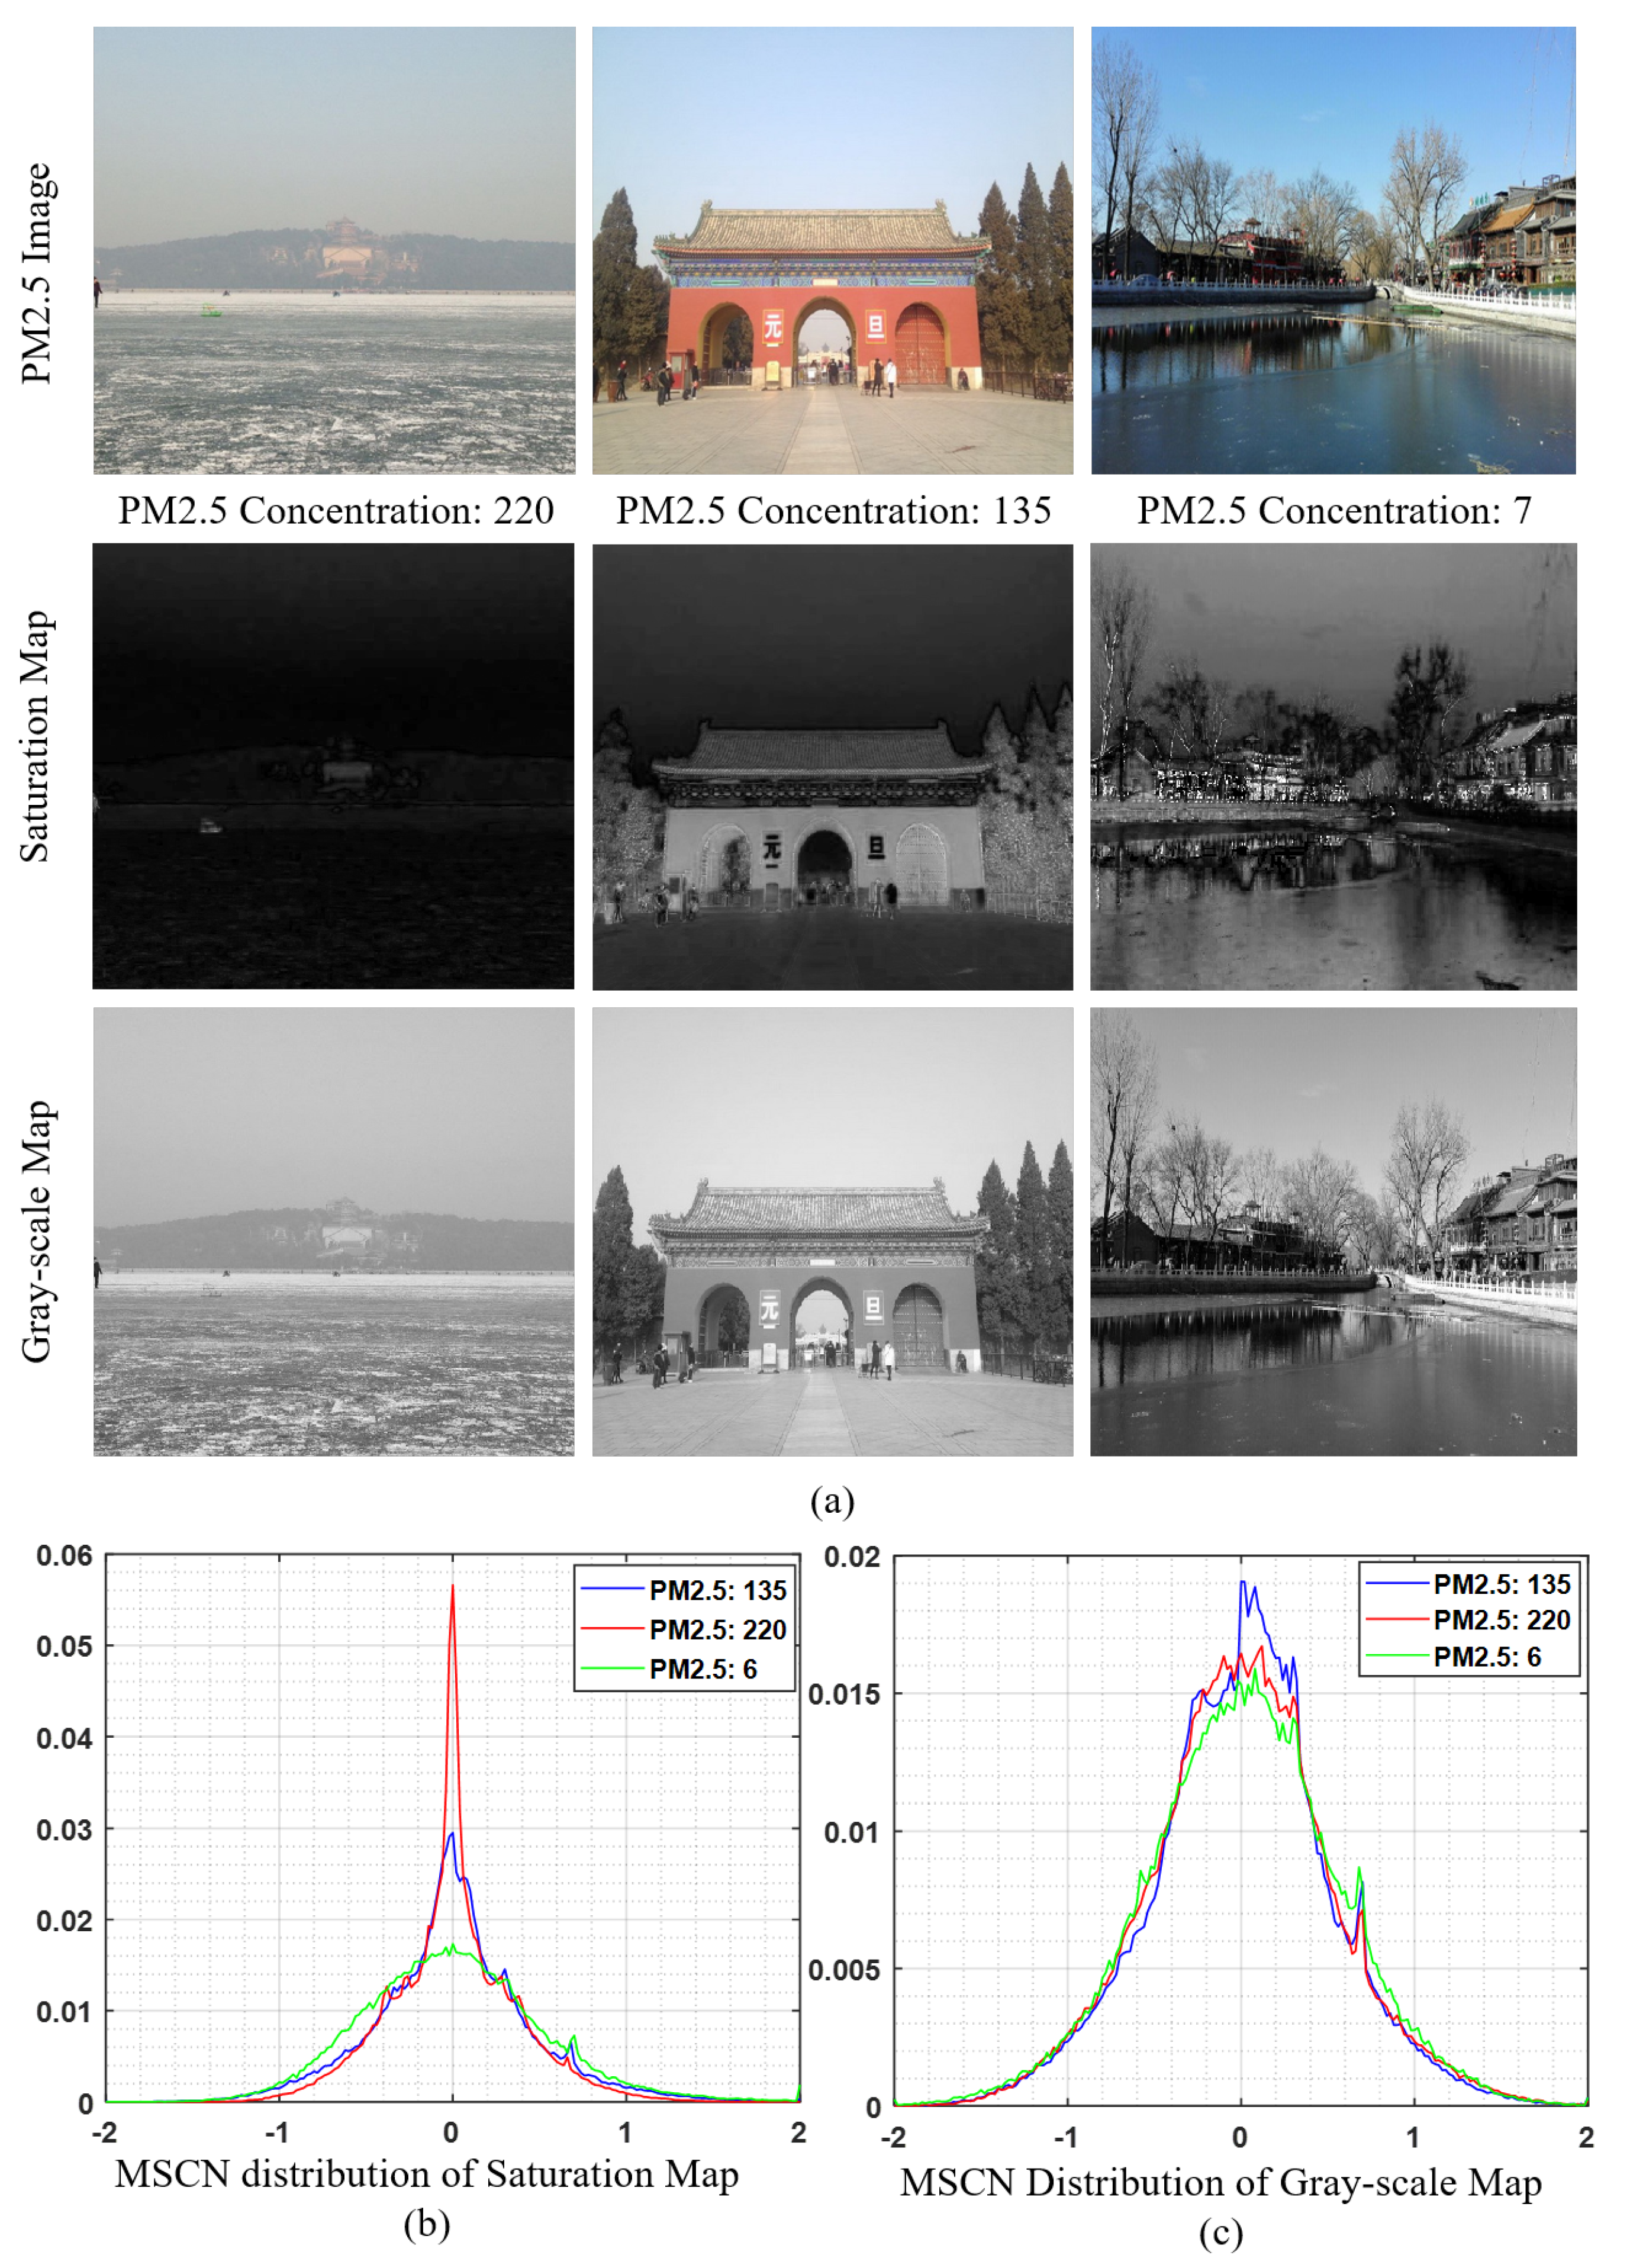
2.1. Natural Scene Statistical Prior for the Color Saturation Loss

As shown in Figure 2b, we can easily find that the saturation pixel values of the high concentration PM2.5 images are closer to zero compared to the low concentration PM2.5 images. The saturation channel of the high concentration PM2.5 image retains less image information compared to the grayscale map. Existing studies have shown that the AGGD of the mean subtracted contrast normalized (MSCN) coefficients of grayscale images can effectively quantify the pollution degree of different artifacts (such as JPEG, white noise, and blur, etc.) to the image quality [24,25,26,27,28,29]. In addition, PM2.5 can be seen as an artifact that causes degradation of image quality. Thus, we suppose whether the MSCN distributions of the saturation channels corresponding to different PM2.5 concentration images are also statistically different. To this end, we perform a conjecture validation on 500 images with different PM2.5 concentrations derived from the AQID [20]. Figure 3 presents an example of the MSCN distributions of the saturation and grayscale maps for three images with different PM2.5 concentrations. From Figure 3b, we can see that the MSCN distributions of image saturation corresponding to different PM2.5 concentrations have apparent differences. Specifically, with the decrease of PM2.5 concentration, the corresponding peak value of MSCN distribution decreases along with it. In addition, the distribution shape of MSCN at low PM2.5 concentration is also smoother than that at high PM2.5 concentration. Figure 3c shows that the MSCN distribution of images with different PM2.5 concentrations in the grayscale channel is not significantly different. Section 3.4 compares the performance of the MSCN distribution of image saturation and grayscale channels on the public AQID.
The above findings indicate that the MSCN distribution of image saturation channel information can effectively evaluate the color loss caused by PM2.5 to photos during imaging, thus enabling accurate photo-based monitoring of PM2.5 concentration. Next, we will describe how to extract the MSCN distribution of the image saturation channel. First, we transform the image from RGB color space to HSV color space to achieve the image saturation channel, which is calculated as follows:
S ( x , y ) = M ( x , y ) N ( x , y ) M ( x , y ) , if M ( x , y ) 0 0 , if M ( x , y ) = 0
where x and y are the pixel indices in the horizontal and vertical directions of the image, respectively. M ( x , y ) and N ( x , y ) denote the maximum and mimimum pixel values at pixel location ( x , y ) in channels R, G, and B of an image, respectively, i.e., M ( x , y ) = max[R ( x , y ) G ( x , y ) B ( x , y ) ], N ( x , y ) = min[R ( x , y ) G ( x , y ) B ( x , y ) ]. We then calculate the MSCN coefficients of the image saturation map by using the following formula:
S M S C N ( x , y ) = S ( x , y ) μ ( x , y ) σ ( x , y ) + C ,
where C is a positive constant to avoid the instability brought about by a zero denominator. μ ( x , y ) and σ ( x , y ) represent the mean and variance of the local area, respectively. The specific definitions of μ ( x , y ) and σ ( x , y ) are as follows:
μ ( x , y ) = k = K K l = L L ω k , l S k , l ( x , y ) ,
σ ( x , y ) = k = K K l = L L ω k , l S k , l ( x , y ) μ ( x , y ) 2 ,
where ω = { ω k , l | k = K , . . . , K , l = L , . . . , L } is a 2D Gaussian weighting function. We empirically set K and L to 3 according to related studies [24,25]. Figure 3b shows that the MSCN distribution of the image saturation channel generally follows an asymmetric generalized Gaussian distribution. Thus, we use the AGGD function to fit the MSCN distribution of the image saturation channel to realize the extraction of the MSCN distribution characteristics, as the first group of natural scene statistical priors for color loss in the proposed PM2.5 monitoring algorithm. The AGGD function is defined as follows:
f ( x ; v , σ l 2 , σ r 2 = v β l + β r Γ 1 v exp x β r v , x 0 , v β l + β r Γ 1 v exp x β l v , x < 0 ,
where
Γ ( a ) = 0 t ( a 1 ) e t d t , a > 0 , β l = σ l Γ 1 v Γ 3 v , β r = σ r Γ 1 v Γ 3 v .
The parameter v represents the shape of the MSCN distribution. The parameters σ l 2 and σ r 2 denote the spread on the left and right sides of the MSCN distribution, respectively. The three parameters v, σ l 2 and σ r 2 are estimated by using the moment-matching method in the literature [30]. The mean of the left and right side of the distribution is also another valid parameter commonly used to characterize the distribution, which is defined as
η = β r β l Γ 2 v Γ 1 v .
The above four parameters ( v , σ l 2 , σ r 2 , η ) of the AGGD fit serve as the first set of natural scene statistical priors for color saturation loss due to PM2.5 during imaging.

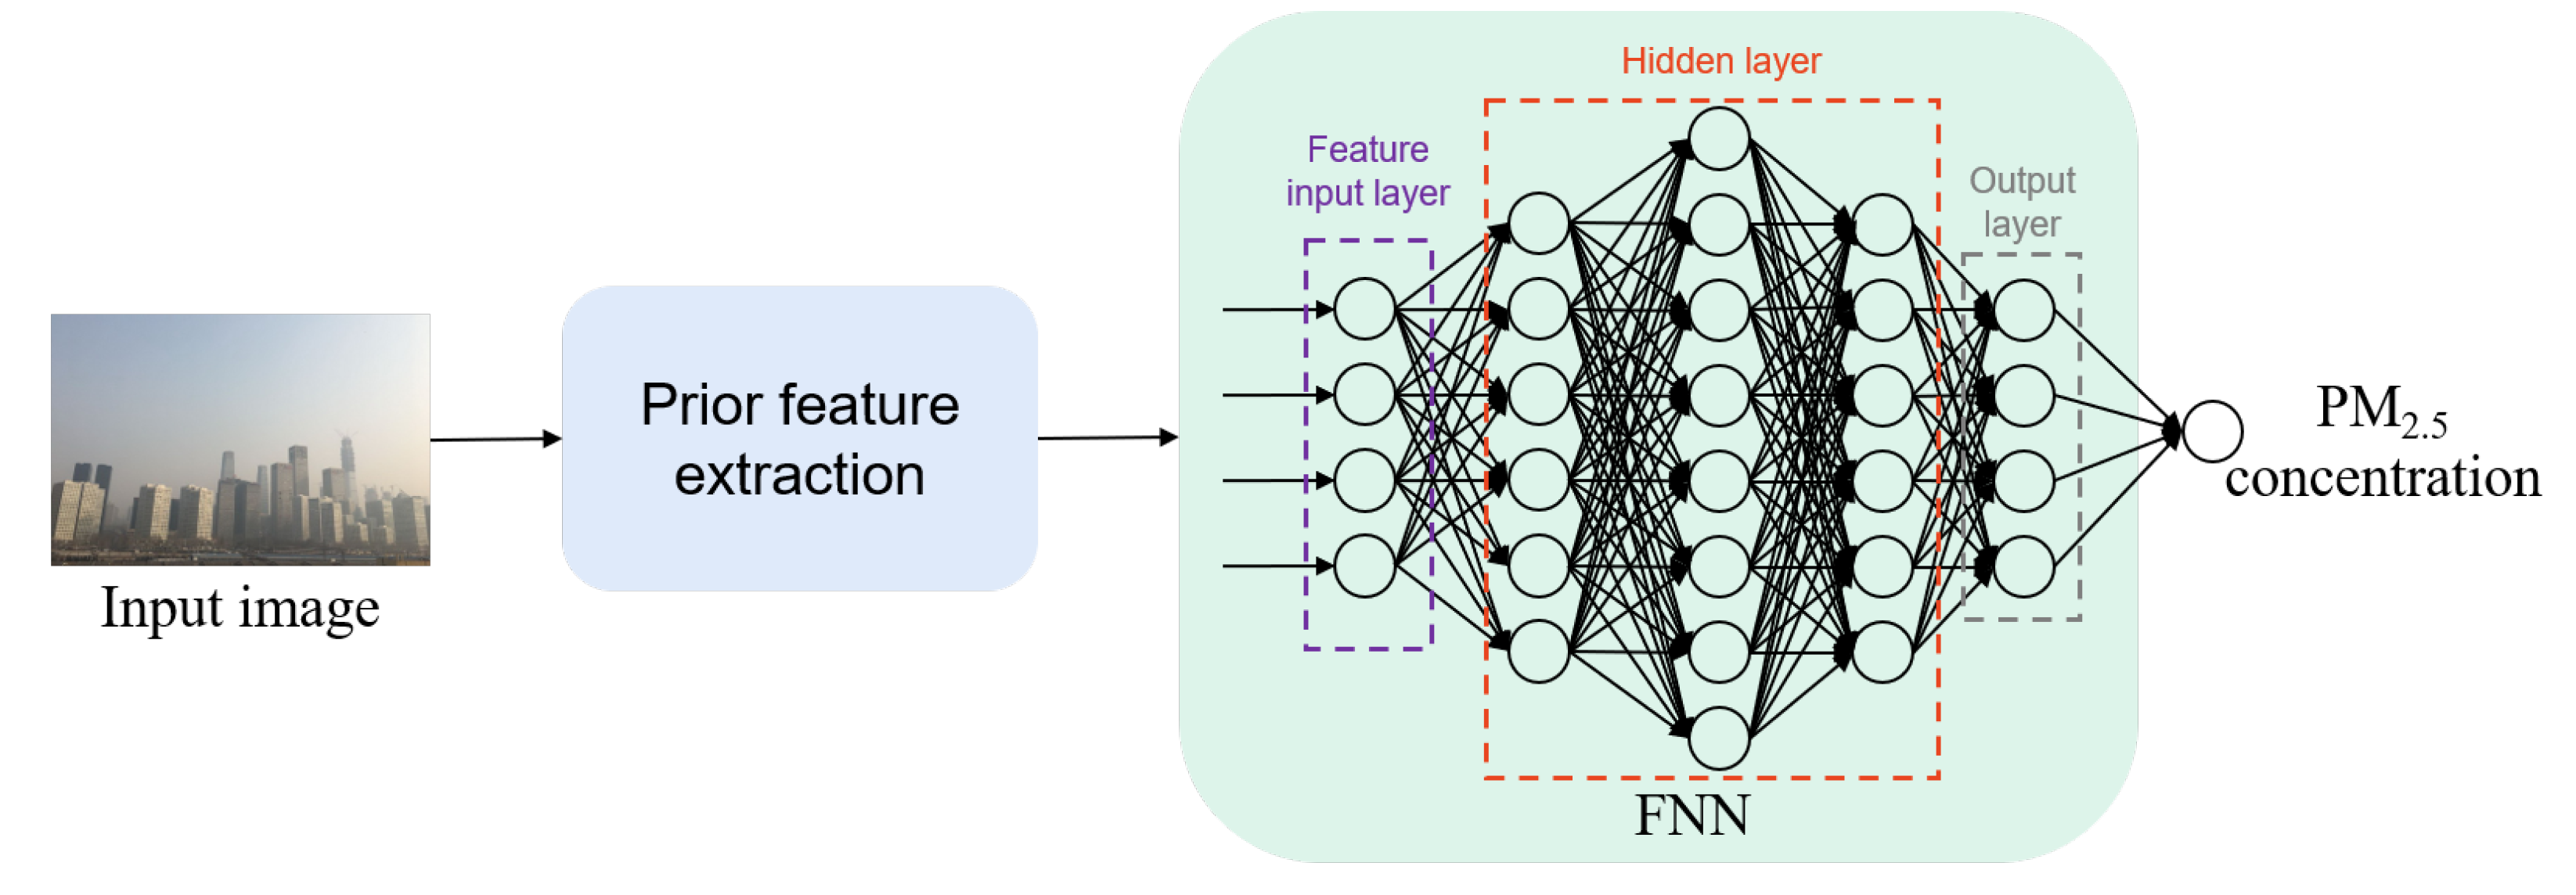
2.2. Proposed FNN-Based PM2.5 Concentration Measurement Model

Among existing studies on picture-based PM2.5 concentration monitoring, the support vector machine (SVM) and random forest (RF) are often adopted to fuse the extracted image-aware priors to measure PM2.5 concentration [31,32,33]. However, due to the shallow structure of SVM and RF, it is difficult for such machine-learning models to optimally map perceptual features to a PM2.5 concentration value. To this end, the FNN is adopted to learn our PM2.5 concentration measurement model, which contains multiple hidden layers that can effectively overcome the shortcomings of the SVM and RF algorithms. Section 3.3 performs the ablation studies of the SVM, RF, and FNN algorithms. Figure 4 shows the overview of our PM2.5 concentration monitoring method. The adopted FNN contains a feature input layer, 28 hidden layers, and an output layer; the details about the setting of the number of hidden layers are described in Section 3.3. In addition, this paper adopts the MSE loss and the gradient descent method to optimize the parameters of FNN.

3. Results

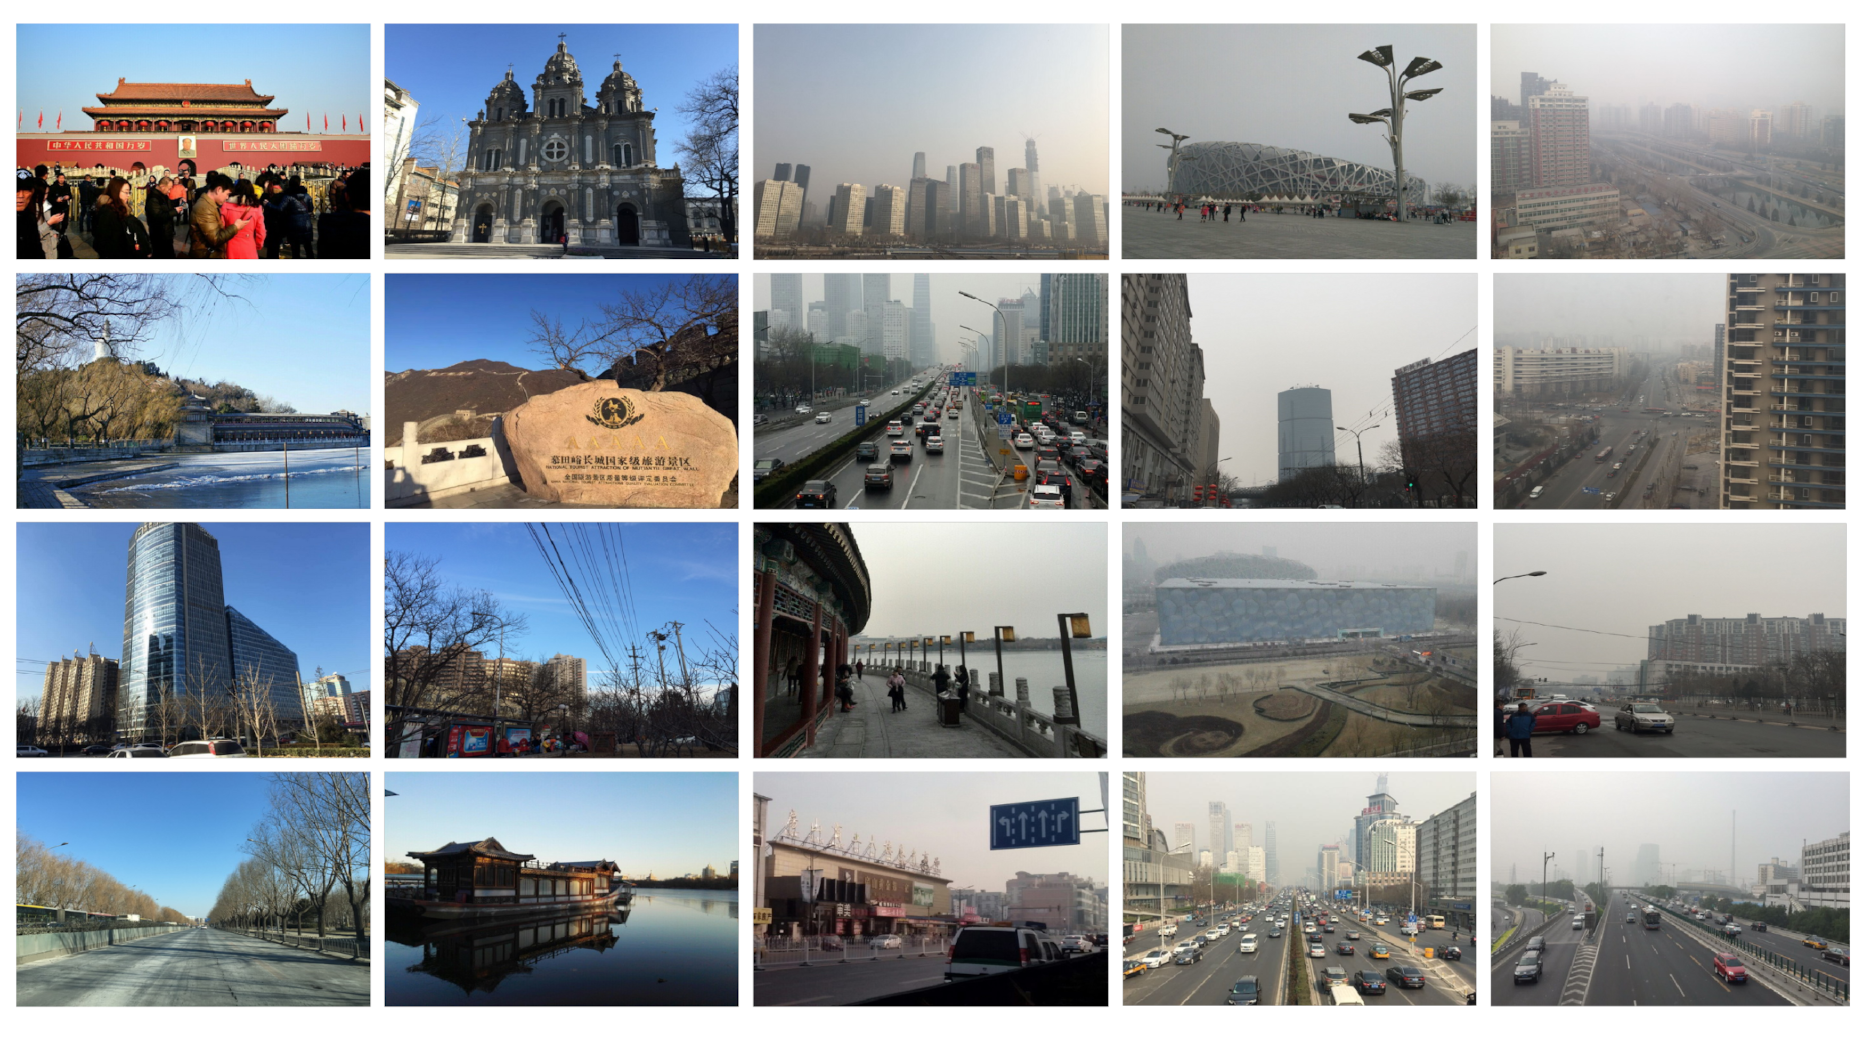
3.1. Testing Dataset

The AQID [20,22] consists of 750 pictures with PM2.5 concentrations ranging from 1 to 423 mu g/m3, where the resolution range of the photos is 500 × 261 to 978 × 550. The testing dataset contains various scenes such as roads, cars, houses, squares, etc. The PM2.5 concentration values corresponding to the photo samples in the dataset were collected by the MetOne BAM-1020 instrument. The MetOne BAM-1020 instrument detects the PM2.5 concentration value based on the β-ray absorption method. To ensure the quality of the collected samples, the following two rules were followed when collecting samples. First, the photo sample collection area is within a radius of 1 km centered on the air-quality monitoring equipment to ensure the PM2.5 concentration value is close to the real PM2.5 concentration value reported by the monitoring point. Second, because the sky area of the photo is more sensitive to PM2.5 concentration changes, the sky area in the sample should occupy about 1/3–1/2 of the entire photo. At the same time, these photos were collected without facing the sun to avoid the influence of the light intensity on PM2.5 monitoring accuracy. Figure 5 presents some samples from the testing dataset.

3.2. Evaluation Criteria

Drawing on Gu et al.’s [20], Yue et al.’s [22], and Sun et al.’s [23] studies, this paper adopts the Pearson correlation coefficient (PCC), the Spearman correlation coefficient (SCC), and the Kendall correlation coefficient (KCC) to evaluate the performance of the PM2.5 concentration monitoring algorithms. The specific definition of the Pearson correlation coefficient is given as follows:
P C C = i ( b i b ¯ ) ( l i l ¯ ) i ( b i b ¯ ) 2 i l i l ¯ ) 2 ,
where b i is the PM2.5 concentration estimate corresponding to the i-th PM2.5 photo. b ¯ is the mean value of all b i . The spearman correlation coefficient is defined as
S C C = 1 6 q = 1 Q d q 2 Q ( Q 2 1 ) ,
where the Q is the pair number of the estimated and actual values of the PM2.5 concentration. d q is the ranked difference between the estimated and actual values of PM2.5 concentration in each group. The Kendall correlation coefficient is computed as
K C C = Q c Q d 0.5 ( Q 2 Q ) ,
where Q c and Q d represent the number of prediction consistent and inconsistent pairs, respectively. The PCC measures the estimation accuracy. In addition, the outputs of the PM2.5 concentration measurement models need to be non-linearly mapped by a logistic function before calculating the PCC value [20,33,34]. The SCC and KCC measure the estimation monotonicity. The larger values of the PCC, SCC, and KCC represent the better performance of the PM2.5 monitoring algorithm.

3.3. Ablation Study on the Regression Models

This part tests the impact of different types of machine-learning algorithms, including SVM, RF, and FNN, on the accuracy of our proposed PM2.5 concentration measurement method. The experimental results are shown in Table 1. From Table 1, it is clear that different types of machine-learning algorithms have a significant impact on the prediction accuracy of the proposed PM2.5 monitoring algorithm. The SVR algorithm outperforms the RF and FNN algorithms in terms of estimation accuracy. The excellent performance of SVR on PCC may lie in the nonlinear mapping of the logistic function to the model outputs. However, the SCC and KCC can better reflect the sensitivity of the PM2.5 concentration prediction models to the dynamic transformation of PM2.5 concentration. The FNN algorithm is much better than the RF and SVR algorithms in terms of estimation monotonicity. Therefore, combining accuracy and monotonicity, the FNN algorithm is finally used to fuse image perception features to achieve our PM2.5 concentration monitoring model. Note that the training, validation, and test data account for 80%, 10%, and 10% of the whole dataset, respectively.
Moreover, Table 2 presents the ablation experiment results for the effect of the number of hidden layers included in the FNN on the prediction accuracy of our proposed PM2.5 concentration monitoring method. The experimental results in Table 2 demonstrate that when the number of hidden layers reaches 21, the prediction robustness of our proposed PM2.5 concentration monitoring algorithm tends to be stable. Considering the three performance indicators, this paper finally sets the number of hidden layers to 28.

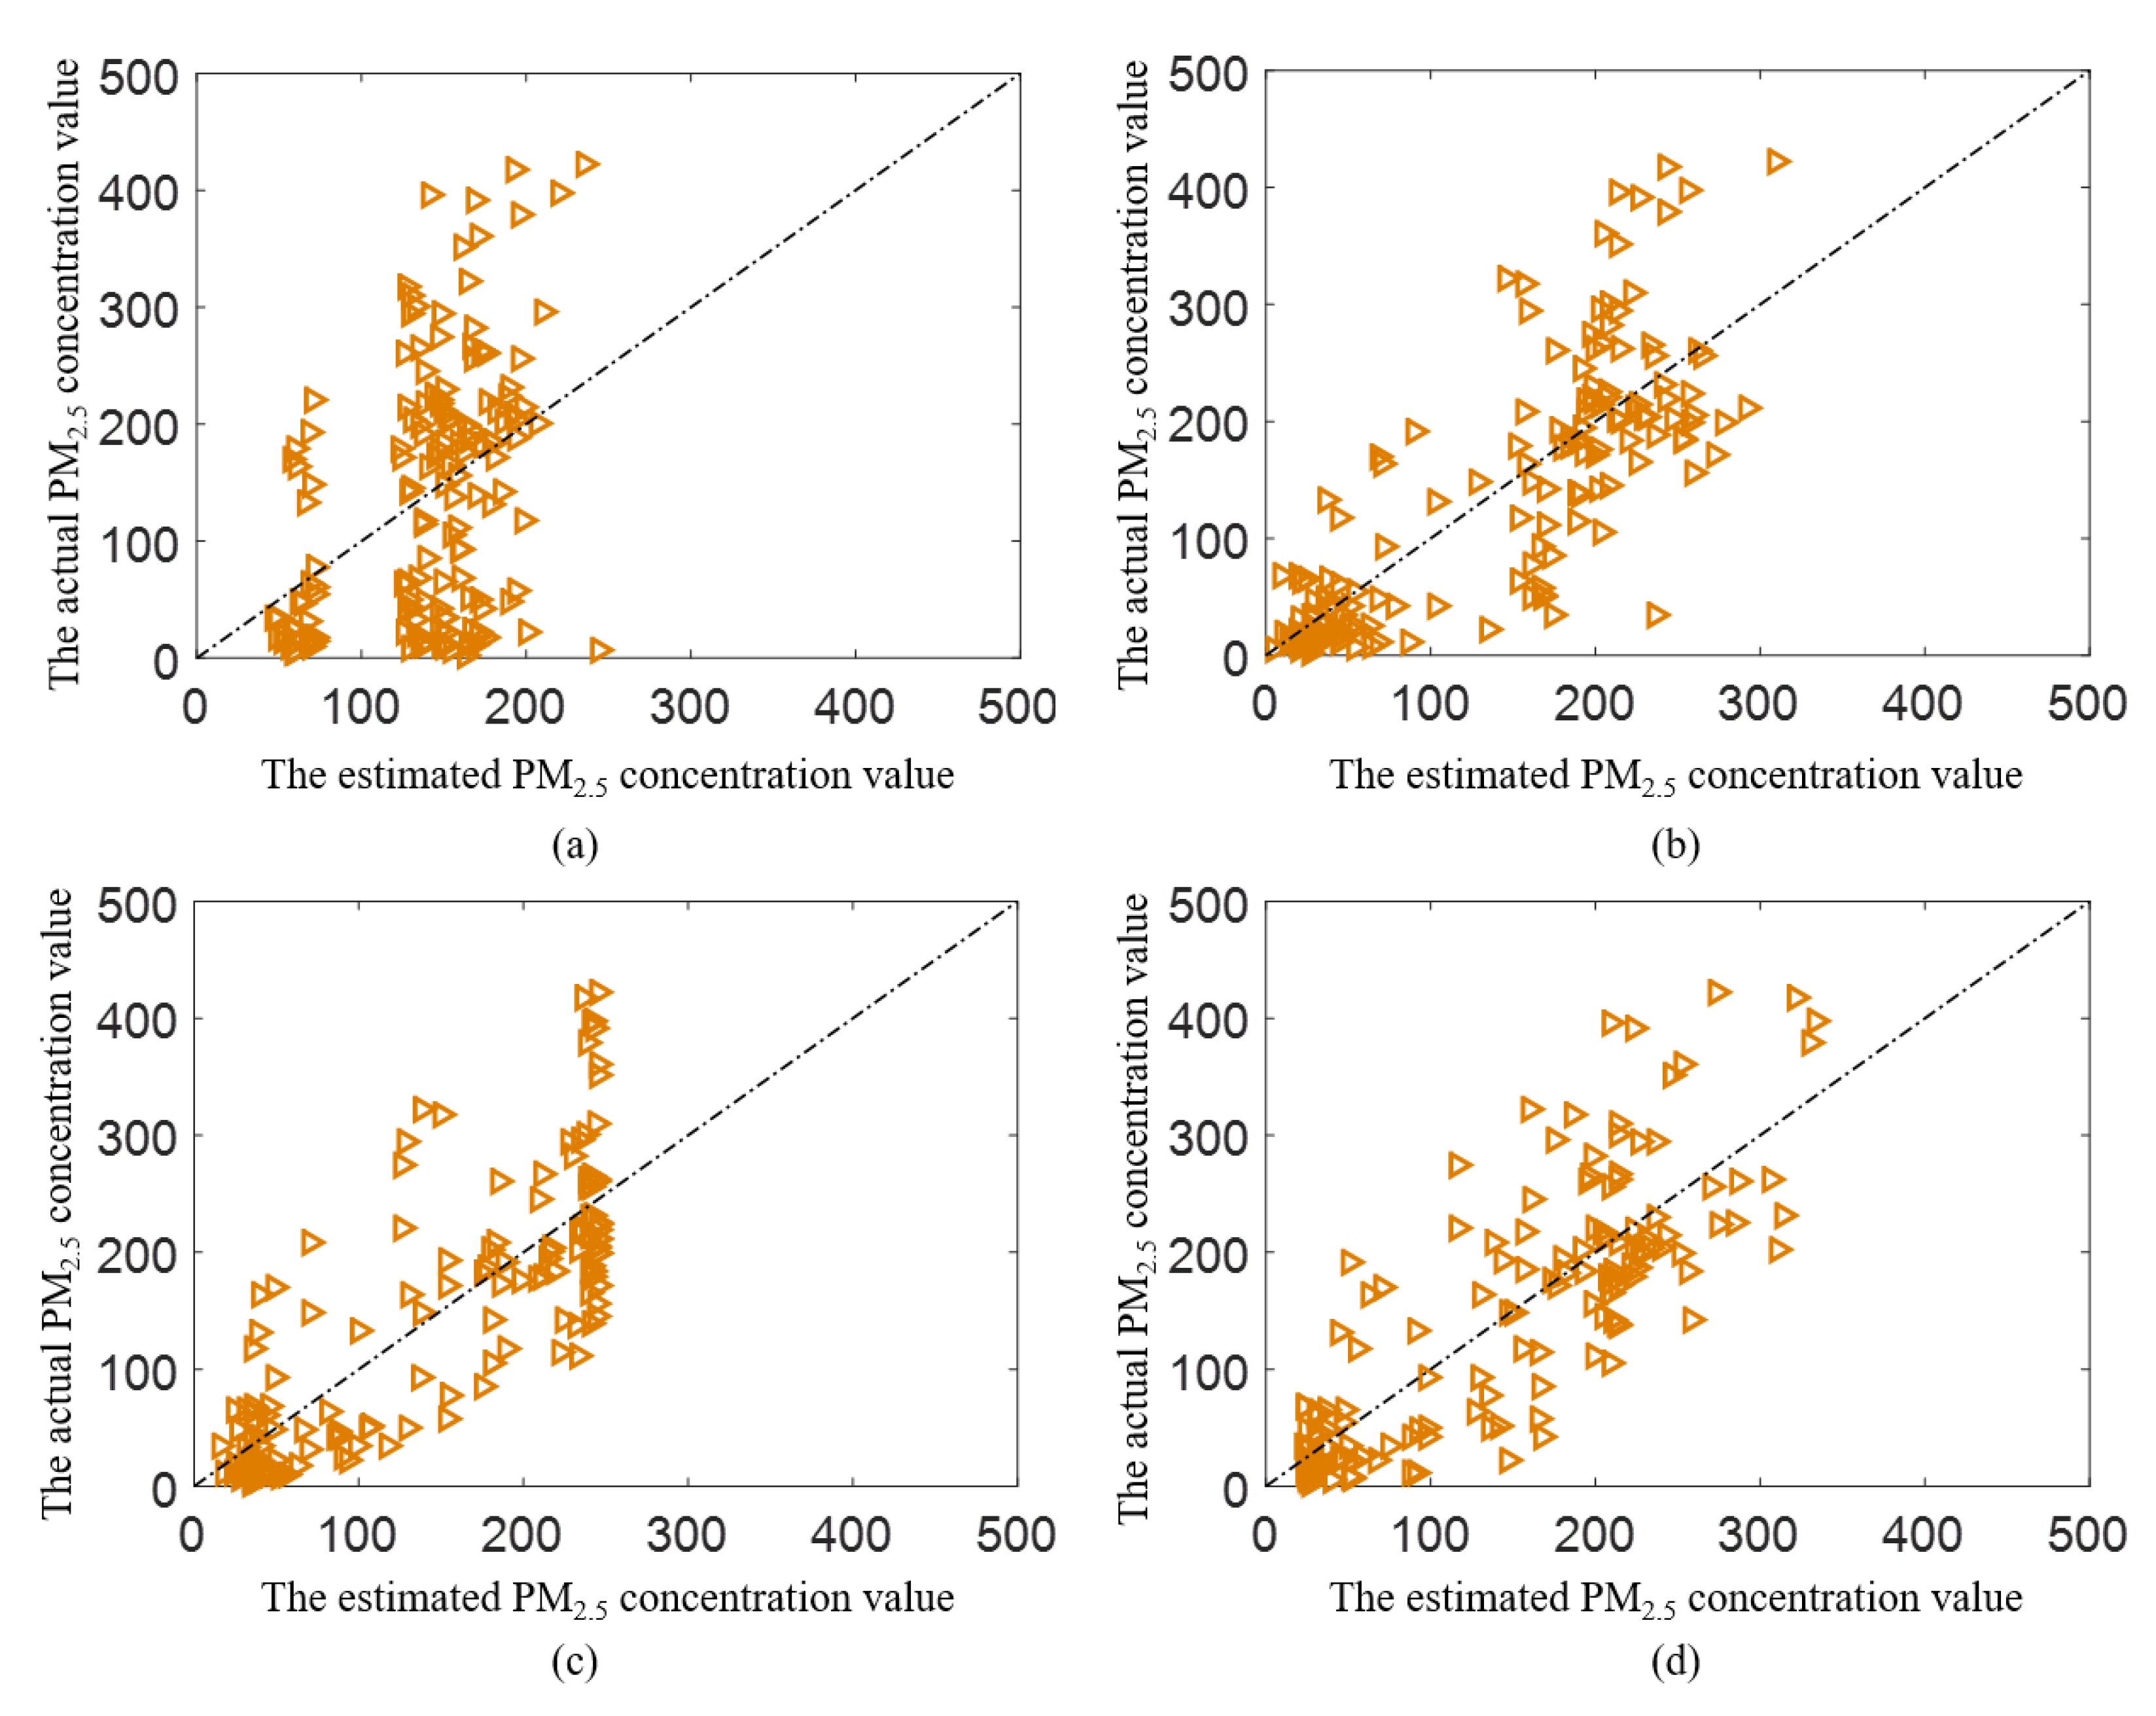
3.4. Performance Comparison with the Benchmark Algorithms

To prove the performance superiority of our proposed PM2.5 monitoring algorithm, three groups of algorithms, namely the image sharpness measurement, the image contrast measurement, and the photo-based PM2.5 monitoring, are selected as competing algorithms. The image contrast measurement methods include NIQMC [35] and BIQME [36]. The image sharpness assessment methods consist of FISH [37], ARISM [38], and BIBLE [39]. The picture-based PM2.5 monitoring algorithms include PPPC [20], Yue et al.’s method [22], Zhang et al.’s method [21], and Sun et al.’s method [33]. The reason for collecting the image sharpness and contrast estimation algorithms as the competing algorithms is that PM2.5 usually affects the contrast and sharpness of photos during imaging.
Table 3 presents the performance of our proposed PM2.5 concentration estimation algorithm, and the three types of competing algorithms on AQID. The best performing method among the image contrast estimation algorithms, BIQME, achieves PCC, SCC, and KCC values on AQID of 0.5441, 0.5375, and 0.3719, respectively. The best performing method among the image sharpness estimation algorithms, FISH, obtains PCC, SCC, and KCC values on AQID of 0.4687, 0.4106, and 0.2784, respectively. This indicates that it is difficult to accurately measure PM2.5 concentration, only focusing on contrast or sharpness. The PCC, SCC, and KCC values obtained by the proposed algorithm on AQID are 0.8228, 0.8241, and 0.6100, respectively. Encouragingly, the proposed method outperforms all competing picture-based PM2.5 monitoring algorithms on PCC and SCC metrics. On the indicator KCC, the proposed algorithm is also second only to the best-performing algorithm. Moreover, we compare the performance of the MSCN distribution features of the grayscale and saturation channels on the AQID, and the experimental results are shown in Table 3. The PM2.5 concentration estimation model based on the MSCN distribution features of the grayscale channel (i.e., MSCN-Gray) obtains the 0.3537, 0.3840, and 0.2597 of PCC, SCC, and KCC values, respectively. The experimental results show that the MSCN distribution of the grayscale channel makes it difficult to effectively distinguish the different levels of PM2.5 concentrations compared to the MSCN distribution of the saturation channel. We train the PM2.5 concentration estimation models based on the MSCN distributions of the grayscale and saturation channels in the same way. Note that all the learning-based models are retrained on AQID, and the ratio of training, validation, and testing data is 8:1:1.
To observe the algorithm performance more intuitively, we further test the scatter plots of some representative algorithms, including BIQME, Sun et al.’s method, PPPC, and the proposed method, which are shown in Figure 6. The scatter points are closer to the black baseline, and the corresponding PM2.5 concentration estimates are more accurate. The experimental results in Figure 6 present that our proposed PM2.5 concentration measurement algorithm is significantly superior to the competing SOTA methods.

4. Conclusions

This paper presents an image perception-based PM2.5 concentration measurement method. The main contributions of the paper include two points. (a) We design a natural scene statistical prior to evaluate the color richness loss caused by PM2.5 during imaging. (b) In this paper, a learning method better suitable for PM2.5 concentration monitoring is used to complete the mapping from the image perception features to PM2.5 concentration values. Extensive experiments have shown that the proposed image-aware PM2.5-based monitoring algorithm can effectively estimate PM2.5 concentrations. We consider designing the image priors from both structural and depth domains in future work to estimate PM2.5 concentrations more effectively.

Author Contributions

Conceptualization, G.W.; methodology, G.W. and Q.S.; software, K.J.; validation, Q.S. and K.J.; formal analysis, Q.S. and K.J.; investigation, G.W.; resources, G.W., Q.S. and K.J.; data curation, G.W. and Q.S.; writing—original draft preparation, G.W.; writing—review and editing, K.J.; visualization, G.W. and Q.S.; supervision, Q.S.; project administration, Q.S.; funding acquisition, Q.S. All authors have read and agreed to the published version of the manuscript.

Funding

This research was funded by the National Natural Science Foundation of China, grant number 61771265.

Data Availability Statement

The experiment uses a public dataset.

Acknowledgments

The authors would like to thank the reviewers and the editor for their careful reviews and constructive suggestions to help us improve the quality of this paper.

Conflicts of Interest

The authors declare no conflict of interest.

References

  1. Pope, C.; Burnett, R.; Thun, M.; Calle, E.; Krewski, D.; Ito, K.; Thurston, G. Lung cancer, cardiopulmonary mortality, and long-term exposure to fine particulate air pollution. JAMA-J. Am. Med. Assoc. 2002, 287, 1132–1141. [Google Scholar] [CrossRef] [Green Version]
  2. Andria, G.; Cavone, G.; Di Lecce, V.; Lanzolla, A. Model characterization in measurements of environmental pollutants via data correlation of sensor outputs. IEEE Trans. Instrum. Meas. 2005, 54, 1061–1066. [Google Scholar] [CrossRef]
  3. Gu, K.; Qiao, J.; Lin, W. Recurrent Air Quality Predictor Based on Meteorology- and Pollution-Related Factors. IEEE Trans. Ind. Inform. 2018, 14, 3946–3955. [Google Scholar] [CrossRef]
  4. Song, Z.; Tang, C.; Ji, J.; Todo, Y.; Tang, Z. A Simple Dendritic Neural Network Model-Based Approach for Daily PM2.5 Concentration Prediction. Electronics 2021, 10, 373. [Google Scholar] [CrossRef]
  5. Saffari, A.; Daher, N.; Shafer, M.M.; Schauer, J.J.; Sioutas, C. Global Perspective on the Oxidative Potential of Airborne Particulate Matter: A Synthesis of Research Findings. Environ. Sci. Technol. 2014, 48, 7576–7583. [Google Scholar] [CrossRef]
  6. Guo, Y.; Tong, S.; Zhang, Y.; Barnett, A.G.; Jia, Y.; Pan, X. The relationship between particulate air pollution and emergency hospital visits for hypertension in Beijing, China. Sci. Total Environ. 2010, 408, 4446–4450. [Google Scholar] [CrossRef] [Green Version]
  7. Wang, G.; Jiang, R.; Zhao, Z.; Song, W. Effects of ozone and fine particulate matter (PM2.5) on rat system inflammation and cardiac function. Toxicol. Lett. 2013, 217, 23–33. [Google Scholar] [CrossRef]
  8. Davel, A.P.; Lemos, M.; Pastro, L.M.; Pedro, S.C.; de Andre, P.A.; Hebeda, C.; Farsky, S.H.; Saldiva, P.H.; Rossoni, L.V. Endothelial dysfunction in the pulmonary artery induced by concentrated fine particulate matter exposure is associated with local but not systemic inflammation. Toxicology 2012, 295, 39–46. [Google Scholar] [CrossRef]
  9. Gent, J.; Triche, E.; Holford, T.; Belanger, K.; Bracken, M.; Beckett, W.; Leaderer, B. Association of low-level ozone and fine particles with respiratory symptoms in children with asthma. JAMA-J. Am. Med. Assoc. 2003, 290, 1859–1867. [Google Scholar] [CrossRef] [Green Version]
  10. Yorifuji, T.; Kashima, S.; Doi, H. Associations of acute exposure to fine and coarse particulate matter and mortality among older people in Tokyo, Japan. Sci. Total Environ. 2016, 542, 354–359. [Google Scholar] [CrossRef]
  11. Prihatno, A.T.; Nurcahyanto, H.; Ahmed, M.F.; Rahman, M.H.; Alam, M.M.; Jang, Y.M. Forecasting PM2.5 Concentration Using a Single-Dense Layer BiLSTM Method. Electronics 2021, 10, 1808. [Google Scholar] [CrossRef]
  12. Carnevale, C.; Turrini, E.; Zeziola, R.; De Angelis, E.; Volta, M. A Wavenet-Based Virtual Sensor for PM10 Monitoring. Electronics 2021, 10, 2111. [Google Scholar] [CrossRef]
  13. Mumtaz, R.; Zaidi, S.M.H.; Shakir, M.Z.; Shafi, U.; Malik, M.M.; Haque, A.; Mumtaz, S.; Zaidi, S.A.R. Internet of Things (IoT) Based Indoor Air Quality Sensing and Predictive Analytic—A COVID-19 Perspective. Electronics 2021, 10, 184. [Google Scholar] [CrossRef]
  14. Zheng, H.; Zhong, X.; Huang, W.; Jiang, K.; Liu, W.; Wang, Z. Visible-Infrared Person Re-Identification: A Comprehensive Survey and a New Setting. Electronics 2022, 11, 454. [Google Scholar] [CrossRef]
  15. Wang, Z.; Jiang, J.; Wu, Y.; Ye, M.; Bai, X.; Satoh, S. Learning Sparse and Identity-Preserved Hidden Attributes for Person Re-Identification. IEEE Trans. Image Process. 2020, 29, 2013–2025. [Google Scholar] [CrossRef]
  16. Wang, Z.; Jiang, J.; Yu, Y.; Satoh, S. Incremental Re-Identification by Cross-Direction and Cross-Ranking Adaption. IEEE Trans. Multimed. 2019, 21, 2376–2386. [Google Scholar] [CrossRef]
  17. Jiang, K.; Wang, Z.; Yi, P.; Chen, C.; Wang, G.; Han, Z.; Jiang, J.; Xiong, Z. Multi-Scale Hybrid Fusion Network for Single Image Deraining. IEEE Trans. Neural Netw. Learn. Syst. 2021, 1–15. [Google Scholar] [CrossRef]
  18. Jiang, K.; Wang, Z.; Yi, P.; Chen, C.; Wang, Z.; Wang, X.; Jiang, J.; Lin, C.W. Rain-Free and Residue Hand-in-Hand: A Progressive Coupled Network for Real-Time Image Deraining. IEEE Trans. Image Process. 2021, 30, 7404–7418. [Google Scholar] [CrossRef]
  19. Liu, C.; Tsow, F.; Zou, Y.; Tao, N. Particle Pollution Estimation Based on Image Analysis. PLoS ONE 2016, 11, e0145955. [Google Scholar] [CrossRef]
  20. Gu, K.; Qiao, J.; Li, X. Highly Efficient Picture-Based Prediction of PM2.5 Concentration. IEEE Trans. Ind. Electron. 2019, 66, 3176–3184. [Google Scholar] [CrossRef]
  21. Zhang, H.; Peng, D.; Chen, W.; Xu, X. Extremely efficient PM2.5 estimator based on analysis of saliency and statistics. Electron. Lett. 2019, 55, 30–31. [Google Scholar] [CrossRef]
  22. Yue, G.; Gu, K.; Qiao, J. Effective and Efficient Photo-Based PM2.5 Concentration Estimation. IEEE Trans. Instrum. Meas. 2019, 68, 3962–3971. [Google Scholar] [CrossRef]
  23. Sun, K.; Tang, L.; Qian, J.; Wang, G.; Lou, C. A deep learning-based PM2.5 concentration estimator. Displays 2021, 69, 102072. [Google Scholar] [CrossRef]
  24. Mittal, A.; Moorthy, A.K.; Bovik, A.C. No-Reference Image Quality Assessment in the Spatial Domain. IEEE Trans. Image Process. 2012, 21, 4695–4708. [Google Scholar] [CrossRef]
  25. Mittal, A.; Soundararajan, R.; Bovik, A.C. Making a “Completely Blind” Image Quality Analyzer. IEEE Signal Process. Lett. 2013, 20, 209–212. [Google Scholar] [CrossRef]
  26. Chen, Z.; Zhou, W.; Li, W. Blind Stereoscopic Video Quality Assessment: From Depth Perception to Overall Experience. IEEE Trans. Image Process. 2018, 27, 721–734. [Google Scholar] [CrossRef]
  27. Zhou, W.; Xu, J.; Jiang, Q.; Chen, Z. No-Reference Quality Assessment for 360-degree Images by Analysis of Multifrequency Information and Local-global Naturalness. IEEE Trans. Circuits Syst. Video Technol. 2021, 32, 1778–1791. [Google Scholar] [CrossRef]
  28. Shi, L.; Zhou, W.; Chen, Z.; Zhang, J. No-Reference Light Field Image Quality Assessment Based on Spatial-Angular Measurement. IEEE Trans. Circuits Syst. Video Technol. 2020, 30, 4114–4128. [Google Scholar] [CrossRef] [Green Version]
  29. Zhou, W.; Shi, L.; Chen, Z.; Zhang, J. Tensor Oriented No-Reference Light Field Image Quality Assessment. IEEE Trans. Image Process. 2020, 29, 4070–4084. [Google Scholar] [CrossRef]
  30. Sharifi, K.; Leon-Garcia, A. Estimation of shape parameter for generalized Gaussian distributions in subband decompositions of video. IEEE Trans. Circuits Syst. Video Technol. 1995, 5, 52–56. [Google Scholar] [CrossRef]
  31. Xia, Z. A robust photo-based PM2.5 monitoring method by combining linear and non-linear learning. IET Image Process. 2022, 16, 1000–1007. [Google Scholar] [CrossRef]
  32. Wang, G.; Shi, Q.; Wang, H.; Sun, K.; Lu, Y.; Di, K. Multi-modal image feature fusion-based PM2.5 concentration estimation. Atmos. Pollut. Res. 2022, 13, 101345. [Google Scholar] [CrossRef]
  33. Sun, K.; Tang, L.; Huang, S.; Qian, J. A photo-based quality assessment model for the estimation of PM2.5 concentrations. IET Image Process. 2022, 16, 1008–1016. [Google Scholar] [CrossRef]
  34. Wang, G.; Wang, Z.; Gu, K.; Jiang, K.; He, Z. Reference-Free DIBR-Synthesized Video Quality Metric in Spatial and Temporal Domains. IEEE Trans. Circuits Syst. Video Technol. 2022, 32, 1119–1132. [Google Scholar] [CrossRef]
  35. Gu, K.; Lin, W.; Zhai, G.; Yang, X.; Zhang, W.; Chen, C.W. No-Reference Quality Metric of Contrast-Distorted Images Based on Information Maximization. IEEE Trans. Cybern. 2017, 47, 4559–4565. [Google Scholar] [CrossRef] [PubMed]
  36. Gu, K.; Tao, D.; Qiao, J.F.; Lin, W. Learning a No-Reference Quality Assessment Model of Enhanced Images With Big Data. IEEE Trans. Neural Networks Learn. Syst. 2018, 29, 1301–1313. [Google Scholar] [CrossRef] [Green Version]
  37. Vu, P.V.; Chandler, D.M. A fast wavelet-based algorithm for global and local image sharpness estimation. IEEE Signal Process. Lett. 2012, 19, 423–426. [Google Scholar] [CrossRef]
  38. Gu, K.; Zhai, G.; Lin, W.; Yang, X.; Zhang, W. No-Reference Image Sharpness Assessment in Autoregressive Parameter Space. IEEE Trans. Image Process. 2015, 24, 3218–3231. [Google Scholar]
  39. Li, L.; Lin, W.; Wang, X.; Yang, G.; Bahrami, K.; Kot, A.C. No-Reference Image Blur Assessment Based on Discrete Orthogonal Moments. IEEE Trans. Cybern. 2016, 46, 39–50. [Google Scholar] [CrossRef]
Figure 1. Examples of some PM2.5 concentration monitoring equipment. (a) The professional PM2.5 monitoring devices based on the β-ray absorption method and the tapered element oscillating microbalance method. (b) The household PM2.5 monitoring devices based on the laser and infrared principles.
Electronics 11 01298 g001
Figure 2. Comparisons of saturation and grayscale channels in photos collected under good and bad weather. (a) A mixed sample image. (b,c) The saturation and grayscale channels of (a).
Electronics 11 01298 g002
Figure 3. The MSCN distributions of the three PM2.5 photos with different rank concentrations and their corresponding saturation and grayscale channels. (a) The PM2.5 images and their corresponding saturation and grayscale channels. (b,c) MSCN distributions of the saturation and grayscale channels, respectively.
Electronics 11 01298 g003
Figure 4. The framework of our proposed PM2.5 concentration measurement method.
Electronics 11 01298 g004
Figure 5. Examples of partial samples in AQID.
Electronics 11 01298 g005
Figure 6. Scatter plot of the PM2.5 concentration estimation results. The black dashed line represents the benchmark perfect estimation. (a) Estimated by BIQME [36]. (b) Measured by Sun et al.’s method [33]. (c) Estimated by PPPC [20]. (d) Measured by our proposed method.
Electronics 11 01298 g006
Table 1. The performance of our proposed PM2.5 concentration estimation algorithm based on SVR, RF, and FNN on the AQID.
Model PCC SCC KCC
SVR0.84110.80390.5883
RF0.83850.79950.5717
FNN0.82280.82410.6100
Table 2. The performance of the FNN-based PM2.5 concentration monitoring model with the different number of hidden layers on the AQID. The reason for the numbers 0 and NAN in Table 2 is that the shallow hidden layer leads to the difficult convergence of model training.
Num. PCC SCC KCC Num. PCC SCC KCC
10NANNAN160.79320.78060.5594
20NANNAN170.10150.60480.4316
3NANNANNAN180.79530.79540.5869
40.12270.17990.1478190.12930.65980.4590
50.11450.42000.328020−0.1206−0.3824−0.2900
60.80090.79620.5840210.80700.80930.6006
70.17780.32570.2484220.80120.79910.5897
80.07100.34430.2446230.78830.80300.5984
90.06720.49750.3718240.80350.80010.5890
10−0.1265−0.3282−0.2587250.78210.77700.5587
110.79810.79260.5796260.82900.82020.6027
12−0.1573−0.6926−0.5092270.81120.79310.5688
130.31250.30080.2037280.82280.82410.6100
140.79090.78670.5760290.79990.79580.5897
150.77640.78170.5746300.81300.79500.5767
Table 3. Performance comparison of the picture-based PM2.5 monitoring algorithms, the image contrast and sharpness measurement algorithms on the AQID. * denotes that the corresponding results are collected in the original papers.
MethodType PCC SCC KCC
NIQMCContrast0.42290.44270.2966
BIQMEContrast0.54410.53750.3719
FISHSharpness0.46870.41060.2784
ARISMSharpness0.29900.21920.1472
BIBLESharpness0.12500.08020.0537
PPPCPM2.50.81150.81890.6078
Ref. [22]PM2.50.7823 *0.5809 *
Ref. [21]PM2.50.8011 *0.6102 *
Ref. [33]PM2.50.80820.81770.6115
MSCN-GrayPM2.50.35370.38400.2597
Pro. (MSCN-Sat)PM2.50.82280.82410.6100
Publisher’s Note: MDPI stays neutral with regard to jurisdictional claims in published maps and institutional affiliations.

