Article

Detection and Diagnosis of Stator and Rotor Electrical Faults for Three-Phase Induction Motor via Wavelet Energy Approach

1
Electrical Engineering Technical College, Middle Technical University, Baghdad 10001, Iraq
2
Technical Engineering College Kirkuk, Northern Technical University, Kirkuk 00964, Iraq
3
Biomedical and Electronics Engineering, Faculty of Engineering and Informatics, University of Bradford, Bradford BD7 1DP, UK
4
Department of Electrical Engineering, University of Misan, Misan 62001, Iraq
5
School of Built Environment, Engineering and Computing, Leeds Beckett University, Leeds LS6 3QR, UK
6
Information and Communication Engineering Department, College of Science and Technology, Basrah University, Basra 61004, Iraq
*
Author to whom correspondence should be addressed.
Electronics 2022, 11(8), 1253; https://doi.org/10.3390/electronics11081253
Submission received: 3 January 2022 / Revised: 3 April 2022 / Accepted: 4 April 2022 / Published: 15 April 2022

Abstract

:
This paper presents a fault detection method in three-phase induction motors using Wavelet Packet Transform (WPT). The proposed algorithm takes a frame of samples from the three-phase supply current of an induction motor. The three phase current samples are then combined to generate a single current signal by computing the Root Mean Square (RMS) value of the three phase current samples at each time stamp. The resulting current samples are then divided into windows of 64 samples. Each resulting window of samples is then processed separately. The proposed algorithm uses two methods to create window samples, which are called non-overlapping window samples and moving/overlapping window samples. Non-overlapping window samples are created by simply dividing the current samples into windows of 64 samples, while the moving window samples are generated by taking the first 64 current samples, and then the consequent moving window samples are generated by moving the window across the current samples by one sample each time. The new window of samples consists of the last 63 samples of the previous window and one new sample. The overlapping method reduces the fault detection time to a single sample accuracy. However, it is computationally more expensive than the non-overlapping method and requires more computer memory. The resulting window samples are separately processed as follows: The proposed algorithm performs two level WPT on each resulting window samples, dividing its coefficients into its four wavelet subbands. Information in wavelet high frequency subbands is then used for fault detection and activating the trip signal to disconnect the motor from the power supply. The proposed algorithm was first implemented in the MATLAB platform, and the Entropy power Energy (EE) of the high frequency WPT subbands’ coefficients was used to determine the condition of the motor. If the induction motor is faulty, the algorithm proceeds to identify the type of the fault. An empirical setup of the proposed system was then implemented, and the proposed algorithm condition was tested under real, where different faults were practically induced to the induction motor. Experimental results confirmed the effectiveness of the proposed technique. To generalize the proposed method, the experiment was repeated on different types of induction motors with different working ages and with different power ratings. Experimental results show that the capability of the proposed method is independent of the types of motors used and their ages.

1. Introduction

Literature Review and Motivation

The application of induction motors in the industry is crucial due to their unique features, e.g., their simple construction, high reliability, and the low maintenance that they need [1,2]. However, the induction motors are subject to various types of electrical faults. The immediate detection of the fault could save the induction motor from disastrous damages. Even the early detection of the fault could reduce the required maintenance time. Electrical faults of induction motors can be detected by extracting features from motor’s current signal. Many techniques are used for fault diagnosis in induction motors, such as Discrete Fourier Transform (DFT) and Fast Fourier Transform (FFT). All these techniques are useful for analyzing non-stationary signals. However, these techniques may not provide the required time-frequency information from the signal needed to locate the fault, particularly sharp signals in a nonlinear system such as induction motor [3,4,5,6]. Hence, researchers have focused on developing new fault detection and classification techniques, e.g., using signal processing algorithms to extract features from motor’s current signal such as frequency components of its current [7,8,9]. Signal processing algorithms are mathematical tools that are used to analyze electrical signals and extract their specific features, e.g., frequency components and time-frequency information [10]. The application of FFT in fault diagnosis is limited as it provides some information about the frequency components of the signal, but it does not provide any information about the timing of the signal frequency components. Short-Time Fourier Transform (STFT) generates a window with two dimensions named time and frequency [11,12]. The window has a predefined size, which is moved along the signal, enabling to analyze of the section of the signal within the window. This method limits the problem of identifying the time of the occurrence of a frequency component to the size of the STFT window and provides information about the frequency components of the signal within the STFT window time slot. Hence, if a fault takes a longer or shorter time duration than the STFT window size, the STFT-based fault detection method’s accuracy is significantly affected. Wavelet Transform (WT) can be used to mitigate the time limitation of the STFT by using different wavelet scales, implying window sizes, where the wavelet scale is inversely proportional to the frequency contents of the signal. Hence, WT provides more time–frequency localized information about the signal [13,14].
In this paper, Wavelet Packet Transform is used to perform two level WT on the induction motor’s current window frame samples, extracting its features (‘sym5’ wavelet was used to generate experimental results). The WT divides the input current samples into their four wavelet subbands, called aa2, ad2, da2, and dd2. The information in the resulting high frequency wavelet subbands is used for fault detection and recognition. Several threshold values have been empirically determined using the entropy energy of the resulting high frequency wavelet subbands’ of the signal and are used for the detection and classification of the faults of the induction motors. In this research, a window size of 64 samples was used, and two types of windows were used named: non-overlapping window samples and moving/overlapping window samples. The proposed technique using the two types of windows for the detection and classification of faults in induction motors was first simulated in MATLAB platform and then implemented using real induction motors and test equipment. Experimental results were consistent with the theory.
In the last few years, various techniques have been reported in the literature for fault detection and diagnosis in induction motors, aiming at improving their efficiency in terms of accuracy and the time they need to detect and classify the fault. Some of these techniques are Wigner-Ville Distribution (WVD) [15], Discrete Wavelet Transform (DWT) and Power Density Entropy (PDE) [16], Support Vector Machine (SVM), MUltiple SIgnal Classification (MUSIC) and Shannon Entropy (SE) ([17,18,19]), DWT, and Hilbert Transform (HT) [20].
Recently, the application of signal processing-based fault detection and classification methods in inductive motors has received significant interests amongst researchers [15,16,17,18,19,20]. This includes analyzing the frequency components of the current signal of the induction motor using various signal processing algorithms. However, the application of the WPT along with the entropy power energy of different wavelet high frequency subbands for detection and then the classification of the type of the fault in induction motors has neither been theoretically investigated and nor practically demonstrated.
In this research, the application of wavelet packet transform for electrical fault detection, classification, and the protection of the inductor motor against electrical faults in its stator and rotor is investigated. The proposed method utilizes two level WPT to decompose the motor’s overall current samples to their wavelet subbands and then computes the entropy energy of the resulting fine WPT subbands. The calculated entropy energy is used as the measure to check the state of the motor. If it was found that the motor is faulty, the calculated entropy energy value is checked against a range of empirically calculated threshold values to identify the type of motor fault. Moreover, the implemented system activates a trip signal to disconnect the motor from the power supply to protect the motor against further damages, which can occur due to the fault. Due to the nature of the WPT, which uses two digital filters to decompose the input signal to its wavelet subbands, the proposed method to some extent is robust to noise.
The contributions of this paper are as follows:
  • Development of a real-time fault detection algorithm for induction motors using wavelet packet transform;
  • Use of Entropy Power Energy (EE) of high frequency subbands of the current signal to determine the condition of the induction motor and, moreover, to classify the type of the fault;
  • Calculation of threshold values to differentiate different faults from EE energy signal;
  • The real-time implementation and test of the algorithm on real equipment;
  • Generalizing the algorithm by testing the algorithm on several induction motors of the same power rating with different parameters.
Comparative analyses between Stockwell transform, Hilbert transform, and WPT are given in Table 1. The state-of-the-art fault detection methods and the proposed technique’s features have been tabulated in Table 2. This provides the reader a clear understanding of the proposed and other state-of-the-art methods’ features.
The rest of this paper is organized as follows. Section 2 discusses the wavelet packet transform and entropy power energy. Section 3 discusses the modeling of a 3-phase induction motor with its different possible electrical faults. Section 4 presents the simulink model and real time data collection of the current signal from an induction motor. The proposed fault detection and diagnosis algorithm will be discussed in Section 5. Section 6 discusses the calculation of threshold values for the proposed method. Section 7 presents simulation results for the detection and classification of faults and power supply isolation. Experimental results are provided in Section 8, and the paper will be concluded in Section 9.

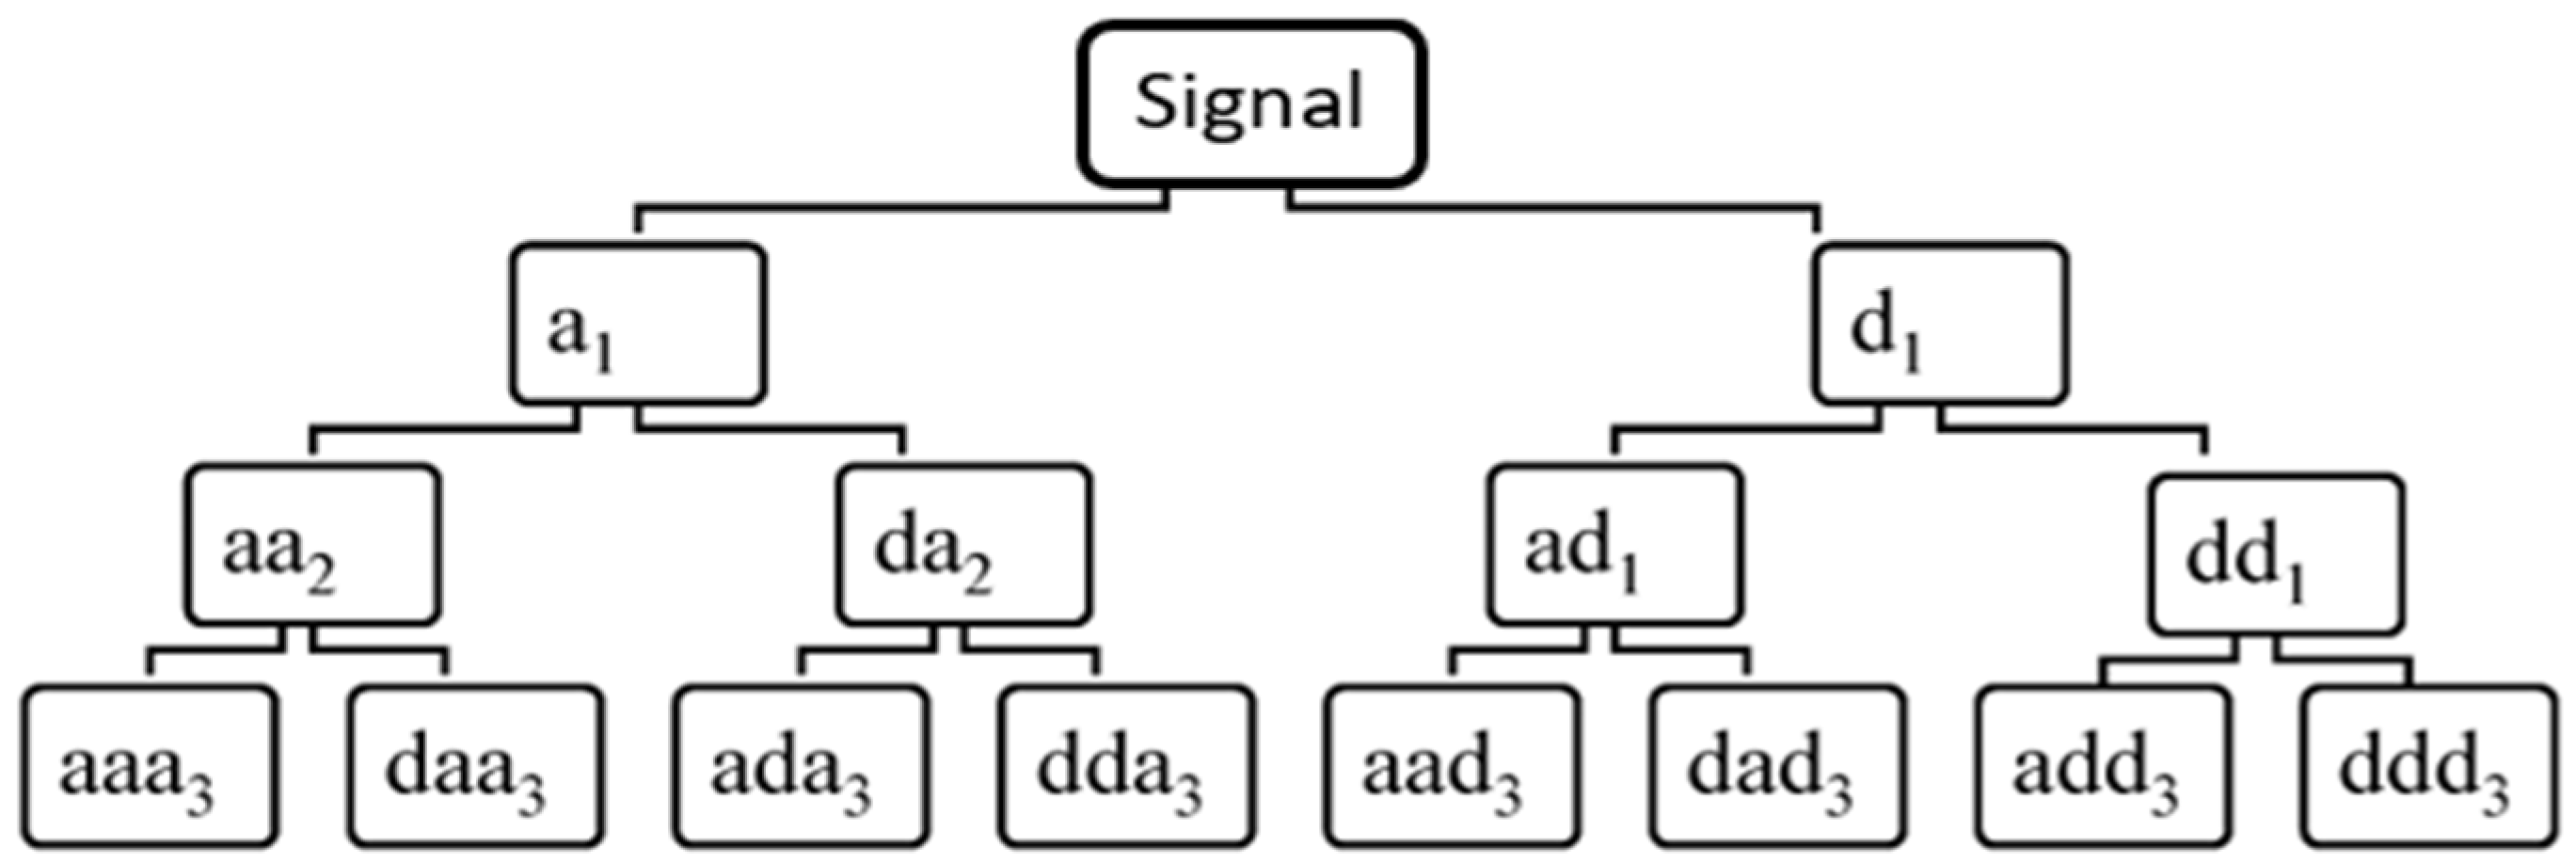
2. Wavelet Packet Transform and Wavelet Energy

Wavelet packet transform is a linear transform, which is widely used in signal processing and offers a much richer signal analysis [22,23]. WPT has a binary tree structure, where at the j th WPT decomposition level, there are 2 j WPT subbands. The relationship between the scale (frequency components) and the time (duration) in each level is inversely proportional [24]. For example, by performing one level WPT on a signal with N samples, WPT divides the signal into two subbands, where the length of the resulting subband signals is N/2. The resulting subbands are called approximation and detailed subbands, in consequence, the approximate subband carries information about low-frequency components, and the detailed subband contains information about high-frequency components of the signal. By applying two level WPT on the signal, four WPT subbands of length N/4 are generated. Figure 1 shows the structure and names of the resulting subbands for the three-level WPT of a signal.
The Shannon Entropy (wavelet energy) is a mathematical tool that can be used to describe the energy content of a signal. The general form of the total Shannon Entropy of a signal is given by the following: H ( X ) = K p ( x ) . log ( p ( x ) ) dx [25], where p(x) is the probability density of the signal, K is the proportionality constant, and x is the signal. The information content of the signal x can be determined by calculating its Shannon Entropy. Hence, the expression of Shannon entropy H(X) can be written as follows [26,27].
H ( X ) = X R p ( x ) log 2 p ( x )

3. Modeling of a 3-Phase Induction Motor with Electrical Faults

In this research, the MATLAB Simulink platform has been used to model the induction motor. This includes the modeling of an induction motor, both its healthy and faulty conditions.

3.1. Modelling the Healthy Condition

Based on the conventional theory of machines, using the dynamic equation, the flux, current, and speed equations of an induction motor can be written as follows [28,29,30]:
d Ψ d 1 dt = v d 1 i d 1 · R 1 + ω k · Ψ q 1  
d Ψ q 1 dt = v q 1 i q 1 · R 1 + ω k · Ψ d 1
d Ψ d 2 dt = i d 2 · R 2 + ( ω r ω k ) · Ψ q 2  
d Ψ q 2 dt = i q 2 · R 2 + ( ω r ω k ) · Ψ d 2
i d 1 = 1 L 1 · ( Ψ d 1 L h · i d 2 )
i q 1 = 1 L 1 · ( Ψ q 1 L h · i q 2 )
i d 2 = 1 L 2 · ( Ψ d 2 L h · i d 1 )
i q 2 = 1 L 2 · ( Ψ q 2 L h · i q 1 )
d ω r dt = P J · [ P · ( Ψ d 1 · i q 1 Ψ q 1 · i d 1 ) T L ]
where v d 1 , q 1 is the stator voltage in the d-q axis, v d 2 , q 2 is the rotor voltage in the d-q axis,   R 1 is stator resistance,   R 2 is rotor resistance,   i d 1 , q 1 is stator current in d-q axis,   i d 2 , q 2 is rotor current in the d-q axis,   ω r is rotor speed, ω k is the synchronous speed, Ψ d 1 , q 1 is stator flux linkage in the d-q axis,   Ψ d 2 , q 2 is rotor flux linkage in d-q axis, L 1 ,   L 2   ,   and   L h are the stator, rotor, and mutual inductance, respectively, P is the number of pole pairs, J is the moment of inertia, and T L is the load torque.

3.2. Modeling the Faulty Condition

3.2.1. Fault in the Stator of the Motor

The stator’s faults in an induction motor can be modeled as a new winding added to the stator’s original winding. This new winding has two parameters, which can provided information about the location and ratio of the winding. We can model any type of electrical fault that occurs in the stator winding by using these parameters. To represent faults in the stator, the following points are must be considered:
  • The localization parameter ( θ cc ): This represents the angle between the new winding, which is generated by the fault, and the first phase winding (a). The value of this angle can be 0°, 120°, or 240° according to the three phases, called a, b, and c.
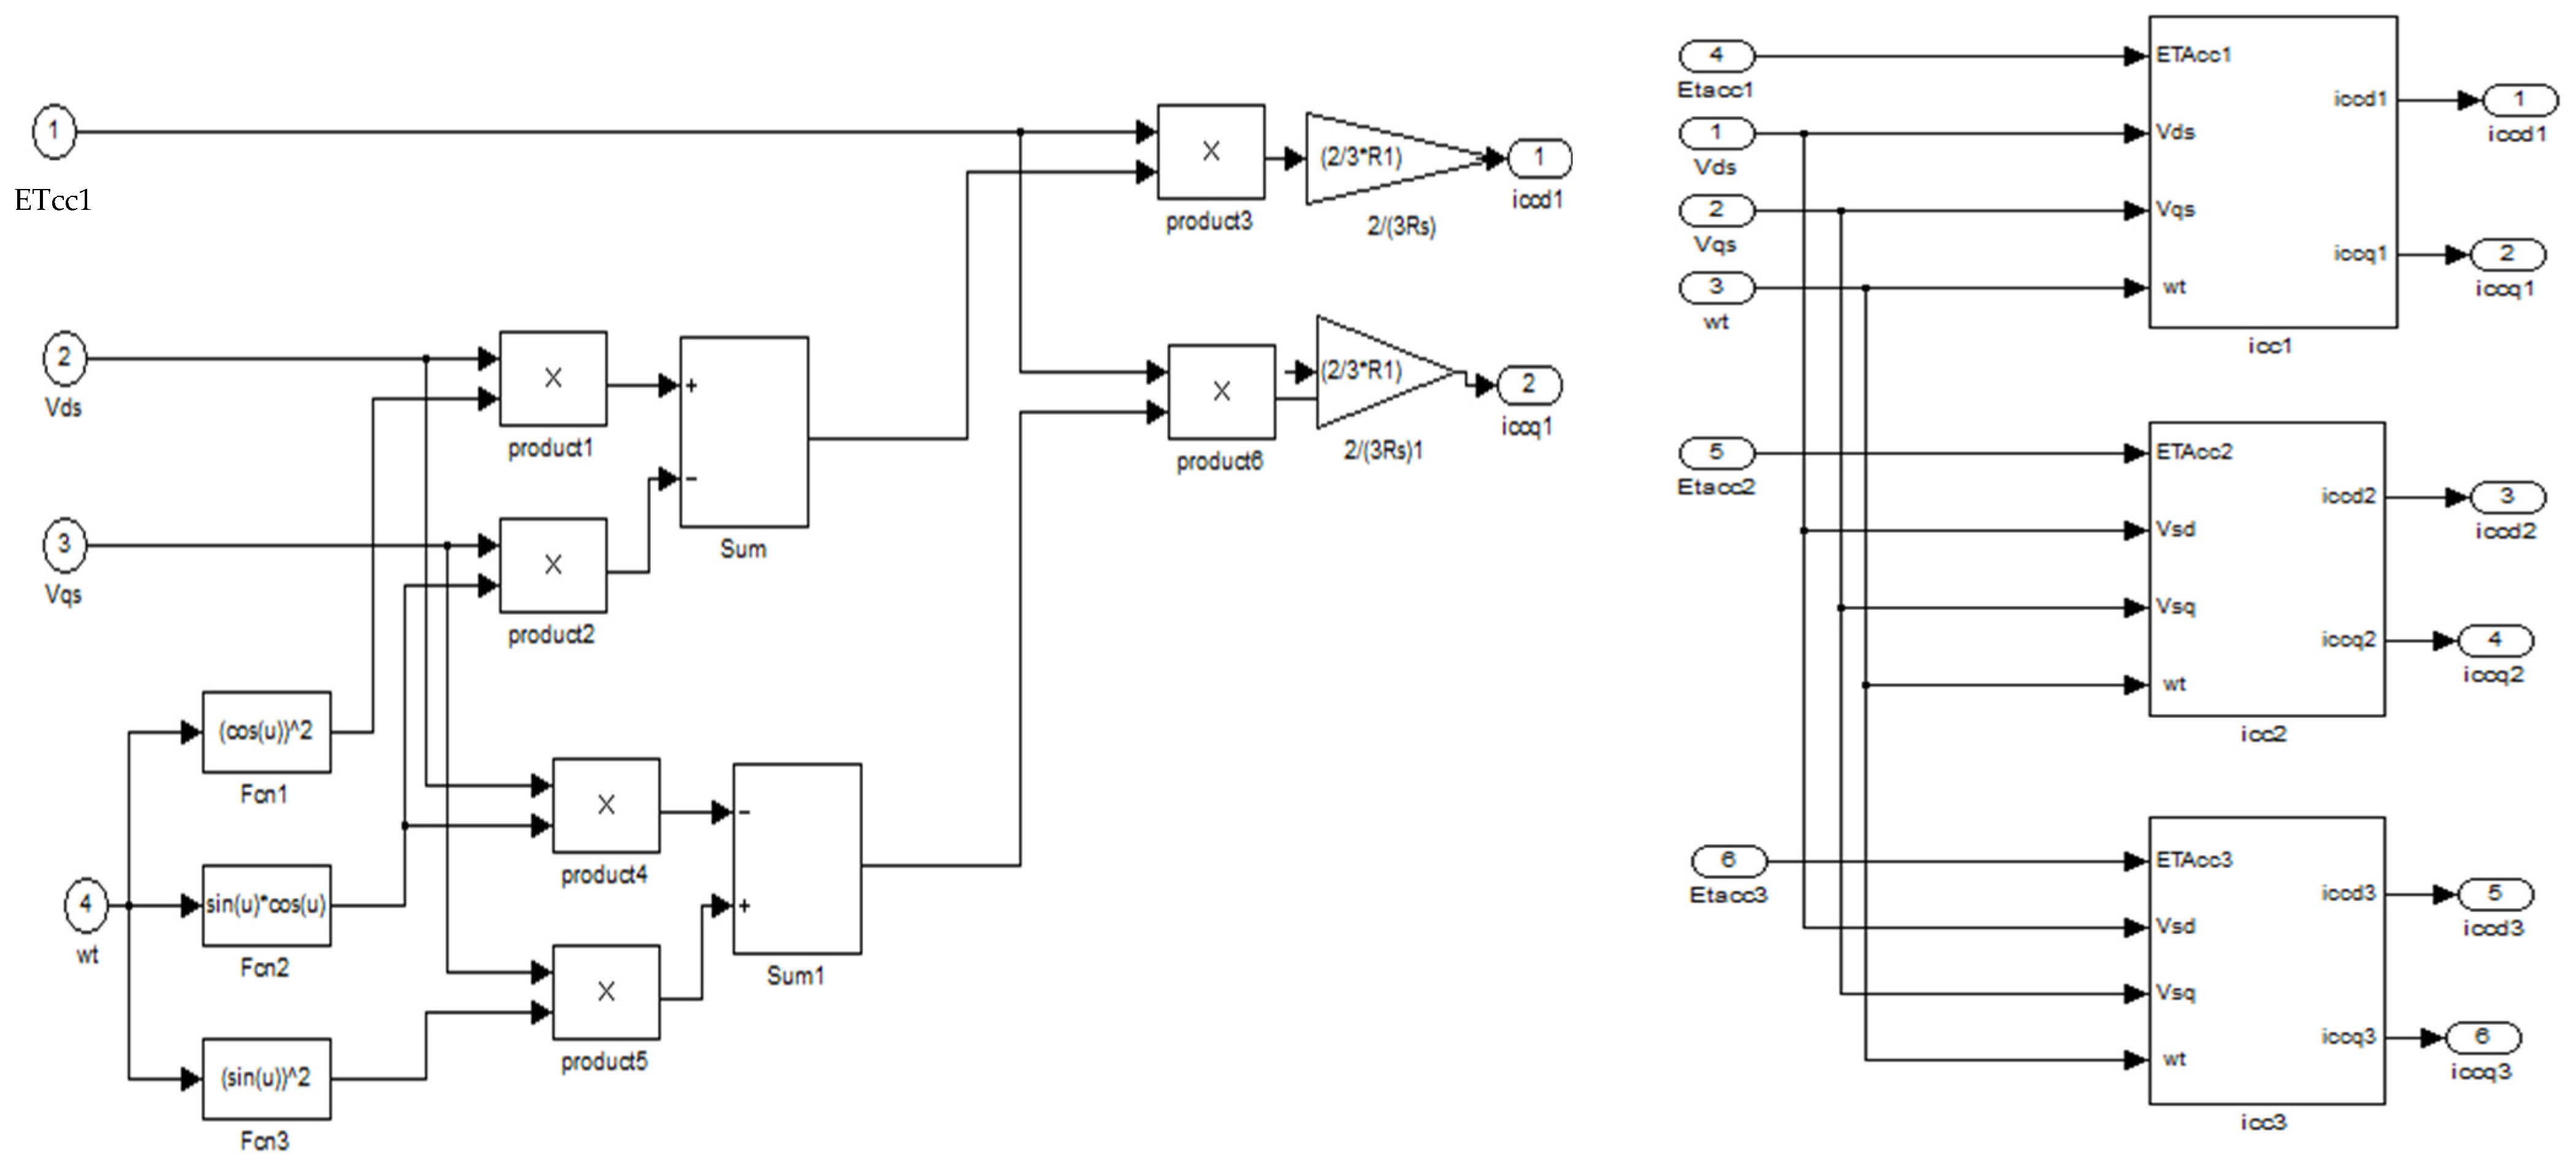
  • The detection parameter ( η cc ) represents the percentage of inter-turn short circuit winding, where this ratio is obtained by dividing the number of inter-turn short circuit winding by the total number of the stator winding in one phase. The short circuit current under d-q axis frame can be represented as shown in the following equations [31]:
i _ cck = 2 3 · η cck R 1 · p ( θ ) · Q ( θ cck ) · p ( θ ) ·   v _ dqs
[ cos ( θ ) cos ( θ + 90 ) sin ( θ ) sin ( θ + 90 ) ]
Q   ( θ cc ) = [ cos ( θ cc ) 2 sin ( θ cc ) · cos ( θ cc ) sin ( θ cc ) · cos ( θ cc ) sin ( θ cc ) 2 ]
where p ( θ ) is the rotational matrix, and θ is the rotor angle. The equation of the stator faults (11) is for the case of one phase. To represent faults in two or three phases, the following equation can be used:
i _ dqs =   ί _ dqs + k = 1 3   i _ cck   for   k = 1 , 2 , 3  
where   ί _ dqs (symbols must be the same) represents the stator current in its normal condition.

3.2.2. Fault in Rotor Part

The rotor’s faults in an induction motor can be represented as a new winding added to the rotor’s electrical winding, as shown in Equation (15). When representing a fault in the rotor, two important points should be considered: (1) the fault localization, which is represented by the angle ( θ o ); this is the angle between the rotor axis of a broken bar and the first phase axis in the rotor ( a r ); and (2) the ratio of fault, which gives the amount of fault (   η o ), which is equal to the number of inter-turns of the fault divided by the full number of inter-turns of the healthy phase. Equation (16) represents current in a faulty winding:
0 =   η o ·   R 2 i o + d dt Ψ o
i _ ˜ dq o = R o · d Ψ _ dqm dt = 2 3 ·   η o R 2 · Q ( θ o ) · d Ψ _ dqm dt
where i o is the faulty rotor current, Ψ o is the faulty rotor flux, R o is the faulty rotor resistance, and d Ψ _ dqm is magnetizing flux. According to Equation (16), the fault winding can be represented as a resistance element connected in parallel to the rotor’s resistance and magnetizing inductance; hence, we have the following:
1 R eq . = 1 R 1 + 1 R o
R eq . 1 = R 1 1 + 2 3 · η o   · R 1 1 · Q ( θ o )  
where Q ( θ o ) is the localization matrix. Then, the equivalent resistance can be written as follows:
R eq . = R 1 + R fault
R eq . = R 1 α 1 α · R 1   · Q ( θ o )   where   α = ( 2 3 ) ·   η o

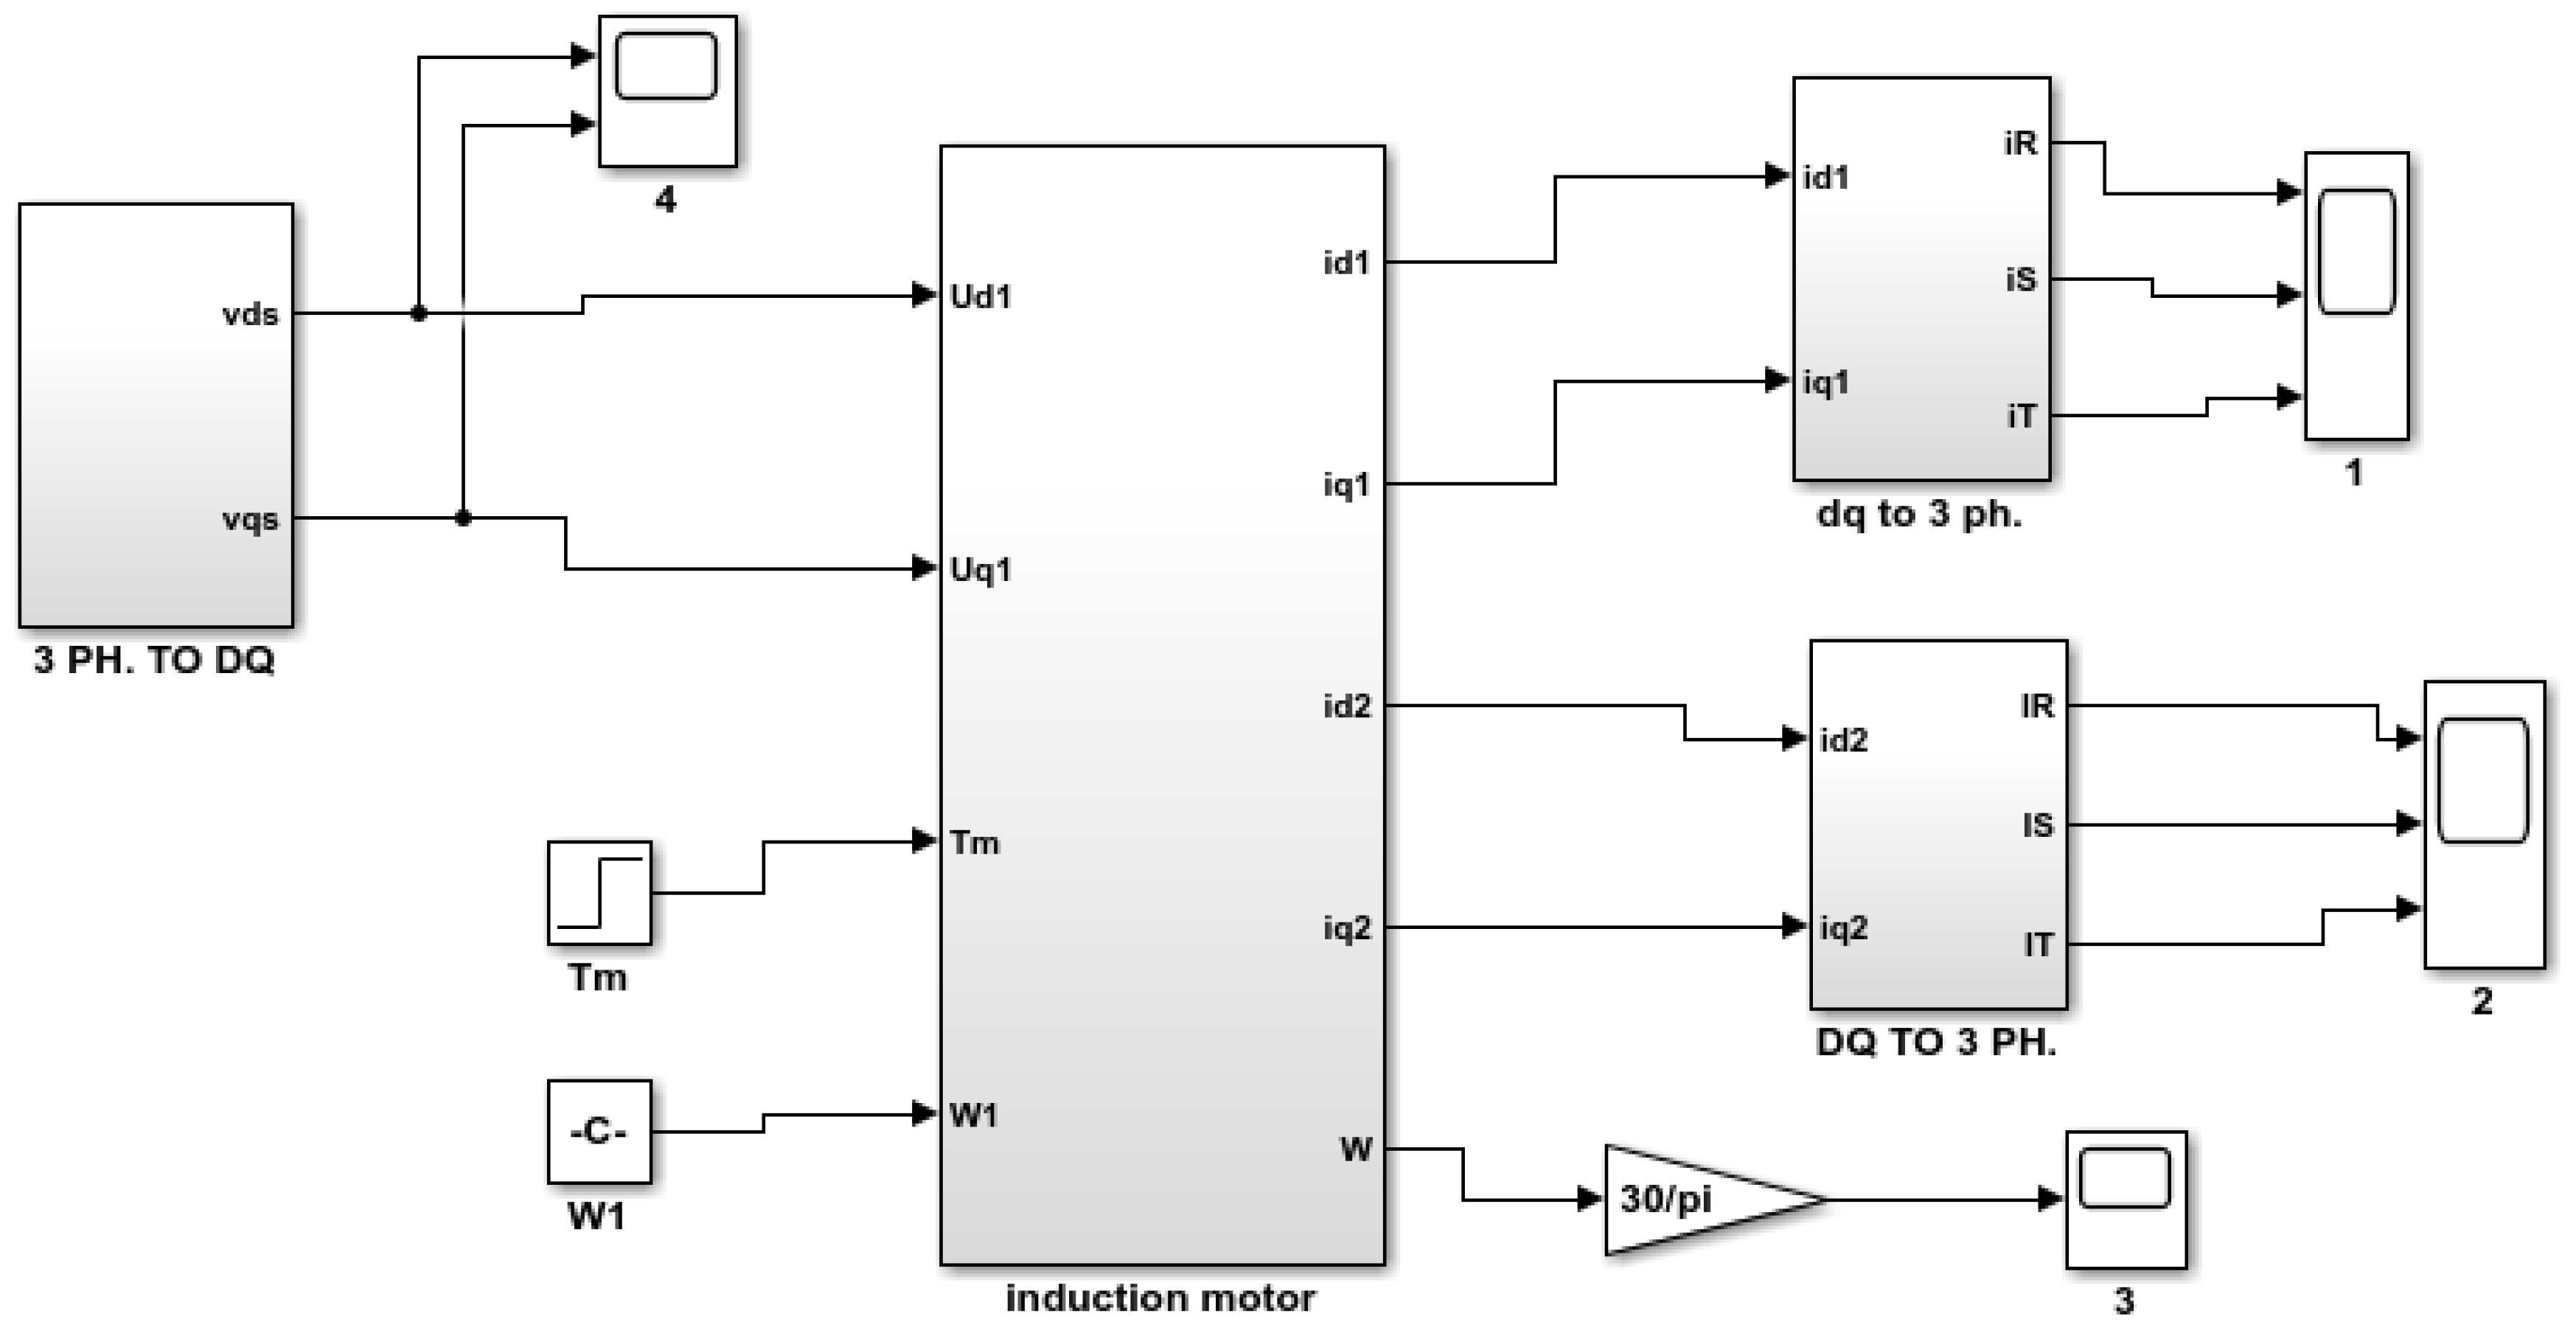
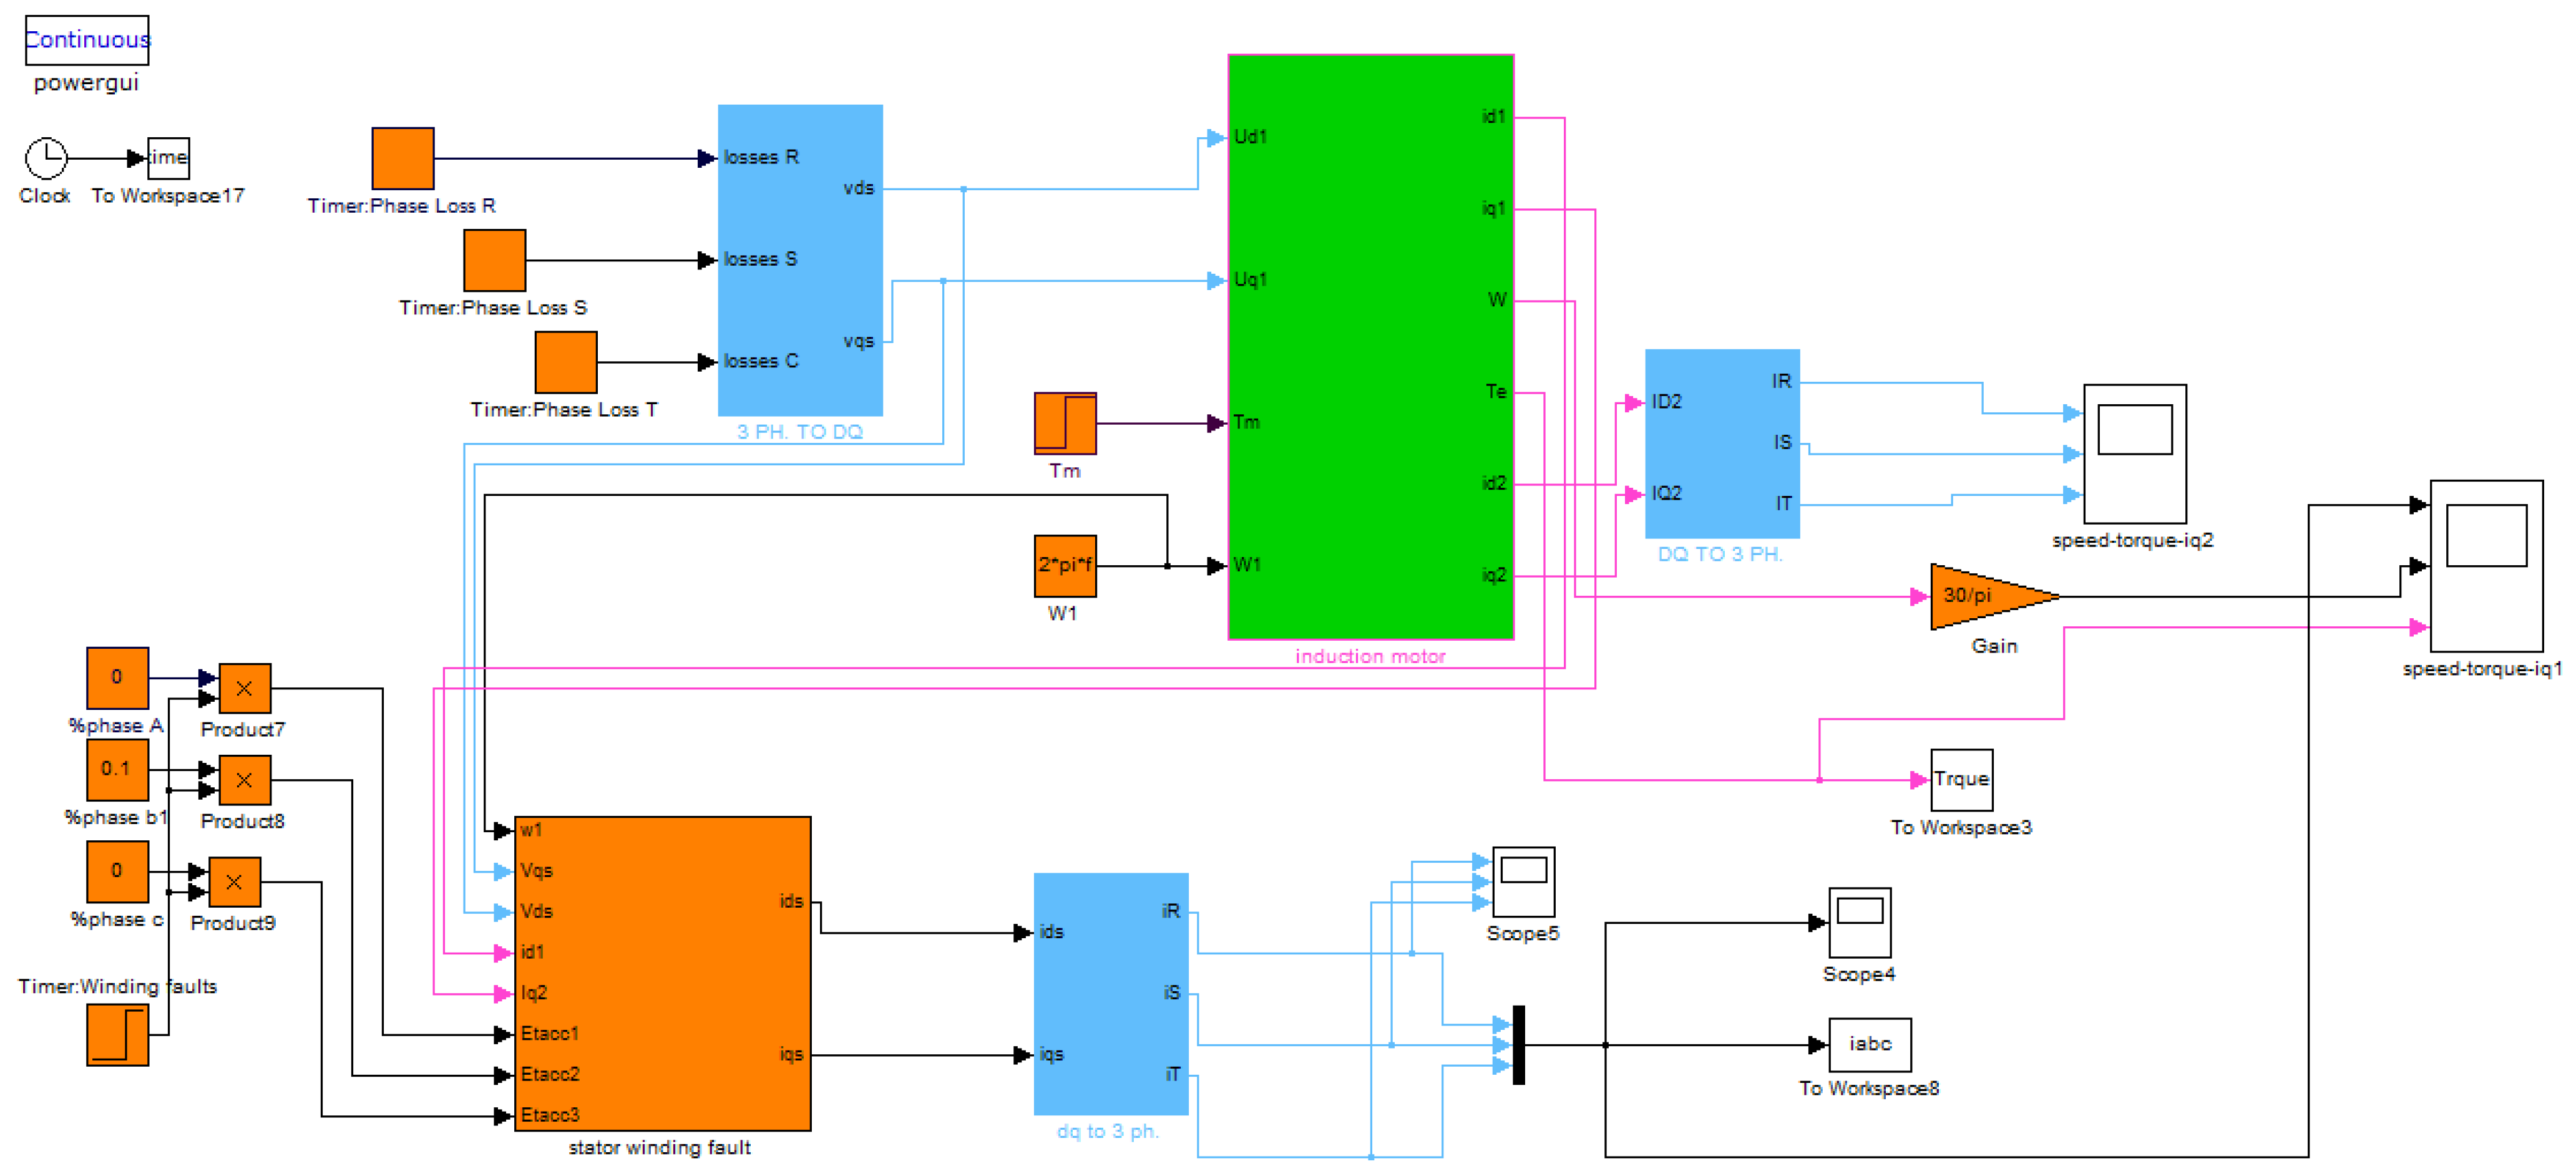
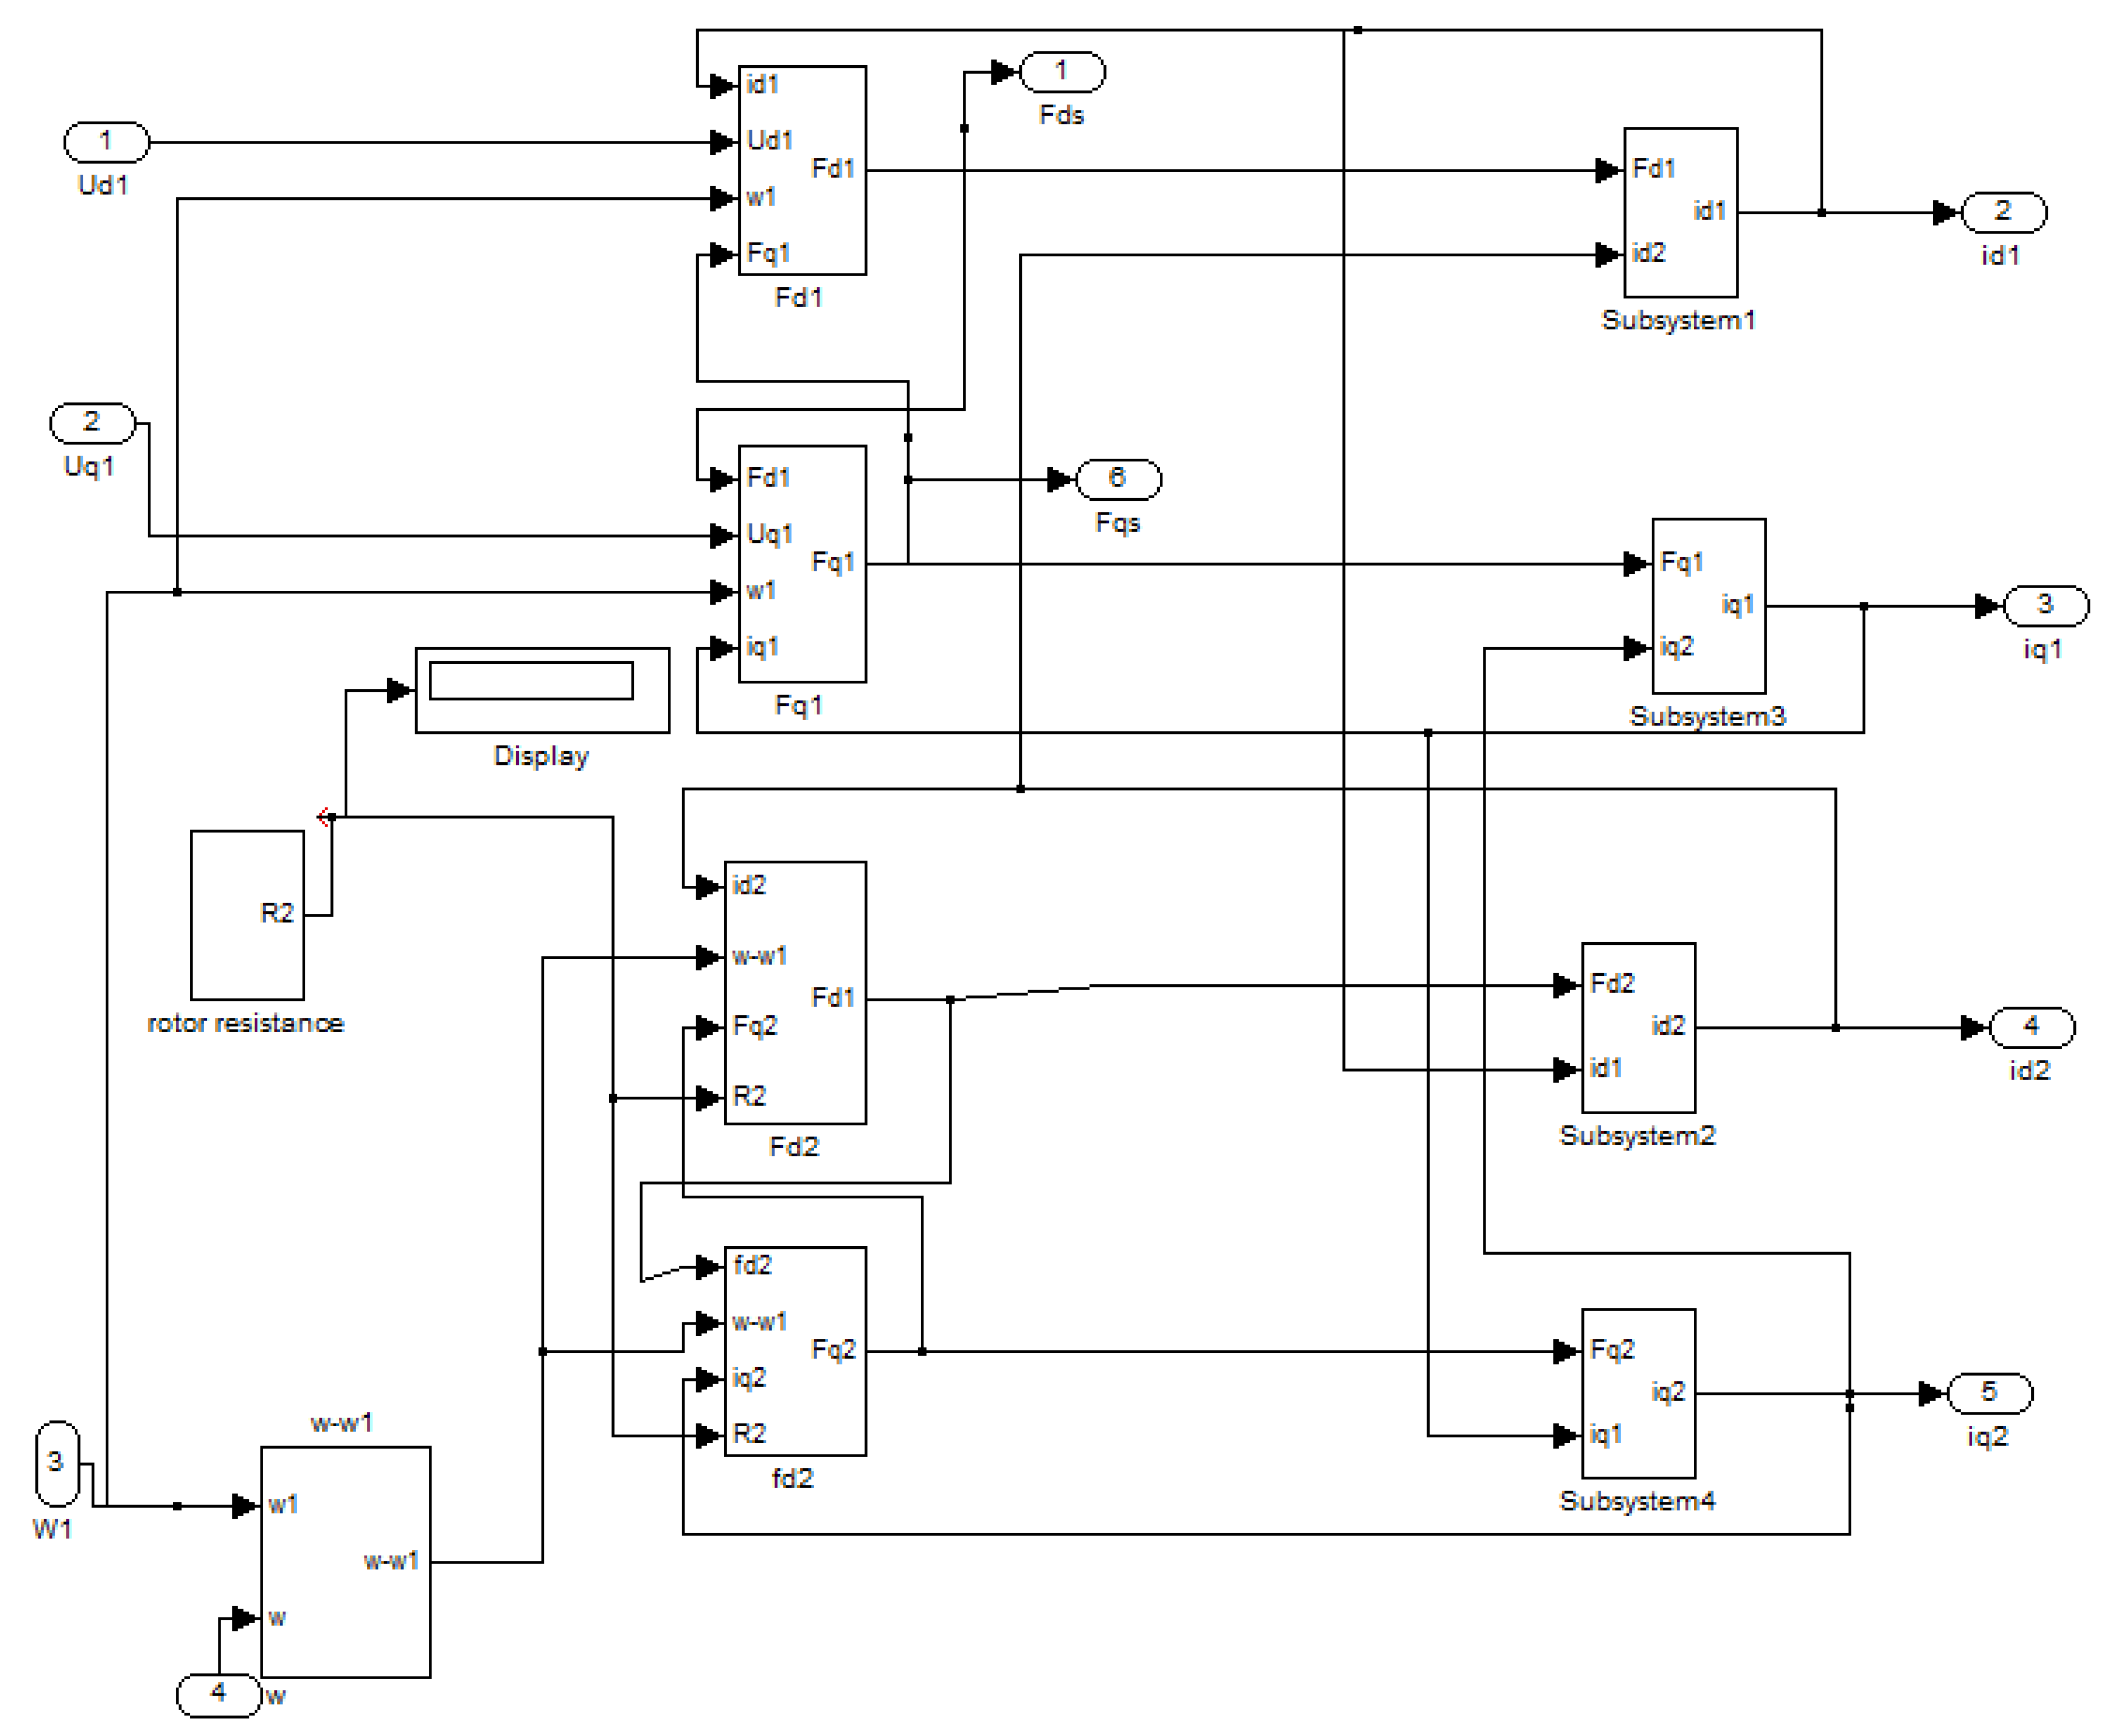
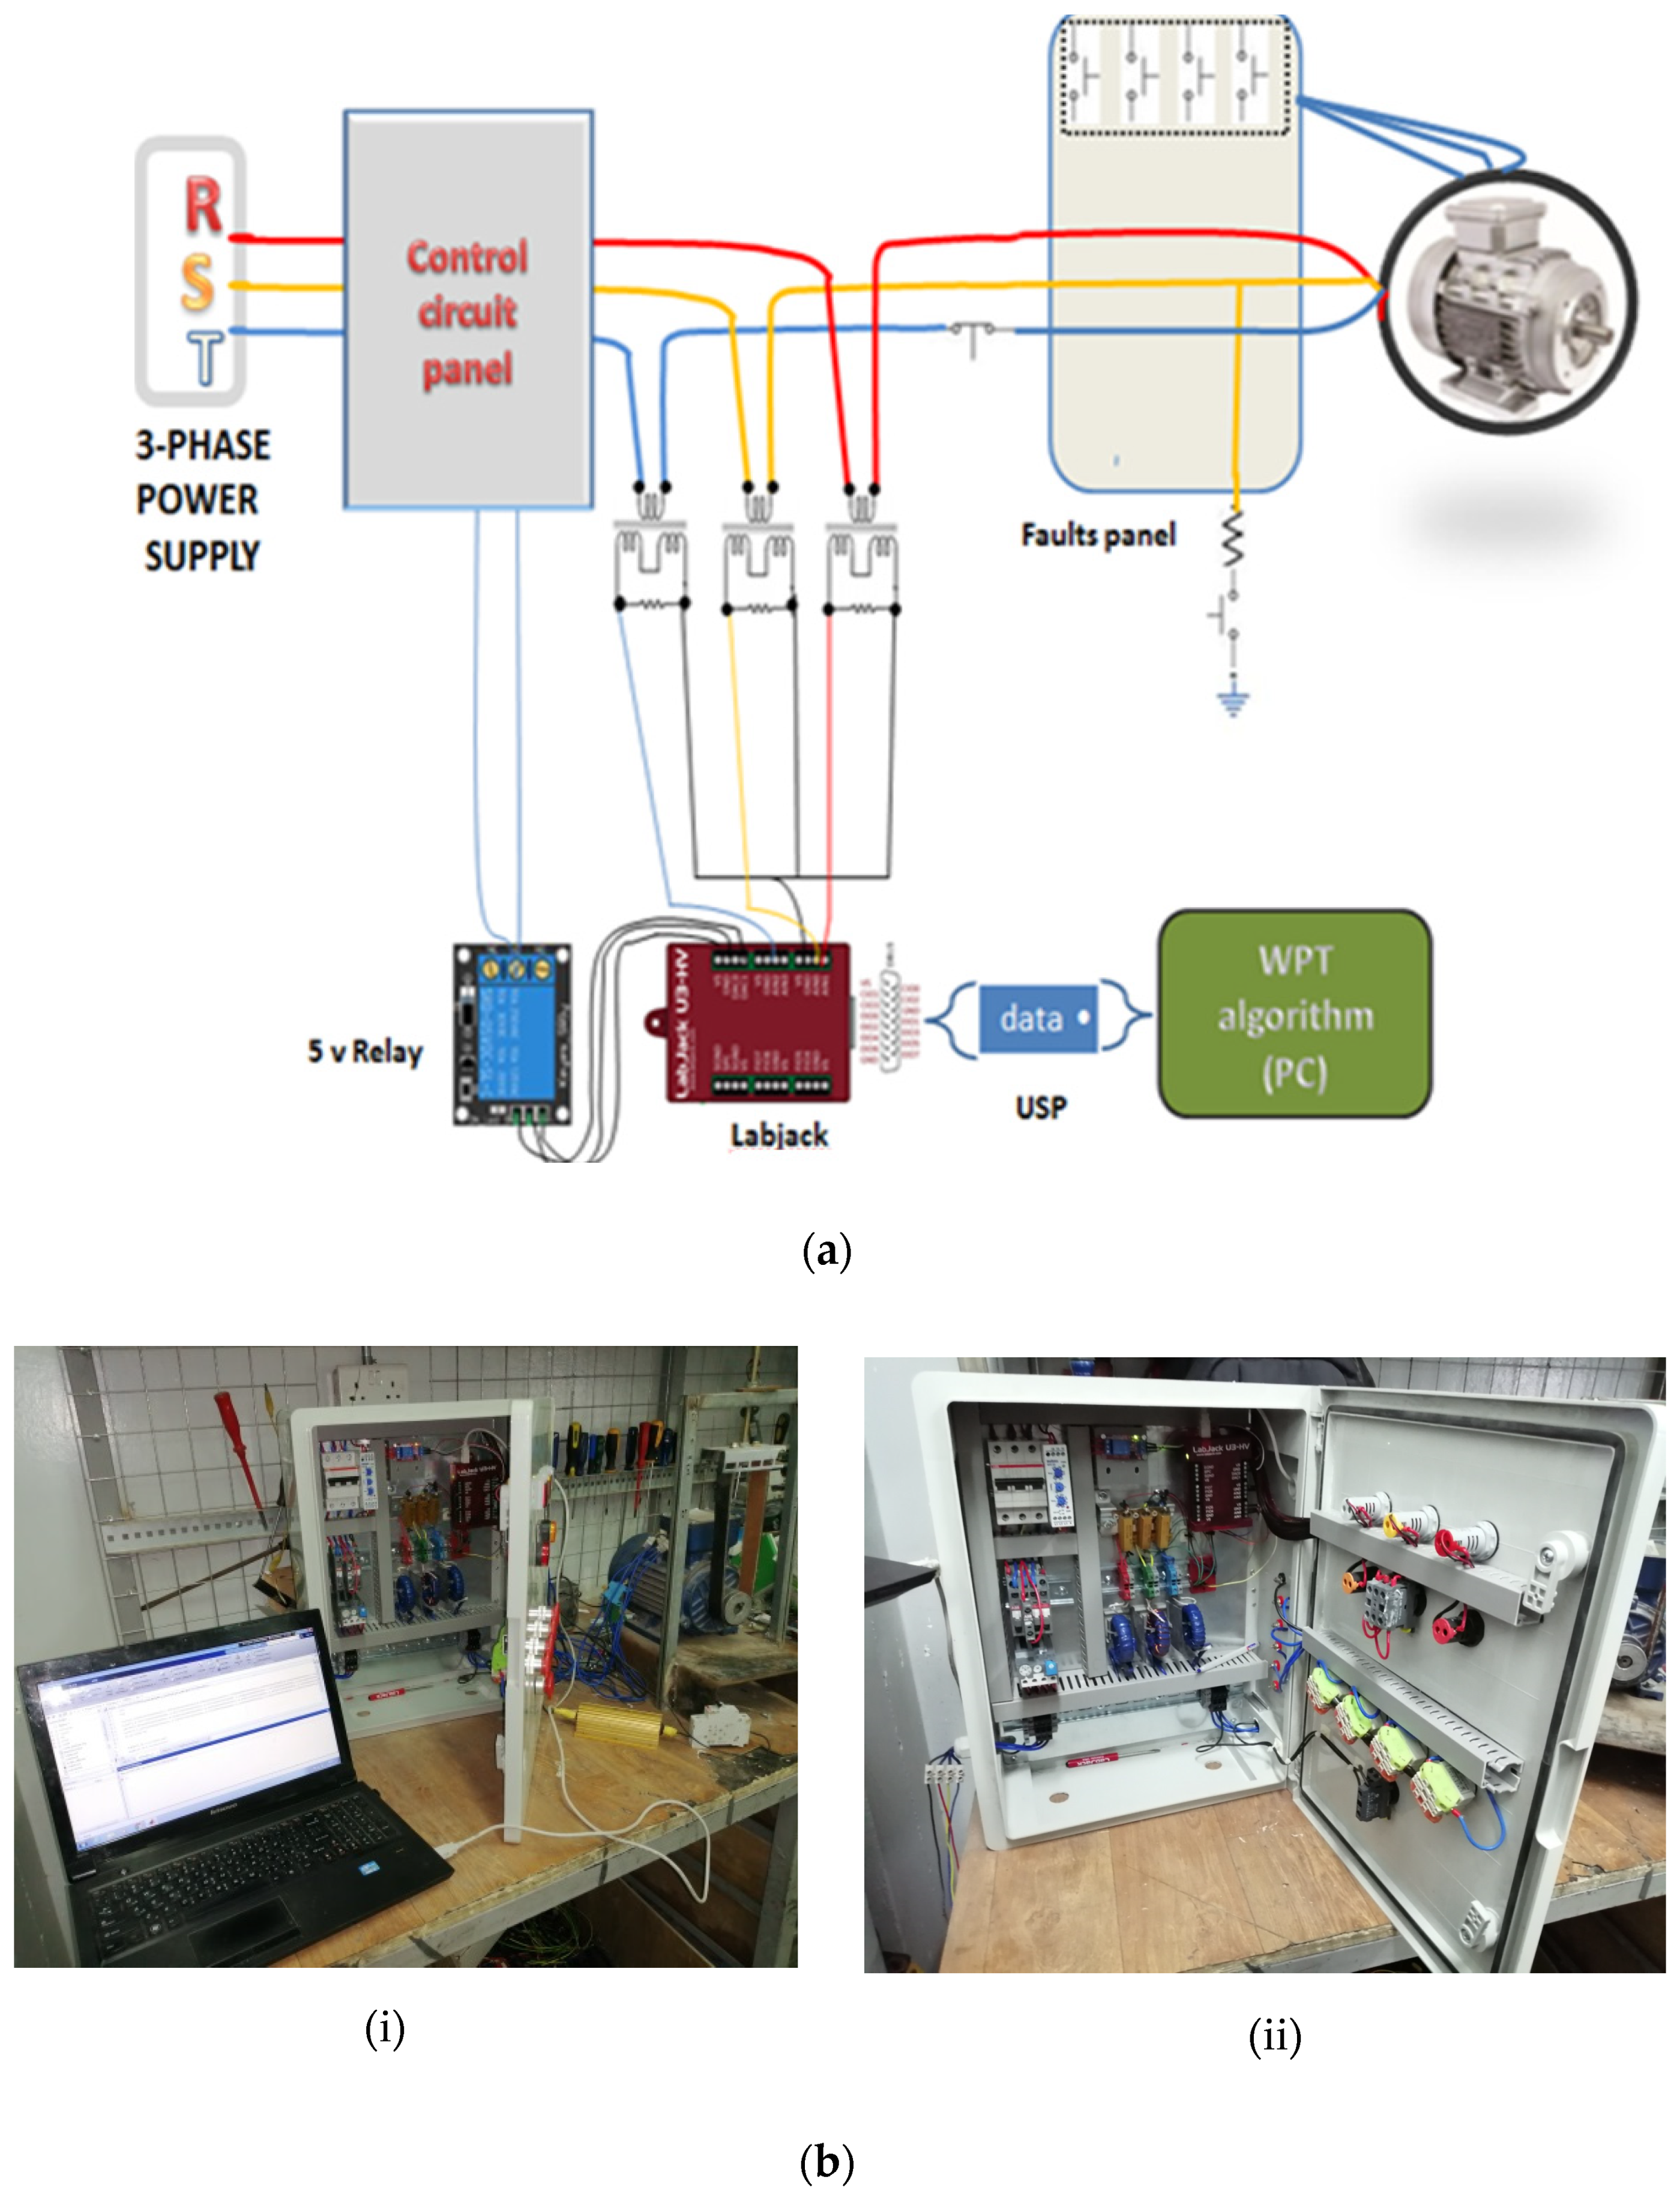
4. Simulink Model of the Proposed Technique and Real Time Data Collection

The Simulink model of an induction motor including its stator and rotor faults can be represented as shown in Figure 2, Figure 3, Figure 4, Figure 5, Figure 6, Figure 7, Figure 8, Figure 9 and Figure 10. Figure 2 represents a healthy induction motor. While Figure 3 and Figure 4 represent a motor with the fault in its stator and rotor, respectively, where its inputs are v d 1 ,   v q 1 ,   ω k , and   T m . Figure 3 expands the block diagram of Figure 2. Figure 2 is divided into five blocks: The first two blocks represent converting three phase voltages to d-q axis frame voltage; the main block in this figure is the three-phase induction motor in d-q axis, where the implementation of this block depends on the above equations (Equations (2)–(10)), while the last two blocks represent converting motor’s current from d-q current axis frame to current in three phase i a , i b , and   i c .
The Simulink model of an induction motor with faults in its stator can be implemented in MATLAB Simulink, as shown in Figure 4. This figure represents the MATLAB Simulink implementation of inter-turn stator faults block. Figure 5 shows the sub-block of the stator faults, which is implemented based on Equations (11)–(13), while Figure 4 represents a healthy induction motor, as shown in Figure 2. Adding the inter-turn stator fault block, which is implemented in Figure 5, has been performed according to Equation (14), where Equation (14) represents the normal stator current combined with current that results from a stator’s fault. The Simulink model of the induction motor with rotor faults can be implemented in MATLAB Simulink, as shown in Figure 6. Like stator faults, rotor faults can be implemented according to Equation (18), which represent rotor faults and then added to the system provided in Figure 2.
The sub-block “rotor faults” in Figure 6 represents the effect of a broken bar in the rotor of an induction motor according to Equation (18) and as illustrated in Figure 7.
The collected data from the Simulink induction motor model are shown in Figure 8, Figure 9 and Figure 10. These figures represent the current signal for 25% short circuit fault in phase c, phase a to ground fault, and line a to line b fault, respectively.

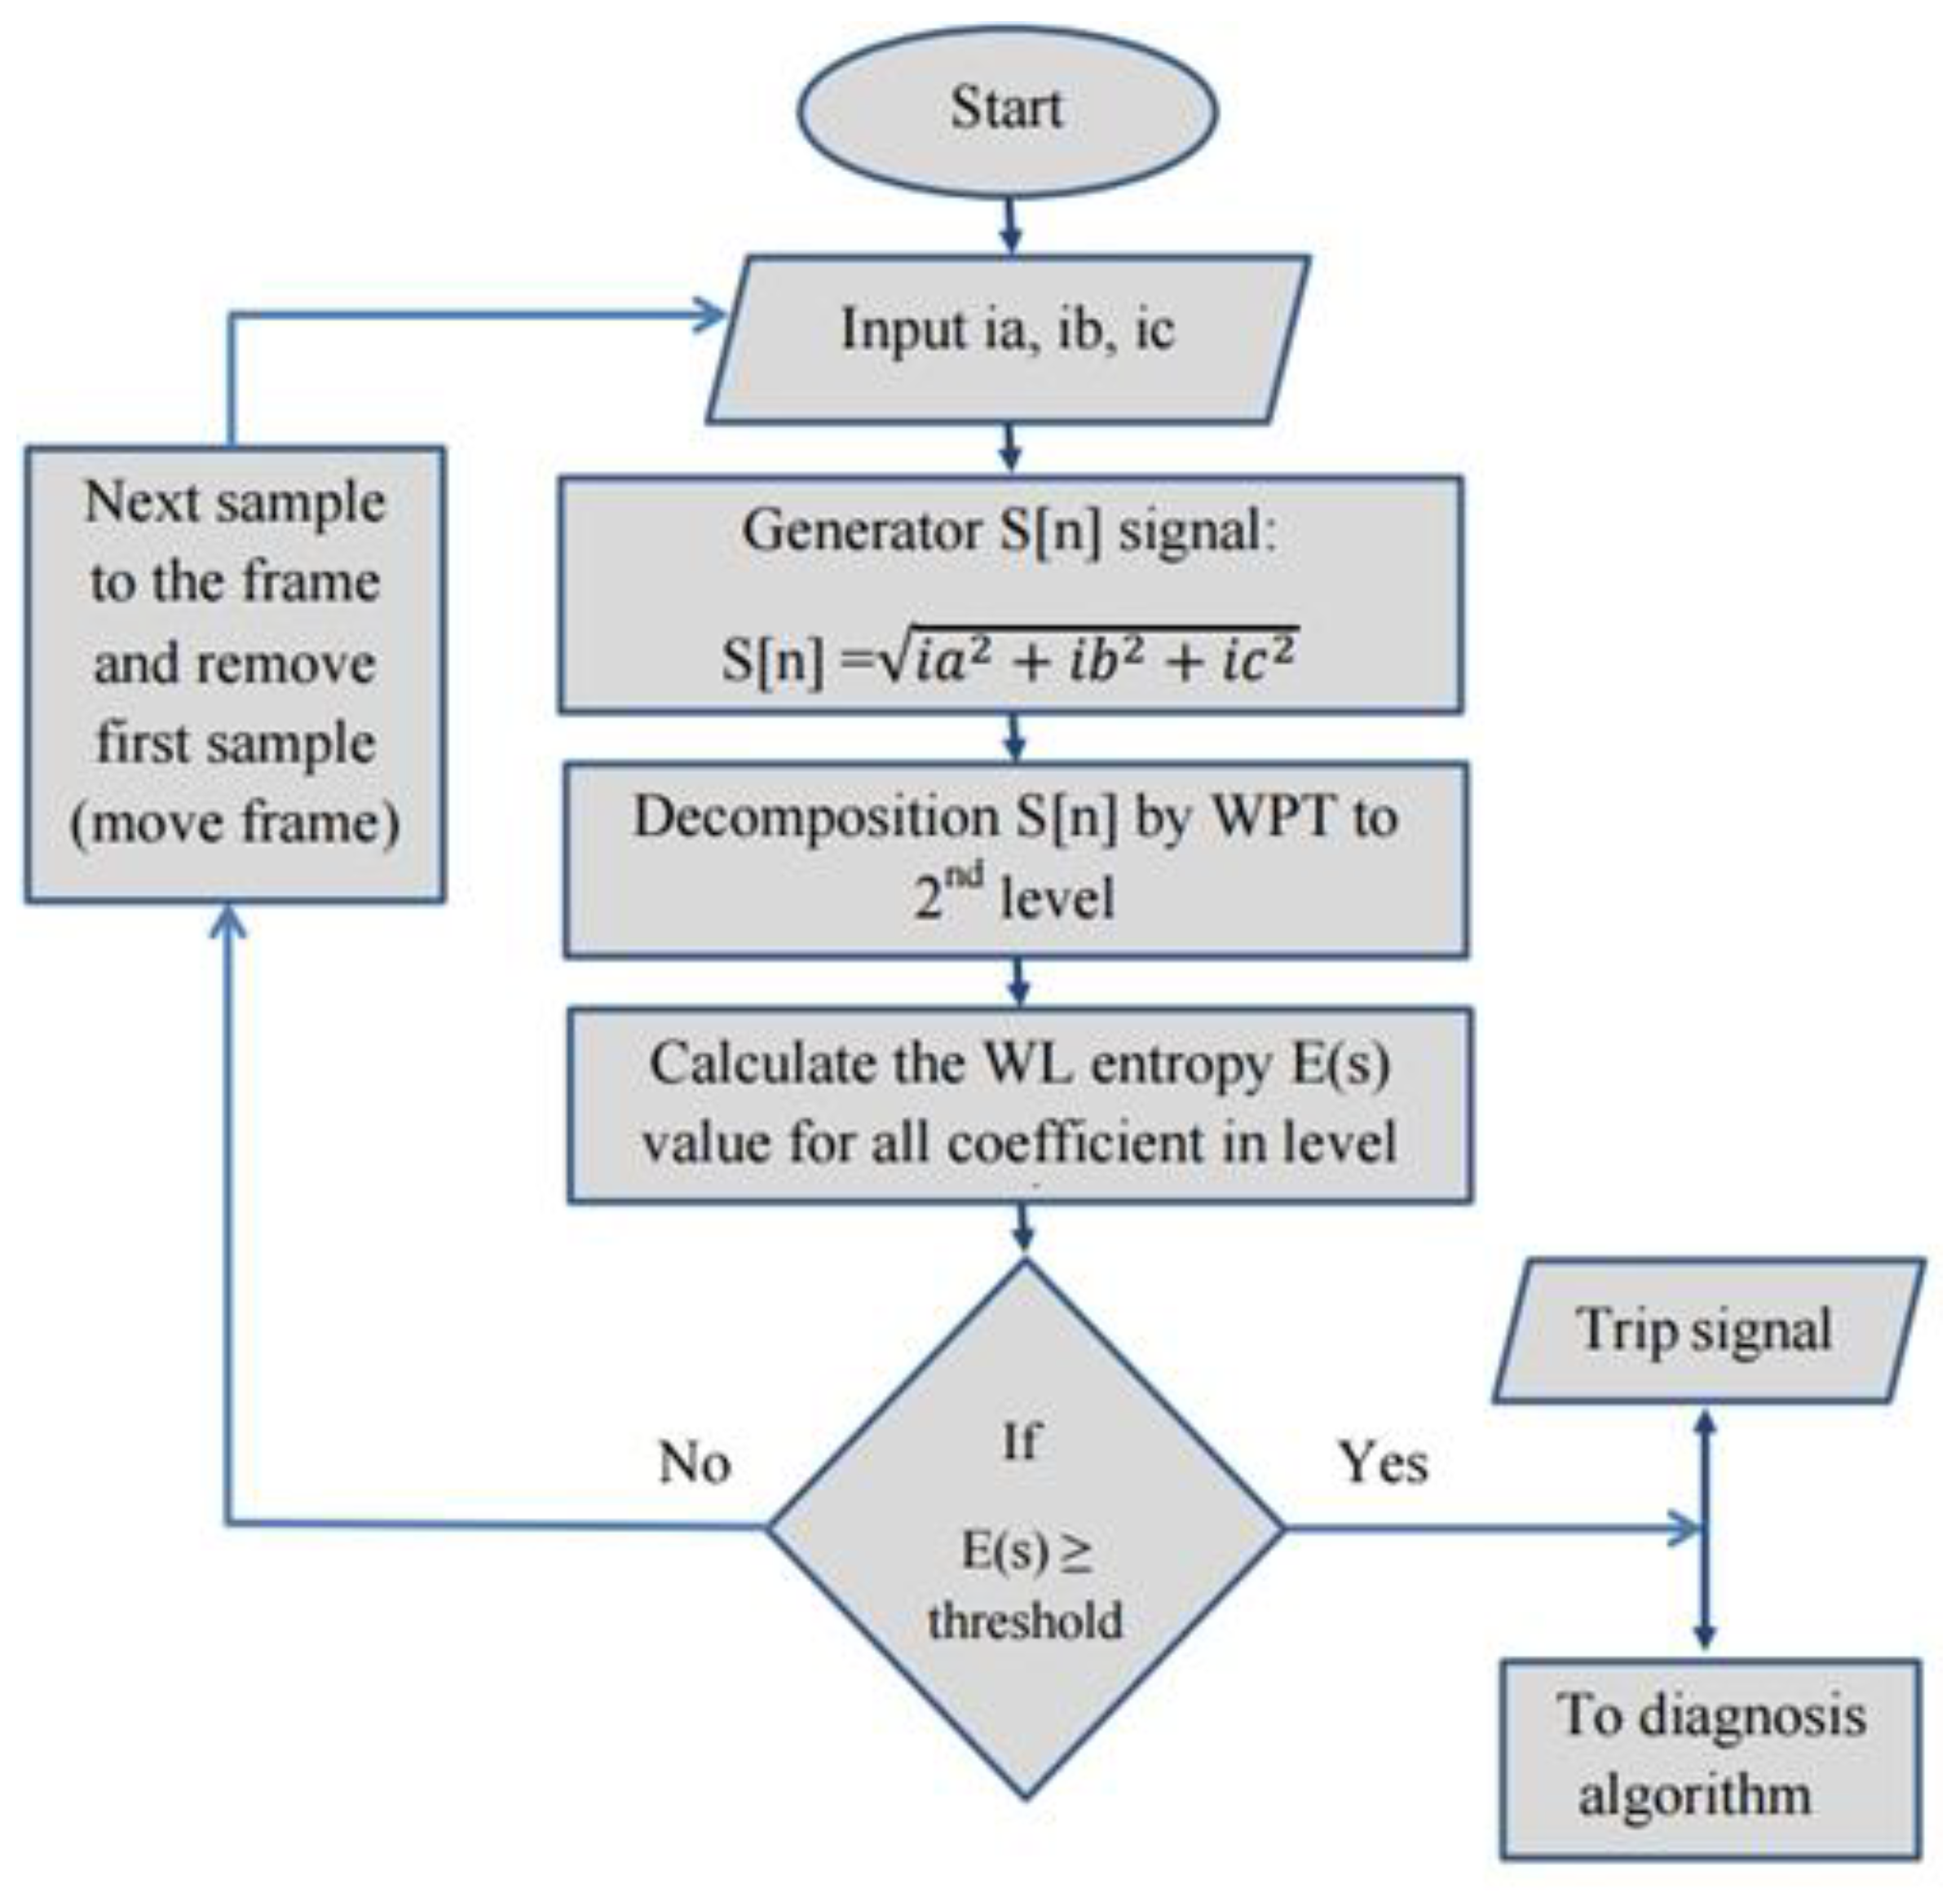
5. Proposed Fault Detection and Diagnosis Algorithm

To study the proposed technique and determine its effectiveness in detecting electrical faults in induction motors, the proposed algorithm is applied to data gathered from the simulation model of the induction motor in the MATLAB Simulink platform. Two algorithms are presented in this paper. The first algorithm is a moving window frame technique, where each new window frame current samples overlaps 63 out of its 64 samples with its previous window samples, and the window frame movement is one sample at each step; and the second algorithm is a non-overlapping window frame method, where a window of 64 samples size is taken from the motor’s combined current signal and processed, as shown in Figure 11 and Figure 12. In the non-overlapping method, the maximum delay between the occurrence of a fault and its detection is 64 samples (a quarter of the cycle) and its processing time. The block diagram of this method is illustrated in Figure 12. The disadvantage of the second algorithm is its slower response in fault detection. To overcome the disadvantage of the non-overlapping window frame algorithm and to speed up the fault detection process, the moving frame algorithm is proposed, where the condition of the motor is assessed for possible fault after every new current sample is arrived, as shown in Figure 11.
If the proposed method detects a fault in the induction motor, it activates a trip signal, which is sent to the circuit breaker of the motor to disconnect the motor from its power supply, and an alarm window will be activated on the PC screen. The proposed algorithm is then moved to its next stage to classify the type of electrical fault in the induction motor. The diagnosis algorithm’s block diagram is shown in Figure 13.

Proposed Fault Detection Threshold

The three current signals of the motor stator, i a ,   i b , and   i c are combined to generate a single current signal called S by computing their root mean square value. The resulting current signal, S, is then sampled at sampling rate of 12.8 kHZ, generating a discrete signal, which is used for fault detection and recognition. The proposed method then takes 64 samples of the resulting signal in each of its processing stages using either of its window frame sampling methods, as explained in the previous section. It then applies two level WPT on the window samples, decomposes the window samples to their wavelet subbands using ‘sym5’ mother wavelet, and generates four wavelet subbands called aa2, ad2, da2, and dd2. The wavelet energies for the samples of a healthy and a faulty induction motor are shown in Figure 14 and Figure 15, respectively. The proposed method uses the total energy value of all coefficients in the second level of the WPT subbands as a feature for fault detection and diagnosis in the induction motor.
As shown in Figure 14 and Figure 15, the energy values for a health condition are equal to zero in all WPT high frequency subbands, ad2, da2, and dd2, while aa2 subband has a constant value, which is proportional to the energy conversion rate of the motor. It is common knowledge that aa2, the approximation subband, provides an approximation representation of the motor total current, and theWPT high frequency subbands, ad2, da2 and dd2, demonstrate the ac behavior of the current signal. In a healthy motor, the energy in its high frequency subbands is low. However, faults in an induction motor results in fluctuation in its current signal, which can be monitored and assessed using the information in its current WPT high frequency subbands’ signal. Empirical investigation in this research showed that the EE value of the da2 subband can be used to detect and classify the fault within the motor. As the information in this WPT subband demonstrates the ac behavior of the motor total current signal, the combined current signal is first smoothed by filtering the input current using the WPT low-pass filter and then its high-frequency components are extracted by passing the smoothed signal via the wavelet high-pass filter. Several empirical threshold values are determined to identify the type of fault in the motor using information presented in Figure 16. Experimental results show that the EE value in the da2 WP subband has a direct link with the type of the fault in the motor as follows: a) A healthy induction motor has a small EE value of almost zero; b) when a fault occurs in the motor’s rotor, the effect of this fault on the current signal will create an EE value higher than zero; and c) when the stator is faulty, the EE value will be higher than the EE value of the motor with a fault in its rotor, and as the number of faulty coils increase, the EE value of the da2 signal is increased too.
The EE values of all four WPT subbands of the motor for different types of faults are calculated and tabulated in Table 3.
From Table 3, the EE value of da2 can be used to empirically determine threshold values for the recognition of different faults in an induction motor, as also shown in Figure 16.

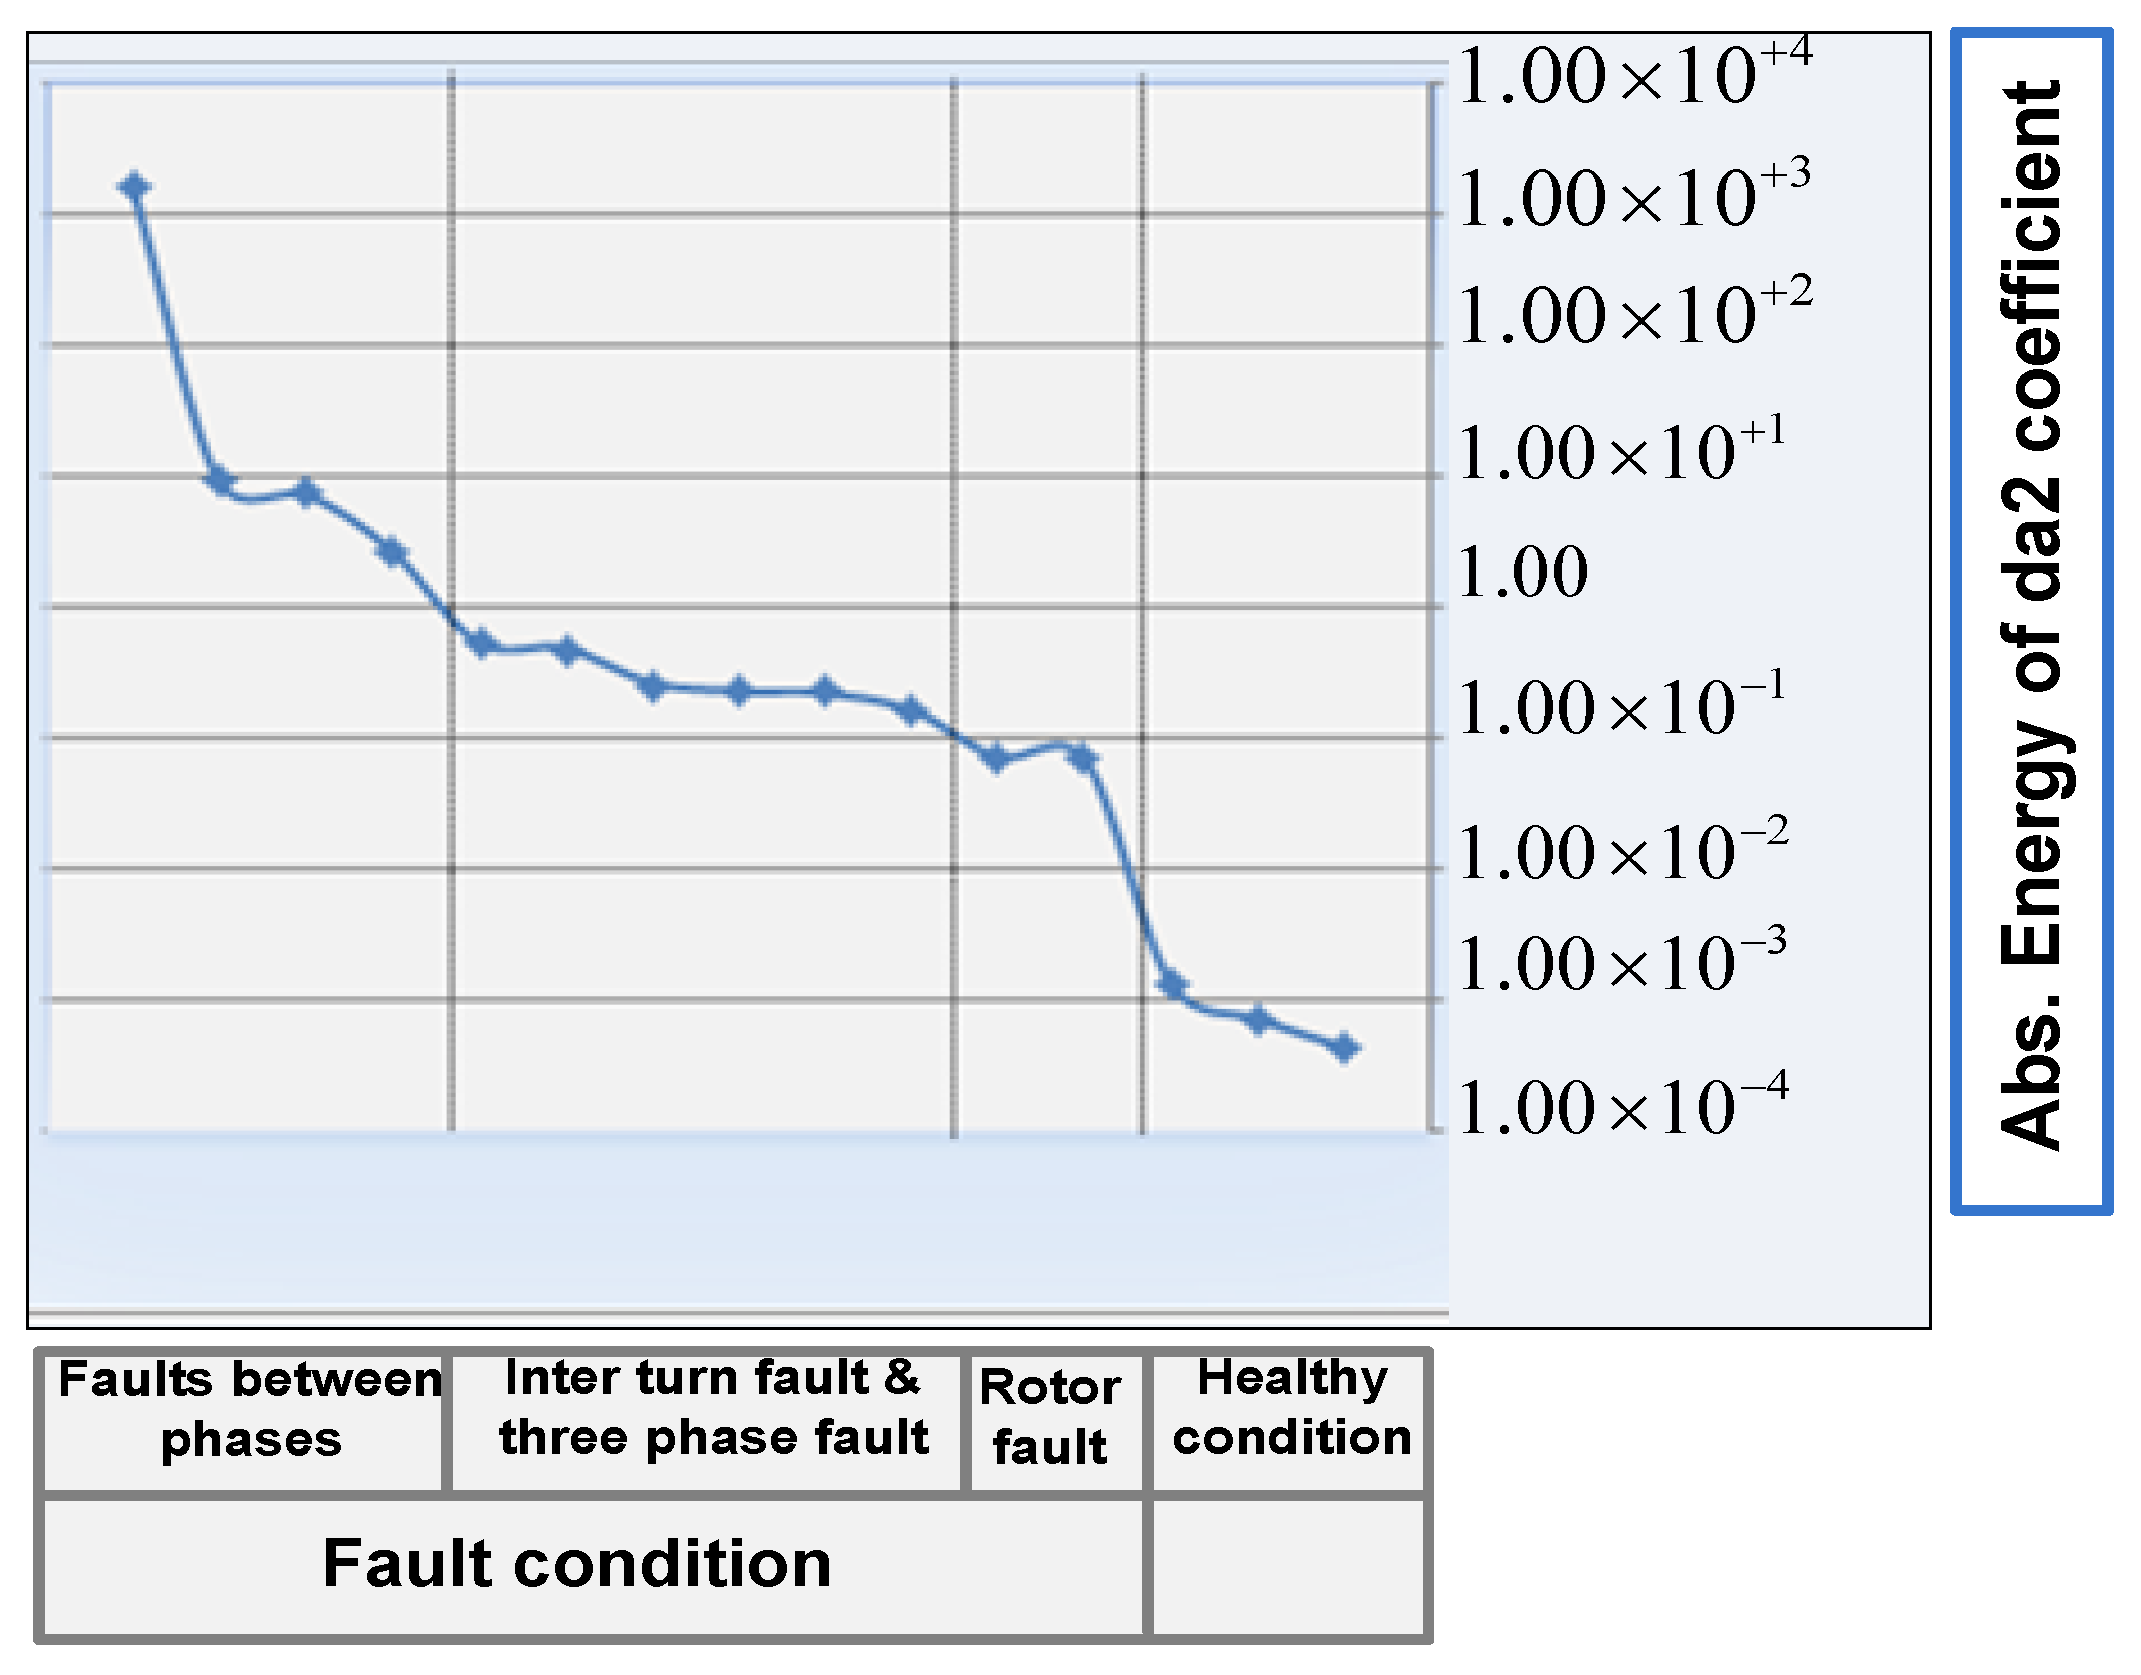
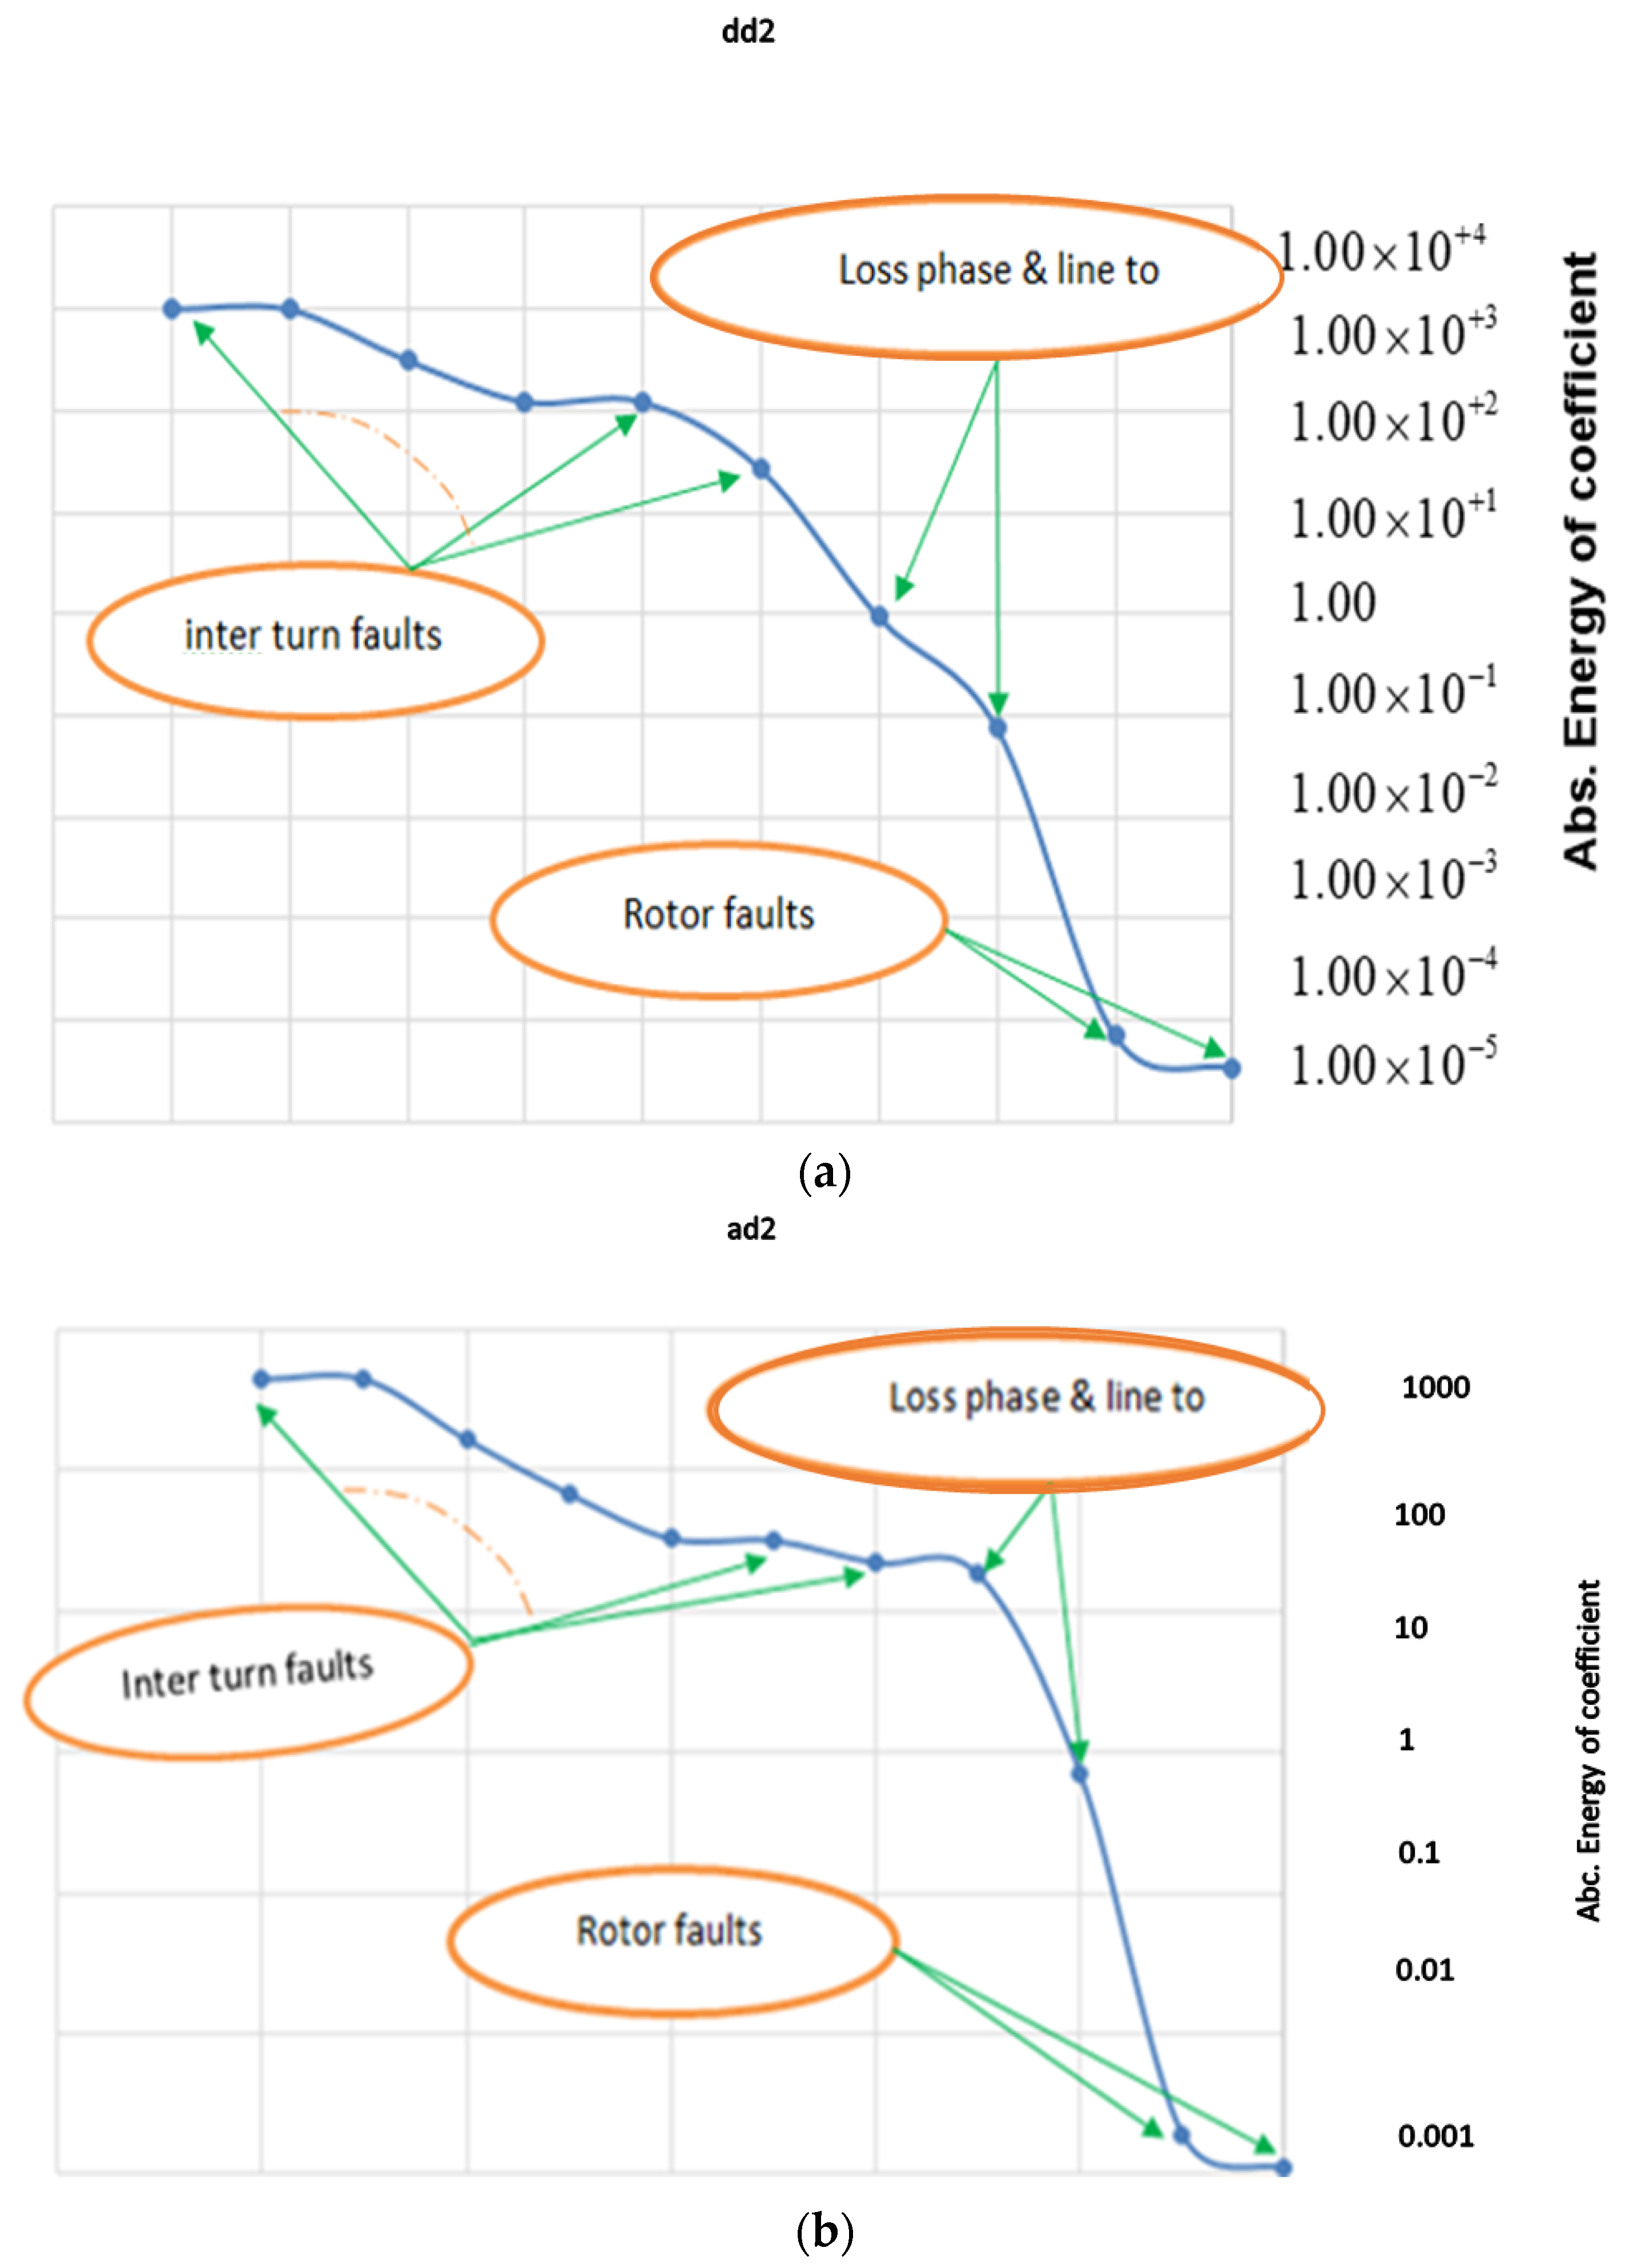
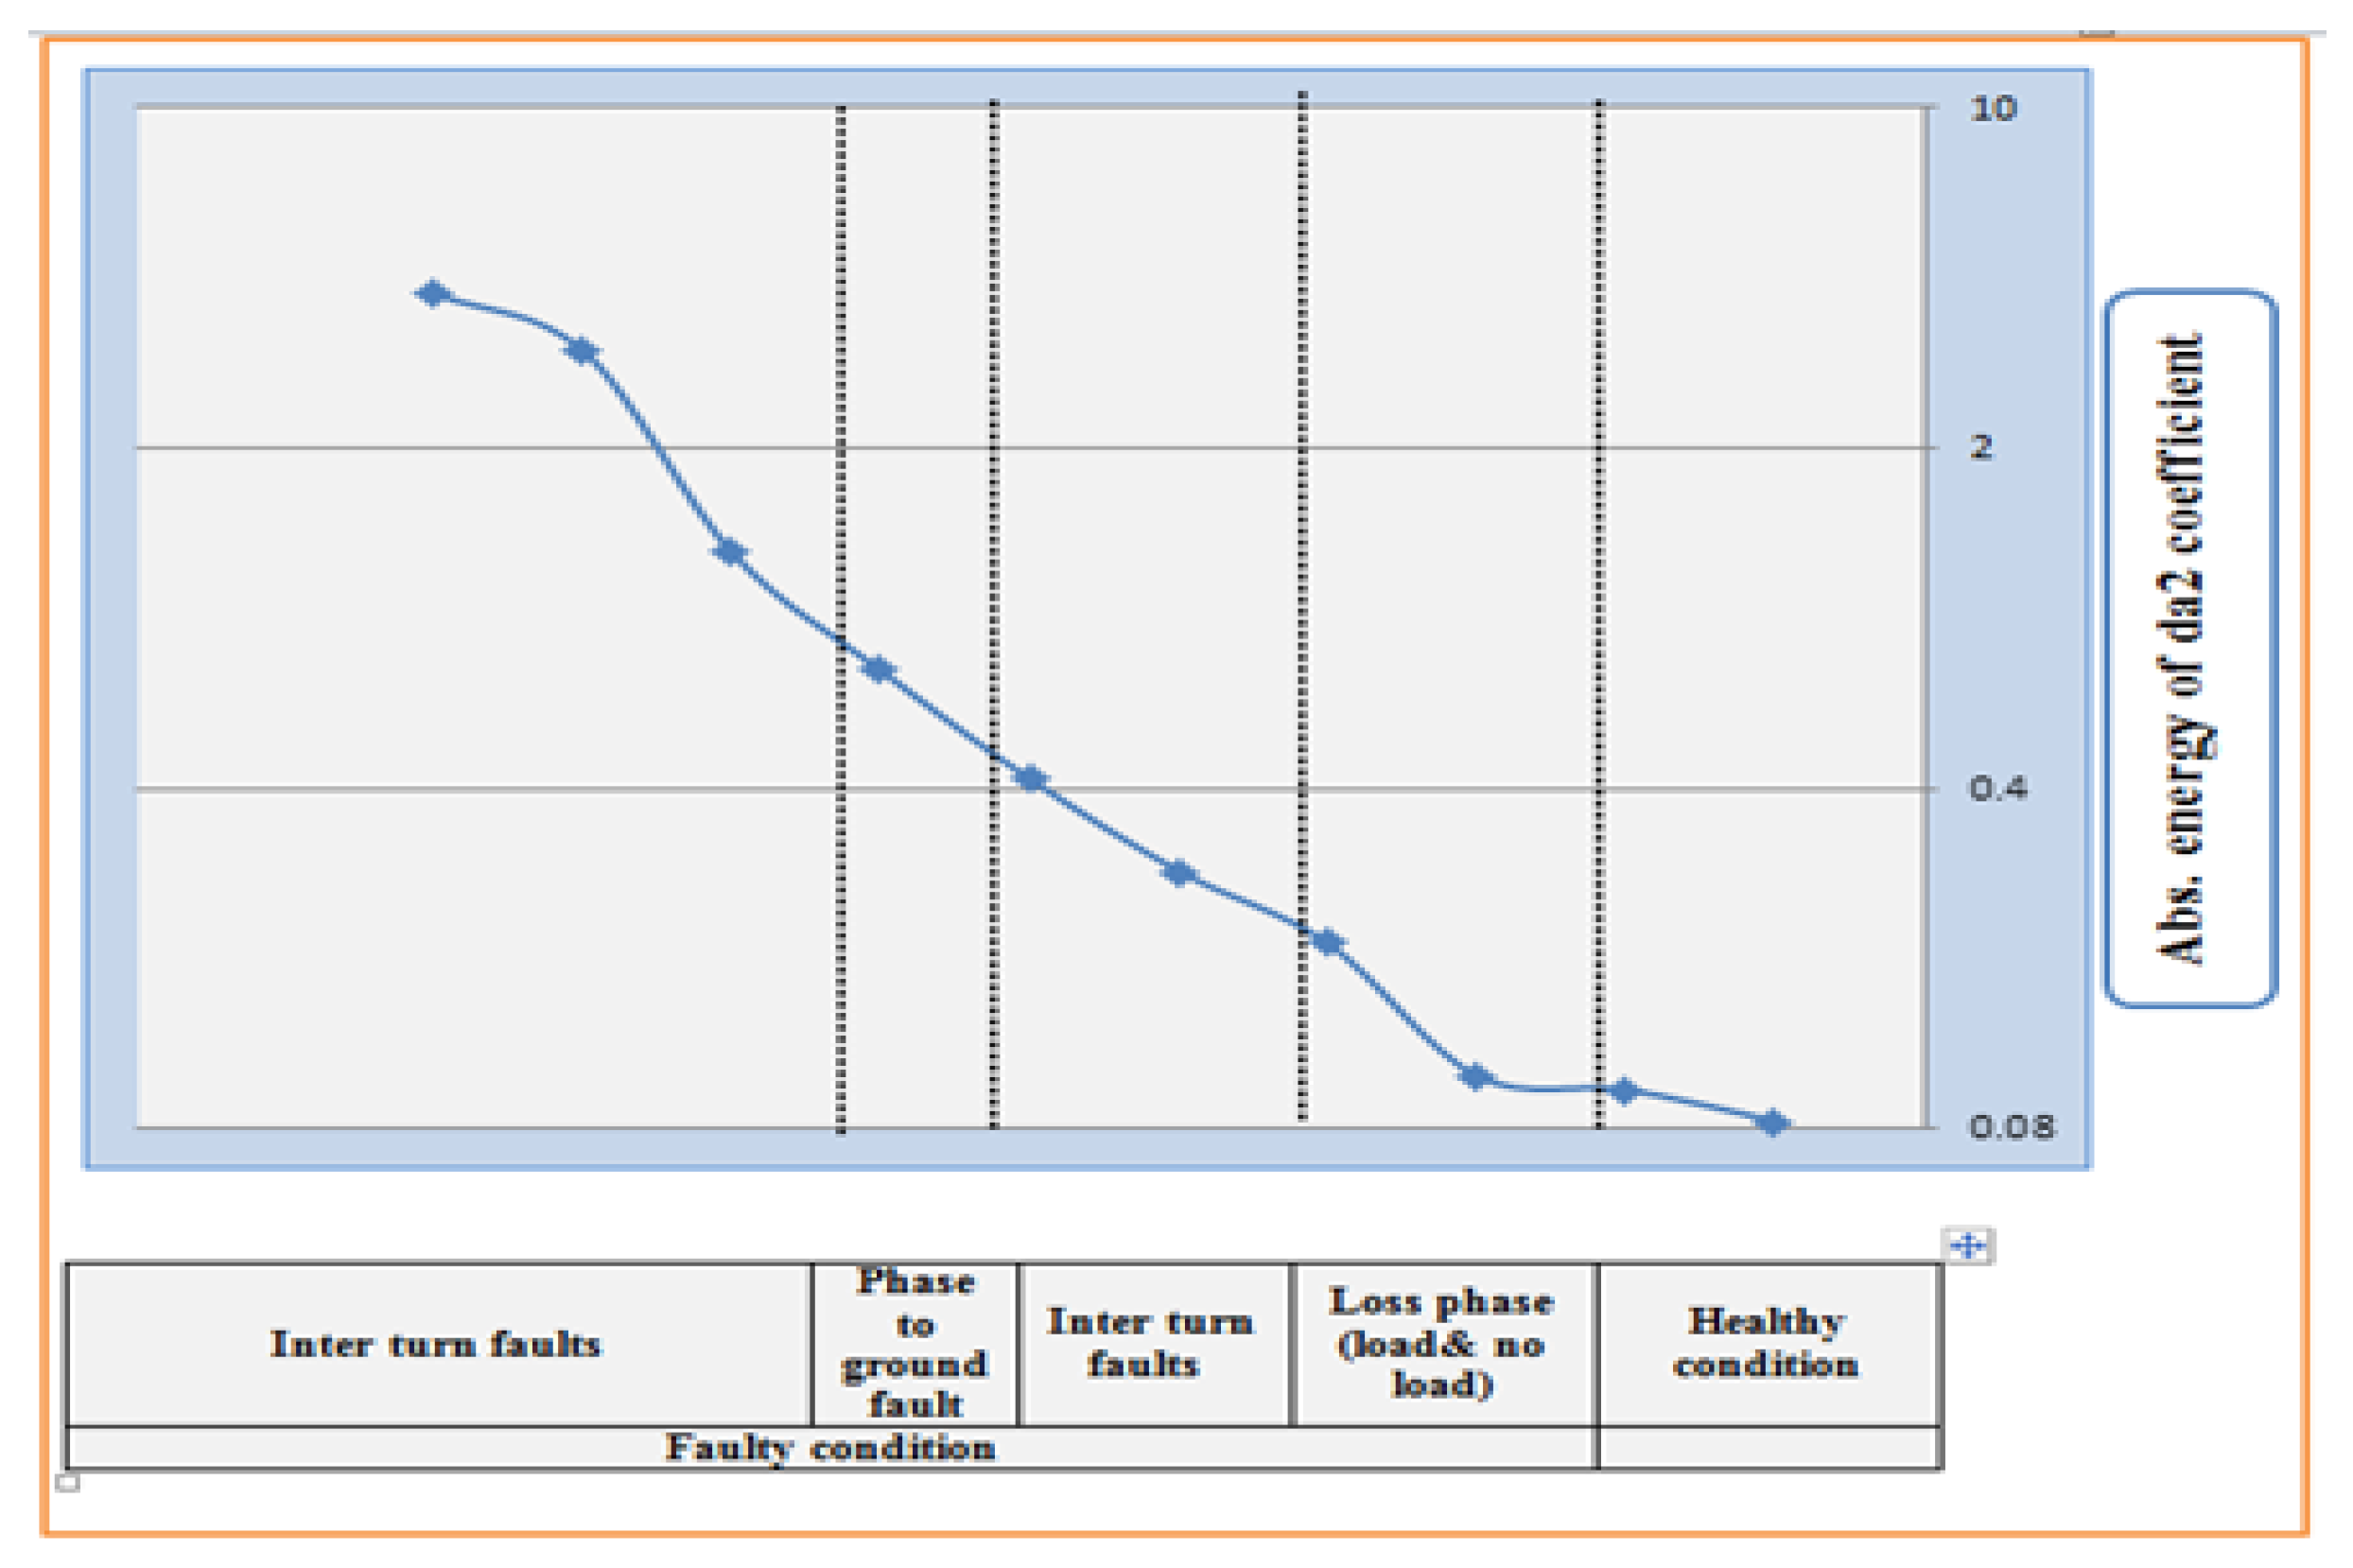
6. Proposed Fault Diagnosis Method—Threshold Values

In this research, the Energy power Entropy (EE) of the da2 subband’s coefficients is used to determine if the motor is faulty or not. Then, the EE values of the dd2 and ad2 subbands are used to determine the type of the fault. The entropy power energy threshold values for diagnoses of different types of faults in an induction motor have been determined and tabulated in Table 4.
The entropy power energy curves for WPT dd2− and ad2 subband’s coefficients are shown in Figure 17a,b. In these, the range of EE values linked to different motor faults has been annotated on the curves.

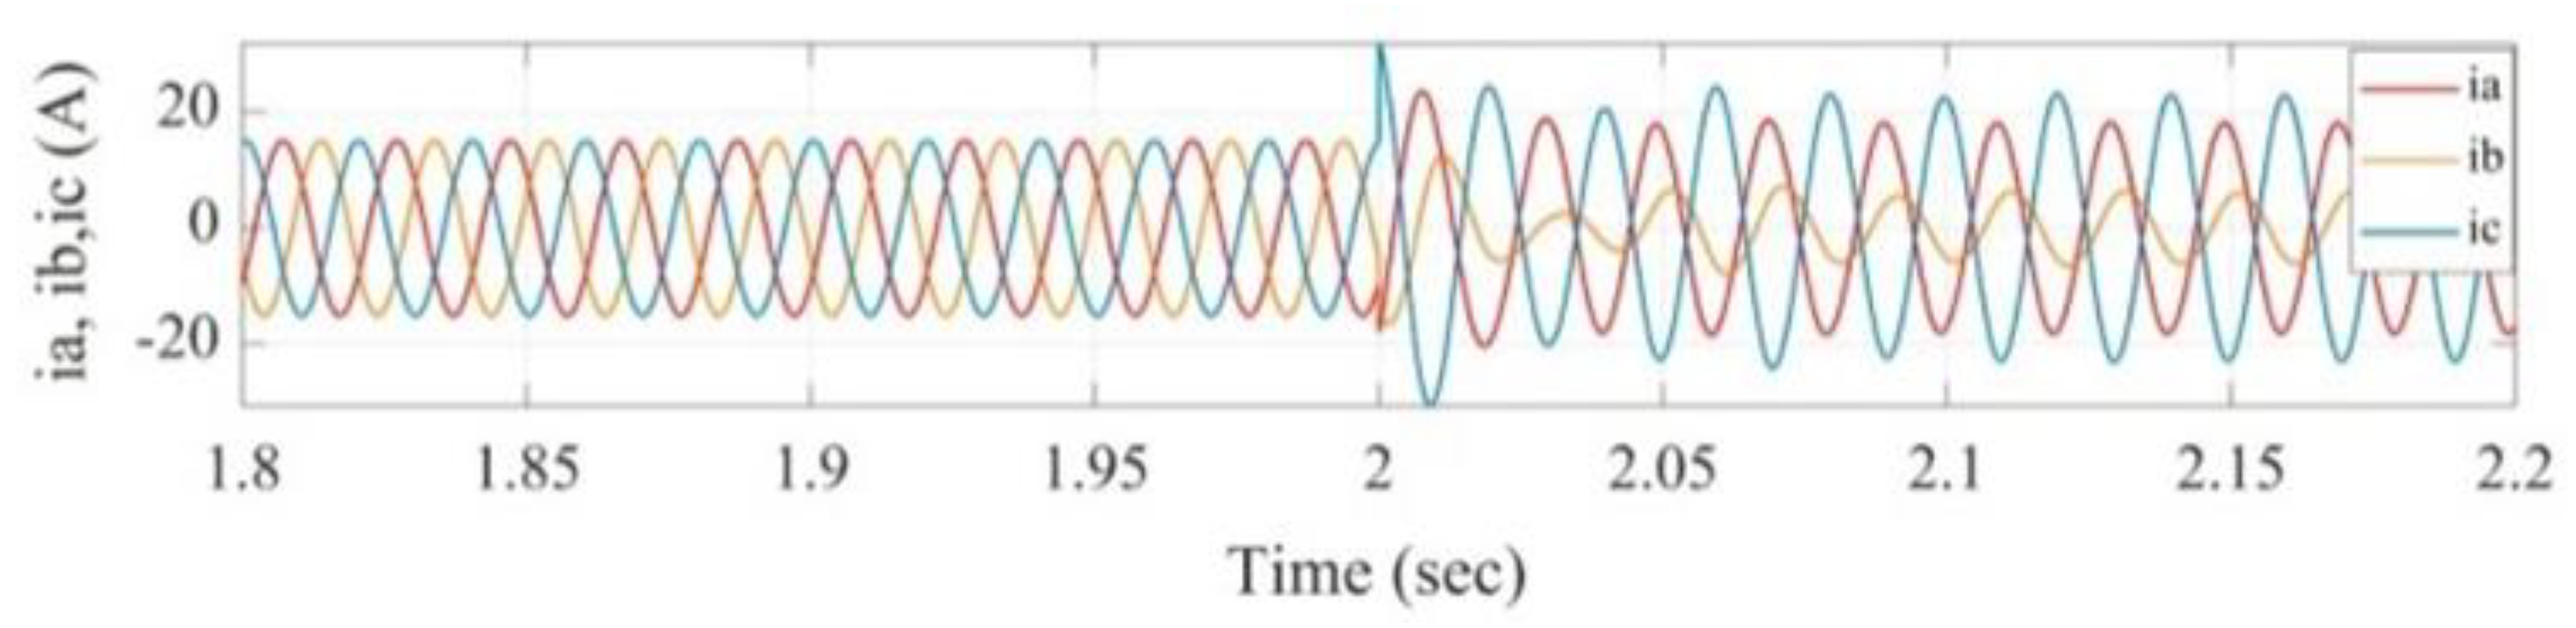
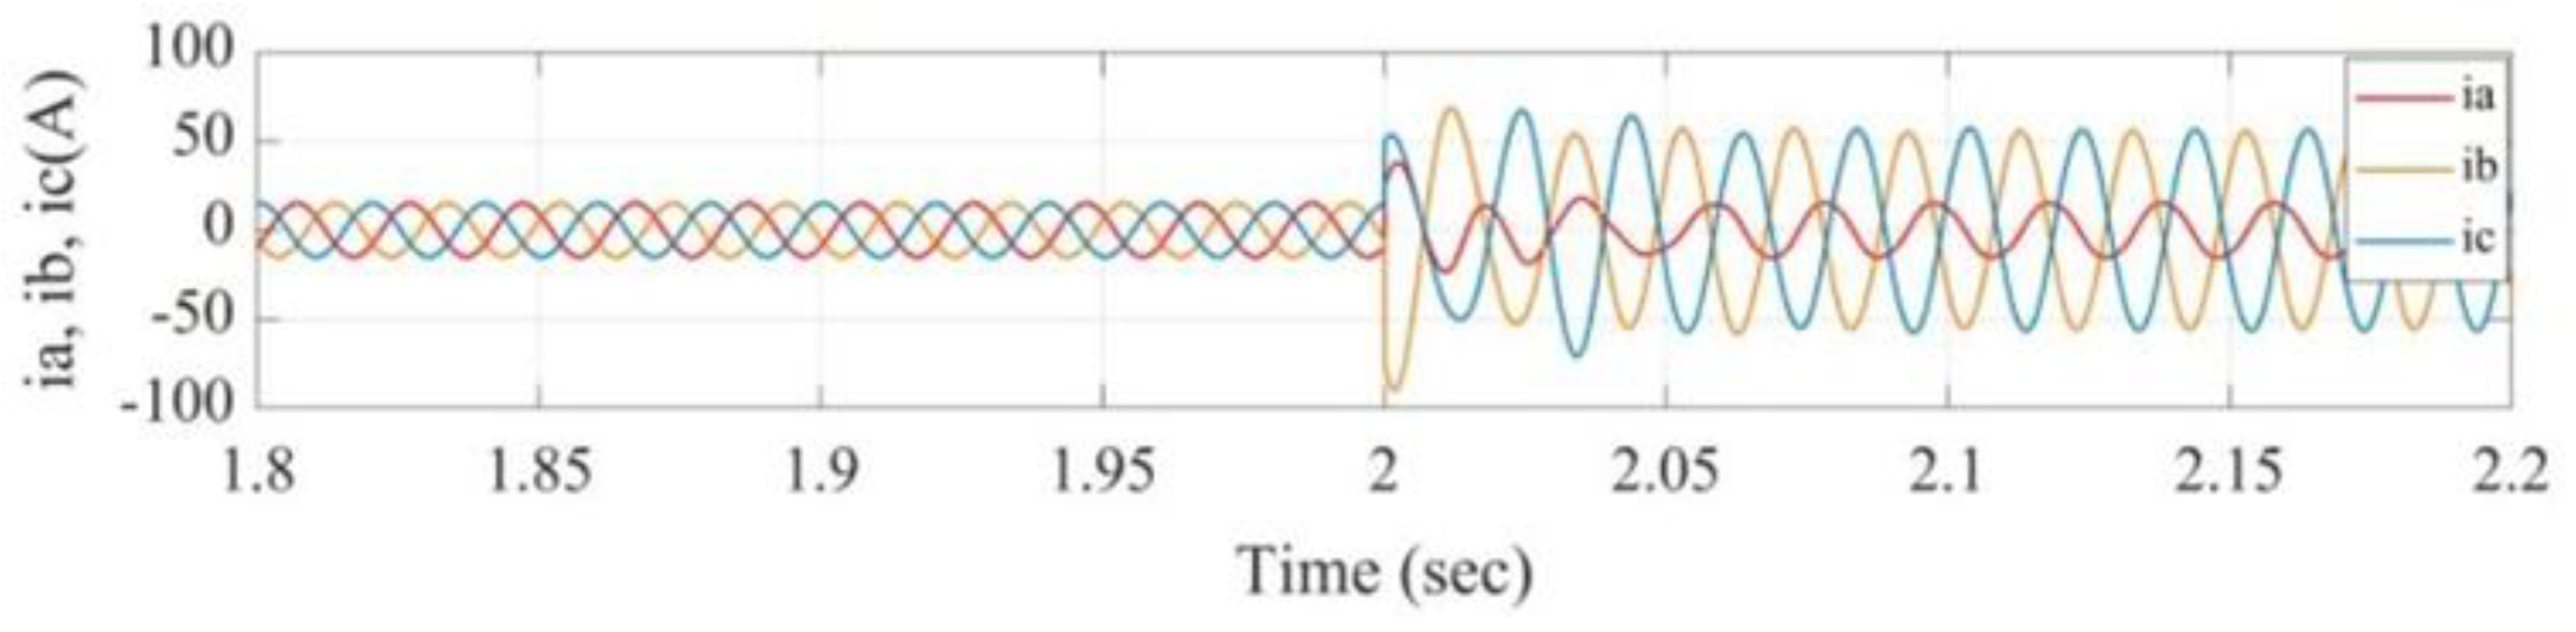
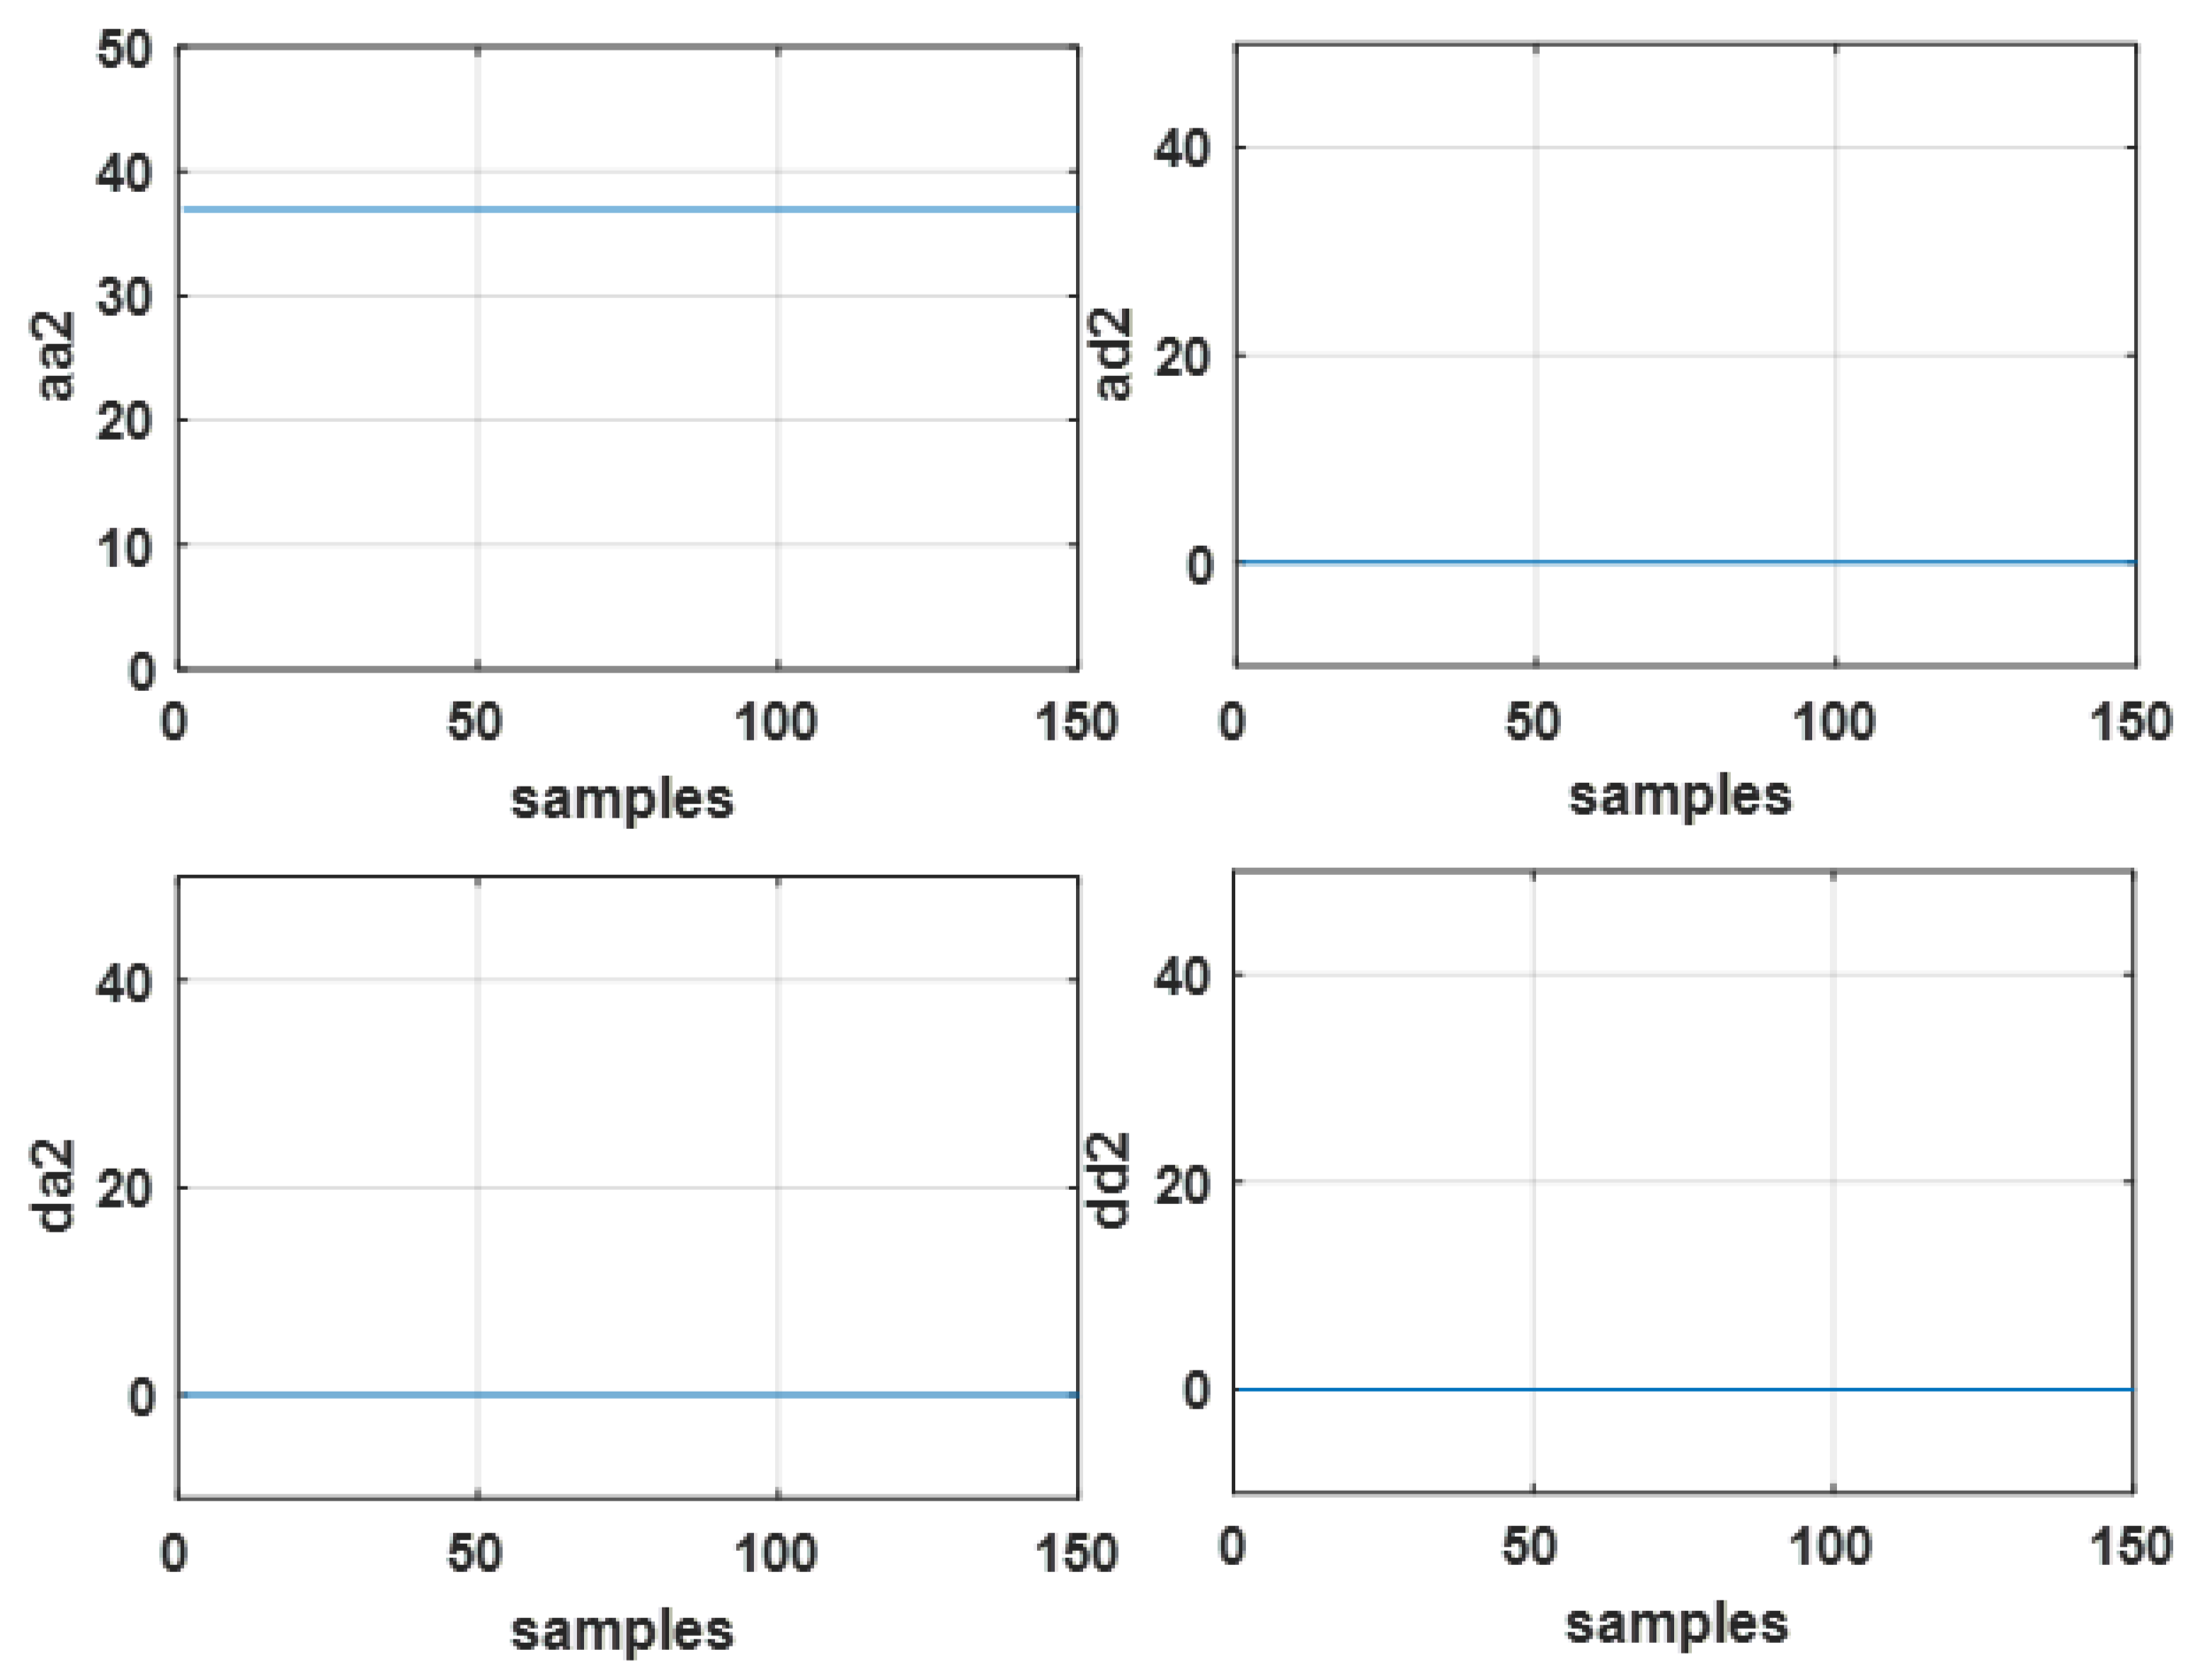
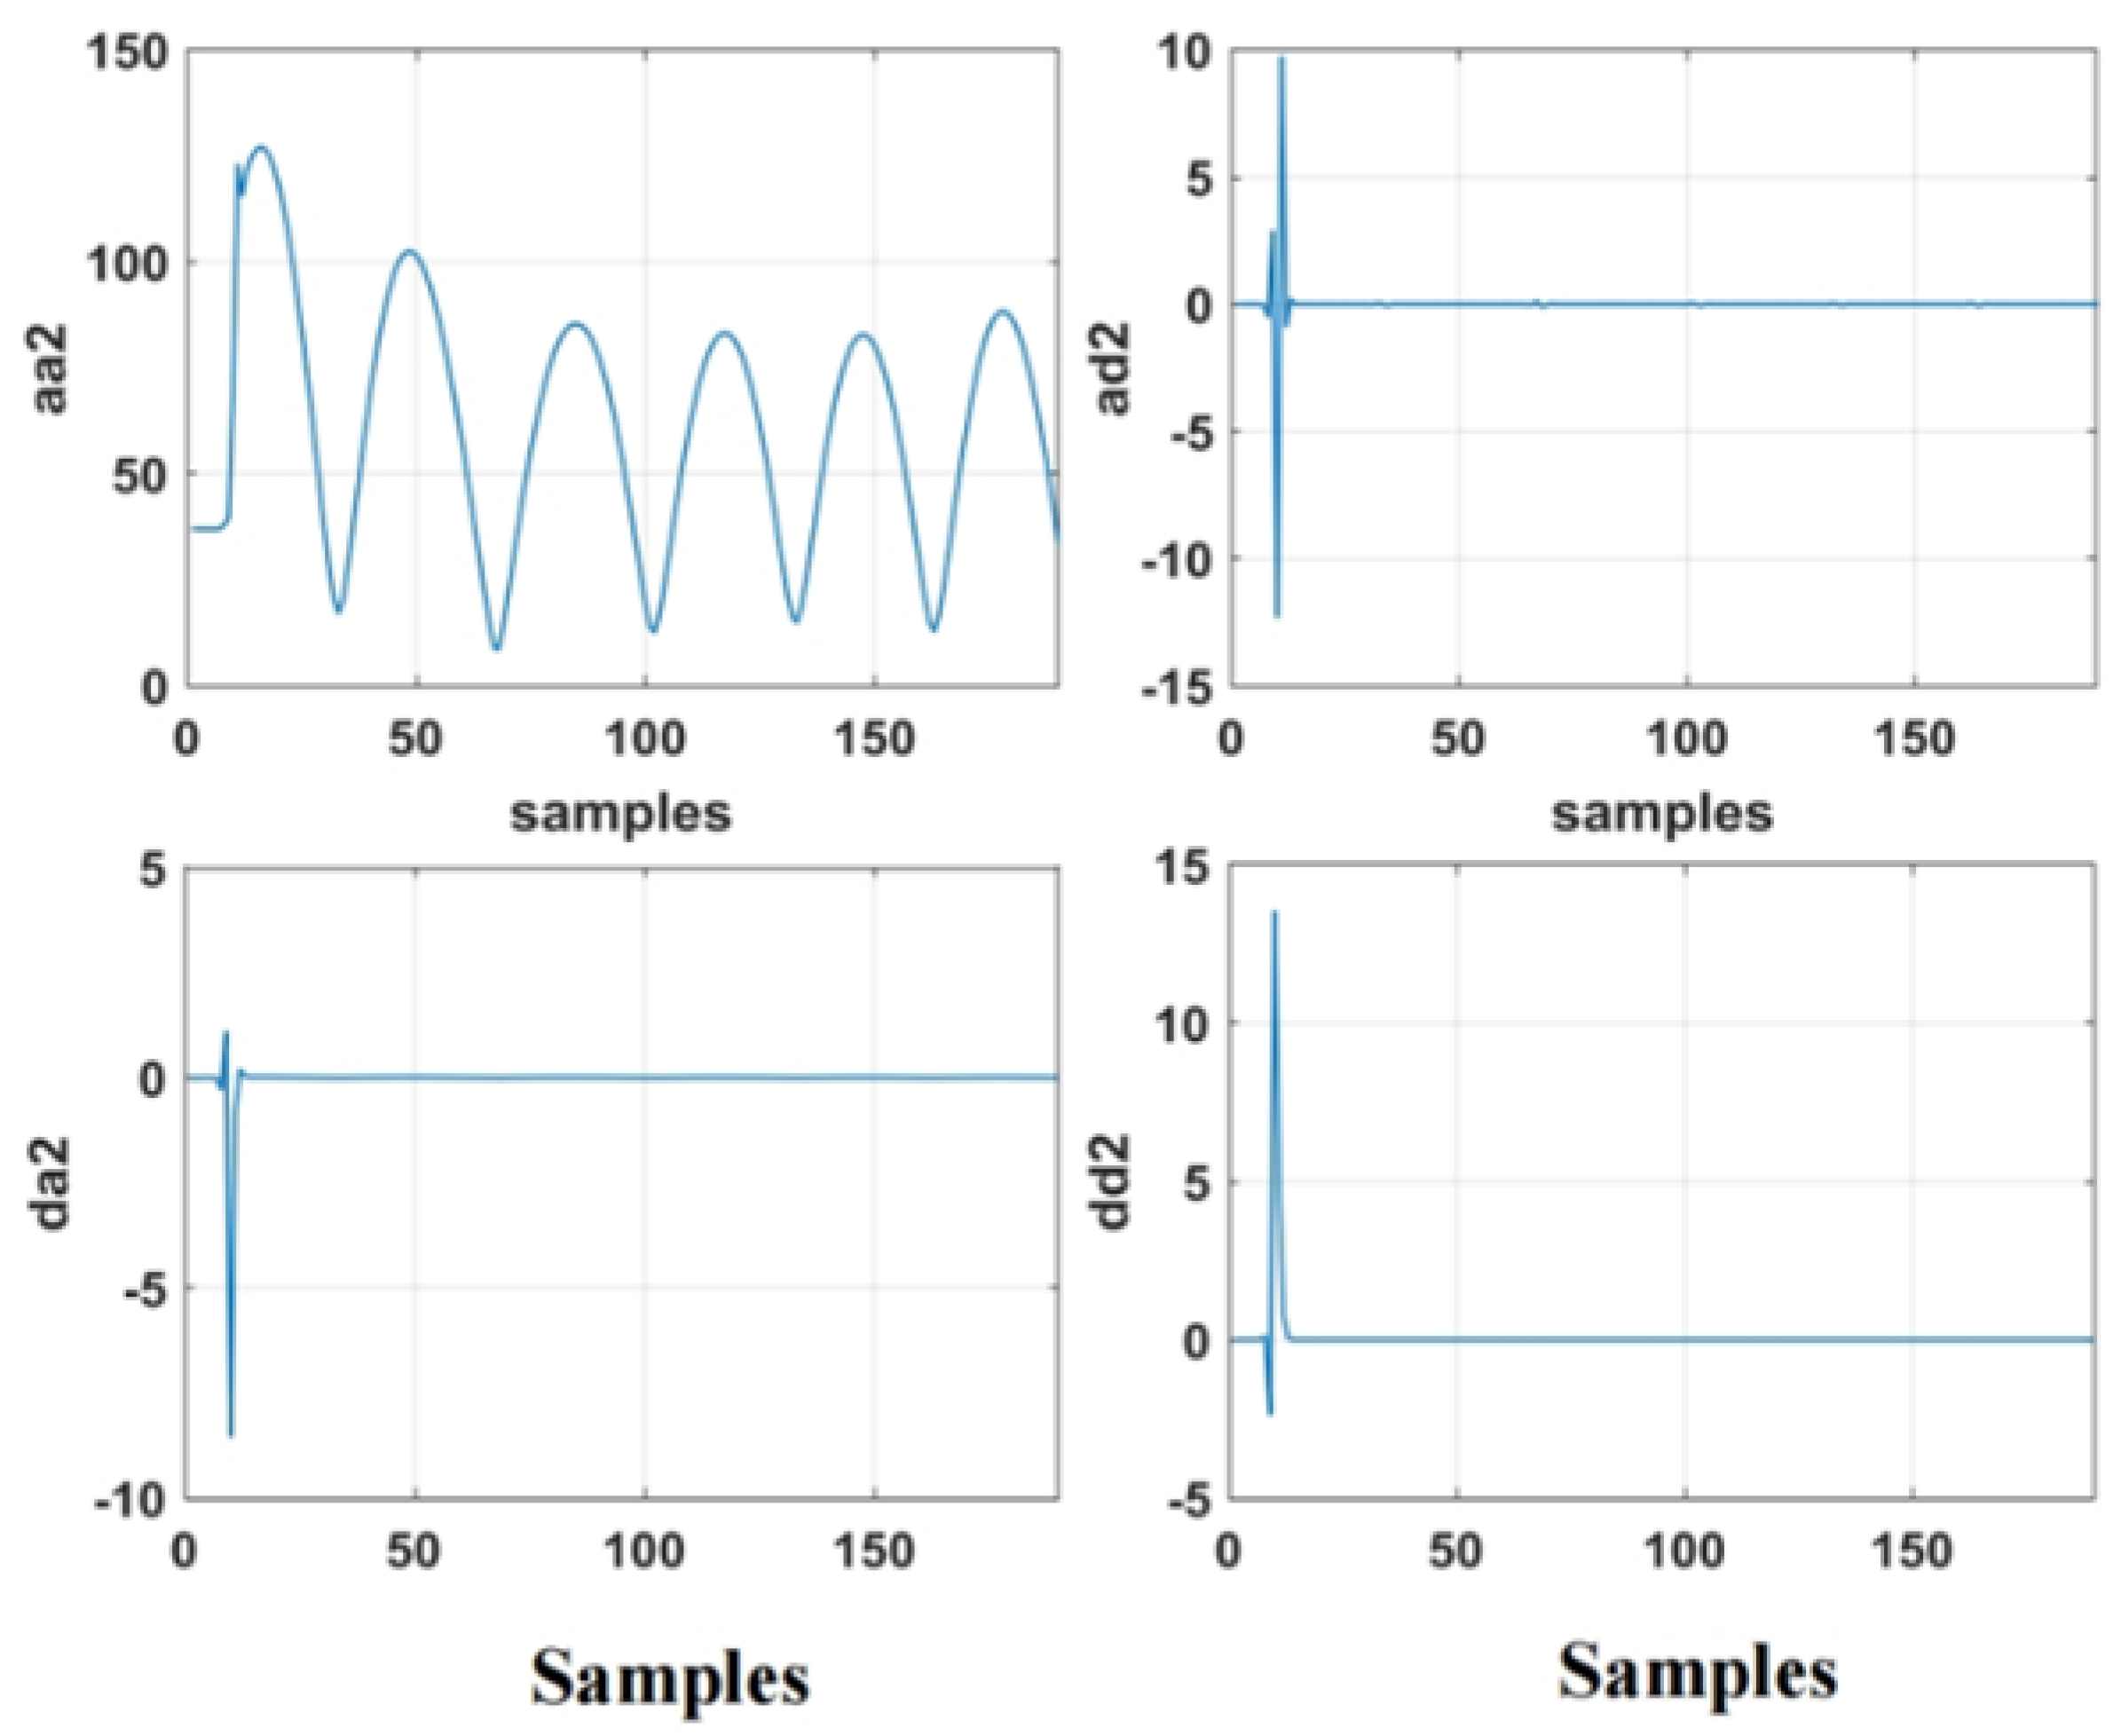
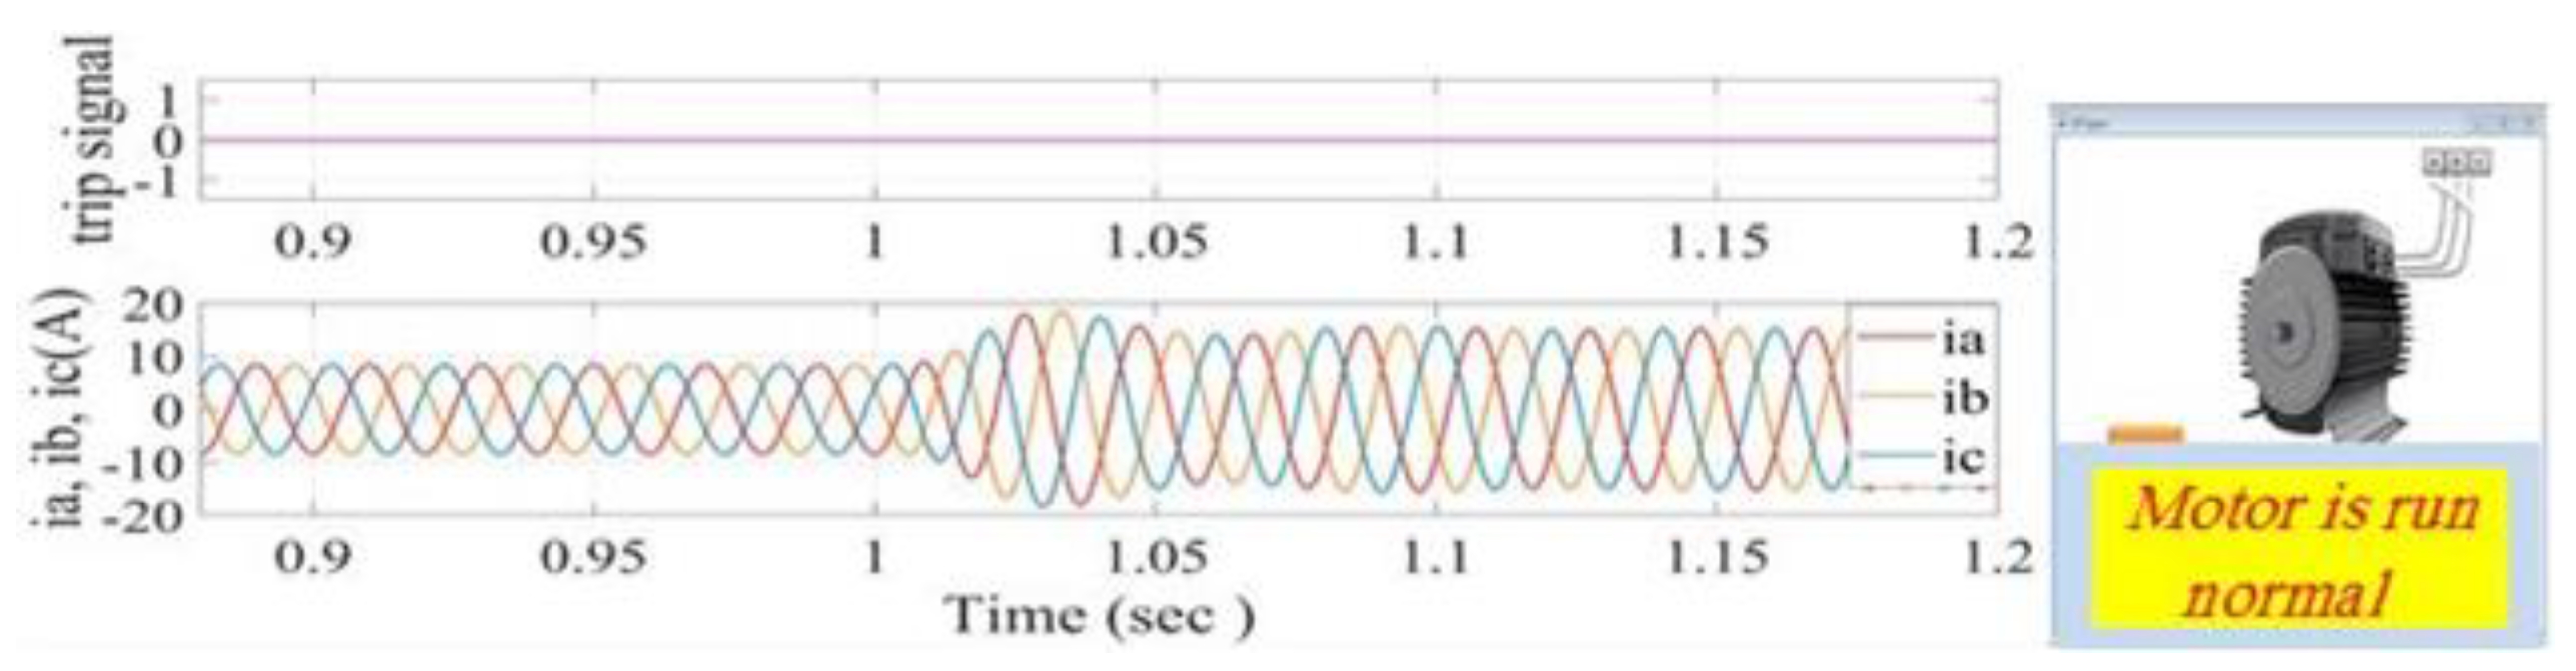
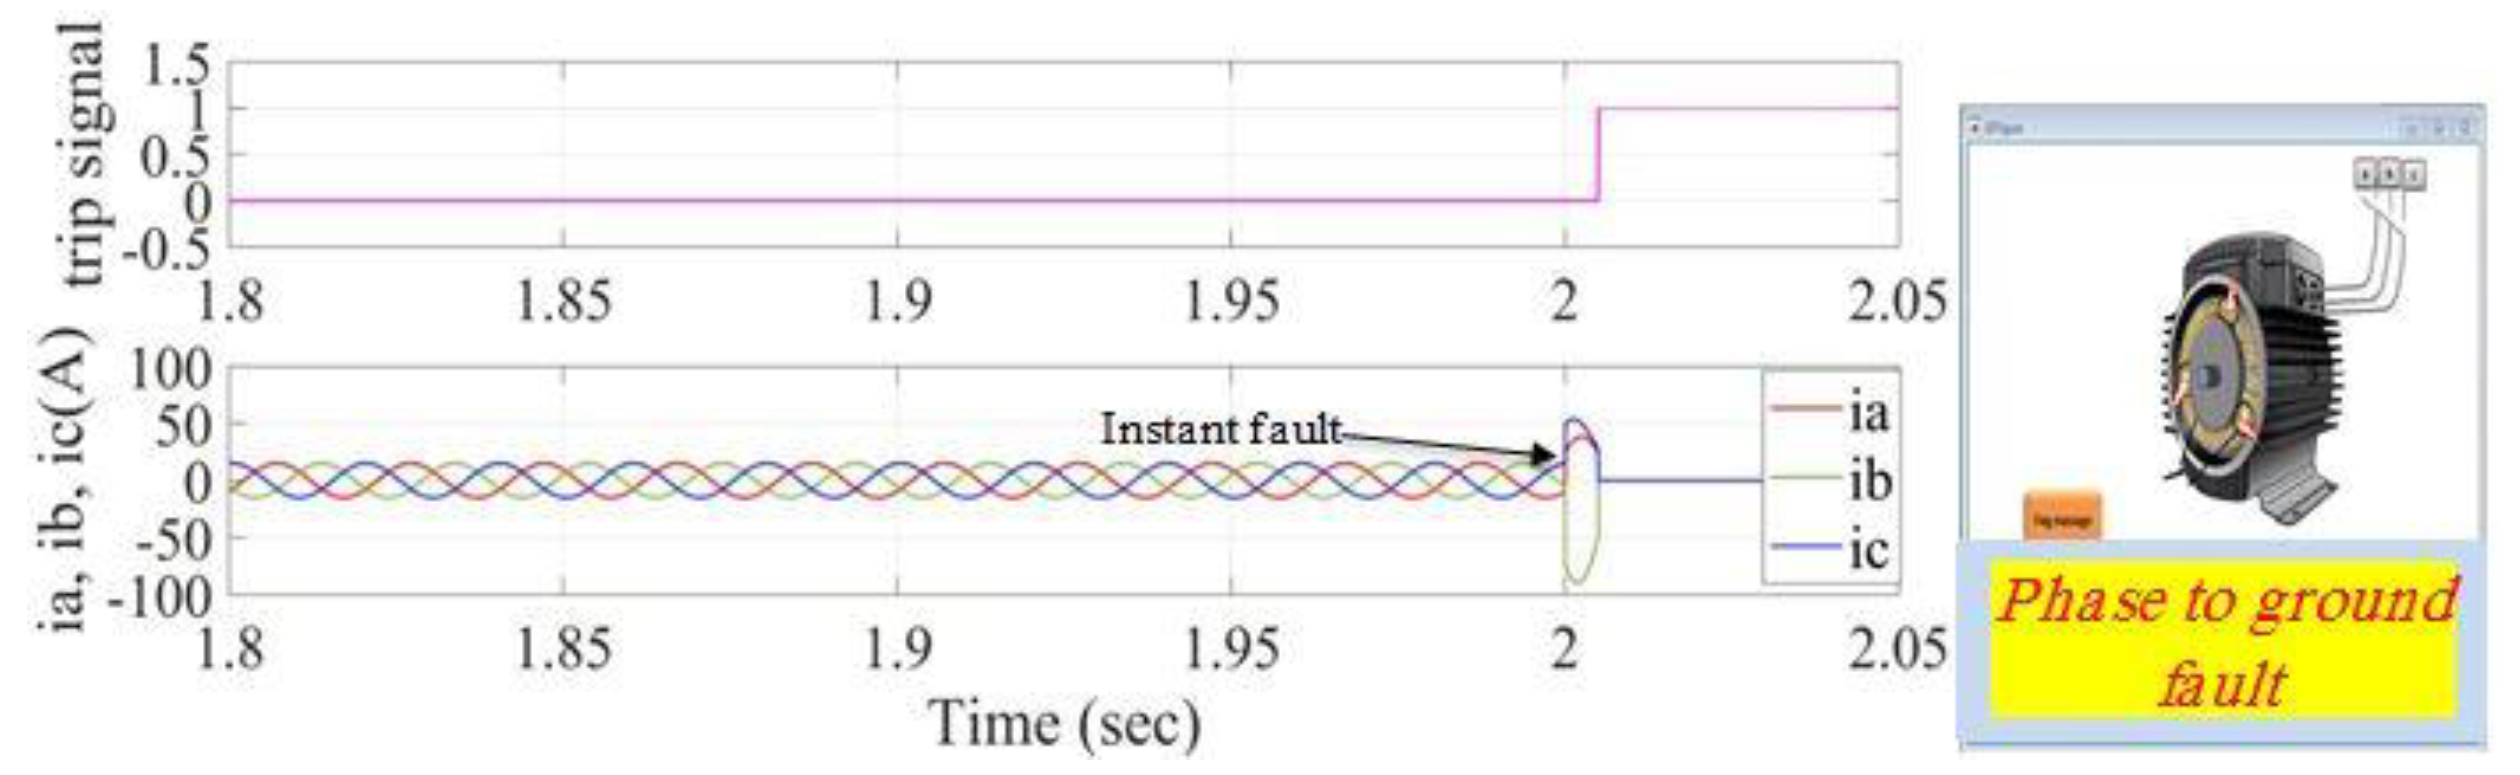
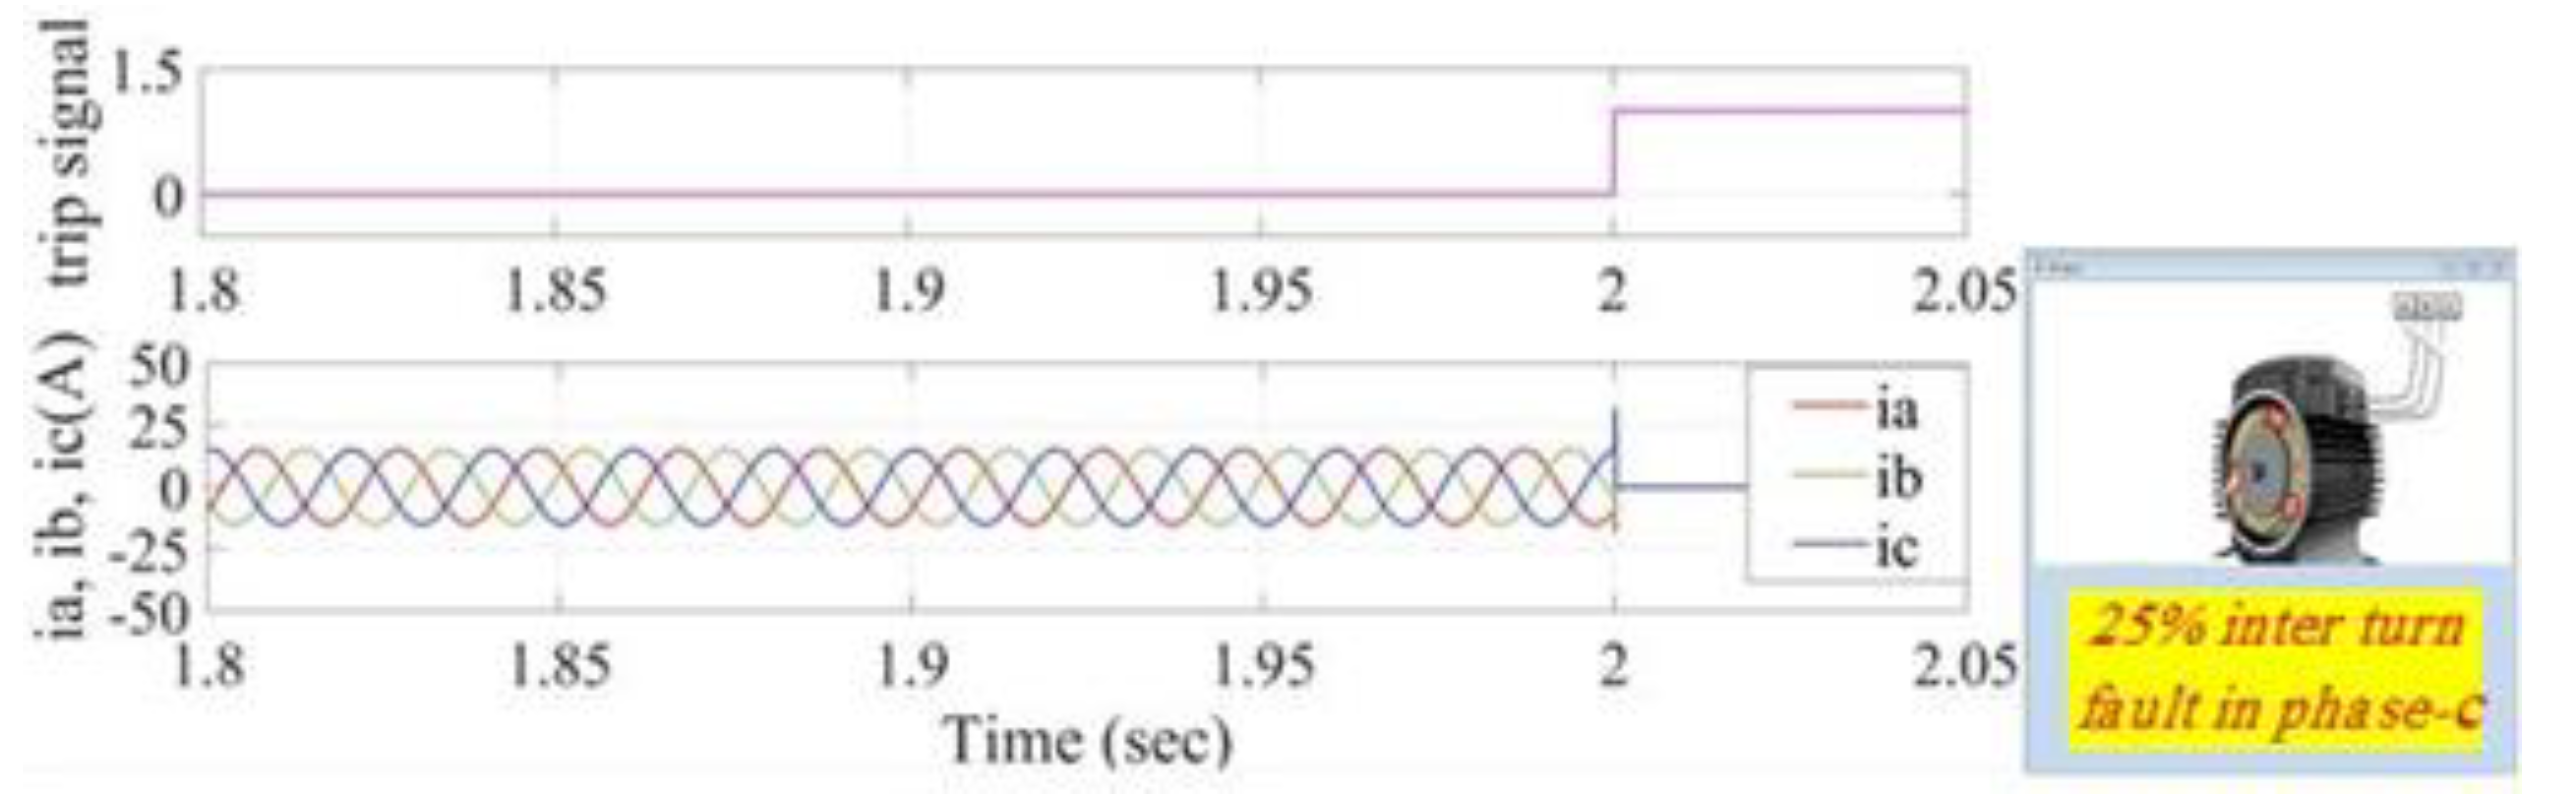
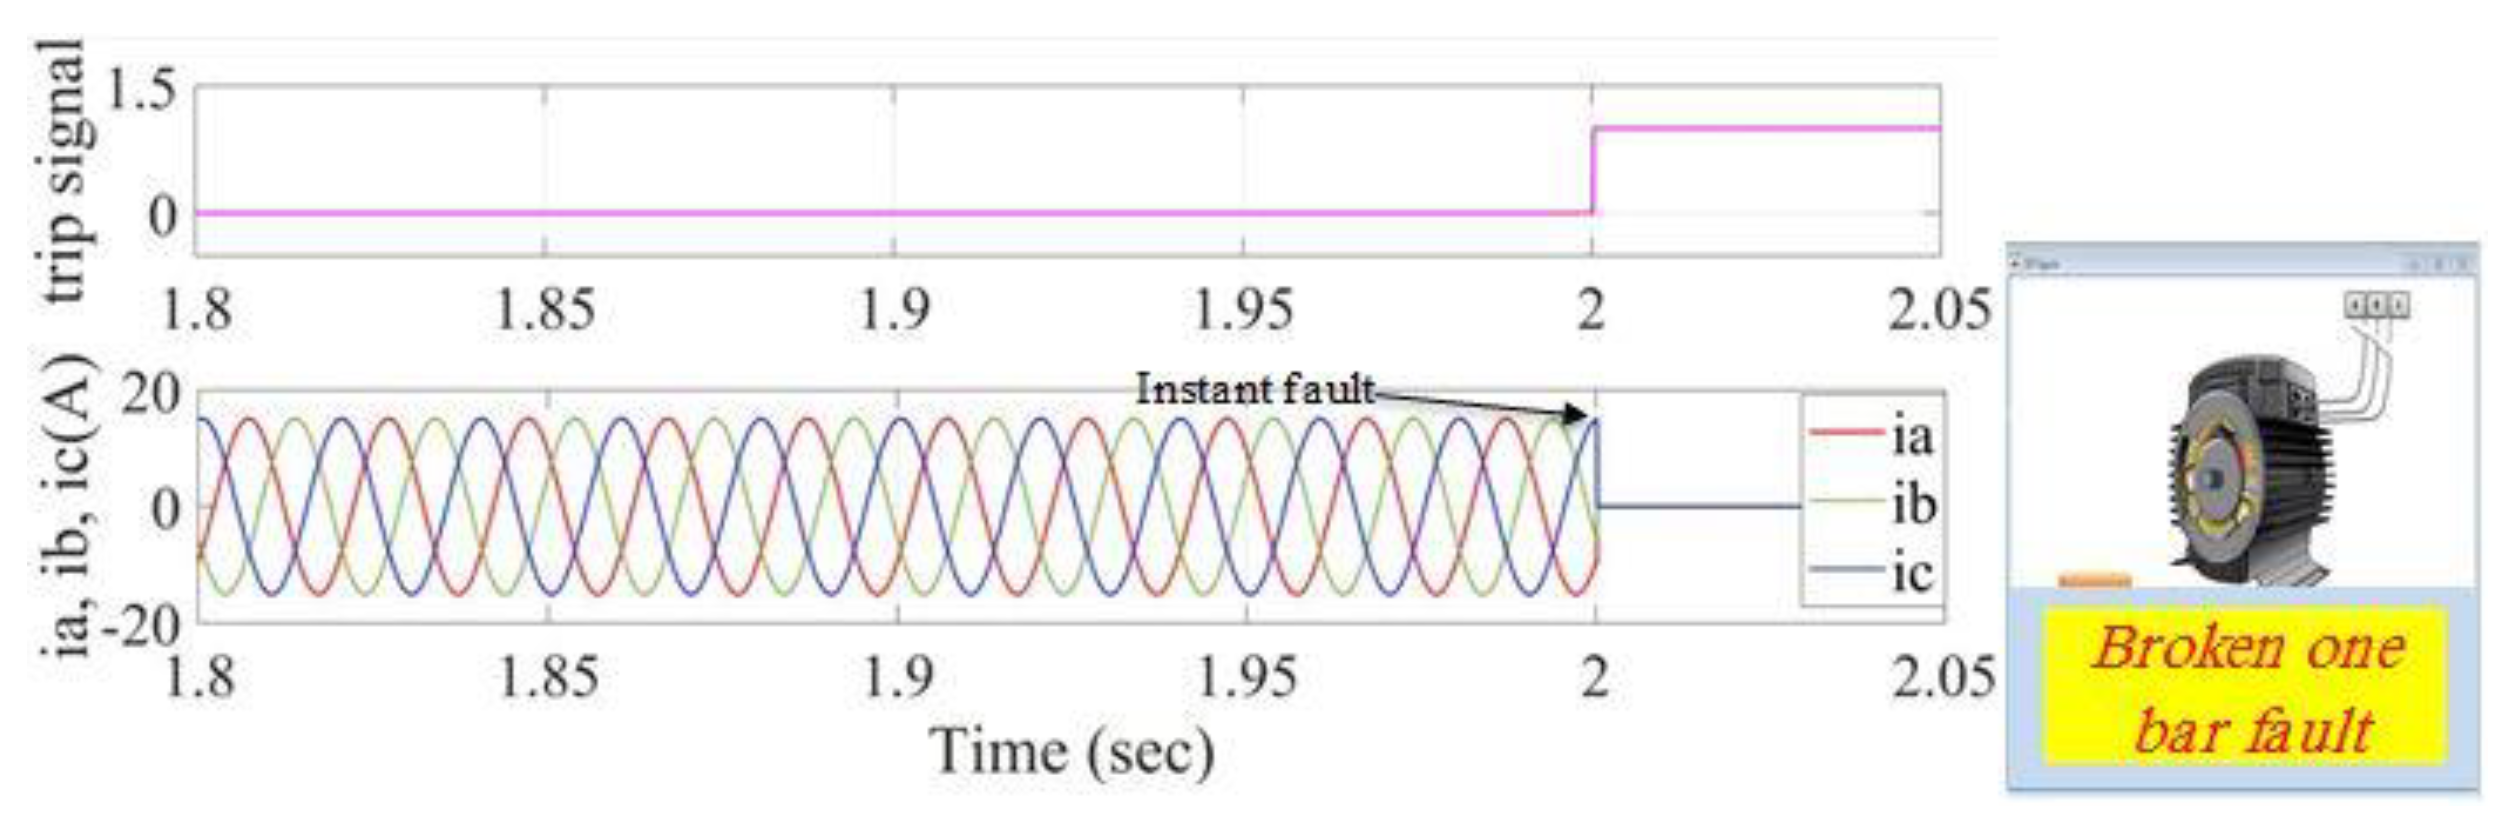
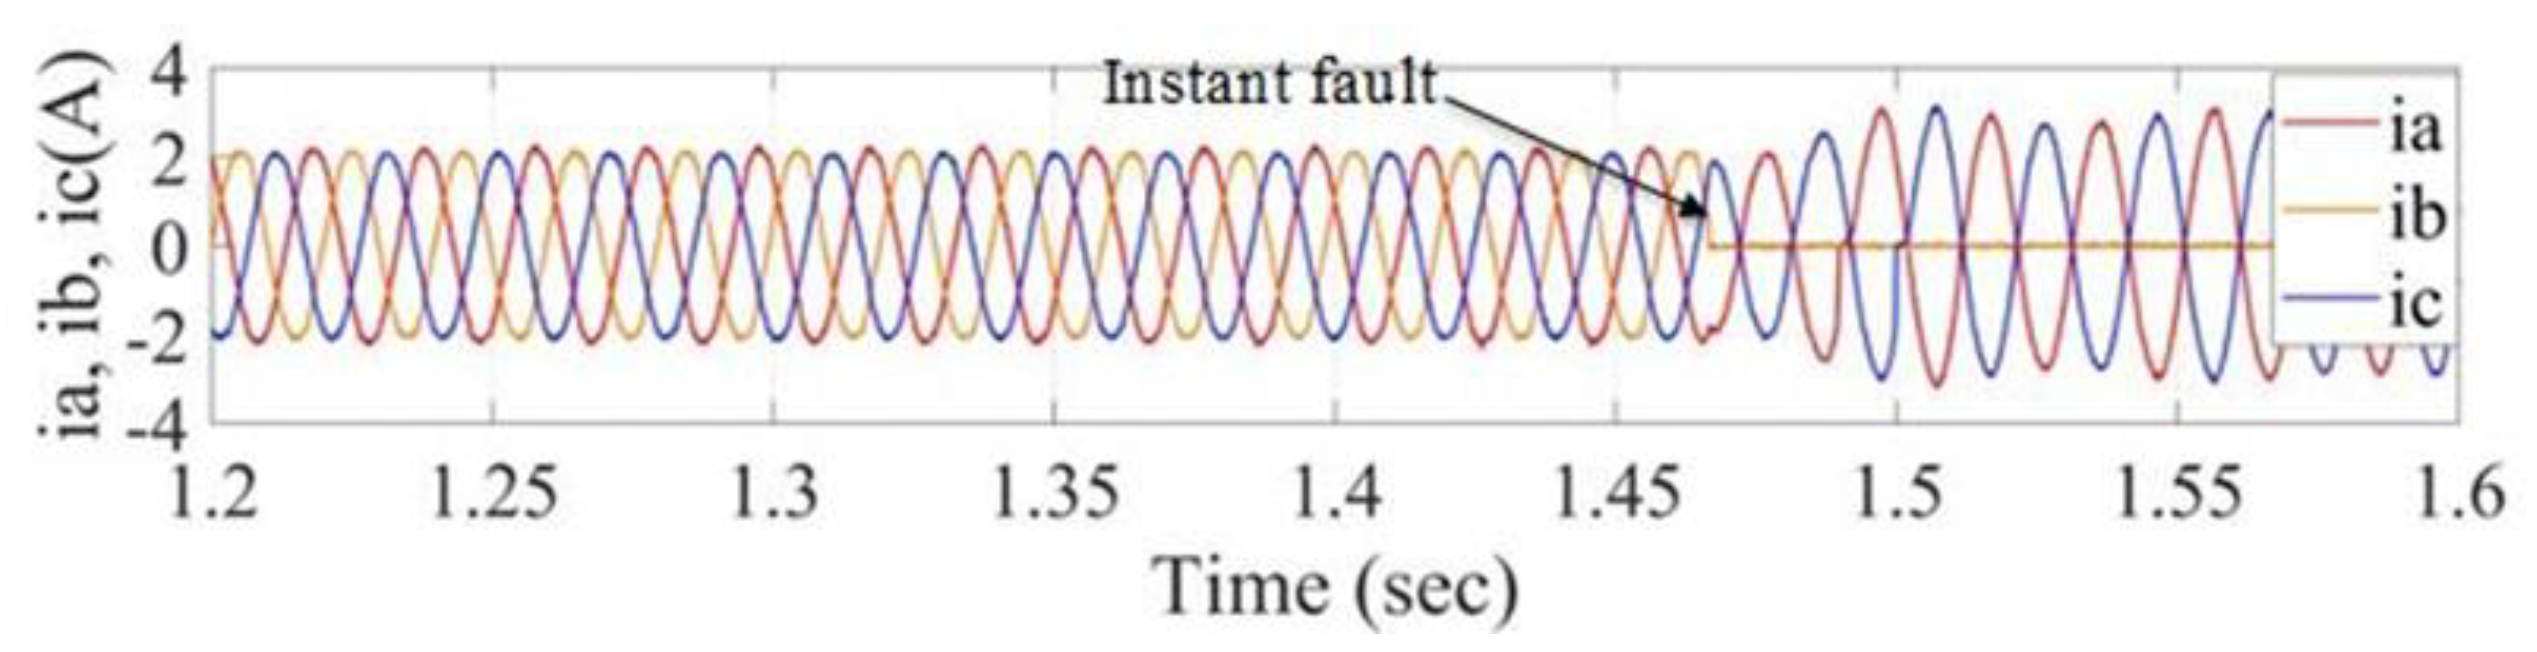
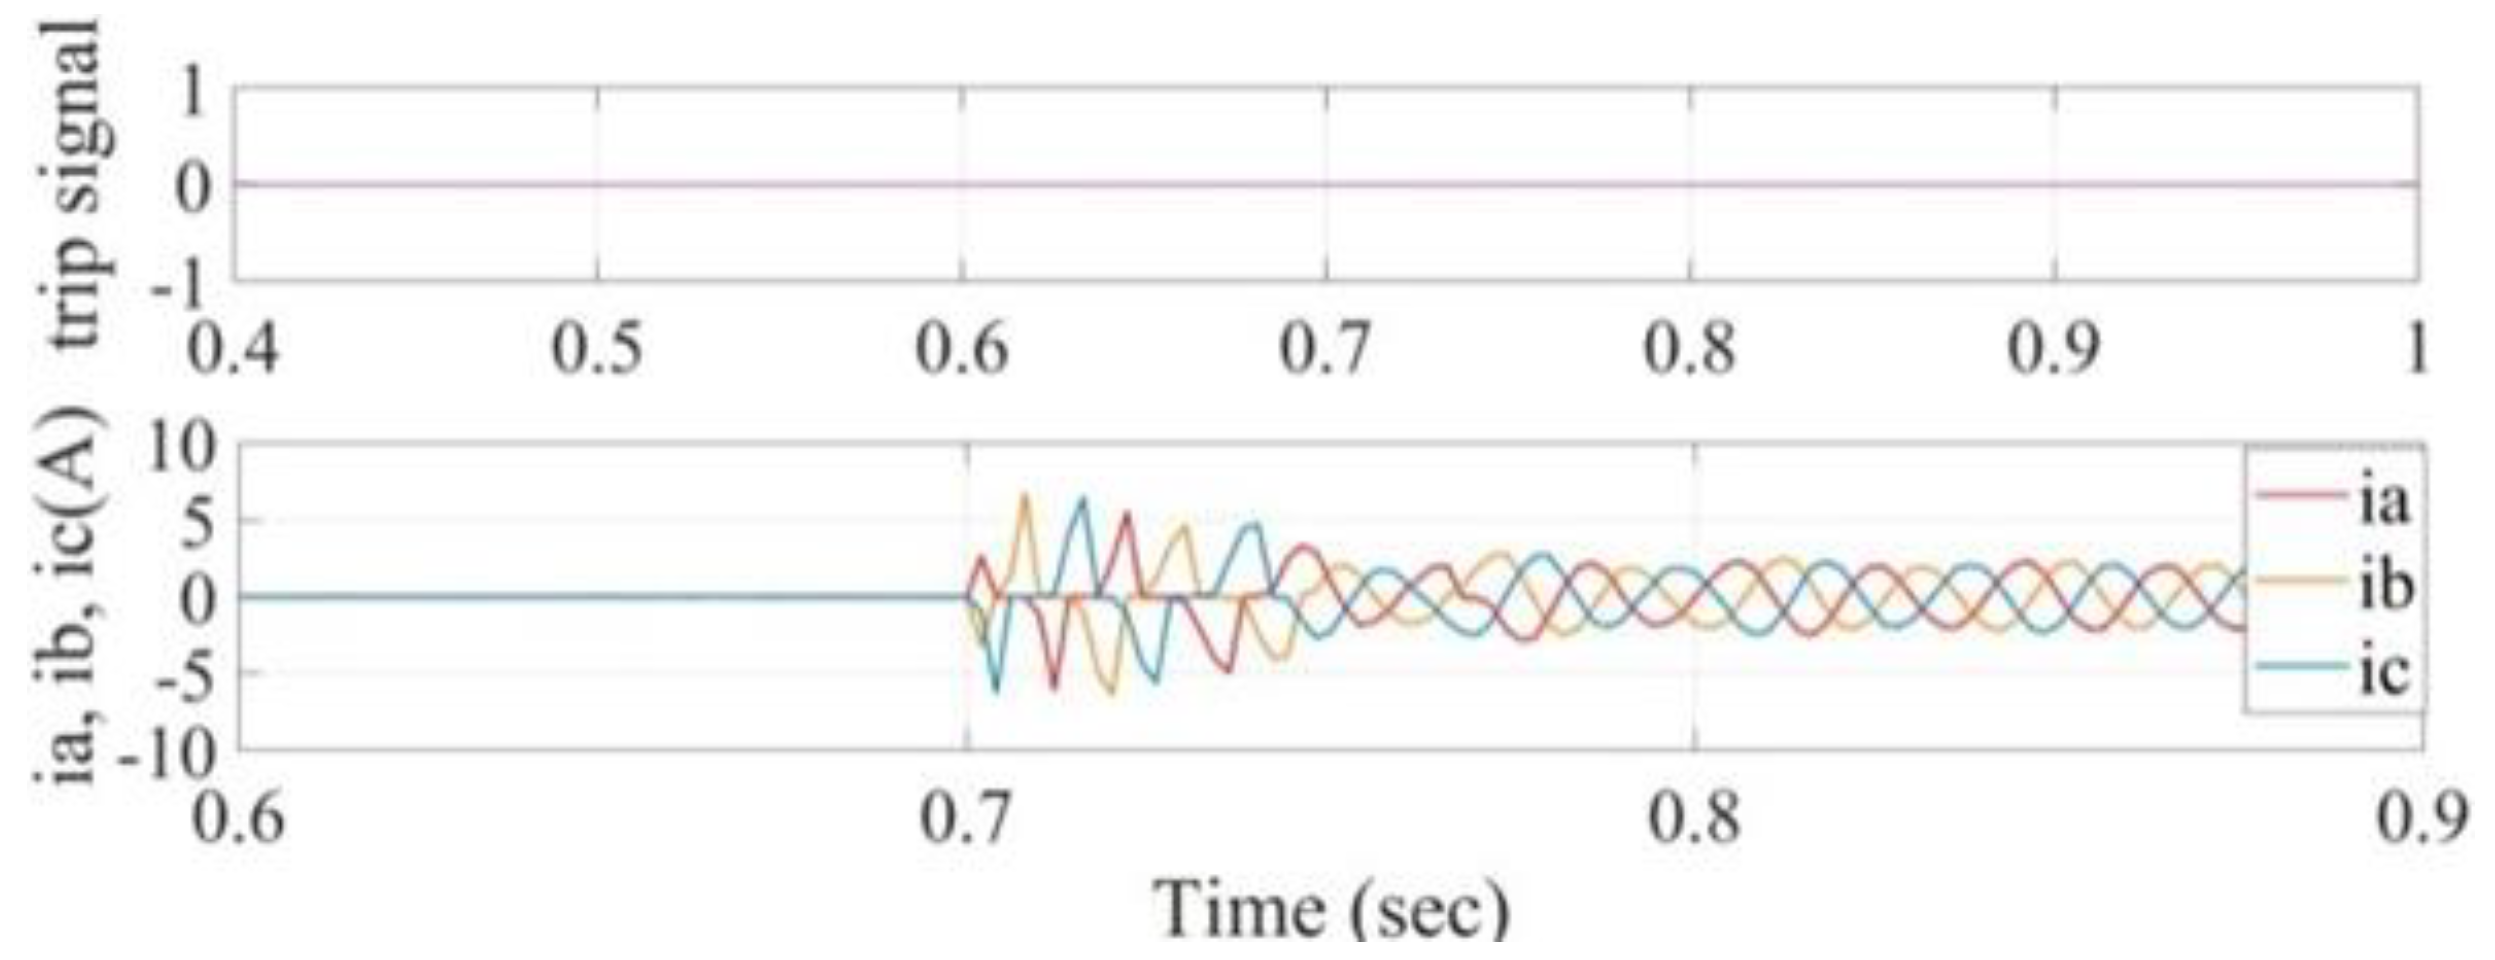
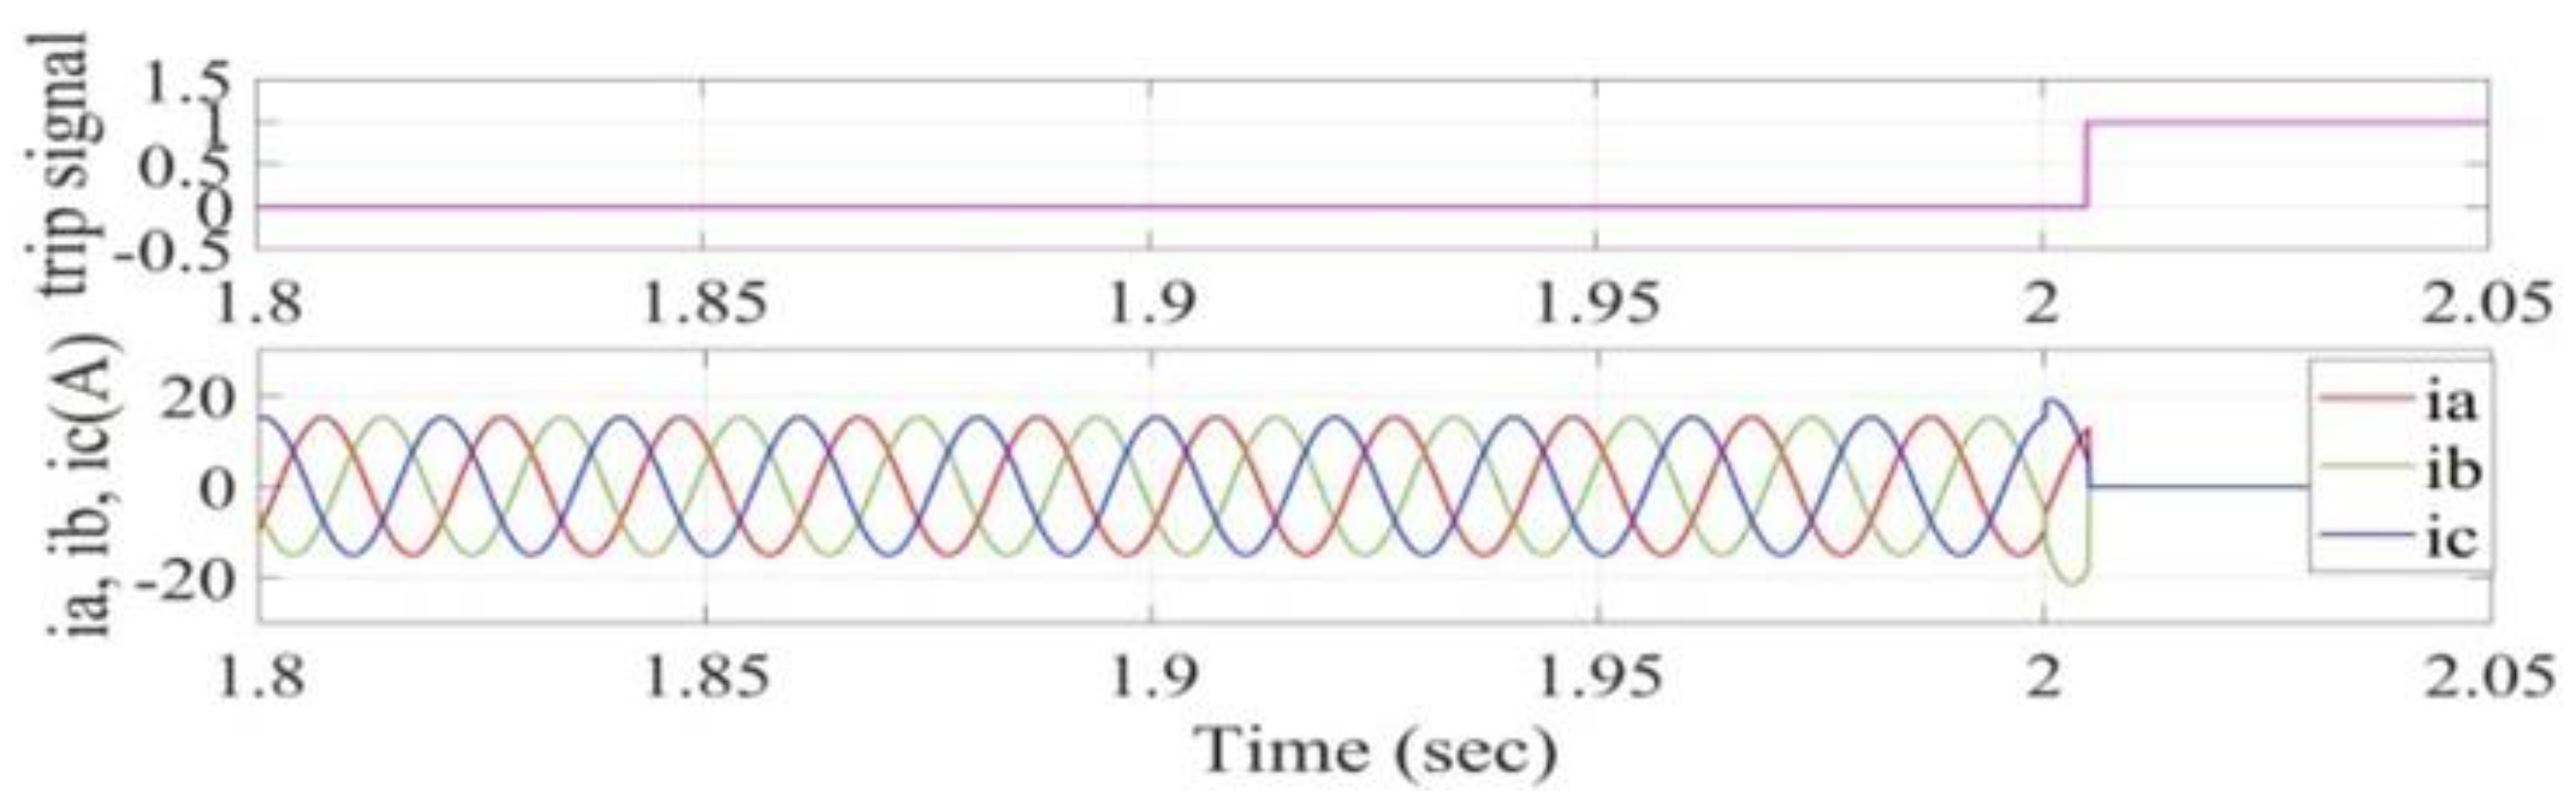
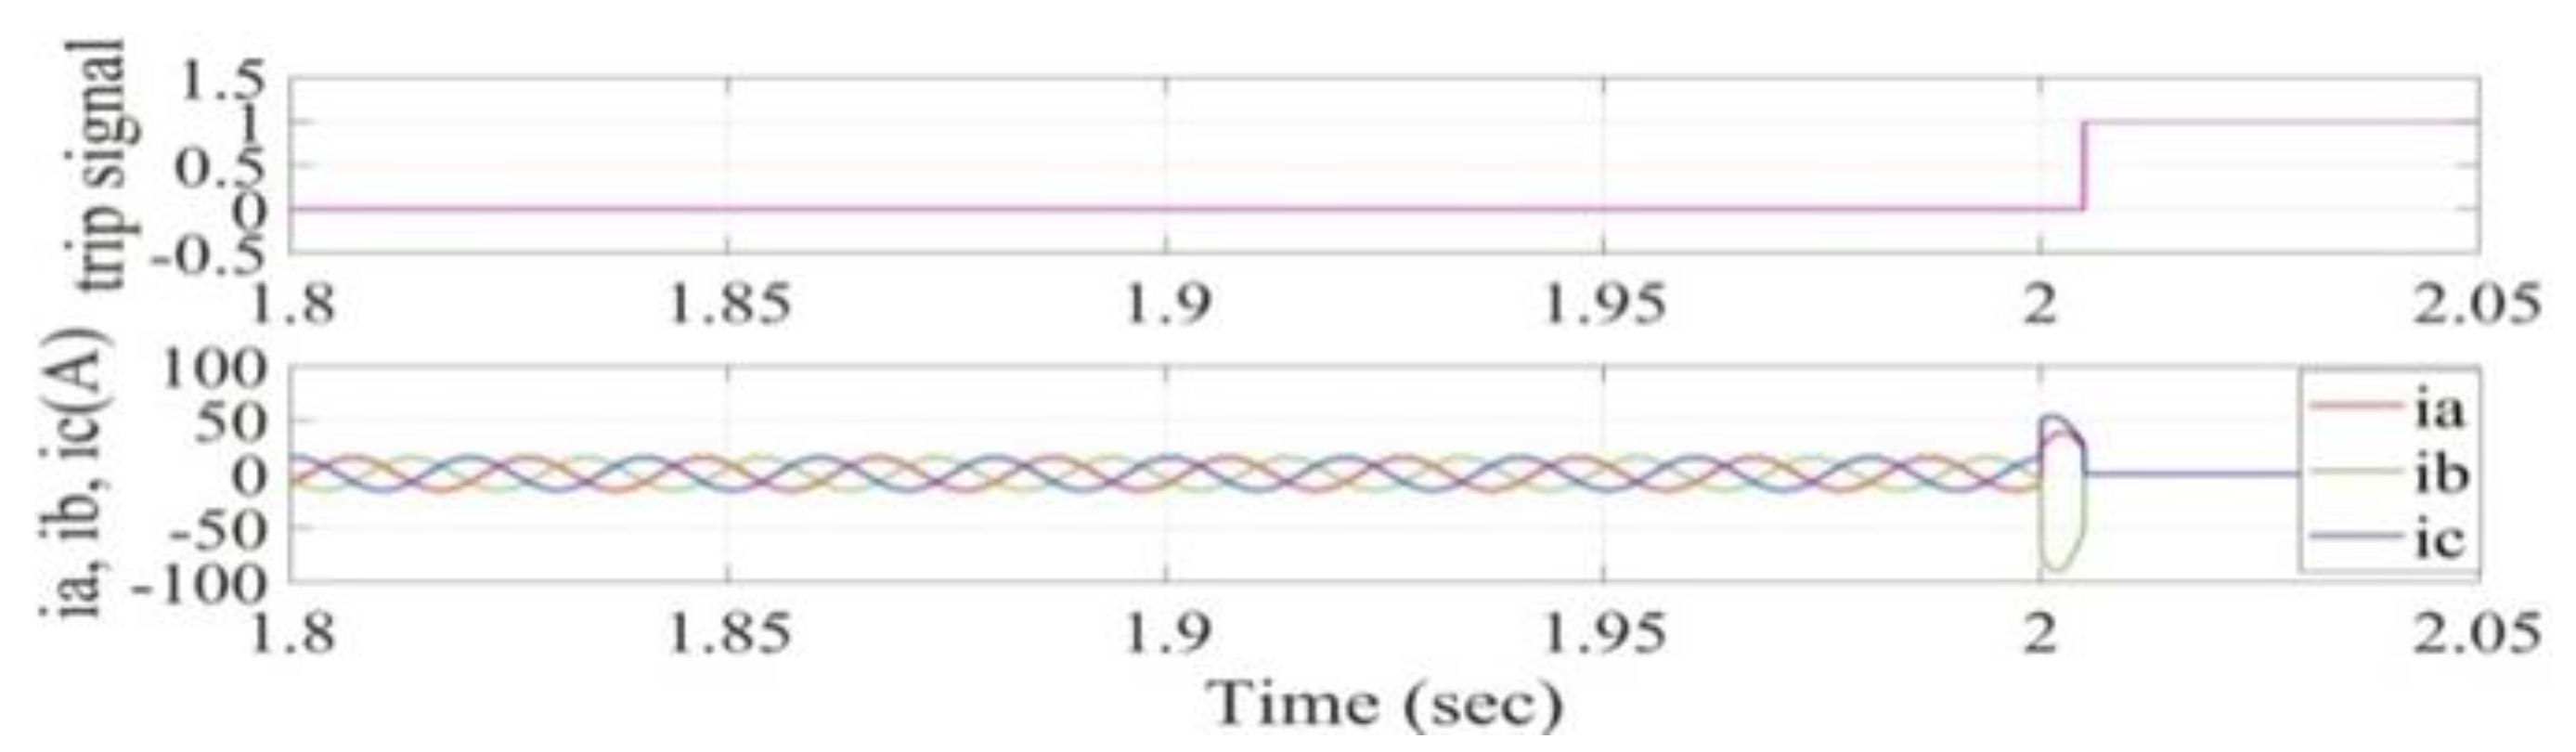
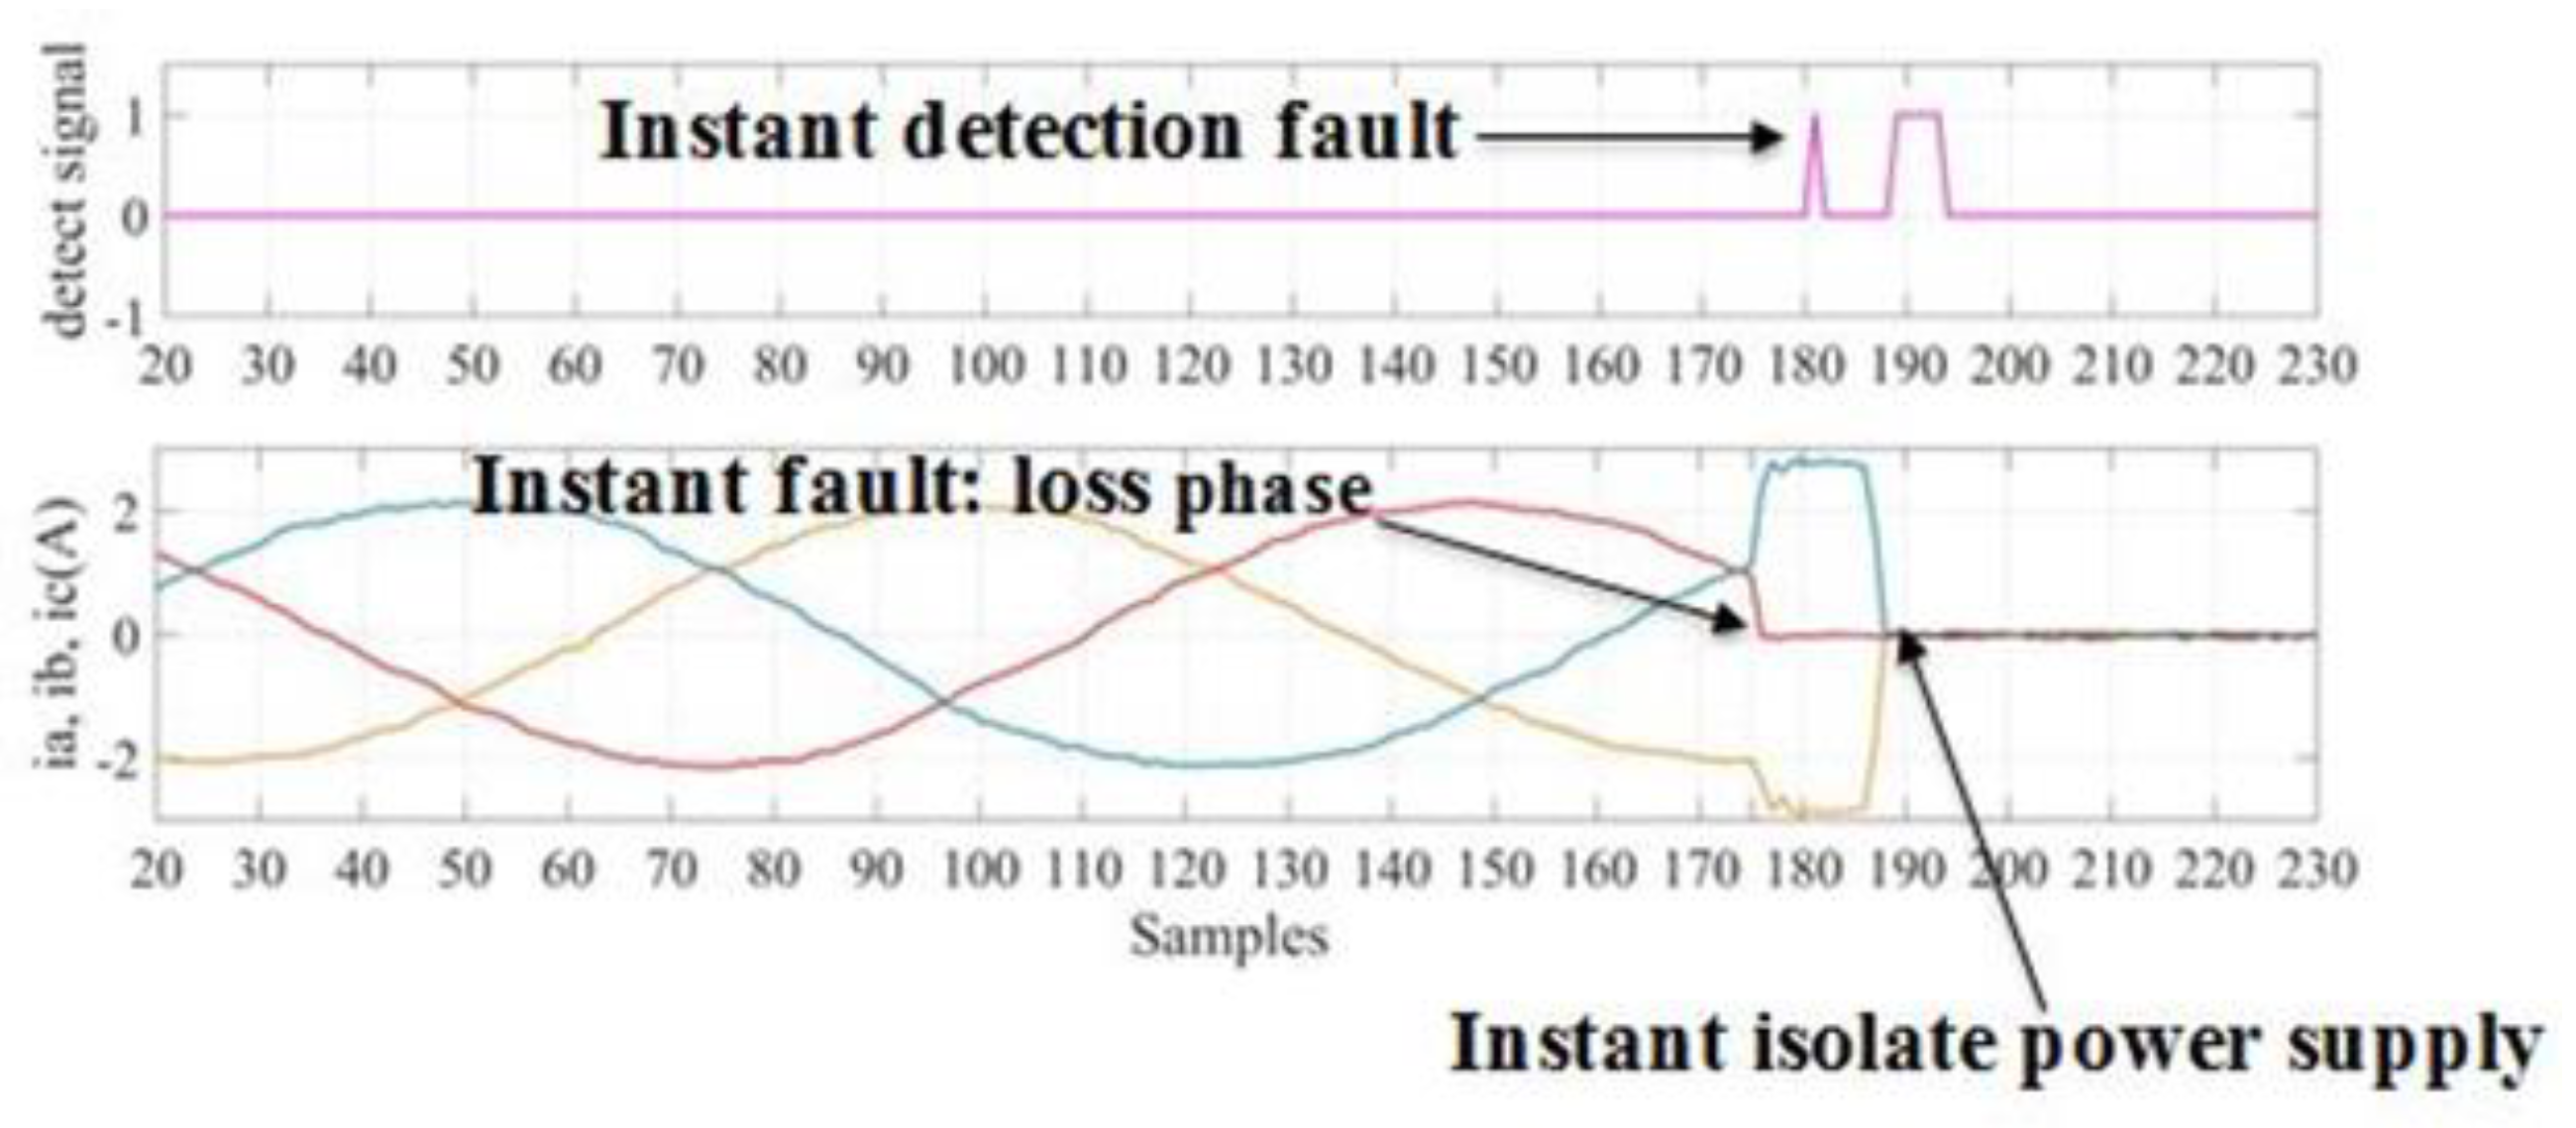
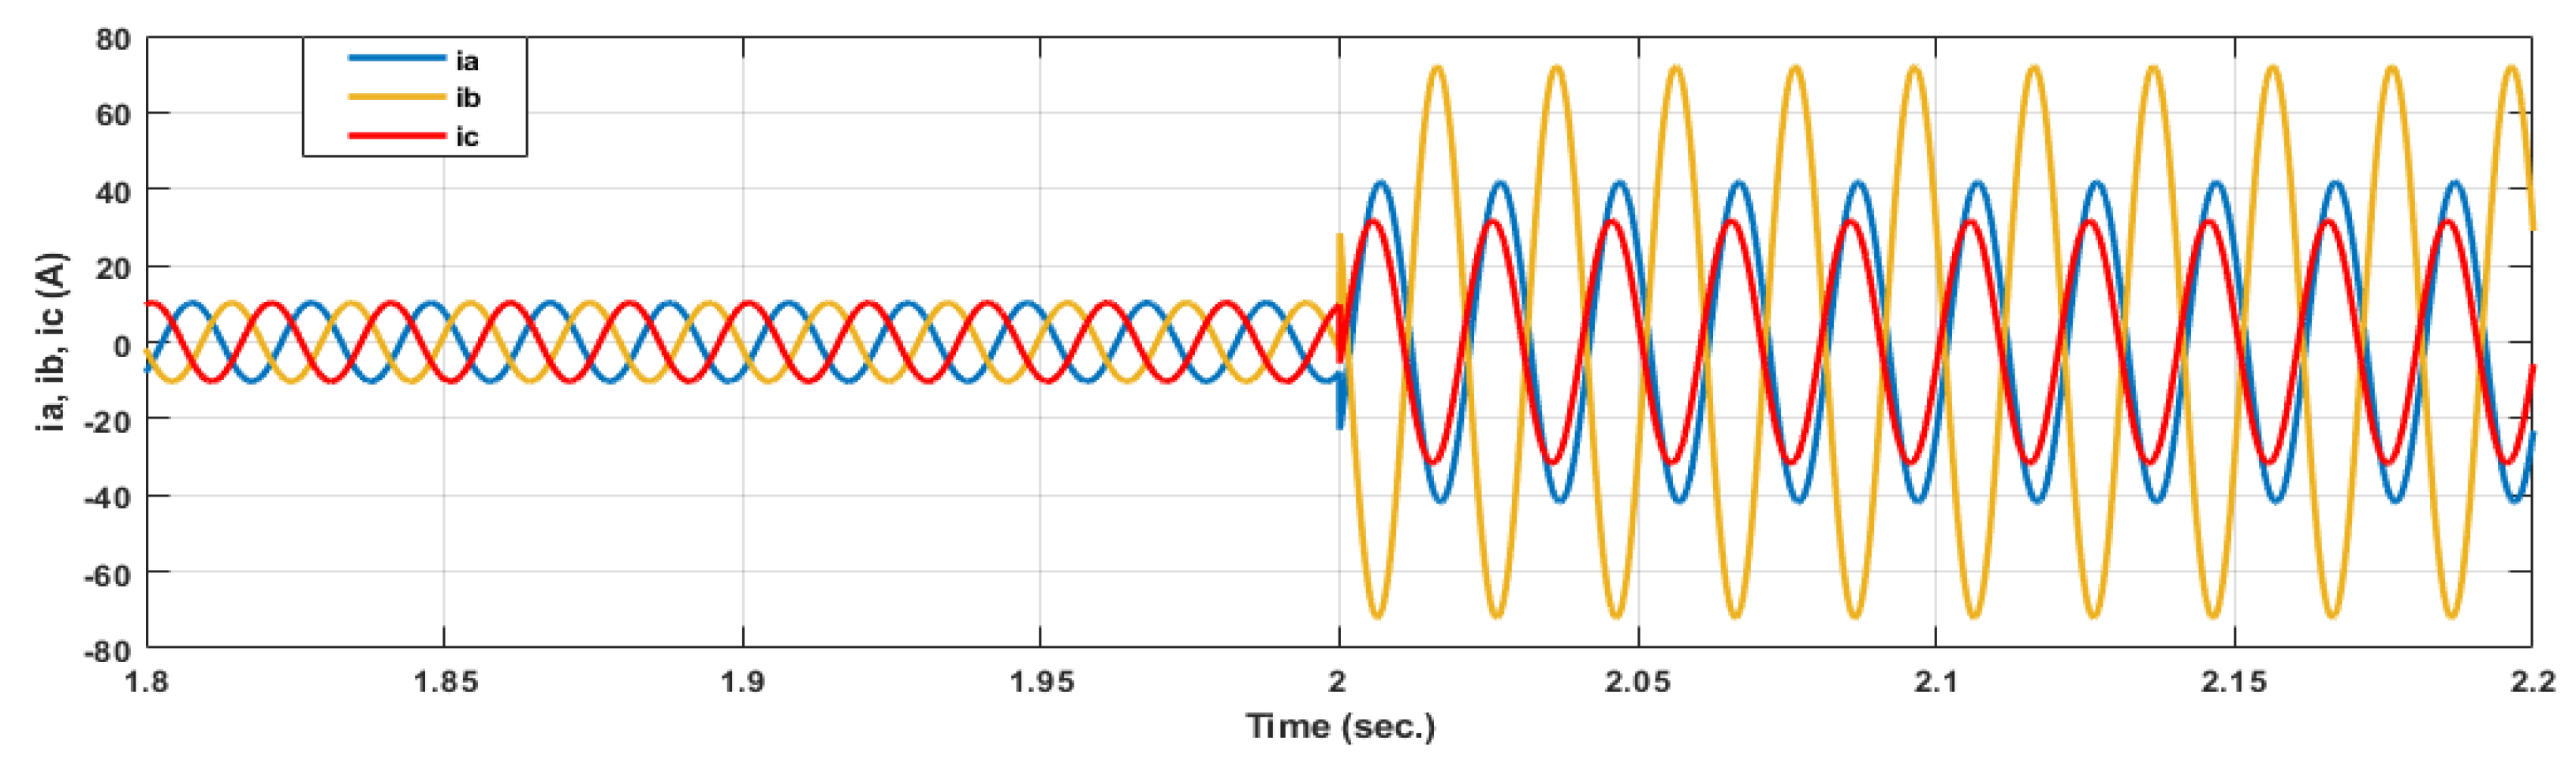
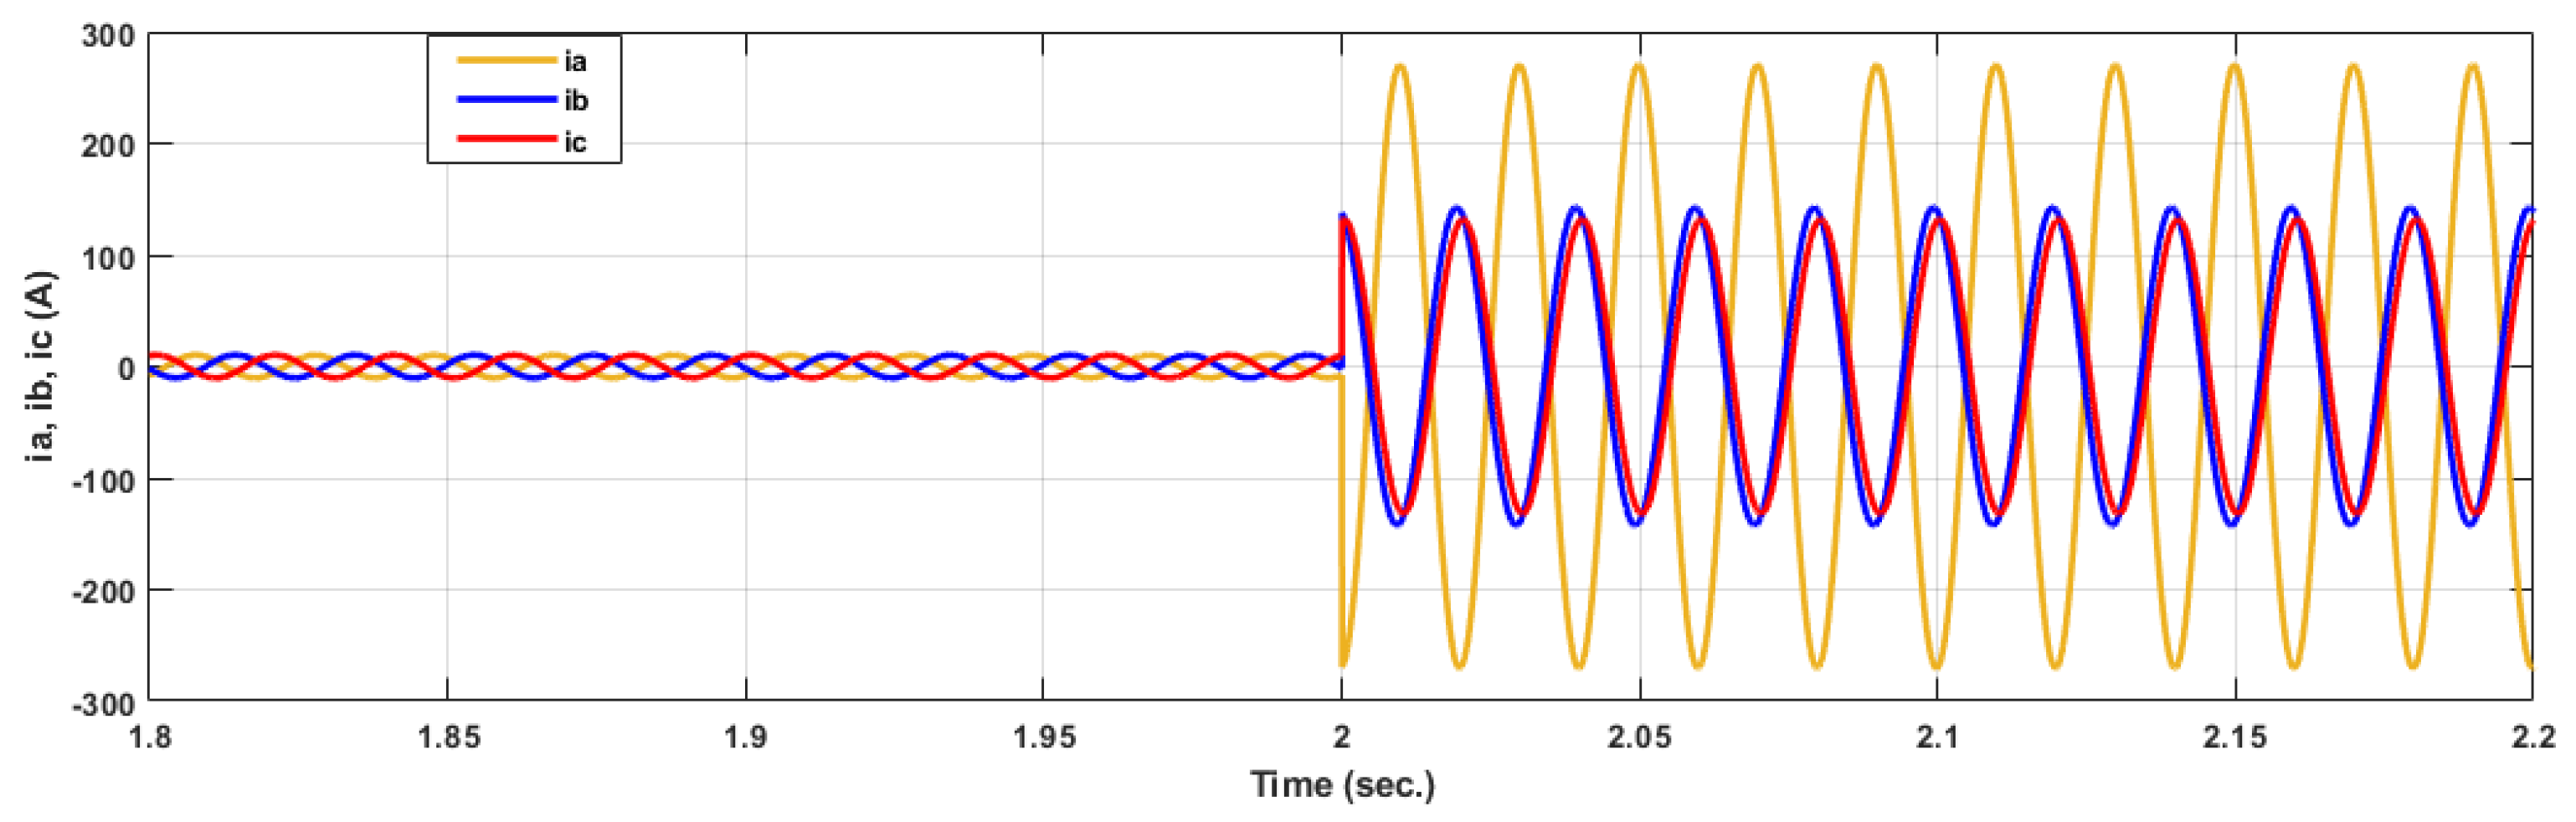
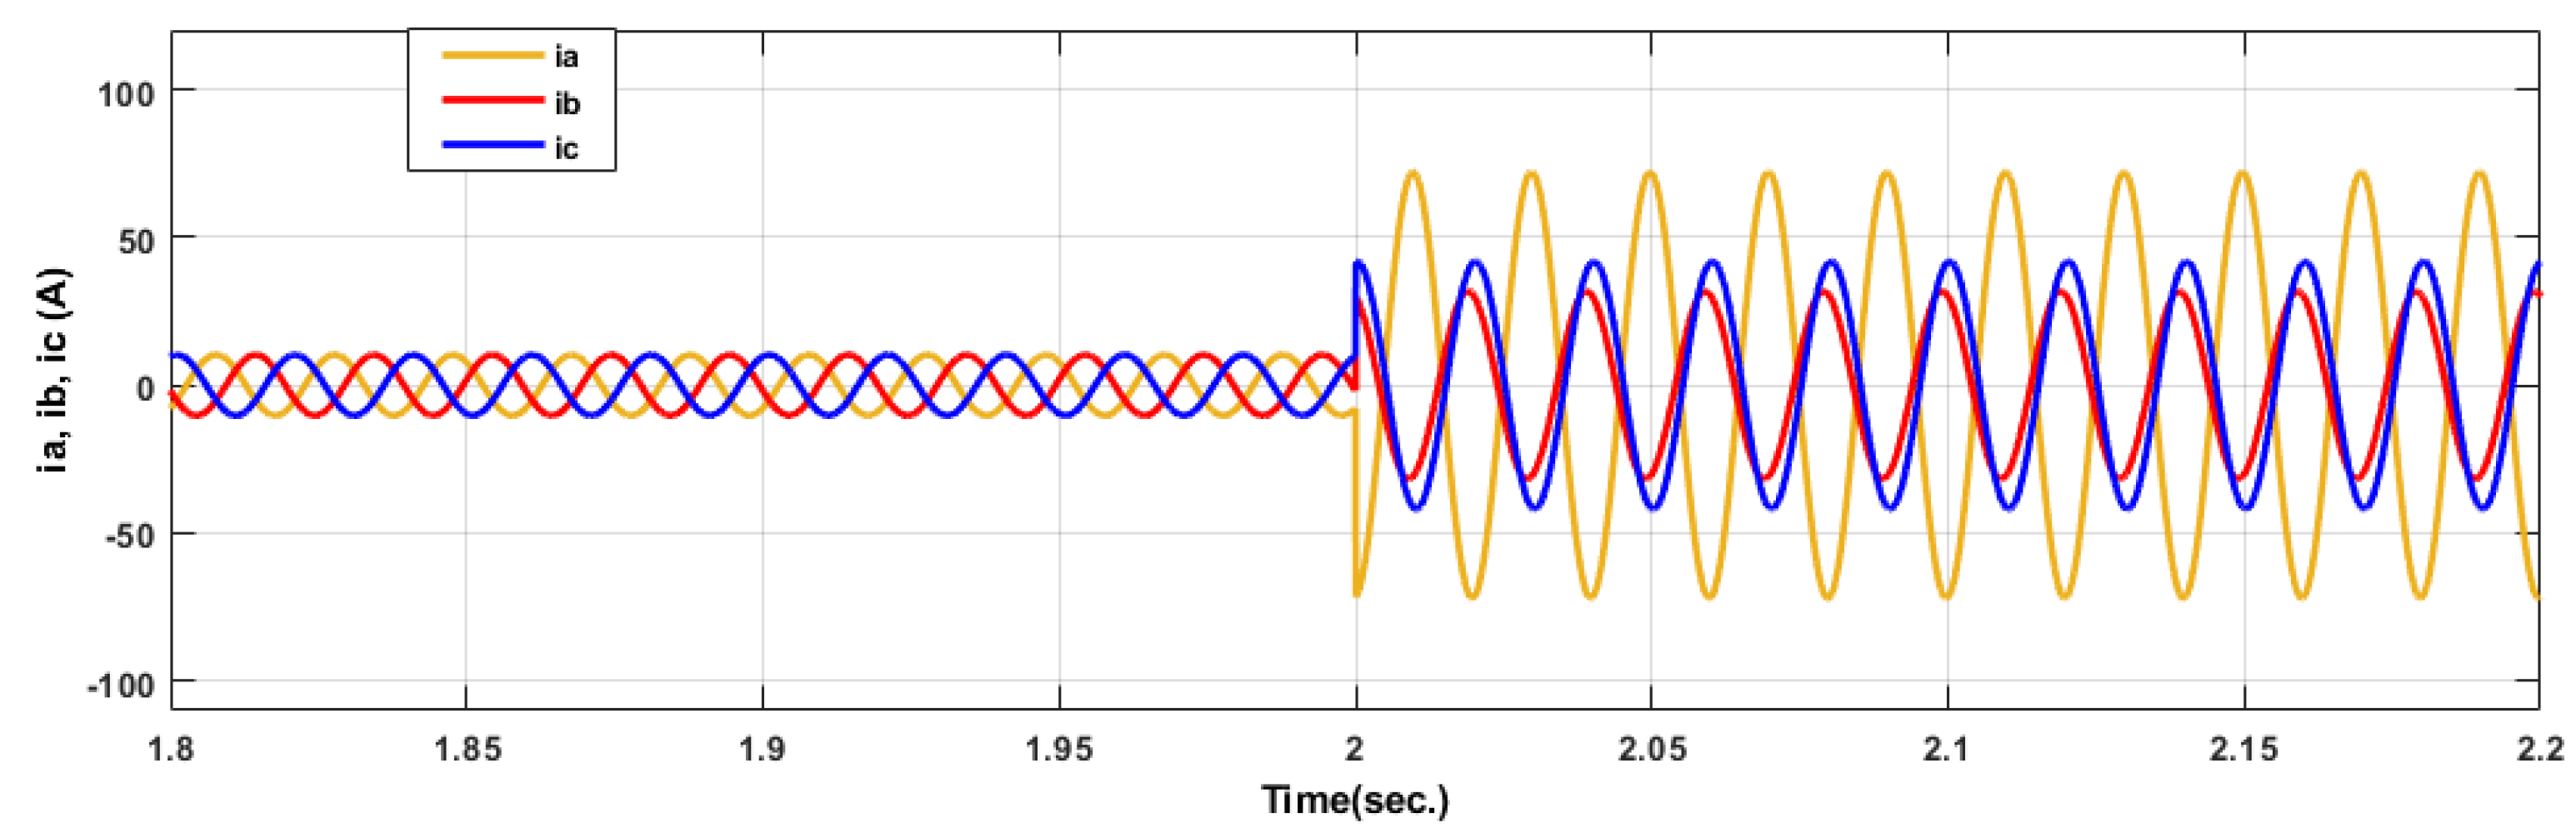
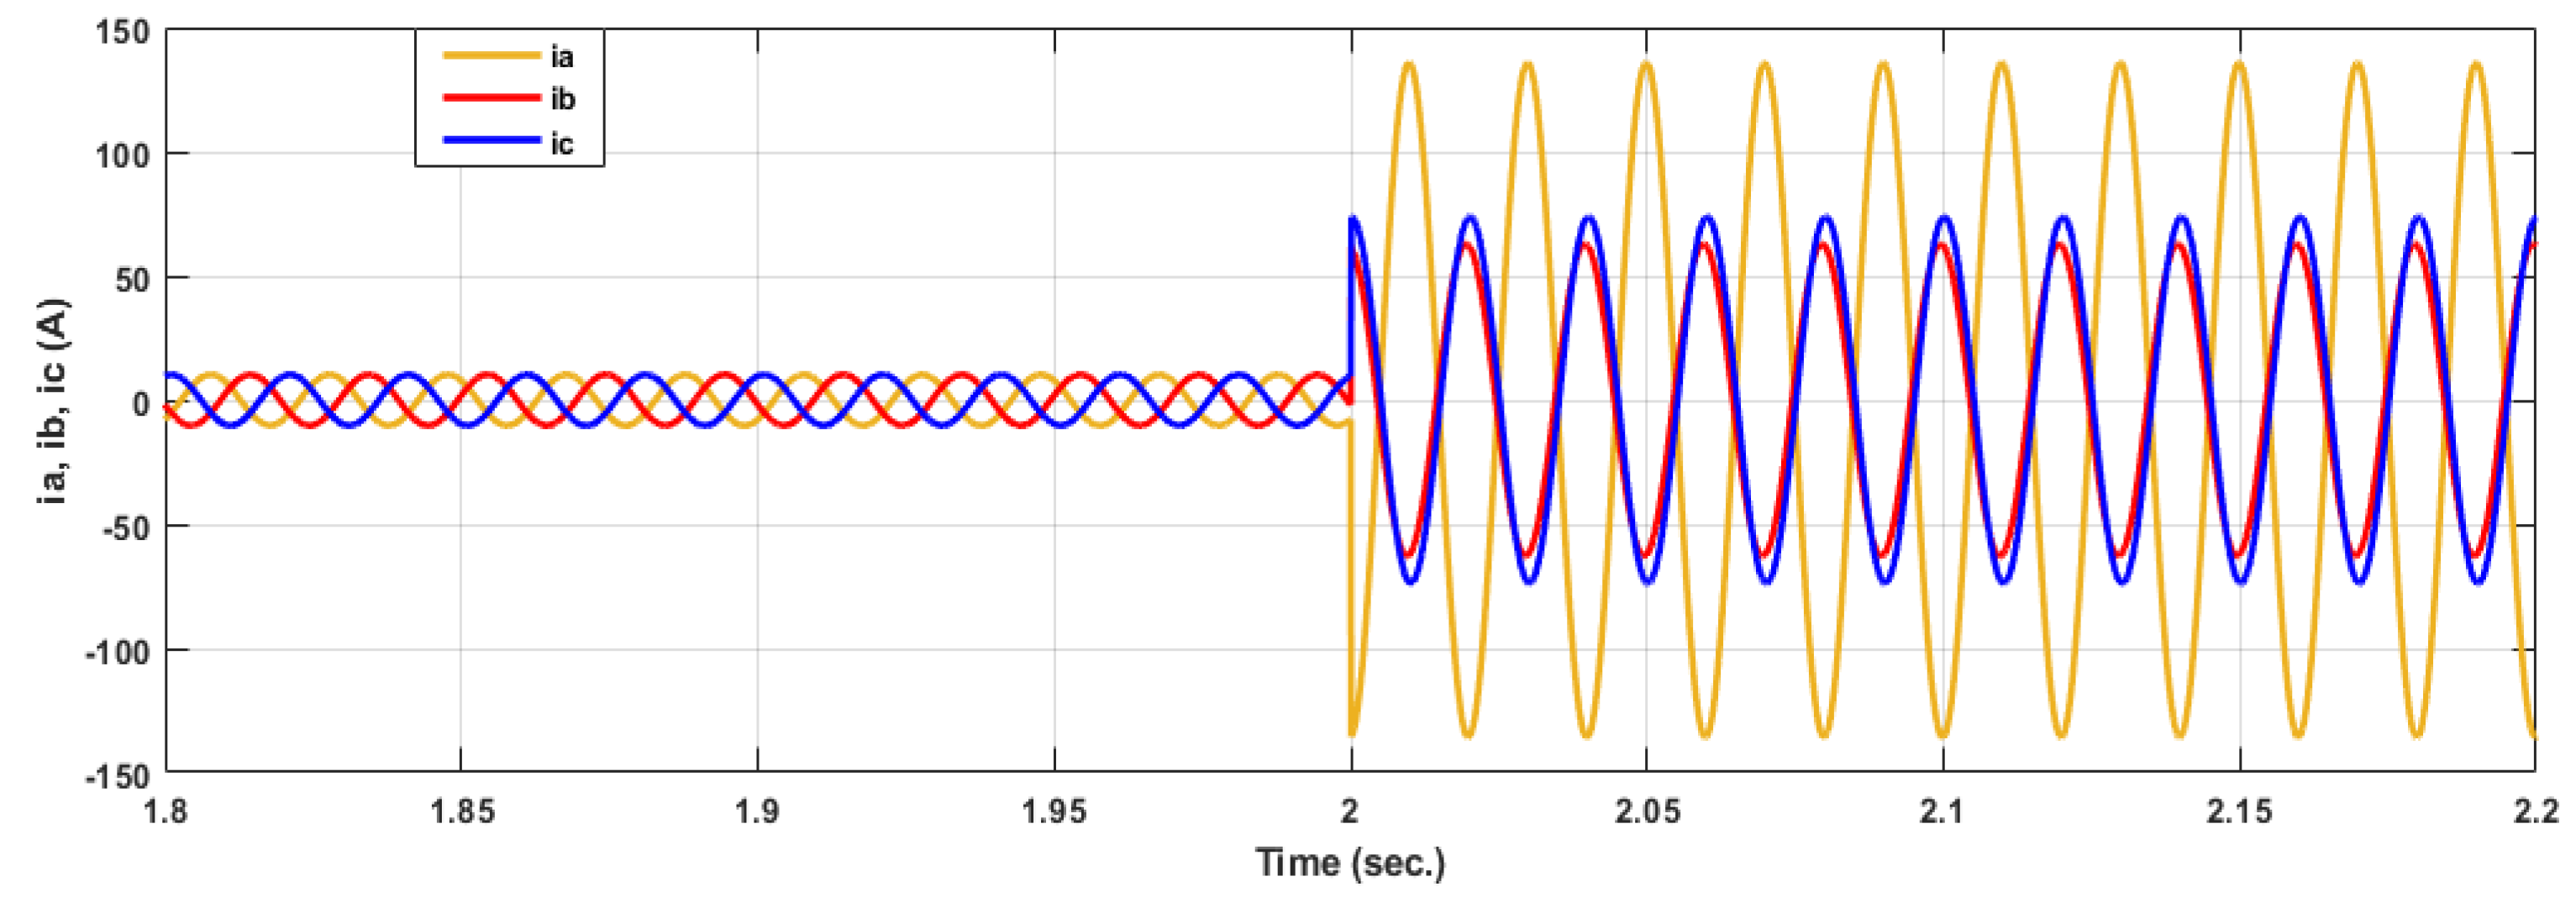
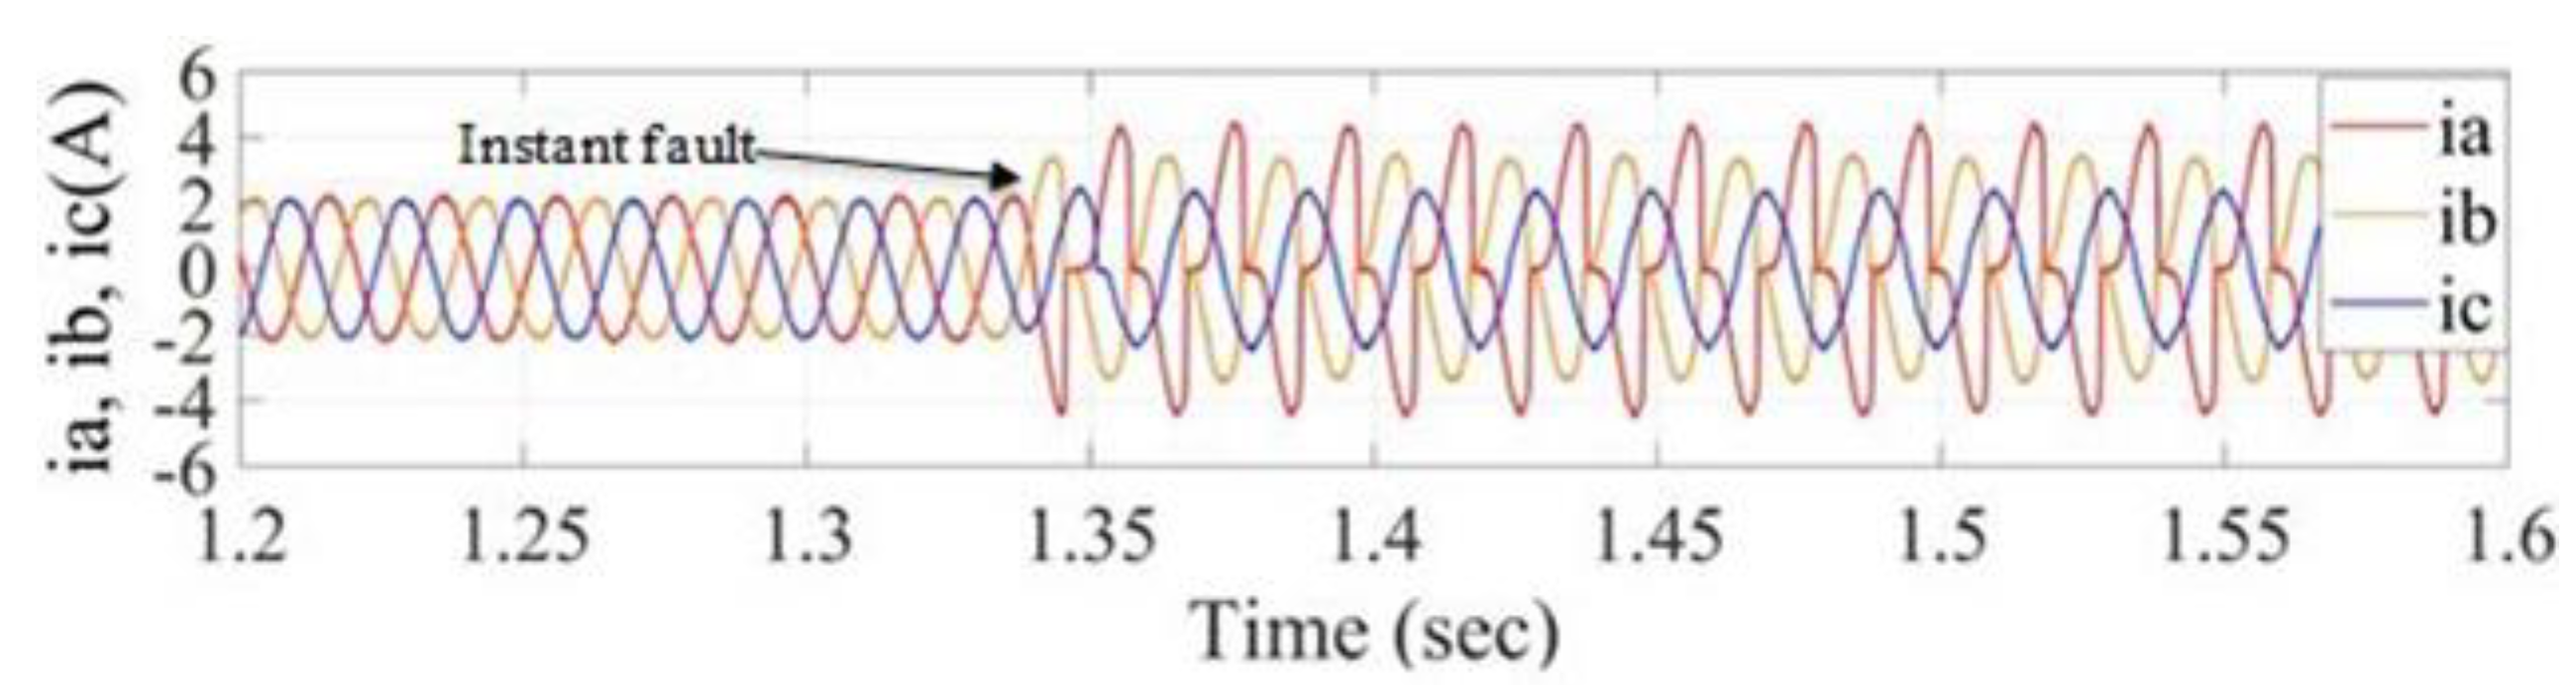
7. Simulation Results for Detection, Diagnosis and Activating the Trip Signal

To assess the performance of the proposed technique on the transition from no load to full load motor, the simulation results are shown in Figure 18. From this screen shot, the system illustrates the normal operation of the motor, despite the no load to full load disturbance (no trip signal and normal operating condition of the motor can be seen on the PC screen).
The proposed method when using its moving window frame algorithm takes less time compared to the method when it uses its non-overlapping window frame algorithm in detecting faults. However, the proposed method, when using its moving window frame algorithm, is computationally more expensive and requires more compute memory to be executed than the proposed algorithm when using the non-overlapping window frames.
The simulation results for the application of the proposed method when it uses its non-overlapping window frame are shown in Figure 19 and Figure 20, where these figures show the stator current before and after the instant fault is being induced and before and after the activation of the trip signal. Figure 19 shows the current signals before and after isolating the supply after a trip signal has been initiated by making a 10% short circuit in phase-b, and in Figure 20, the induced fault is 25% in phase b and 10% in phase a. In both cases, the trip signal has a delay of 64 samples, because the fault cannot be detected in the first 64 samples.
The simulation results for the application of the proposed method when it uses its moving window frame are shown in Figure 21 and Figure 22, where these figures show the stator current before and after the instant fault is being induced and before and after the activation of the trip signal.
Figure 21 shows the current signals before and after isolating the supply after a trip signal has been initiated by making a 10% short circuit in phase-b, and in Figure 22, the induced fault is 25% in phase b and 10% in phase a. In both cases, the trip signal has a delay of one to two sample/s. This almost immediate detection and classification of the fault has significantly improved the efficiency of the system and reduces the damage to the motor due to the fault.

8. Experimental Results

All the steps of the proposed method, which were simulated in the above theoretical sections, will be experimentally implemented in this section. The setups of the experimental equipment are shown in Figure 23. The system includes an induction motor winding in a special way to allow the implementation of inter-turn short circuit by pulling out three wires from each phase. Detailed specifications of the system utilized in this experiment are as follows:
  • Induction motor: 1 hp, rated current 2 A, 3-phase 380 V;
  • PC specifications: Core i5, RAM 4GB, hard SSD256GB, windows 7, and the proposed algorithm is implemented in MATLABE 2019B platform and when generating experimental results, no other programs are running on the PC;
  • LABJACK UD-U3 is used to capture current samples from the power current lines of the induction motor.
The second stage involves gathering sample data experimentally when different types of faults are introduced to the induction motor and assessing the proposed threshold values for detection and classification of the faults. Samples of current signals from a real induction motor are shown in Figure 24 and Figure 25. Figure 24 shows the current signals for the no-load condition of the motor, when phase (b) has been disconnected. This resulted in an increase in the current of phase-a and phase-b. The signals were taken via the current lines, which feed the stator coils. A special circuit, which can feed the motor without affecting the shape of voltage/current due to being overloaded, as shown in Figure 23a, is used.
Figure 25 shows the no-load scenario of the motor with a 25% inter-turn fault in phase (a) as its fault condition. As shown in Figure 25, the current values of phase-a and phase-b have been increased and harmonic has also appeared on the current signals.
The entropy power energy of the captured signal for all four second level WPT subbands’ coefficients for healthy and different types of faults in the induction motor has been calculated from its captured current signals and tabulated in Table 5.
Entropy power energy of WPT subband da2’s coefficients, which are used to determine thresholds in practical cases, have been calculated and illustrated in Figure 26 in the form of a curve.
By comparing the theoretical and practical curves shown in Figure 17 and Figure 26, it can be observed that the EE values for current signal in an induction motor increases as damage to the motor increases. The experiments were repeated with a couple of inductor motors with the same power rating and feeding system but different motor parameters. The results confirmed the generality of the findings and computed thresholds. Moreover, the characteristics of the filters that were used for fault diagnosis show that the entropy value is close to zero in healthy conditions, but it increases as the fault is induced to the motor. Therefore, the proposed technique can be used to detect fault in induction motors in general. In this study, two motors with different parameters but the same power rating were applied, and similar results were obtained. The generality of the proposed algorithm was further investigated with MATLAB Simulink simulation on several induction motors with the same power rating but different motor parameters; the results were in consistent with our previous findings. From the achieved consistency of the experimental results with real induction motors with the MATAB Simulink simulation results, it can be concluded that the proposed method can be used for fault detection and the classification of other types of motors and expect similar results. However, our experimental results were generated on two available motor types with the same power rating. From the theoretical side, the dd2 and ad2’s coefficients were used to determine the diagnosis thresholds to classify the type of fault in the motor, as shown in Table 6.
Experimental results for the application of the proposed method using the computed threshold values to detect and classify the faults and activate the trip signal to protect the induction motor by disconnecting it from the power supply are shown in Figure 27, Figure 28 and Figure 29. Figure 27 shows the current signals of a healthy induction motor, when it starts to its steady state. As observed, the trip signal has not been activated, which shows the robustness of the proposed algorithm.
Figure 28 shows the stator current signals and the trip signal waveforms for 50% stator fault in phase (c) on a no-load motor condition. From this figure, the system has immediately detected the fault in the motor, activated the trip signal, and the breaker has disconnected the motor from the power supply.
Figure 29 illustrates the stator current signals and trip signal waveforms for phase (c) to ground fault with load condition. From this figure, the system has immediately detected the fault in the motor, activated the trip signal, and the breaker has disconnected the motor from the power supply.
Figure 30 shows a current signal with phase loss fault condition and the detection signal that is generated from the WPL energy algorithm.
To generalize the validity of the proposed motherhood, the practical experiments and simulation results were generated using a 1 hp induction motor. The experiments were repeated with a 3 hp induction motor, when different faults were induced to the motor. The captured current signals were then processed using the proposed technique. Hence, the Entropy power Energy (EE) values of all four second level WPT subbands’ coefficients for different practical conditions of the induction motor were calculated, tabulated in Table 7, and used as features for determining the condition of the motor. It was already demonstrated in this paper that the calculated EE value of the motor’s current high frequency WPT subbands’ coefficients can be used as an indicator to diagnose the condition of the induction motor. The results presented in Table 7 support the above findings. The results also show a clear link between the motor power rating and the selection of the threshold values for distinguishing different conditions of the motor. This can be further studied to determine a method to normalize the threshold values and make them independent of the power rating of the motors, which required significant resources but can be beneficial to the research community.
Figure 31, Figure 32, Figure 33, Figure 34 and Figure 35 show the current signal of a 3hp induction motor under its different conditions. The results presented in these Figures are inconsistent with the present results for a 1 hp induction motor.
The maximum scan rate of labjack is equal to 50 k samples/s per the number of channels used. In this experiment, three channels of the labjack were used. Therefore, the maximum sampling rate is 16.67 k samples/s per channel. Using a scan rate of 2500 samples per channel per second, the number of samples for each cycle can be calculated as follows.
sample   rate = scan   rate × number   of   channels   × time   for   one   cycle
Therefore, for 50 Hz supply, the number of samples in one cycle will be:
sample   rate = 2500 × 3 × 0.02 = 150   sample   in   one   cycle  
As it can be seen from Figure 30, the time between the occurrence of a fault and the system to activate the trip signal is five samples, which equals to 0.02 150 × 5 = 0.00066   s . These experimental results confirm the capability of the proposed technique in detecting and identifying the type of the fault in a very short period of time. The achieved performance is due to the wavelet time-scale decomposition property of the ‘sym5’ mother wavelet.

9. Conclusions

A fault detection technique for three-phase induction motors using wavelet packet transform was detailed in this paper. The proposed algorithm combines sample three phase current signals of the induction motor and combined them using their mean Squair values creating a single current signal, which is used to determine the health of the motor and to check if a fault occurred and to identify the type of the fault. The proposed algorithm splits the current samples into window frame samples. Two methods were proposed to generate window samples: non-overlapping window frames and moving window frame methods. Each resulting window frame samples was then processed separately as follows. It performed two level WPT on the window frame samples, extracting its four wavelet subbands. It then calculates the entropy power energy of the resulting high frequency subband coefficients. The resulting da2’s EE value is used to determine the condition of the motor. If it was found that the motor is faulty, ad2 and dd2’s EEs are used to identify the type of the fault. Threshold values for fault detection and classification are first determined using MATLAB Simulink simulations, and then they were empirically verified using real equipment under induced faults. The proposed system was capable of activating a trip signal after detecting a fault and disconnecting the induction motor from the power supply to protect the motor against further electrical damage. Moreover, it was shown that one-sample moving window could detect the fault much faster than the non-overlapping method at the price of higher computational cost and computer memory usage. The proposed method was first simulated in MATLAB platform and then implemented using a real motor and test equipment. Experimental results on a range of motors were consistent with the simulation results. To the authors’ knowledge, Stockwell and Hilbert transform and their combination have been widely used for fault detection in transmission lines. However, their applications for fault detection and classification in induction motors can be investigated as an extension to the proposed method in the future.

Author Contributions

Conceptualization, A.M.H. and A.A.O.; methodology, A.M.H., A.A.O., A.L.S. and R.H.A.Z.; software, A.M.H. and A.A.O.; validation, A.M.H., A.A.O., Y.I.A.A.-Y., H.F., A.L.S. and G.M.; formal analysis, A.M.H. and A.A.O.; investigation, A.M.H. and A.A.O.; resources, A.M.H. and A.A.O.; writing—original draft preparation, A.M.H., A.A.O., R.H.A.Z., Y.I.A.A.-Y., H.F., G.M., R.A.A.-A., A.L.S. and A.S.-A.; writing—review and editing, A.M.H., A.A.O., R.H.A.Z., Y.I.A.A.-Y., H.F., G.M., R.A.A.-A. and A.S.-A.; visualization, A.M.H., A.A.O., R.H.A.Z., Y.I.A.A.-Y., H.F., G.M., R.A.A.-A. and A.S.-A.; supervision, A.A.O.; Y.I.A.A.-Y., G.M. and R.A.A.-A. All authors have read and agreed to the published version of the manuscript.

Funding

This work was supported in-part by British Academy under Grant GCRFNGR3/1541.

Conflicts of Interest

The authors declare no conflict of interest.

References

  1. Chavhan, K.B.; Ugale, R.T. Automated Test Bench for an Induction Motor using Lab VIEW. In Proceedings of the 1st IEEE International Conference on Power Electronics, Intelligent Control and Energy Systems, Delhi, India, 4–6 July 2016; pp. 1–6. [Google Scholar]
  2. Ramasamy, P.; Krishnasamy, V. SVPWM control strategy for a three-phase five level dual inverter fed open-end winding induction motor. ISA Trans. 2020, 102, 105–116. [Google Scholar] [CrossRef] [PubMed]
  3. Bacha, K.; Salem, S.B.; Chaari, A. An improved combination of Hilbert and Park transforms for fault detection and identification in three-phase induction motors. Int. J. Electr. Power Energy Syst. 2012, 43, 1006–1016. [Google Scholar] [CrossRef]
  4. Bouzid, M.B.K.; Champenois, G.; Tnani, S. Reliable stator fault detection based on the induction motor negative sequence current compensation. Int. J. Electr. Power Energy Syst. 2017, 95, 490–498. [Google Scholar] [CrossRef]
  5. Zaggout, M.; Ran, L. Detection of rotor electrical asymmetry in wind turbine doubly-fed induction generators. Renew. Power Gener. IET 2014, 8, 878–886. [Google Scholar] [CrossRef] [Green Version]
  6. He, W.; Zi, Y.; Chen, B.; Wu, F.; He, Z. Automatic Fault Feature Extraction of Mechanical Anomaly on Induction Motor Bearing Using Ensemble Super-Wavelet Transform. Mech. Syst. Signal Process. 2014, 54, 1–24. [Google Scholar] [CrossRef]
  7. Asad, B.; Vaimann, T.; Belahcen, A.; Kallaste, A.; Rassõlkin, A.; Iqbal, M.N. Broken rotor bar fault detection of the grid and inverter-fed induction motor by effective attenuation of the fundamental component. IET Electr. Power Appl. 2019, 13, 2005–2014. [Google Scholar] [CrossRef]
  8. Campos-Delgado, D.U.; Espinoza-Trejo, D.R.; Palacios, E. Fault-tolerant control in variable speed drives: A survey. IET Electr. Power Appl. 2008, 2, 121–134. [Google Scholar] [CrossRef]
  9. Sapena-Bano, A.; Martinez-Roman, J.; Riera-Guasp, M. Induction machine model with space harmonics for fault diagnosis based on the convolution theorem. Int. J. Electr. Power Energy Syst. 2018, 100, 463–481. [Google Scholar] [CrossRef]
  10. Mehala, N.; Dahiya, R. A Comparative Study of FFT, STFT and Wavelet Techniques for Induction Machine Fault Diagnostic Analysis. In Proceedings of the International Conference on Computational Intelligence, Haryana, India, 10–12 December 2008; pp. 203–206. [Google Scholar]
  11. Espinoza-Trejo, D.R.; Campos-Delgado, D.U.; Bossio, G.; Bárcenas, E.; Hernández-Díez, J.E.; Lugo-Cordero, L.F. Fault diagnosis scheme for open-circuit faults in field-oriented control induction motor drives. IET Power Electron. 2013, 6, 869–877. [Google Scholar] [CrossRef]
  12. Shi, P.; Chen, Z.; Vagapov, Y.; Davydova, A.; Lupin, S. Broken Bar Fault Diagnosis for Induction Machines Under Load Variation Condition Using Discrete Wavelet Transform. In Proceedings of the IEEE East-West Design & Test Symposium (EWDTS 2014), Kiev, Ukraine, 26–29 September 2014; Volume 1, pp. 1–4. [Google Scholar]
  13. Roshanfekr, R.; Jalilian, A. Wavelet-based index to discriminate between minor inter-turn short-circuit and resistive symmetrical faults in stator windings of doubly fed induction generators: A simulation study. IET Gener. Transm. Distrib. 2016, 10, 374–381. [Google Scholar] [CrossRef]
  14. Yahia, K. Induction motors airgap-eccentricity detection through the discrete wavelet transform of the apparent power signal under non-stationaryoperating conditions. ISA Trans. 2014, 53, 603–611. [Google Scholar] [CrossRef] [PubMed]
  15. Climente-alarcon, V.; Antonino-daviu, J.; Member, S. Induction Motor Diagnosis by Advanced Notch FIR Filters and the Wigner-Ville Distribution. IEEE Trans. Ind. Electron. 2014, 61, 4217–4227. [Google Scholar] [CrossRef] [Green Version]
  16. Ahamed, S.K.; Sarkar, A.; Mitra, M.; Sengupta, S. Induction Machine Stator Inter-Turn Short Circuit Fault. Innov. Syst. Des. Eng. 2014, 5, 75–82. [Google Scholar]
  17. Hammo, R. Faults Identification in Three-Phase Induction Motors Using Support Vector Machines. In Master of Technology Management Plan II Graduate Project; Bowling Green State University: Toledo, OH, USA, 2014. [Google Scholar]
  18. Lu, J.; Wang, P.; Duan, S.; Shi, L.; Han, L. Detection of Broken Rotor Bars Fault in Induction Motors by Using an Improved MUSIC and Least-Squares Amplitude Estimation. Math. Probl. Eng. 2018, 2018, 1–12. [Google Scholar] [CrossRef]
  19. Mejia-barron, A.; De Santiago-perez, J.J.; Granados-lieberman, D.; Amezquita-sanchez, J.P.; Valtierra-rodriguez, M. Shannon Entropy Index and a Fuzzy Logic System for the Assessment of Stator Winding Short-Circuit Faults in Induction Motors. Electronic 2019, 8, 90. [Google Scholar] [CrossRef] [Green Version]
  20. Bessam, B.; Menacer, A.; Boumehraz, M.; Cherif, H. DWT and Hilbert Transform for Broken Rotor Bar Fault Diagnosis in Induction Machine at Low Load. Energy Procedia 2015, 74, 1248–1257. [Google Scholar] [CrossRef] [Green Version]
  21. Nemec, M.; Ambrožič, V.; Fišer, R.; Nedeljković, D.; Drobnič, K. Induction Motor Broken Rotor Bar Detection Based on Rotor Flux Angle Monitoring. Energies 2019, 12, 794. [Google Scholar] [CrossRef] [Green Version]
  22. Zolfaghari, S.; Noor, S.; Mehrjou, M.R.; Marhaban, M.; Mariun, N. Broken Rotor Bar Fault Detection and Classification Using Wavelet Packet Signature Analysis Based on Fourier Transform and Multi-Layer Perceptron Neural Network. Appl. Sci. 2017, 8, 25. [Google Scholar] [CrossRef] [Green Version]
  23. Shao, H. Rolling bearing fault diagnosis using adaptive deep belief network with dual-tree complex wavelet packet. ISA Trans. 2017, 69, 187–201. [Google Scholar] [CrossRef]
  24. Keskes, H.; Brahama, A.; Lachiri, Z. Broken Rotor Bar Diagnosis in Induction Machines Through Stationary Wavelet Packet Transform and Multiclass Wavelet SVM. Electr. Power Syst. Res. 2013, 97, 151–157. [Google Scholar] [CrossRef]
  25. De Oliveira, H.M. Shannon and Renyi Entropy of Wavelets. Int. J. Math. Comput. Sci. 2015, 10, 1–5. [Google Scholar]
  26. Alsharabi, K.; Ibrahim, S.; Djemal, R.; Alsuwailem, A. A DWT-Entropy-ANN Based Architecture for Epilepsy Diagnosis Using EEG Signals. In Proceedings of the IEEE 2nd Interntioal Conference on Advanced Technologies for Signal and Smage Processing (ATSIP), Monastir, Tunisia, 21–23 March 2016; pp. 288–291. [Google Scholar]
  27. Hajihosseini, P. Process fault isolation based on transfer entropy algorithm. ISA Trans. 2014, 53, 230–240. [Google Scholar] [CrossRef] [PubMed]
  28. Mehta, S. Generalized Theory of Electrical Machines—A review. Int. J. Res. Sci. Innov. 2016, 3, 67–71. [Google Scholar]
  29. Leedy, A.W. Simulink/matlab Dynamic Induction Motor Model for Use as a Teaching and Research Tool. Int. J. Soft Comput. Eng. 2013, 3, 102–107. [Google Scholar]
  30. Bhatti, M.K.; Multan, T. Direct Quadrate (D-Q) Modeling of 3-Phase Induction Motor Using MatLab/Simulink. Can. J. Electr. Eng. 2012, 3, 237–243. [Google Scholar]
  31. Bachir, S.; Tnani, S.; Trigeassou, J.C.; Champenois, G. Diagnosis by Parameter Estimation of Stator and Rotor Faults Occurring in Induction Machines. IEEE Trans. Ind. Electron. 2006, 53, 963–973. [Google Scholar] [CrossRef]
Figure 1. Three level WPT subbands of a sample current signal of an induction motor.
Electronics 11 01253 g001
Figure 2. Simulink model of a 3-phase induction motor under normal conditions.
Electronics 11 01253 g002
Figure 3. Sub-block of a 3-phase induction motor in d-q axis.
Electronics 11 01253 g003
Figure 4. Simulink block diagram of the inter-turn.
Electronics 11 01253 g004
Figure 5. Sub-block of the stator faults.
Electronics 11 01253 g005
Figure 6. Simulink model of an induction motor with faults in its rotor.
Electronics 11 01253 g006
Figure 7. Modeling of an induction motor with faults in its rotor.
Electronics 11 01253 g007
Figure 8. Current signals for 25% short circuit fault in phase c.
Electronics 11 01253 g008
Figure 9. Phase a to ground fault current signal.
Electronics 11 01253 g009
Figure 10. Current signals for phase a to phase b fault.
Electronics 11 01253 g010
Figure 11. Fault detection using moving frame algorithm.
Electronics 11 01253 g011
Figure 12. Fault detection using the non-overlapping window frame method.
Electronics 11 01253 g012
Figure 13. Block diagram of the proposed fault classification method.
Electronics 11 01253 g013
Figure 14. The 2nd level WPT-coefficients for healthy condition.
Electronics 11 01253 g014
Figure 15. The 2nd level WPT-coefficients for faulty condition.
Electronics 11 01253 g015
Figure 16. Entropy Energy (EE) value for different operation condition of an induction motor using da2 WPT subband coefficients.
Electronics 11 01253 g016
Figure 17. Entropy power energy curve for (a) WPT dd2− and (b) ad2 subband’s coefficients, where the regions representing different types of faults have been annotated on the curves.
Electronics 11 01253 g017
Figure 18. Stator current and trip signals for no-load to full load condition within the diagnosis window.
Electronics 11 01253 g018
Figure 19. Stator current and trip signals for 10% inter-turn fault in phase-b (application of the proposed method when it uses its non-overlapping window frame algorithm).
Electronics 11 01253 g019
Figure 20. Stator current and trip signals for 25% inter-turn fault in phase-b and 10% inter-turn fault in phase-a (application of the proposed method when it uses its non-overlapping window frame algorithm).
Electronics 11 01253 g020
Figure 21. Stator current and trip signals for 10% inter-turn fault in phase-c (application of the proposed method when it uses its moving window frame algorithm).
Electronics 11 01253 g021
Figure 22. Stator current and trip signals of a broken one bar fault (application of the proposed method when it uses its moving window frame algorithm).
Electronics 11 01253 g022
Figure 23. The implemented system (a) Block diagram, and (b) practical implementation of the protection system.
Electronics 11 01253 g023
Figure 24. Stator current signal for no-load and when the phase (b) has been disconnected/lost.
Electronics 11 01253 g024
Figure 25. Stator current signals for no-load with 25% fault in phase (a).
Electronics 11 01253 g025
Figure 26. Entropy power energy value of WPT subband da2’s coefficients for different motor fault conditions, using captured experimental data.
Electronics 11 01253 g026
Figure 27. Stator currents’ signals and trip signal waveforms for healthy starting condition of an inductive motor.
Electronics 11 01253 g027
Figure 28. Stator current signals and the trip signal waveforms for 50% stator fault in phase (c) on a no-load condition.
Electronics 11 01253 g028
Figure 29. Stator current signals and trip signal waveforms for phase (c) to ground fault with load condition.
Electronics 11 01253 g029
Figure 30. Stator current signal and trip signal for phase loss fault.
Electronics 11 01253 g030
Figure 31. Current signals for 25% short circuit fault in phase b.
Electronics 11 01253 g031
Figure 32. Current signals for 25% short circuit fault in phase c.
Electronics 11 01253 g032
Figure 33. Current signals for 10% short circuit fault in phase a and phase b.
Electronics 11 01253 g033
Figure 34. Current signals for 25% short circuit fault in phase a.
Electronics 11 01253 g034
Figure 35. Current signals for 50% short circuit fault in phase a.
Electronics 11 01253 g035
Table 1. Comparative analysis between Stockwell, Hilbert, and wavelet packet transform.
Wavelet Packet Transform
(Used in the Proposed Method)
Stockwell TransformHilbert Transform
The wavelet packet transform generates a time and frequency representation of the signal at different scales.
In this paper, the entropy power Energy of detailed WPT subbands of the induction motor is used to detect and classify the induction motor’s faults.
Accurate fault detection in less than a second.
It splits the input signal into a number of sections. Each resulting section is first smoothed using a Gaussian filter. It then determines the frequency components of each section using Fourier transform.
It provides a good time-frequency representation of the signal, but there is always a trade-off between its time and frequency accuracy. Moreover, its performance is limited to the size of the window. Authors reported good performance in terms of accuracy in the detection of the faults in a certain section of the motor, e.g., rotors.
It provides a representation of the signal in the same domain (frequency domain). Therefore, it does not provide information about the time of the fault occurrence. However, the focus of the presented research in this paper is on the speed and accuracy of fault detection and classification.
Table 2. Key features of the proposed and state-of-the-art methods.
AuthorsUsed TechniquesKey Features
V.Climente-Alarcon et al. [15]It uses Wigner–Ville distribution techniques to study rotor asymmetry and mixed eccentricities.It splits the stator current into several time-frequency components.
Syed Kamruddin Ahamed et al. [16]It uses DWT, Root Mean Square (RMS), and Power Density Entropy (PDE) index.It analyses the window current signal in the steady-state operation of the motor. It determines the PDE of the high frequency wavelet of the motor current to detect faults in the stator winding of the induction motor.
R. Hammo [17]It uses the Support Vector Machine (SVM), which is a learning-based method.Results show that the application of SVM is alleviating some of the limitations of the Artificial Neural Network (ANN) based methods. Moreover, the SVM based method is more effective than ANN based method in detecting faults in terms of accuracy, where SVM uses the Radial Bases Function kernel.
J. Lu, P. Wang et al. [18]It uses the MUltiple SIgnal Classification (MUSIC) technique and least-squares magnitude estimation to detect the frequency and amplitude of the faults.Because the research of step travel produces lower efficiency, they proposed a method to improve
MUSIC method using Niche Bare-bones Practical Swarm Optimization (NBPSO), which was used to detect broken bars in an induction motor.
A. Mejia-Barron et al. [19]It uses both Shannon Entropy (SE) index and artificial intelligence fuzzy logic.To diagnose faults in the stator of an induction motor, it applies brick-will band-pass filters at multiple levels on induction motor’s current signal and then calculates SE.
M. Nemec et al. [21]It uses the frequency components of inductor motor’s current signal to diagnose faults in the rotor of the motor.The existence of certain frequency components in the current signal of the induction motor indicates the fault in the motor. This method was applied to two different models of induction motor in MATLAB platform.
Proposed methodIt uses wavelet packet transform and Shannon Entropy (SE) criteriaIt uses performs 2 level WPT on induction motor current signal decomposes it into its wavelet subbands. It then determines EE of the fine WPT of the current as a feature to determine the status of the motor. If it was found faulty, it uses some empirically pre-determined thresholds to classify the fault.
Table 3. Entropy Energy values for different operating conditions of the induction motor at its four WPT second level subbands.
Entropyaa2ad2da2dd2
Fault
Healthy no load−5.08 × 1057.41 × 10−54.30 × 10−48.37 × 10−5
Healthy full load−2.65 × 1062.78 × 10−41.30 × 10−32.85 × 10−4
No load to full load healthy−1.52 × 1070.00147.06 × 10−49.30 × 10⁻⁴
10% fault phase-b−2.13 × 10⁶−0.53720.1605−3.4479
15% fault phase-b−2.39 × 10⁶−6.67460.2593−20.04
25% fault phase-c−3.28 × 10⁶−1.36 × 1020.5235−3.14 × 10²
25% fault phase-b−3.29 × 10⁶−48.52160.4773−121.5733
50% fault phase-b−7.83 × 10⁶−446.93260.2243−1.02 × 10³
50% phase-b and 10% phase-a−8.08 × 10⁶−448.92940.2169−1.02 × 10³
25% phase-b and 10% phase-a−3.43 × 10⁶−48.53820.4742−121.5034
Loss phase-a−1.48 × 10⁸−3.13 × 10³−7.15−6.64 × 10³
Phase-c to ground−3.16 × 10⁷−3.04 × 10³−8.88−6.65 × 10³
Three-phase fault−1.88 × 10⁷−17.20760.19010.5652
Line-a to line-b fault−3.91 × 1070.5976−2.6355−78.3431
Line-a to line-b to ground fault−1.55 × 10⁸−3.55 × 10⁴−1.63 × 10³−2.97 × 10⁴
rotor broken 1-bar fault−2.07 × 1060.00250.07046.44 × 10−4
rotor broken 2-bars fault−1.97 × 1063.08 × 10−40.0682.69 × 10−4
Table 4. Entropy power energy threshold values for diagnoses of different types of faults in an induction motor.
Type of FaultEntropy Power Threshold Value for WPT Subband
ad2dd2
Broken one bar0.00113.43 × 10−5
Broken two bars0.00197.11 × 10−5
Line-a to line-b fault0.70540.0764
Loss phase-a18.30.9424
10% inter turn fault phase-b21.993927.0078
25% ph. (b) and 10% ph. (a) inter turn fault31.7595125.079
25% inter turn fault phase-b32.74125.168
50% inter turn fault phase-b446.39321.02 × 10−3
25% ph. (b) and 10% ph. (a) inter turn fault446.6111.02 × 10−3
Table 5. Entropy power energy values of all four second level WPT subbands’ coefficients for different practical conditions of the induction motor.
Motor ConditionWPT Subbands’ Entropy Power Energy
aa2ad2da2dd2
No-load healthy−189.6740.14680.08310.0995
Loaded healthy781.57690.17250.09630.1224
No-load 25% fault (b)−1.13 × 1032.09980.41760.9368
No-load 50% fault (c)−2.56 × 1036.22223.15773.0059
No-load with loss ph. (b)−437.32490.58280.10270.1329
Load condition with 10%fault (a)−856.37410.61390.27030.4808
Load condition with 25%fault (b)−2.08 × 1034.97961.21522.0776
Load condition with 50% fault (c)−3.14 × 10311.39924.14545.4373
Load condition with loss ph. (b)−1.02 × 1030.78890.19220.2736
Phase to ground fault−1.27 × 1032.21730.69711.259
Table 6. Computed Entropy power energy threshold values for the classification of the faults using experimental data.
Type of FaultWPT Subbands’ Entropy Power Energy
ad2dd2
10% no load fault-a0.50160.2338
40% no load fault-b1.31071.1831
50% no load fault-c1.58281.3086
Loss phase fault1.63410.8724
Phase to ground1.76121.4303
50% loaded-c1.38770.9955
Table 7. Entropy power energy values of all four second level WPT subbands’ coefficients for different practical conditions of the induction motor.
Motor ConditionWPT Subbands’ Entropy Power Energy
aa2ad2da2dd2
No-load healthy−3.8914 × 1051.7736 × 10−40.01911.2729 × 10−4
Loaded healthy−7.9257 × 1053.1433 × 10−40.03342.2519 × 10−4
No-load 25% fault(b)−2.9841 × 10⁷−2.2918 × 10⁴−1.5434 × 10³−256.4051
No-load 50% fault(c)−1.1857 × 10⁸−1.5737 × 10⁵−1.0024 × 10⁴−2.4242 × 10³
No-load with loss phase(b)−437.32490.5828 × 1070.10270.1329 × 104
Load condition with 10% fault (a)−6.1115 × 10⁶−1.6653 × 10⁴−1.0147 × 10³−191.9537
Load condition with 25% fault (b)−3.0647 × 10⁷−1.1116 × 10⁴−735.9312−107.2747
Load condition with 50% fault(c)−1.1952 × 10⁸−1.7314 × 10⁵−1.1123 × 10⁴−2.6732 × 10³
Load condition with loss phase (b)−1.02 × 1030.7889 × 1070.19220.2736 × 104
Phase to ground fault−1.27 × 1032.2173 × 1070.69711.259 × 105
Publisher’s Note: MDPI stays neutral with regard to jurisdictional claims in published maps and institutional affiliations.

