
An Algorithm to Predict E-Bike Power Consumption Based on Planned Routes


Abstract
:1. Introduction
1.1. Related Work
1.2. Organization of the Paper
2. Materials and Methods
2.1. Mathematical Model for Power Consumption
- A mass m body placed on a surface with slope s is subject to the gradient resistance forcewhere g is the gravity acceleration, 9.81 m/s. Moving the body uphill at speed v consumes power .
- If the body is an e-bike, the rolling resistance force is proportional to the total load on the wheelsIf we always assume optimal tyre pressure, we can consider the factor a constant depending on the bike characteristics only. Then, if the e-bike moves at speed v, the instant power drained due to friction is .
- The force due to air resistance is proportional to the air density , the frontal area A exposed by the vehicle (including the rider, in case of a bike) and the square of speed:where the so-called drag coefficient is usually determined experimentally, as it accounts for very complex dependencies. Once more, if the e-bike moves at speed v, the power consumed due to air resistance is .
2.2. Computing Power Consumption to Achieve Rider’s Goals
- Using the model for power consumption, compute , the number of Watt-hours required to complete section at speed v.
- Let ℓ be the length of .
- Set .
- Partition W as the sum , where is the human contribution and is clearly “the rest”, i.e., the energy required from the drive unit.
- Return .
- Set and
- For
- (a)
- (Feasibility check)
- (b)
- If
- Append to A
- Emit a warning message for section
- Continue to next section
- (c)
- Set (i.e., 25 Km/h)
- (d)
- .
- (e)
- Find assistance level such that .
- (f)
- If reduce speed by , i.e., set , and go to step 2.4
- (g)
- Append to A and set
- (h)
- Optionally determine the shift that better suits the desired cadence.
- Return (and optionally the sequence of gear shifts)
2.3. External Services
- the OSMDroid (https://osmdroid.github.io/osmdroid/, last accessed on 18 March 2022) library to implement the map visualization in a fully functional and open source alternative to the one that uses Google Maps as default;
- the OpenTopoData (https://www.opentopodata.org, last accessed on 18 March 2022) API to retrieve altitude information of single geographical points;
- the OSMBonusPack (https://github.com/MKergall/osmbonuspack, last accessed on 18 March 2022) library to implement routing and directions;
- the OpenStreetMap Nominatim (https://nominatim.org, last accessed on 18 March 2022) API to request location information about a geographical positions.
3. Implementation
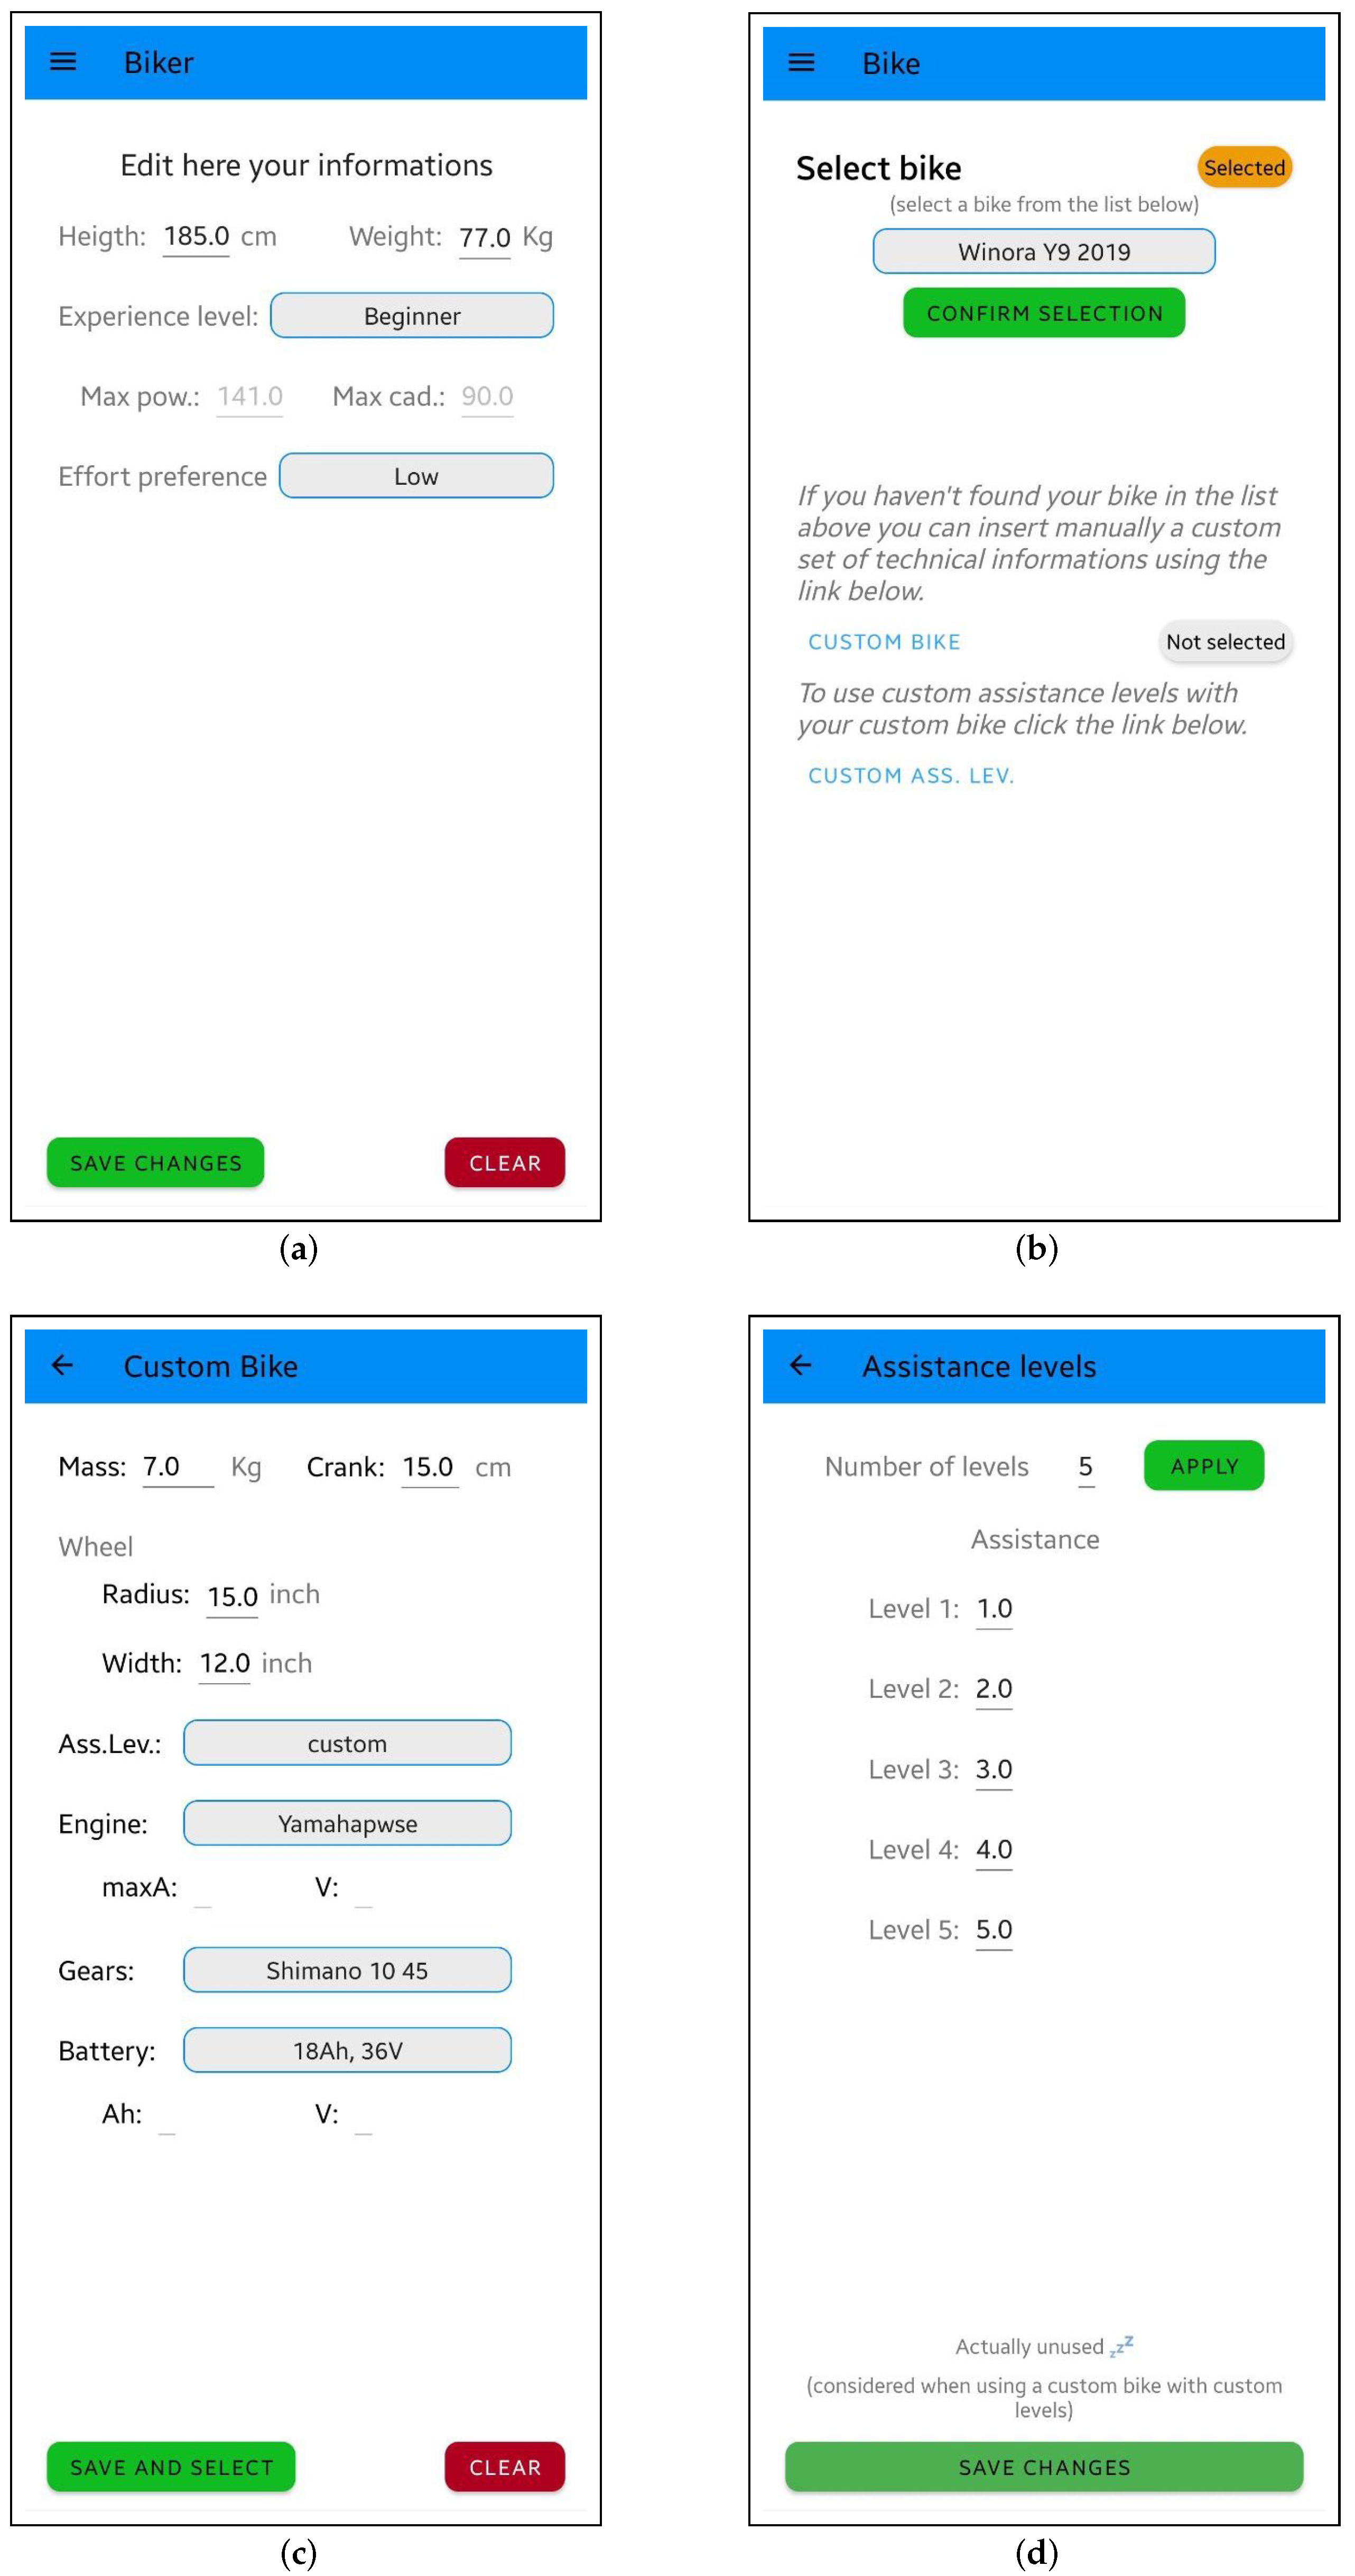
- the mass in kg;
- the length of the pedal in cm;
- the wheel specifying both the radius and the width in inches;
- the mounted motor selected from those available by default or it can be configured by specifying the maximum amperage and voltage;
- the gearbox by selecting the configuration from those available;
- the battery, selected from those available in the system, or configured by specifying amperage and voltage;
- the assistance levels selected from the predefined ones or they can be set in a personalized way in a specific section of the application (Figure 1d).
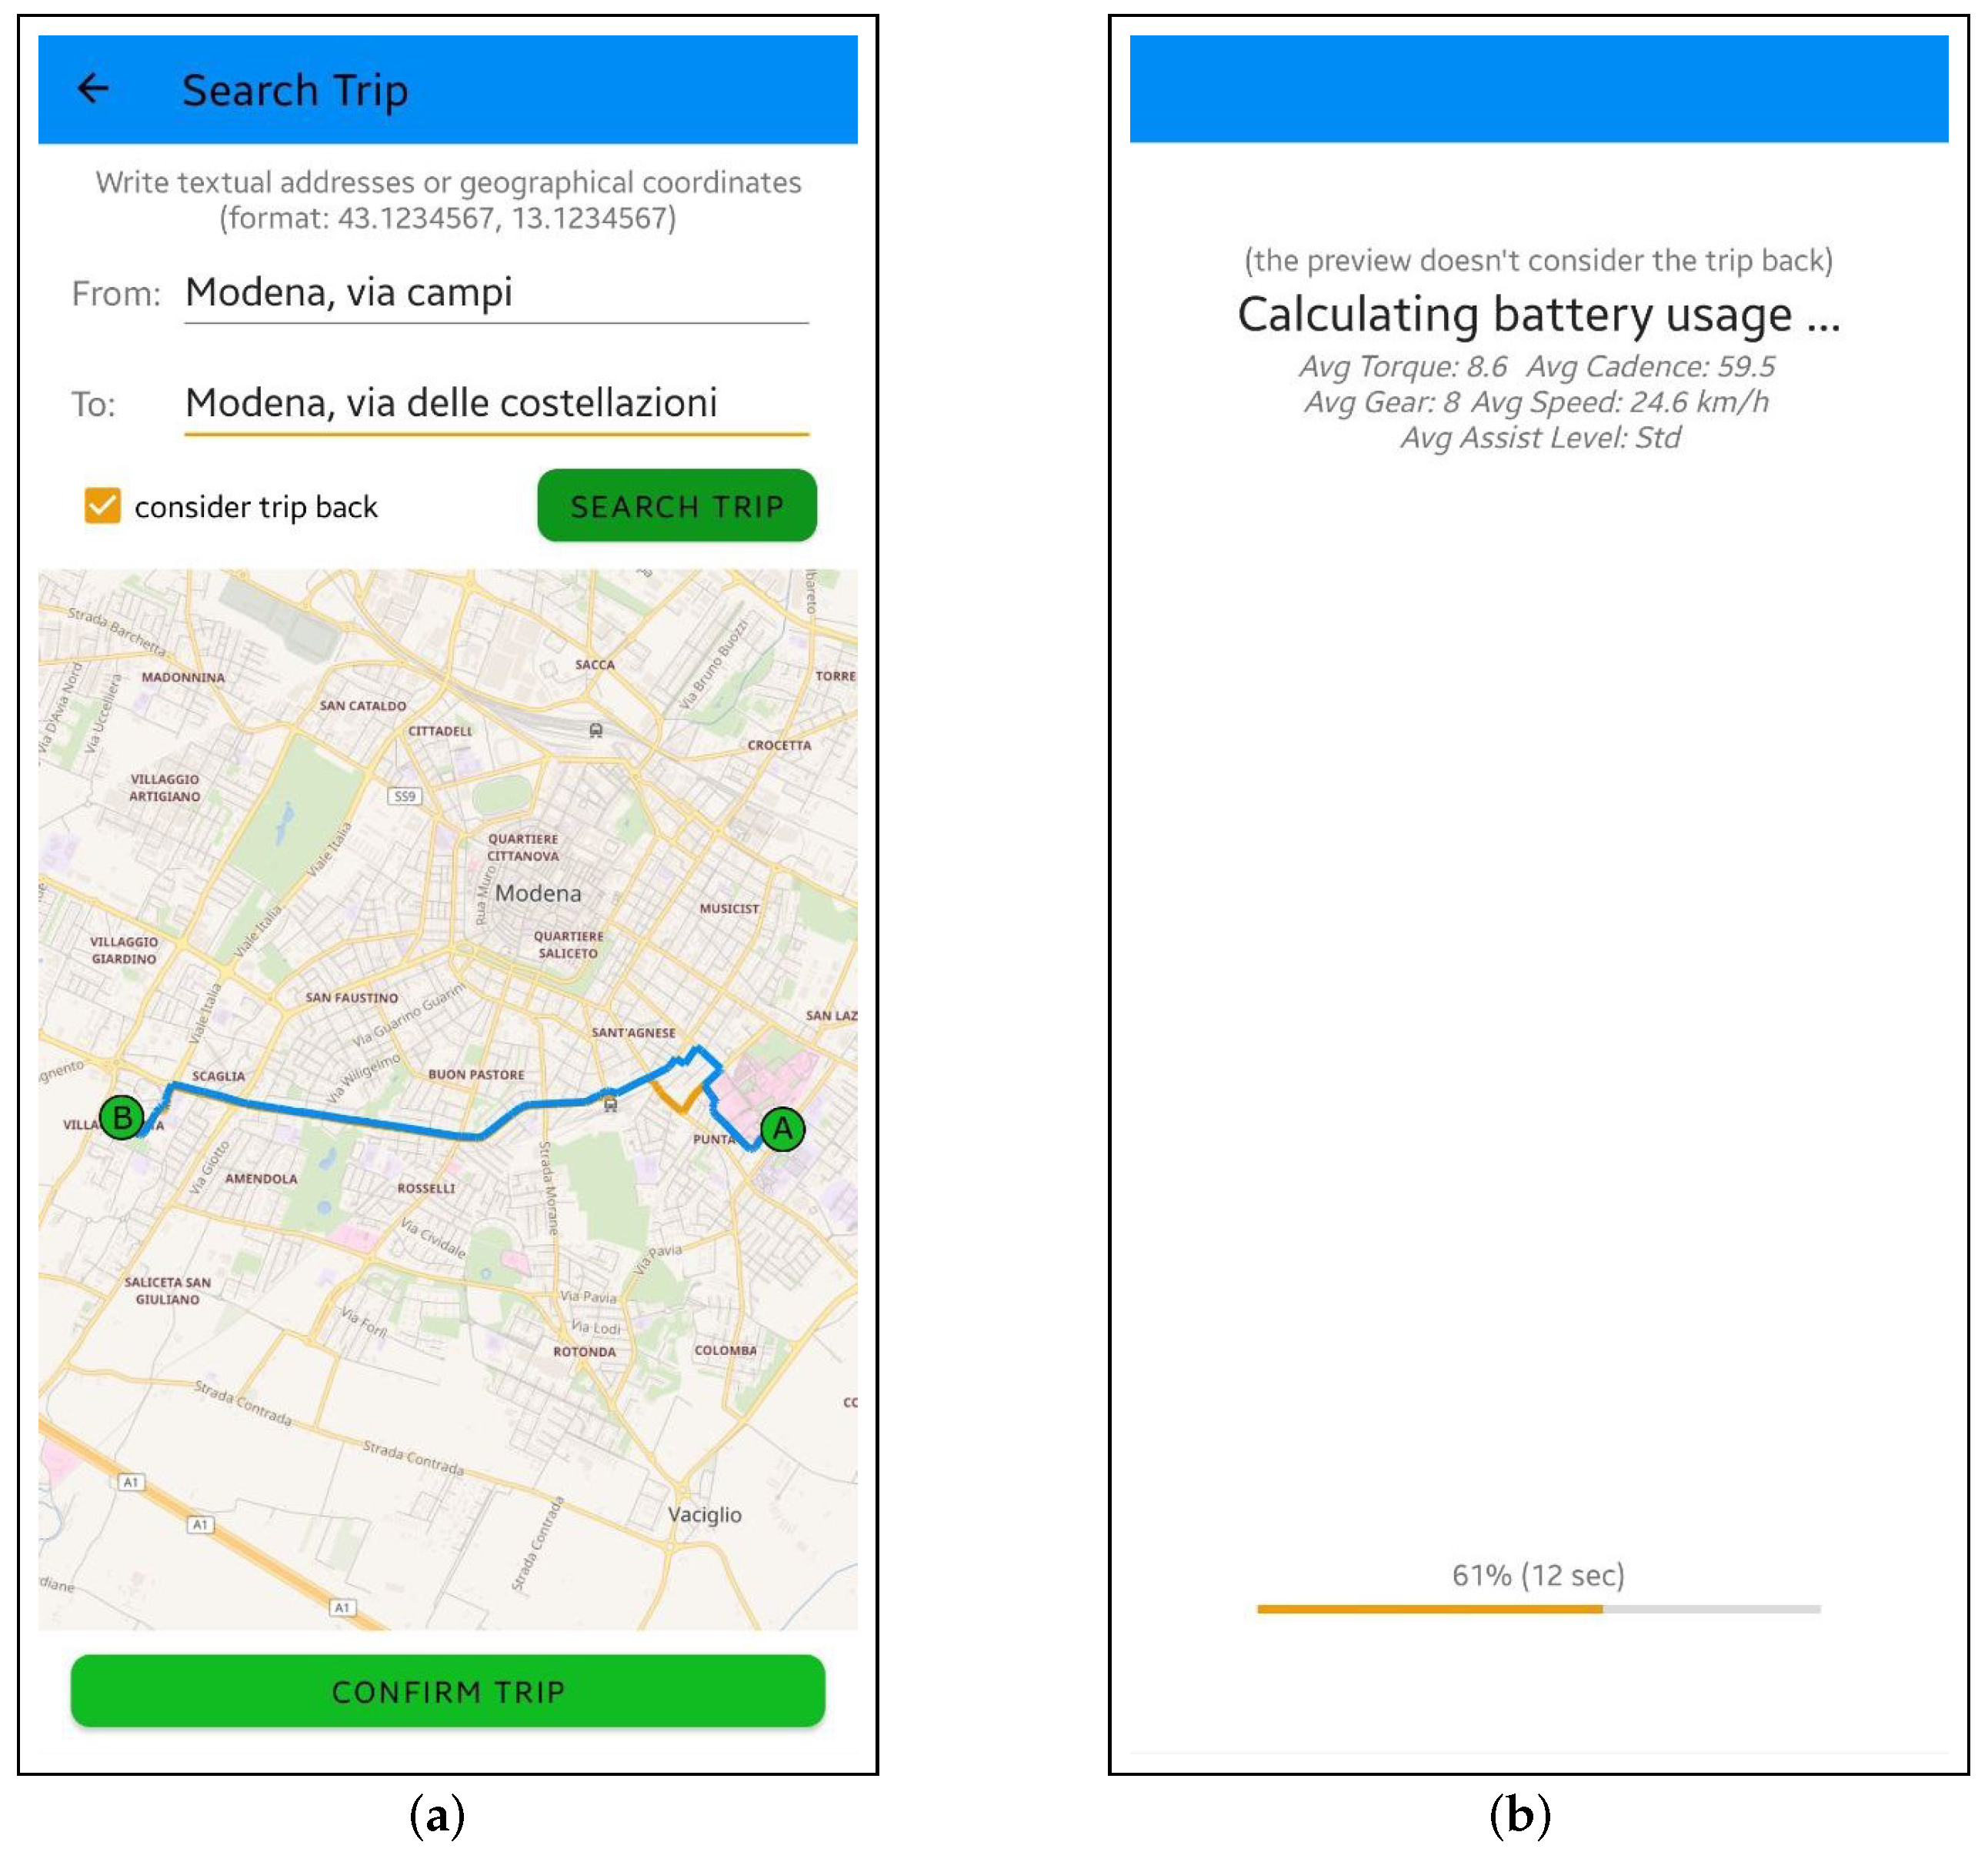
- search for a route, defining a starting point and a destination point for the e-bike ride (in this case it is possible to include the return to the starting point, see Figure 2a);
- search for a circuit, defining a sequence of locations that will represent a polygon to be covered with the e-bike (it is possible to reorder the sequence by holding a location and positioning it where preferred).
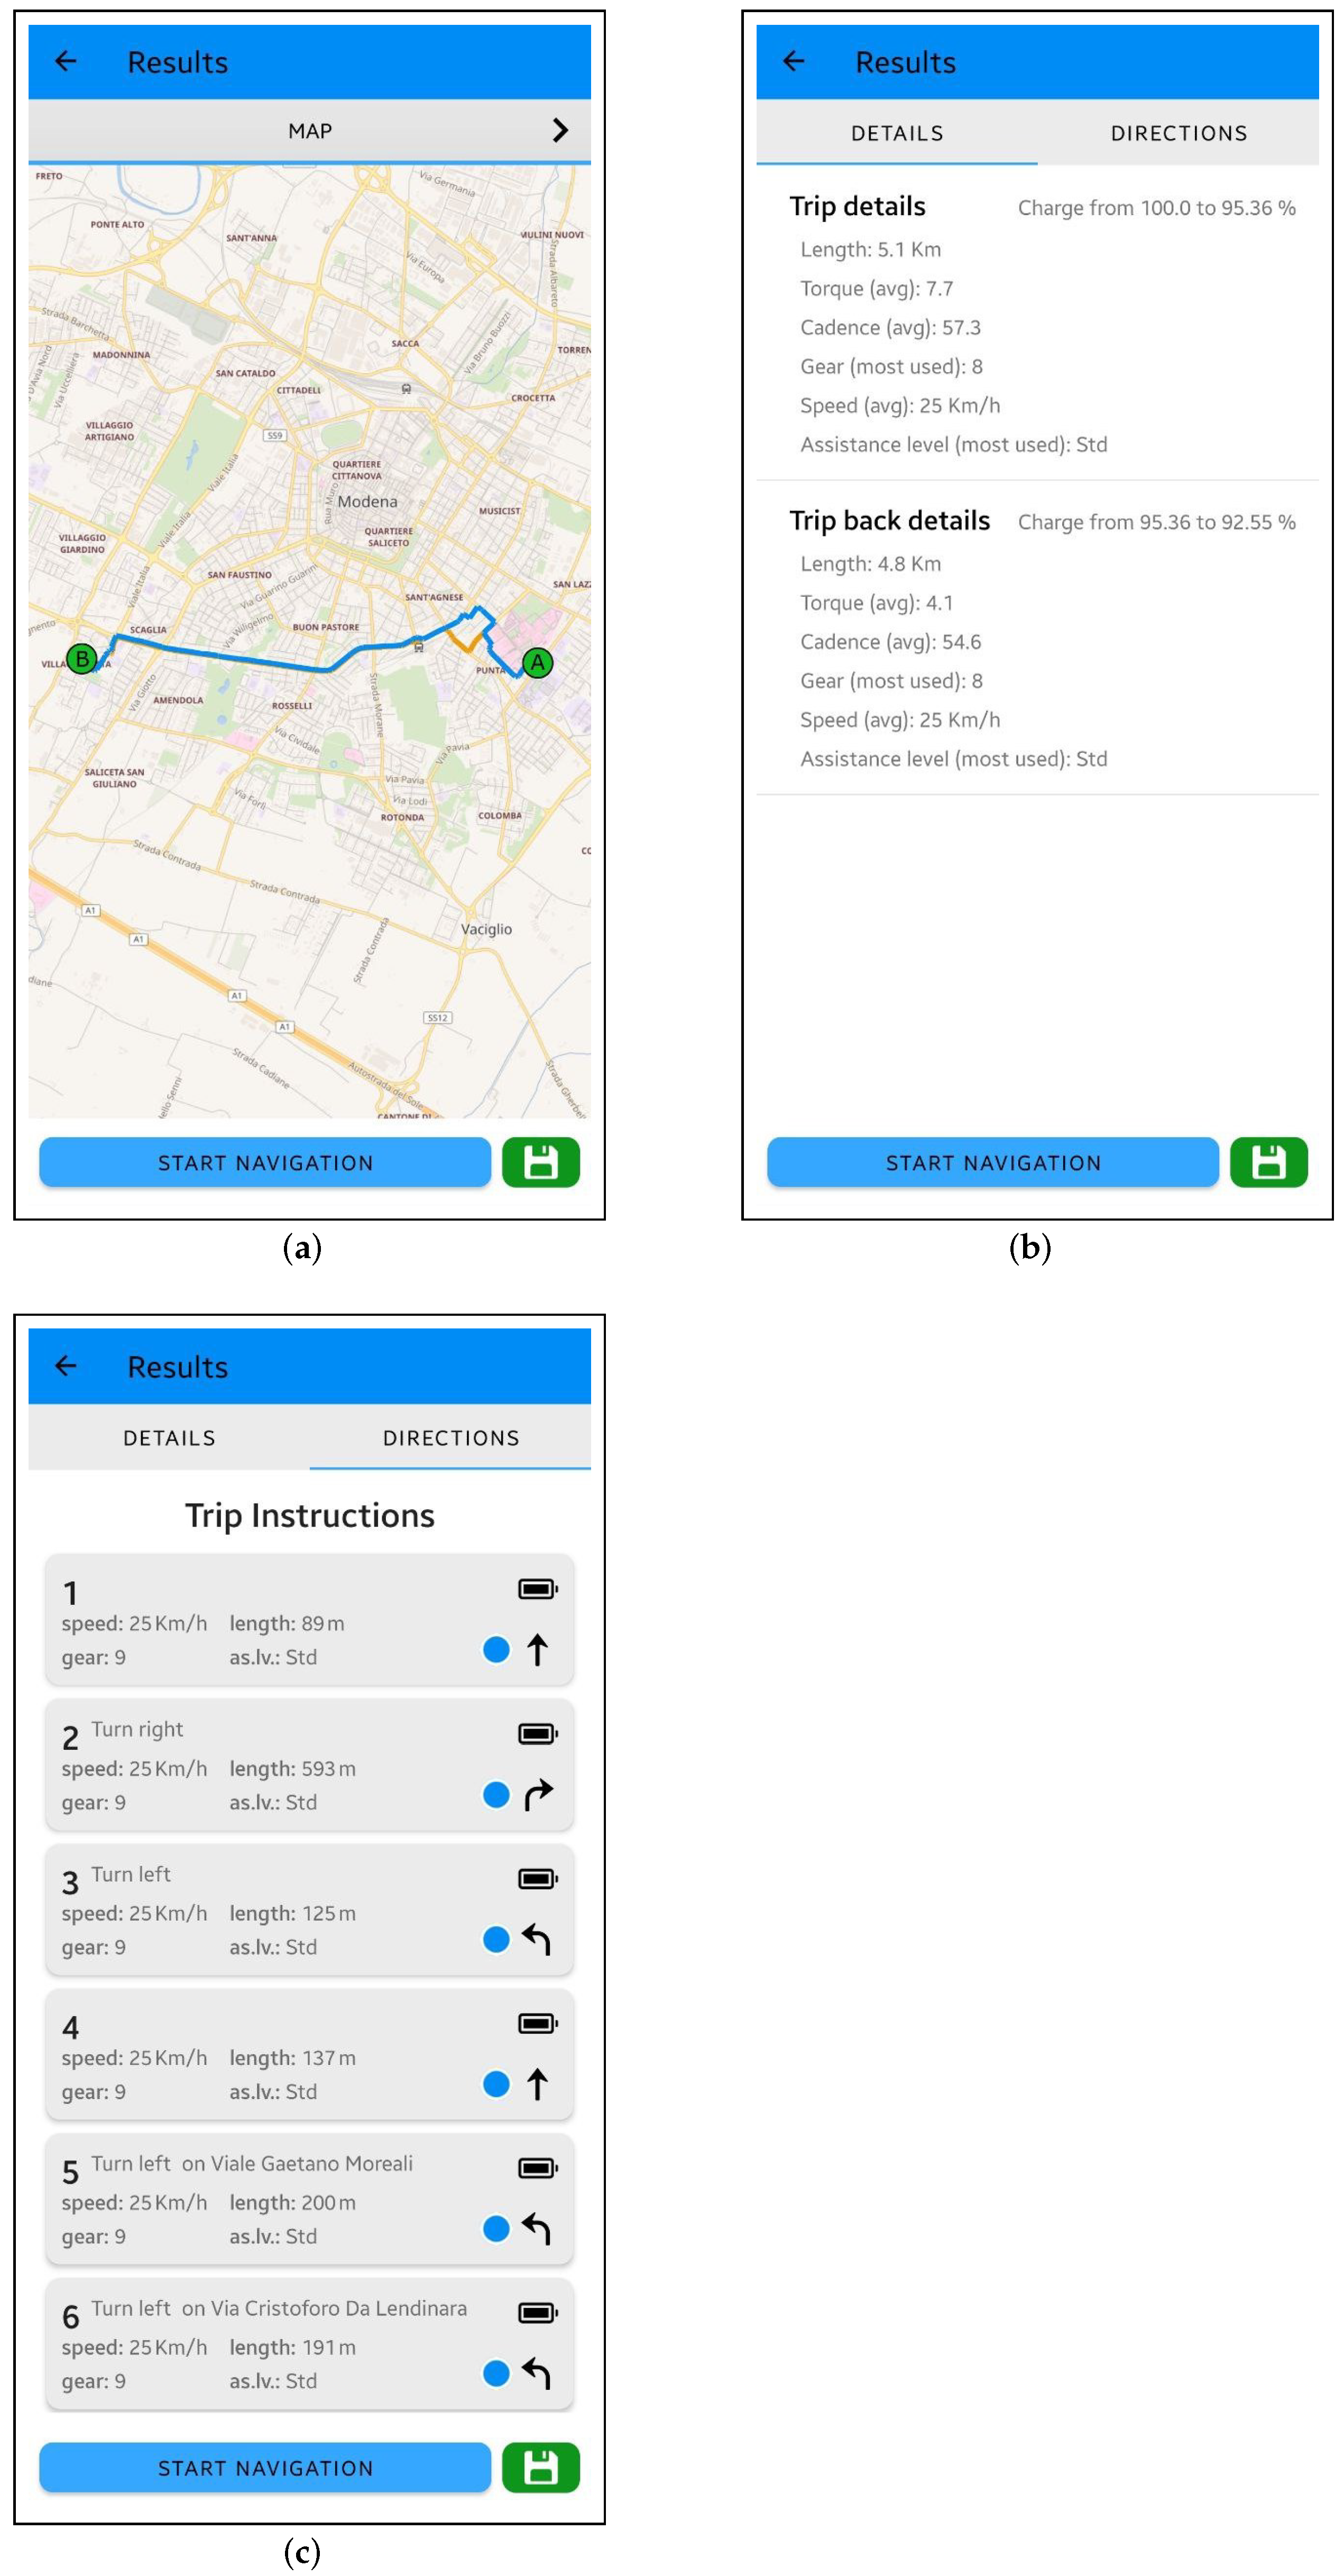
- a map (Figure 3a) that allows the biker to view the points of interest of our route highlighting any problems with the route (sections considered impossible with the current configurations);
- a page that shows the average details of our track (Figure 3b) for both the outward and return journeys respectively (data such as overall length, average torque, average cadence, battery consumption and so on);
- the list of navigation instructions (Figure 3c) to follow with the computed data relating to each section of the route (data such as the length of the section, the recommended gear, the recommended level of assistance and so on).
4. Results
- A Specialized Turbo Vado 5.0 (2020 model), mounting a Specialized 1.3 engine and equipped with a 604 Wh battery. Using the Mission Control App it is possible to tune the three available assistance levels, often termed as Eco, Trail, and Turbo. The default (preset) numerical values for the three levels are 1.3, 2.9, and 3.8, respectively, which we left unchanged for the experiments. The peak (electrical) power of the engine is approximately 560 W while the torque reaches the remarkable maximum of 90 Nm.
- A Pegasus Premio 10 Lite (2021 model), powered by a 4th Gen. Bosch Performance Line CX and a 625 Wh battery. The four assistance levels (Eco, Tour, Sport, and Turbo) adds 0.6, 1.4, 2.4, and 3.4 times the muscle power provided by the biker, respectively. The engine’s peak electrical power amounts to 600 W with 75 Nm max torque.
5. Discussion
Future Work
6. Conclusions
- Goal: our proposal aims at providing a forecast of the battery consumption given a whatever path, while other proposals focus on known paths, for instance to support bike sharing;
- Approach: our proposal relies on a mathematical model without the need of existing data, while others rely on machine learning techniques and data collected in previous tours;
- Scope: our proposal lets the biker choose a whatever path, while others consider the usual path or predefined paths, often only urban paths.
Author Contributions
Funding
Institutional Review Board Statement
Informed Consent Statement
Data Availability Statement
Conflicts of Interest
References
- Machedon-Pisu, M.; Borza, P.N. Are personal electric vehicles sustainable? A hybrid E-bike case study. Sustainability 2020, 12, 32. [Google Scholar] [CrossRef] [Green Version]
- Melliger, M.A.; van Vliet, O.P.; Liimatainen, H. Anxiety vs reality—Sufficiency of battery electric vehicle range in Switzerland and Finland. Transp. Res. Part D Transp. Environ. 2018, 65, 101–115. [Google Scholar] [CrossRef]
- Dedek, J.; Docekal, T.; Ozana, S.; Sikora, T. BEV Remaining Range Estimation Based on Modern Control Theory-Initial Study. IFAC-PapersOnLine 2019, 52, 86–91. [Google Scholar] [CrossRef]
- Ba Hung, N.; Lim, O. The effects of operating conditions and structural parameters on the dynamic, electric consumption and power generation characteristics of an electric assisted bicycle. Appl. Energy 2019, 247, 285–296. [Google Scholar] [CrossRef]
- vdM Steyn, W.J.; Warnich, J. Comparison of tyre rolling resistance for different mountain bike tyre diameters and surface conditions. S. Afr. J. Res. Sport. Phys. Educ. Recreat. 2014, 36, 179–193. [Google Scholar]
- Altoumaimi, R.; Altoumaimi, T.; Upadhya, B.P. Characteristics and Control of the Motor System in E-Bikes. Master’s Thesis, School of Engineering, Blekinge Institute of Technology, Karlskrona, Sweden, 2014. [Google Scholar]
- Gebhard, L.; Golab, L.; Keshav, S.; de Meer, H. Range prediction for electric bicycles. In Proceedings of the e-Energy ’16: Seventh International Conference on Future Energy Systems, Waterloo, ON, Canada, 21–24 June 2016; Association for Computing Machinery: New York, NY, USA, 2016; pp. 224–234. [Google Scholar]
- Yuan, X.; Zhang, C.; Hong, G.; Huang, X.; Li, L. Method for evaluating the real-world driving energy consumptions of electric vehicles. Energy 2017, 141, 1955–1968. [Google Scholar] [CrossRef]
- Zhang, Y.; Wang, W.; Kobayashi, Y.; Shirai, K. Remaining driving range estimation of electric vehicle. In Proceedings of the 2012 IEEE International Electric Vehicle Conference, Greenville, SC, USA, 4–8 March 2012; pp. 1–7. [Google Scholar]
- Bingham, C.; Walsh, C.; Carroll, S. Impact of driving characteristics on electric vehicle energy consumption and range. IET Intell. Transp. Syst. 2012, 6, 29–35. [Google Scholar] [CrossRef]
- Kim, E.; Lee, J.; Shin, K. Real-time prediction of battery power requirements for electric vehicles. In Proceedings of the 2013 ACM/IEEE International Conference on Cyber-Physical Systems (ICCPS), Philadelphia, PA, USA, 8–11 April 2013; pp. 11–20. [Google Scholar]
- Ferreira, J.; Monteiro, V.; Afonso, J.; Afonso, J. Mobile Cockpit System for Enhanced Electric Bicycle Use. IEEE Trans. Ind. Informatics 2015, 11, 1017–1027. [Google Scholar] [CrossRef]
- eBike Range Calculator for Bosch Drive Systems. Available online: https://www.bosch-ebike.com/us/service/range-calculator (accessed on 1 February 2022).
- Chew, K.; Yong, Y.R. Effectiveness comparison of range estimator for battery electric vehicles. In Information Science and Applications (ICISA) 2016; Springer: Berlin/Heidelberg, Germany, 2016; pp. 839–849. [Google Scholar]
- WeBike Project. Available online: https://iss4e.ca/webike-project/ (accessed on 28 January 2022).
- Arango, I.; Lopez, C.; Ceren, A. Improving the Autonomy of a Mid-Drive Motor Electric Bicycle Based on System Efficiency Maps and Its Performance. World Electr. Veh. J. 2021, 12, 59. [Google Scholar] [CrossRef]
- Bertucci, W.; Rogier, S.; Reiser, R. Evaluation of aerodynamic and rolling resistances in mountain-bike field conditions. J. Sport. Sci. 2013, 31, 1606–1613. [Google Scholar] [CrossRef] [PubMed]
- Brutsaert, W. Evaporation into the Atmosphere. Theory, History and Applications; Springer: Dordrecht, The Netherlands, 1982. [Google Scholar]
- Fromm, D.; Opitz, L.; Juri, M.; Côté, O. Final Design Report for Human Powered Vehicle Drivetrain Project. Available online: https://digitalcommons.calpoly.edu/mesp/489 (accessed on 21 January 2022).


| Ref. | BEV | Goal | Approach | Scope |
|---|---|---|---|---|
| [7] | E-bike | Forecast in a given area | Machine learning | Waterloo University area |
| [8] | Car | Real-world driving energy consumptions | Analytical model of power losses + linear regression | General |
| [3] | Car | Better range estimation algorithms | Battery model/Control Theory model | Map data |
| [9] | Car | Reduce anxiety | Remote control with warning messages (state of charge, min-cost route, etc.) | Position based |
| [10] | Car | Impact of driving style on range | Measurements only | Pre-defined short urban-rural road roads |
| [11] | Car | Future power requirement | Physical and history based power model | Downloaded road map |
| [12] | E-bike | Range prediction | Mixed: Bayesian update of deterministic initial estimates | Urban mobility system |
| [13] | E-bike | Off-line forecast | N/A | Biker and road situations |
| Test | Conditions | Forecast | Results |
|---|---|---|---|
| 1 | Low biker effort, flat urban (14 Km) | AL Trial, BC 14% | accurate (RE not greater than 7%) |
| 2 | Moderate biker effort, extra urban (22 Km) | AL Eco, BC 20% | 18% (RE about 10%) |
| Test | Conditions | Forecast | Results |
|---|---|---|---|
| 1 | Mixed urban and suburban (14 Km × 2, tot. 28 Km) | AL Tour, BC 28% | uncertain, probably ≤20% |
Publisher’s Note: MDPI stays neutral with regard to jurisdictional claims in published maps and institutional affiliations. |
© 2022 by the authors. Licensee MDPI, Basel, Switzerland. This article is an open access article distributed under the terms and conditions of the Creative Commons Attribution (CC BY) license (https://creativecommons.org/licenses/by/4.0/).
Share and Cite
Burani, E.; Cabri, G.; Leoncini, M. An Algorithm to Predict E-Bike Power Consumption Based on Planned Routes. Electronics 2022, 11, 1105. https://doi.org/10.3390/electronics11071105
Burani E, Cabri G, Leoncini M. An Algorithm to Predict E-Bike Power Consumption Based on Planned Routes. Electronics. 2022; 11(7):1105. https://doi.org/10.3390/electronics11071105
Chicago/Turabian StyleBurani, Erik, Giacomo Cabri, and Mauro Leoncini. 2022. "An Algorithm to Predict E-Bike Power Consumption Based on Planned Routes" Electronics 11, no. 7: 1105. https://doi.org/10.3390/electronics11071105
APA StyleBurani, E., Cabri, G., & Leoncini, M. (2022). An Algorithm to Predict E-Bike Power Consumption Based on Planned Routes. Electronics, 11(7), 1105. https://doi.org/10.3390/electronics11071105