Article

Testbed Emulator of Satellite-to-Ground FSO Downlink Affected by Atmospheric Seeing Including Scintillations and Clouds

1
Institute of Microwave and Photonic Engineering, Graz University of Technology, 12 Inffeldgasse, 8010 Graz, Austria
2
Department of Information, Electronics and Telecommunications, Sapienza University of Rome, Via Eudossiana 18, 00184 Rome, Italy
*
Author to whom correspondence should be addressed.
Electronics 2022, 11(7), 1102; https://doi.org/10.3390/electronics11071102
Submission received: 7 February 2022 / Revised: 25 March 2022 / Accepted: 25 March 2022 / Published: 31 March 2022

Abstract

:
Free Space Optics (FSO) technology enabling next-generation near-Earth communication is prone to severe propagation losses due to atmospheric-turbulence-induced fading and Mie scattering (clouds). As an alternative to the real-time evaluation of the weather effects over optical signal, a state-of-the-art laboratory testbed for verification of slant APD-based (Avalanche Photodiode) FSO links in laboratory conditions is proposed. In particular, a hardware channel emulator representing an FSO channel by means of fiber-coupled Variable Optical Attenuator (VOA) controlled by driver board and software is utilized. While atmospheric scintillation data are generated based on Radiosonde Observation (RAOB) databases combined with a statistical design approach, cloud attenuation is introduced using Mie theory together with empirical Log-Normal modeling. The estimation of atmospheric-turbulence-induced losses within the emulated optical downlink is done with an FSO IM/DD prototype (Intensity Modulation/Direct Detection) relying on two different data throughputs using a transmitter with external and internal modulation. Moreover, the receiver under-test is a high-speed 10 Gbps APD photodetector with integrated Transimpedance Amplifier (TIA) typically installed in OGSs (Optical Ground Stations) for LEO/GEO satellite communication. The overall testbed performance is addressed by a BER tester and a digital oscilloscope, providing BER graphs and eye diagrams that prove the applied approach for testing APD-TIA in the presence of weather-based disruptions. Furthermore, the testbed benefits from the used beam camera that measures the quality of the generated FSO beam.

1. Introduction

FSO systems act as a game-changing technology within the near- and deep-space communication domain, offering unprecedented reliability and vast intrinsic information capacity for feeder and inter-satellite links. In particular, that is a revolutionary solution to data-throughput bottlenecks in satellite communication (SatCom), where RF systems are overwhelmingly used [1]. Having operated chiefly in C-band, the optical carrier frequency at 1550 nm is 190 THz providing at least a few THz bandwidth. ESA already initiated the race in space by launching a constellation of two GEO satellites (European Data Relay System (EDRS)) equipped with space-borne laser communication terminals manufactured by TESAT that offer 1.8 Gbps data rates [2]. Similarly, the planned NASA’s Laser Communication Relay Demonstration (LCRD) paves the way to next-generation GEO Tracking and Data Relay Satellites (TDRS) that guarantee 10 Gbps user data links and 100 Gbps feeder- and cross-links [3]. While GEO constellations play the role of relay networks, the implemented FSO-based LEO/MEO satellites open the room for a considerable number of broadband services that require low-latency performance [1]. As stated in [3], the planned FSO data throughput for LEO satellites is expected to reach 200 Gbps in the foreseen future.
Nevertheless, FSO technology enabling secure and extremely high data rate communication triggers a need for excessive testing and characterization of the atmospheric propagation channel. Both commercially produced scintillometers and systems based on delayed tilt anisoplanatism technology are applied for measuring atmospheric-turbulence-induced fading, used for FSO operation range between 1 km and 13.5 km [4]. Moreover, sonic anemometer–thermometer data are used in [4] to observe the wind speed and temperature changes and their influence over near-surface atmospheric turbulence within the boundary layer. Although those technologies offer decent results, they are mainly used for horizontal links. A piece of novel key equipment presented in [5] that is under extensive testing implements technology utilizing laser guide star systems installed in most observatories. While it is still in an early development phase, it is claimed that backscatter-effect-based technology applying Rayleigh beaconing and collecting telescope offers a reliable evaluation of slant atmospheric turbulence profiles. In contrast to this intricate but highly productive method, a state-of-the-art concept for a compact device implementing an interferometric refractive index sensor is given in [6]. This interferometric approach widely used in the field of meteorology science offers a solution for figuring out the fringe frequency (i.e., atmospheric refractive index) that is easy for use in an outdoor environment, and once installed in an unmanned aircraft system, a vertical atmospheric turbulence profile can be built. In parallel with those initiatives involving tremendous resources, a vertical profile of refractive index structure parameter used for investigation of clear-air scintillations in terms of space-to-ground downlinks is well approximated based on Radiosonde Observation (RAOB) data [7,8]. Apart from the listed measurement methods, the most promising technology for the mitigation of atmospheric turbulence is adaptive optics systems. In order to compensate for the phase distortion, the reconstruction process is based on a deformable mirror controlled by a wave-front sensor. While the use of Shack–Hartmann wave sensor prevails within the last decade, its bandwidth limitations and saturation losses lead to the development of other early-stage technologies such as modal holographic wave-front sensors based on the Karhunen–Loève modes [9]. In addition, digital adaptive optics for turbulence mitigation is also considered [10].
Apart from atmospheric scintillations, the minimum amount of FSO power penalties in the presence of most cloud types (Mie scattering) is higher than 30 dB, which is unbearable in terms of optical SatCom links [11]. In comparison to turbulence fading, the key solution for cloud mitigation is building an OGS network with sites that are featured with maximum Cloud-Free Line-Of-Sight (CFLOS) probability. Considering Earth’s weather system, the selected sites should be situated at least several hundred kilometers from each other, ensuring enough low correlation levels between them. Based on satellite images, various studies were performed by ESA and NASA [12]. Since each selected site is subject to limited CFLOS availability, a European network, including 12 different OGSs and reaching outage probability of 10−3 is assessed in [13]. Nevertheless, the accomplished JPL (NASA) work in [14] offers 96% availability based only on four selected OGS sites, namely Oldstone, CA; Kitt Peak, AZ; McDonald Observatory, TX and Mama Kea, Hawaii.
In order to not only measure the atmospheric influences by themselves but also to prove the operation of FSO SatCom systems, few ground-space bidirectional links (e.g., Teide Observatory—ARTEMIS GEO satellite FSO link) offer an actual evaluation of atmospheric turbulence and cloud effects over transmitted optical beam have been established [15]. While those initiatives provide the whole picture by means of testing real FSO systems, this is a costly procedure, and actual measured data are only available for a very limited number of locations. Moreover, those measurement campaigns do not offer any room for improvements in regard to the already installed space-borne equipment. Along with available FSO commercial off-the-shelf (COTS) components, several state-of-the-art space-qualified solutions are developed with a high focus on photodetectors, including APD with integrated TIA offering superior data throughputs and sensitivity [16]. Furthermore, various modulation techniques, including mostly OOK or DPSK, are implemented [17]. Consequently, a few laboratory prototypes evaluating space-borne FSO transceivers consisting of communication subsystems with photodetectors, optical laser sources, etc., as well as fine and coarse pointing assemblies, have been considered within the last years [18]. Nevertheless, most laboratory tests do not cover the influence of atmospheric impairments consisting of turbulence-induced fading and Mie scattering attenuation (i.e., clouds), which is essential for systems/components evaluation in real-life conditions [8].
Since the above technology concepts are still in an early development stage and still a facilitated unexpansive test method is required, a high-end breadboard for verification of SatCom FSO links is suggested in this work. One of the very first prototypes for verification of high-demanding SNSPD-based (Superconducting Nanowire Single-Photon Detector) deep-space FSO channels, described in [19,20], allows verification of other scenarios, including terrestrial and near-space links. Its operation is hereby translated to a platform for evaluating near-Earth SatCom links implementing 10 Gbps APD-TIA photodetectors (PD) installed in future OGSs for LEO/GEO data transmission [21]. Having offered capabilities for testing COTS components as well as technologies, the testbed implements a state-of-the-art fiber-based hardware FSO channel emulator representing atmospheric turbulences using RAOBs [7,8].
The remainder of the paper is organized as follows: Section 2 introduces the design and the operation of the developed FSO channel emulator that represents atmospheric-based disruptions of the transmitted optical beam. In Section 3, a methodology for the generation and evaluation of atmospheric turbulence and cloud attenuation data is provided. The simulations of the RAOB-based scintillations are hereby explained in detail. The performance of the proposed high-end APD-TIA photodetector under test is evaluated in Section 4 at maximum data throughput using a facilitated prototype with Mach-Zehnder modulator (MZM). In Section 5, the full-scale evaluation of the built SatCom prototype in the presence of atmospheric turbulence is presented based on the number of high-quality measurement results. Finally, Section 6 provides conclusions.

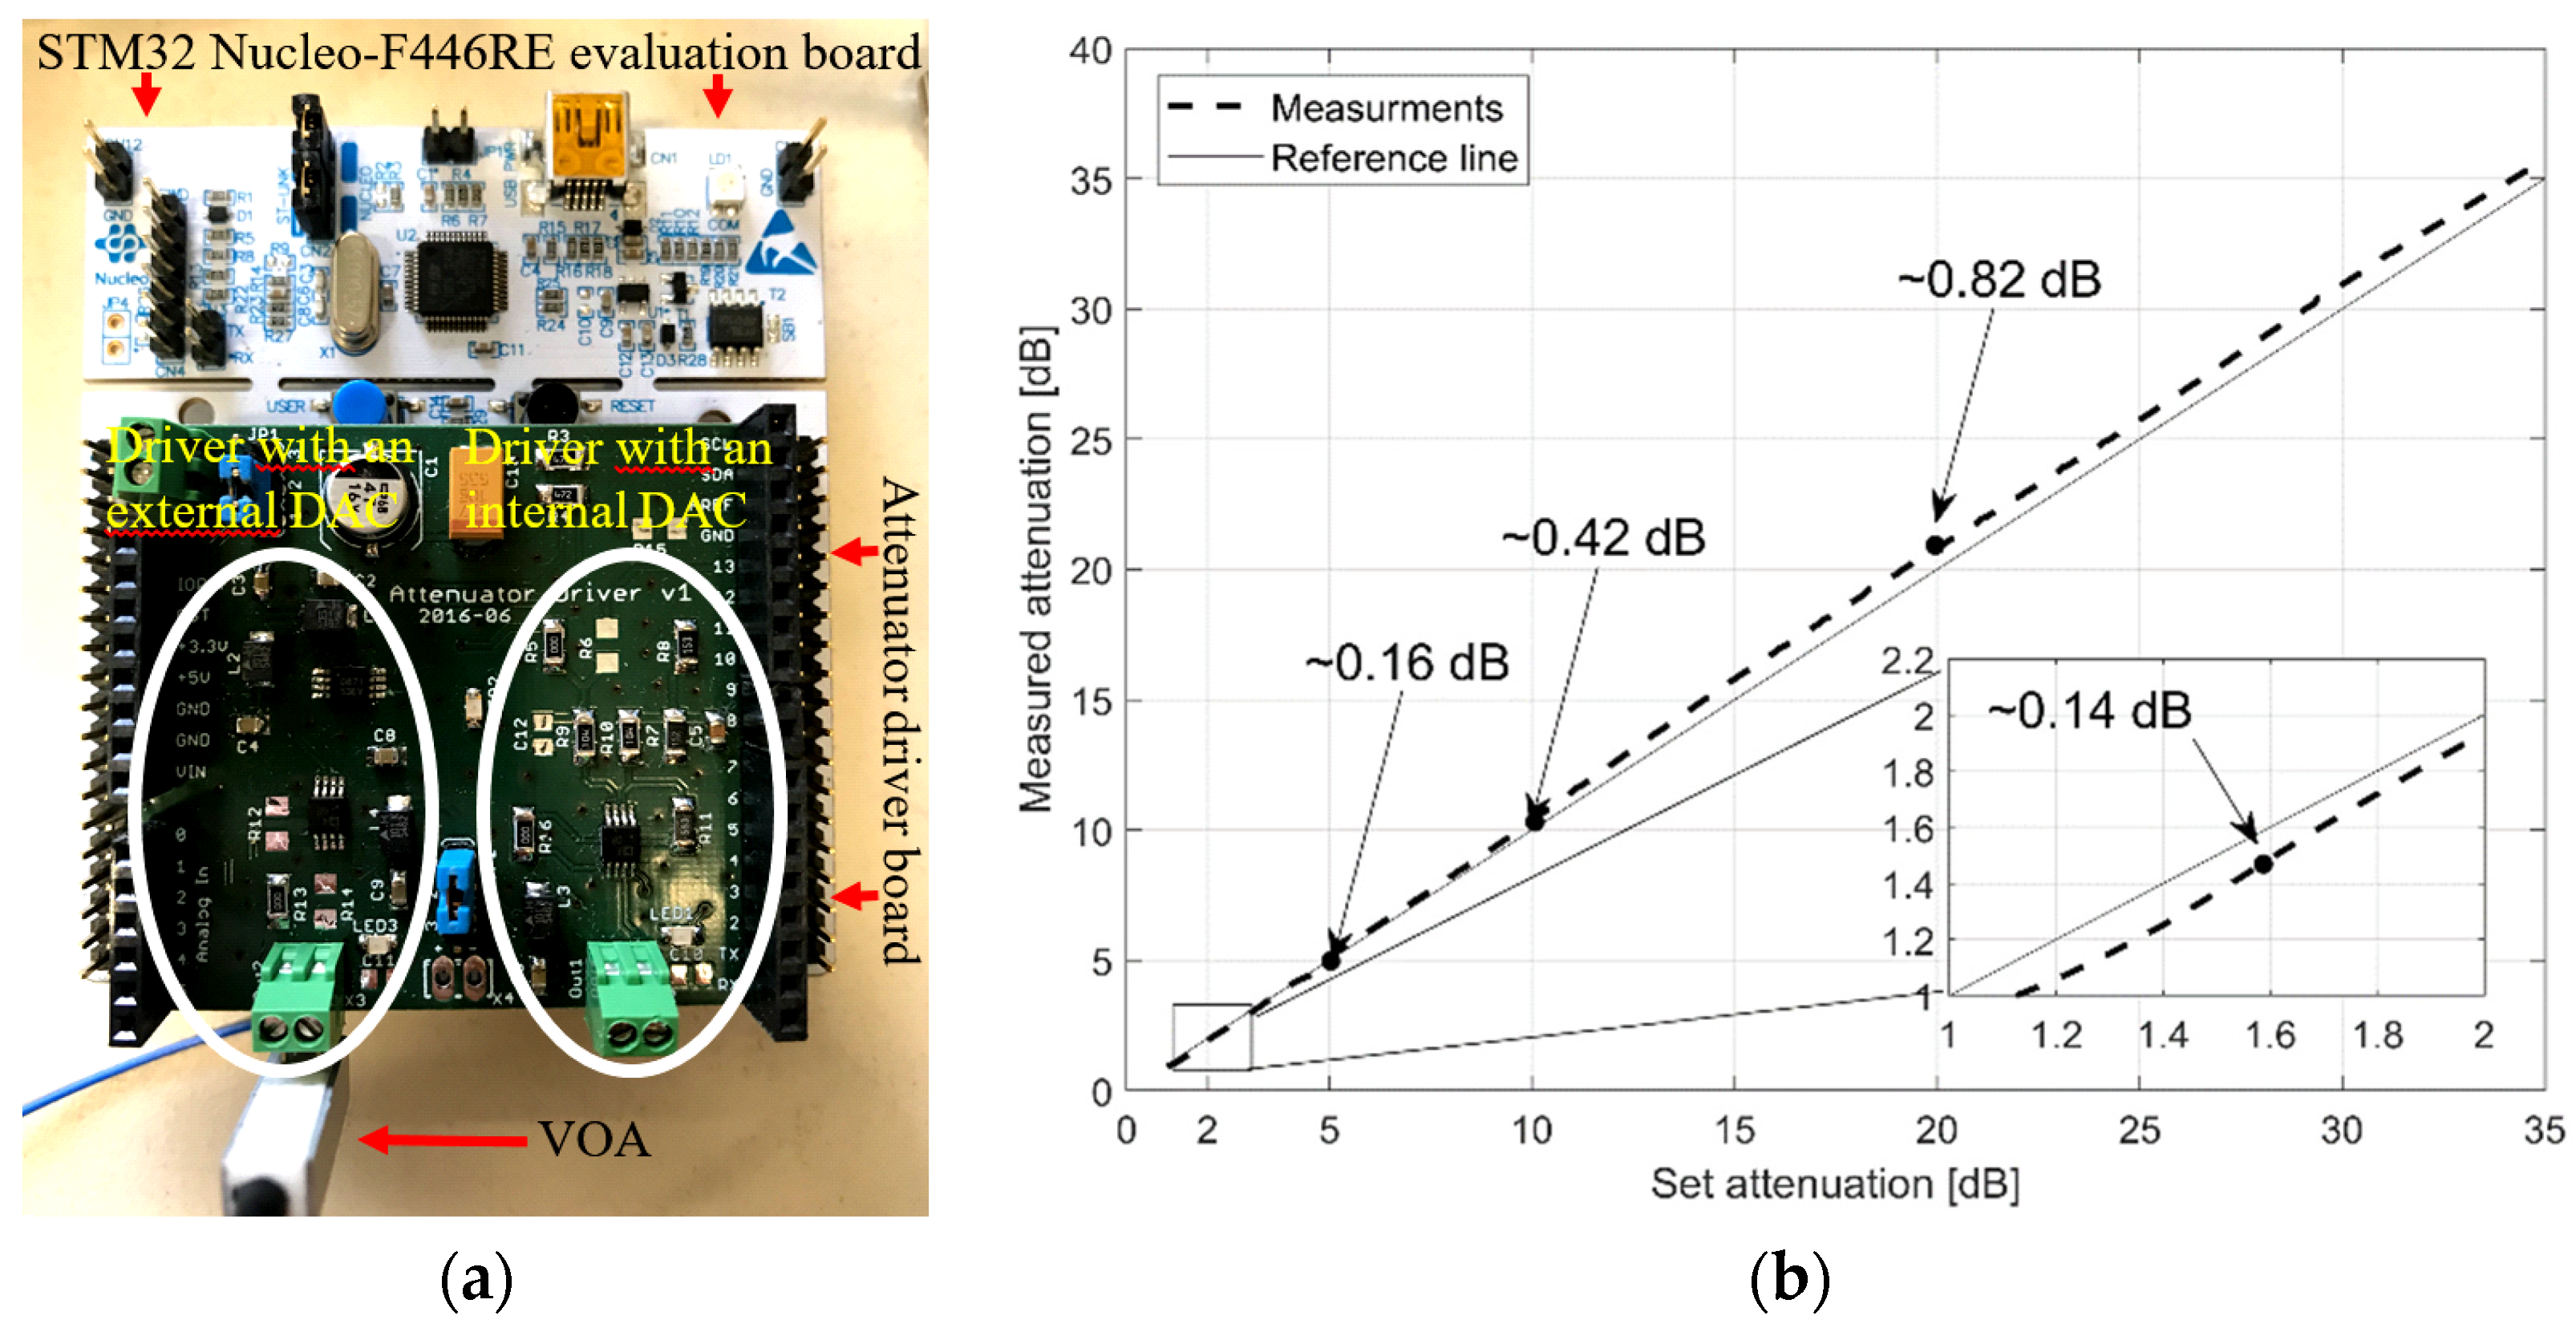
2. FSO Channel Emulator Representing the Impact of Atmospheric Impairments

In order to emulate the wave-front distortions of an optical beam due to atmospheric fading, an experimental setup that consists of a hardware channel emulator and atmospheric turbulence and/or cloud data acquired based on simulations is utilized. In particular, turbulence fluctuations and/or cloud attenuation causing phase and irradiance random changes can be evaluated based on their influence over the collected instantaneous FSO power valid for IM/DD scheme [11,22]. Consequently, the channel emulator is limited to a near-space FSO system having a direct detection technique combined with OOK or DPSK modulation, while the rarely used coherent detection scheme is not considered [17]. In some cases, the coherent detection systems are vulnerable to synchronization issues between the Local Oscillator and incoming signal caused by turbulence-induced phase fluctuations. Even though those disruptions due to synchronization are often internally compensated, they should be addressed by applying an additional MZM in the design.
The developed hardware FSO fading emulator built with COTS components is given in Figure 1 (i.e., Figure 1a) while its controlled software is provided in Figure 2. Its performance aims to represent the broad spectrum of Mie scattering and atmospherics turbulence scenarios that are featured with 0.1 Hz–1 kHz fading bandwidth and optical attenuation less than 10 dB. In particular, the real dynamic changes of the received FSO optical power are translated here into a laboratory environment leveraging MEMs-based VOA at 1550 nm wavelength with SMF–28 (Single Mode Fiber) having MFD = 10.4 μm. On the one hand, the transmitted fundamental transverse mode TEM00 (Gaussian optical beam) in a typical FSO communication scenario is launched into an SMF with 80% efficiency supported as a linearly polarized LP01 mode. On the other hand, the FSO architectures for near- and deep-space communication are especially based on SMF optical components that provide exceptional performance. Furthermore, the obtained VOA operates within 0–60 [dB] dynamic attenuation range and has 0–1 kHz fading bandwidth (response time up 1 ms), covering a broad scope of atmospherically induced fading.
Moreover, the implemented attenuator driver is utilized together with an STM32 Nucleo-F446RE evaluation board, providing a broad spectrum of capabilities. It incorporates an STM32F4 microcontroller ARM Cortex M4 series, powered by 3.3 V. Furthermore, the attenuator driver board implements external DAC, namely Texas Instruments DAC8571 characterized by 16-bit resolution, 10 μs settling time, and ±4 mV accuracy. Since the VOA has a low input impedance of 100 Ohm, a higher amount of output DAC8571 DAC power is achieved using an AD8532ARM operation amplifier that plays the role of an impedance transformer. In order to evaluate the performance of the built hardware, set attenuation versus induced optical attenuation into an optical fiber is measured and compared with a reference line that represents the ideal case. The results in Figure 1b offer <0.16 dB attenuation accuracy within the most used 0–5 dB optical attenuation range in terms of turbulence fading.
Furthermore, the control is performed with the developed GUI shown in Figure 2. While the software offers a number of settings, the most important are fading frequency (response time) and an option for loading a lookup table with attenuation values. In addition, manually setting an attenuation value is also possible.
The used special SPIRICON PYROCAM III beam camera provides self-measured proof of the propagated LP01 mode in vertical (Figure 3a) and horizontal (Figure 3b) planes, representing real FSO links.

3. Simulations of Atmospheric-Based Disruption Including Turbulence and Clouds

Together with the hardware representation of the atmospheric FSO channel, both atmospheric turbulence- and cloud-induced attenuation are simulated to be evaluated and provided the required test data for optical losses. Having their combined influence based on a joint probability density function (PDF), the full characterization of the FSO channel is considered.

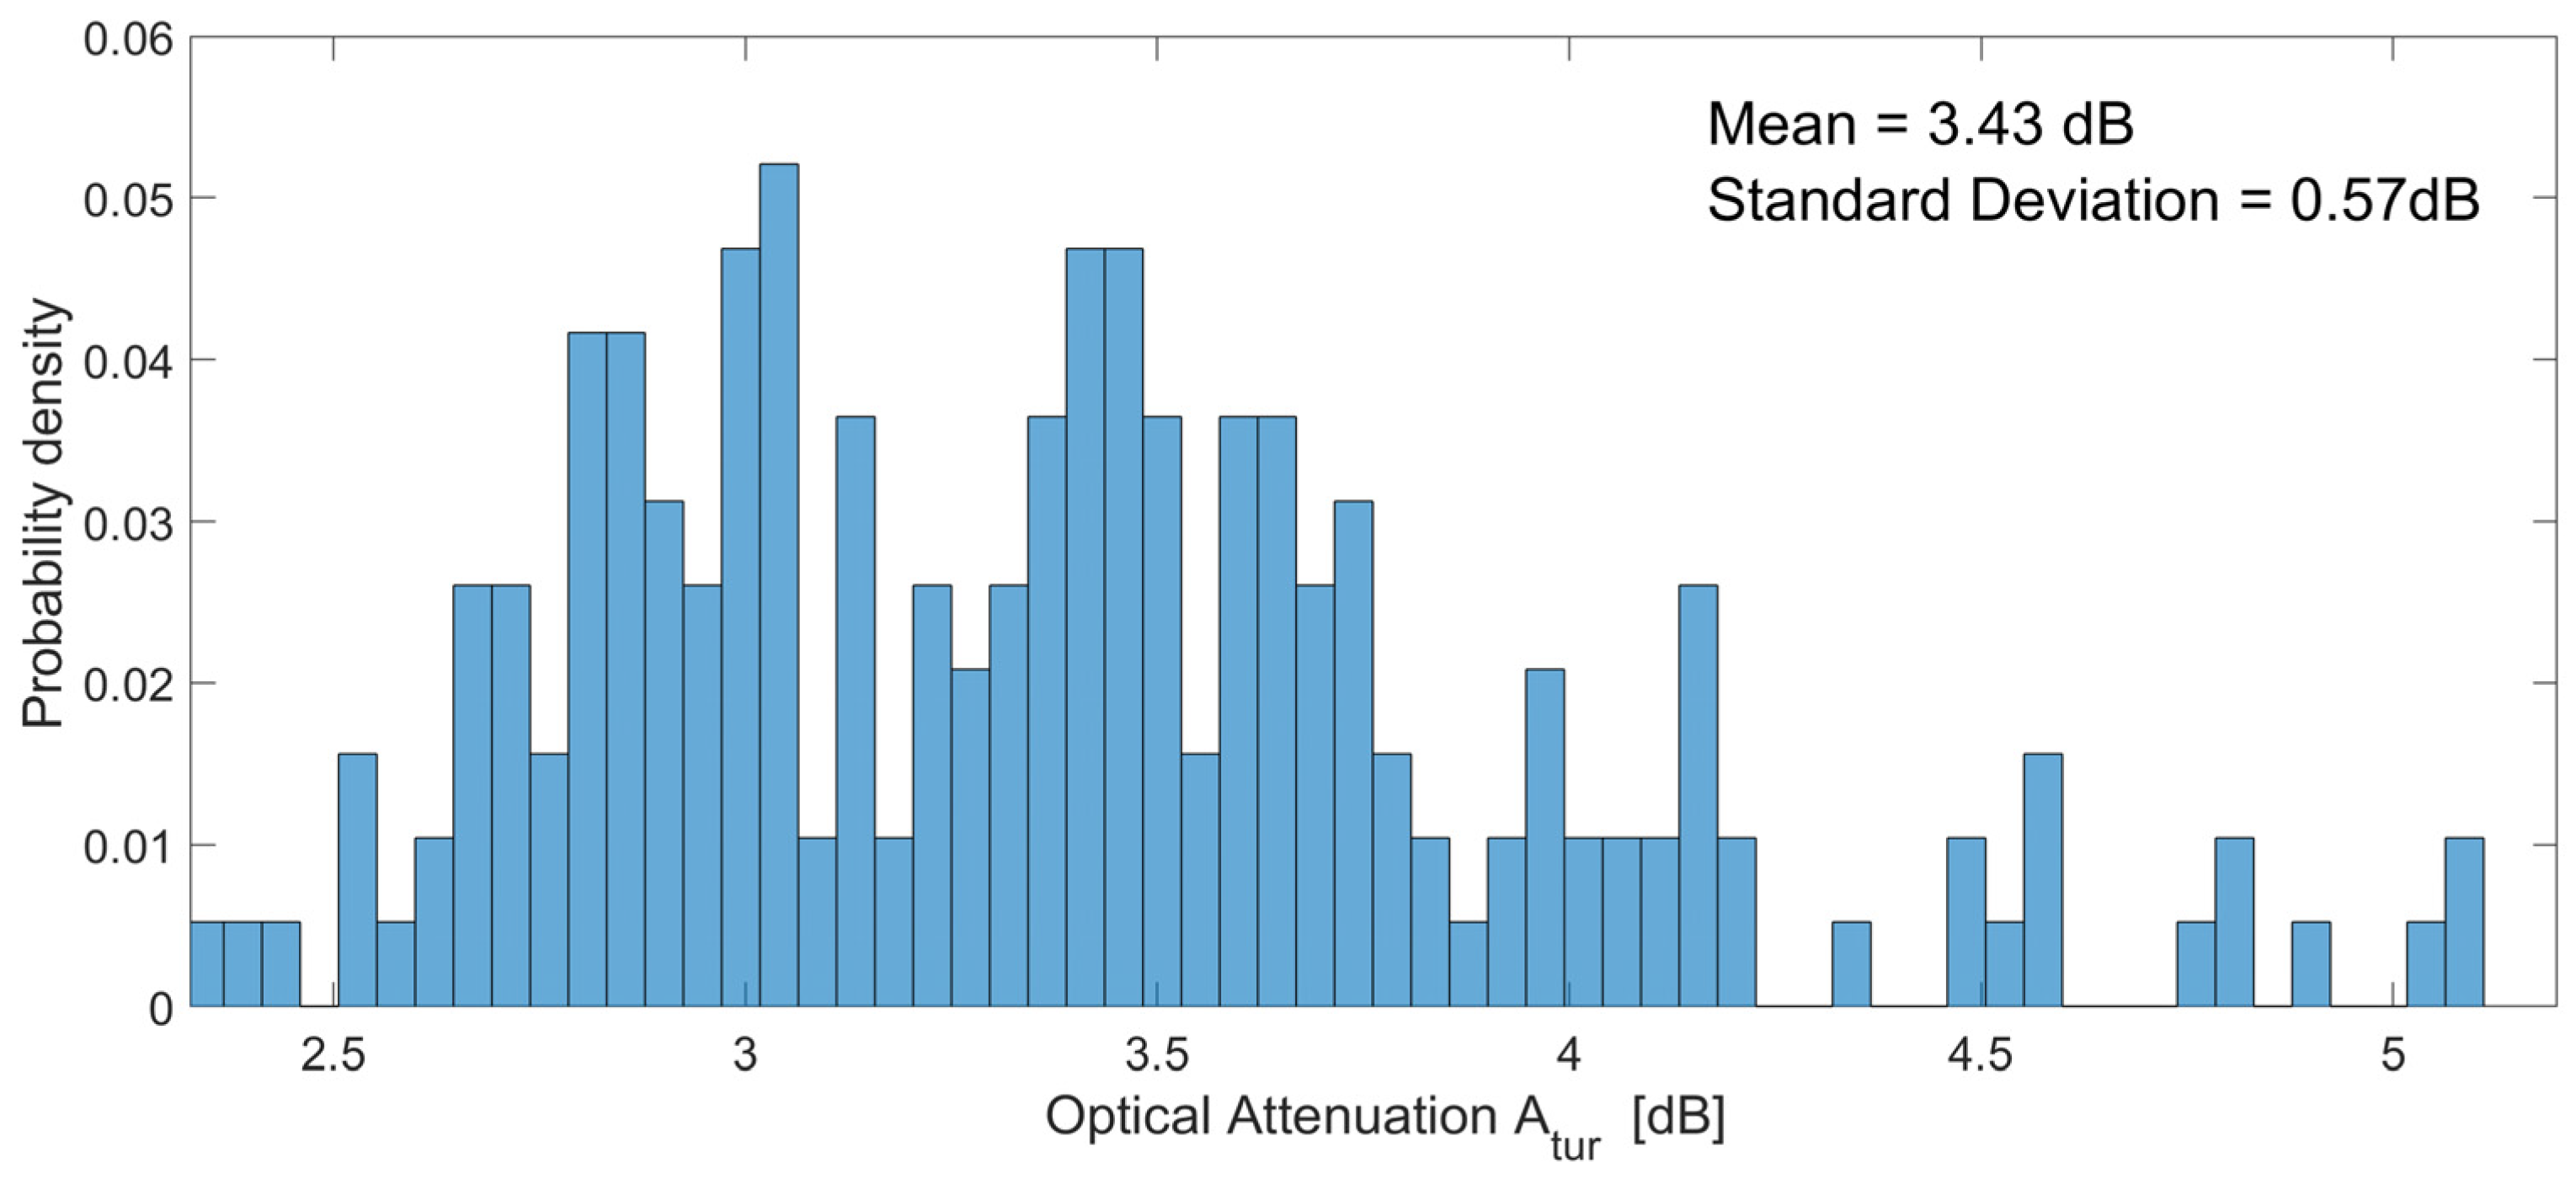
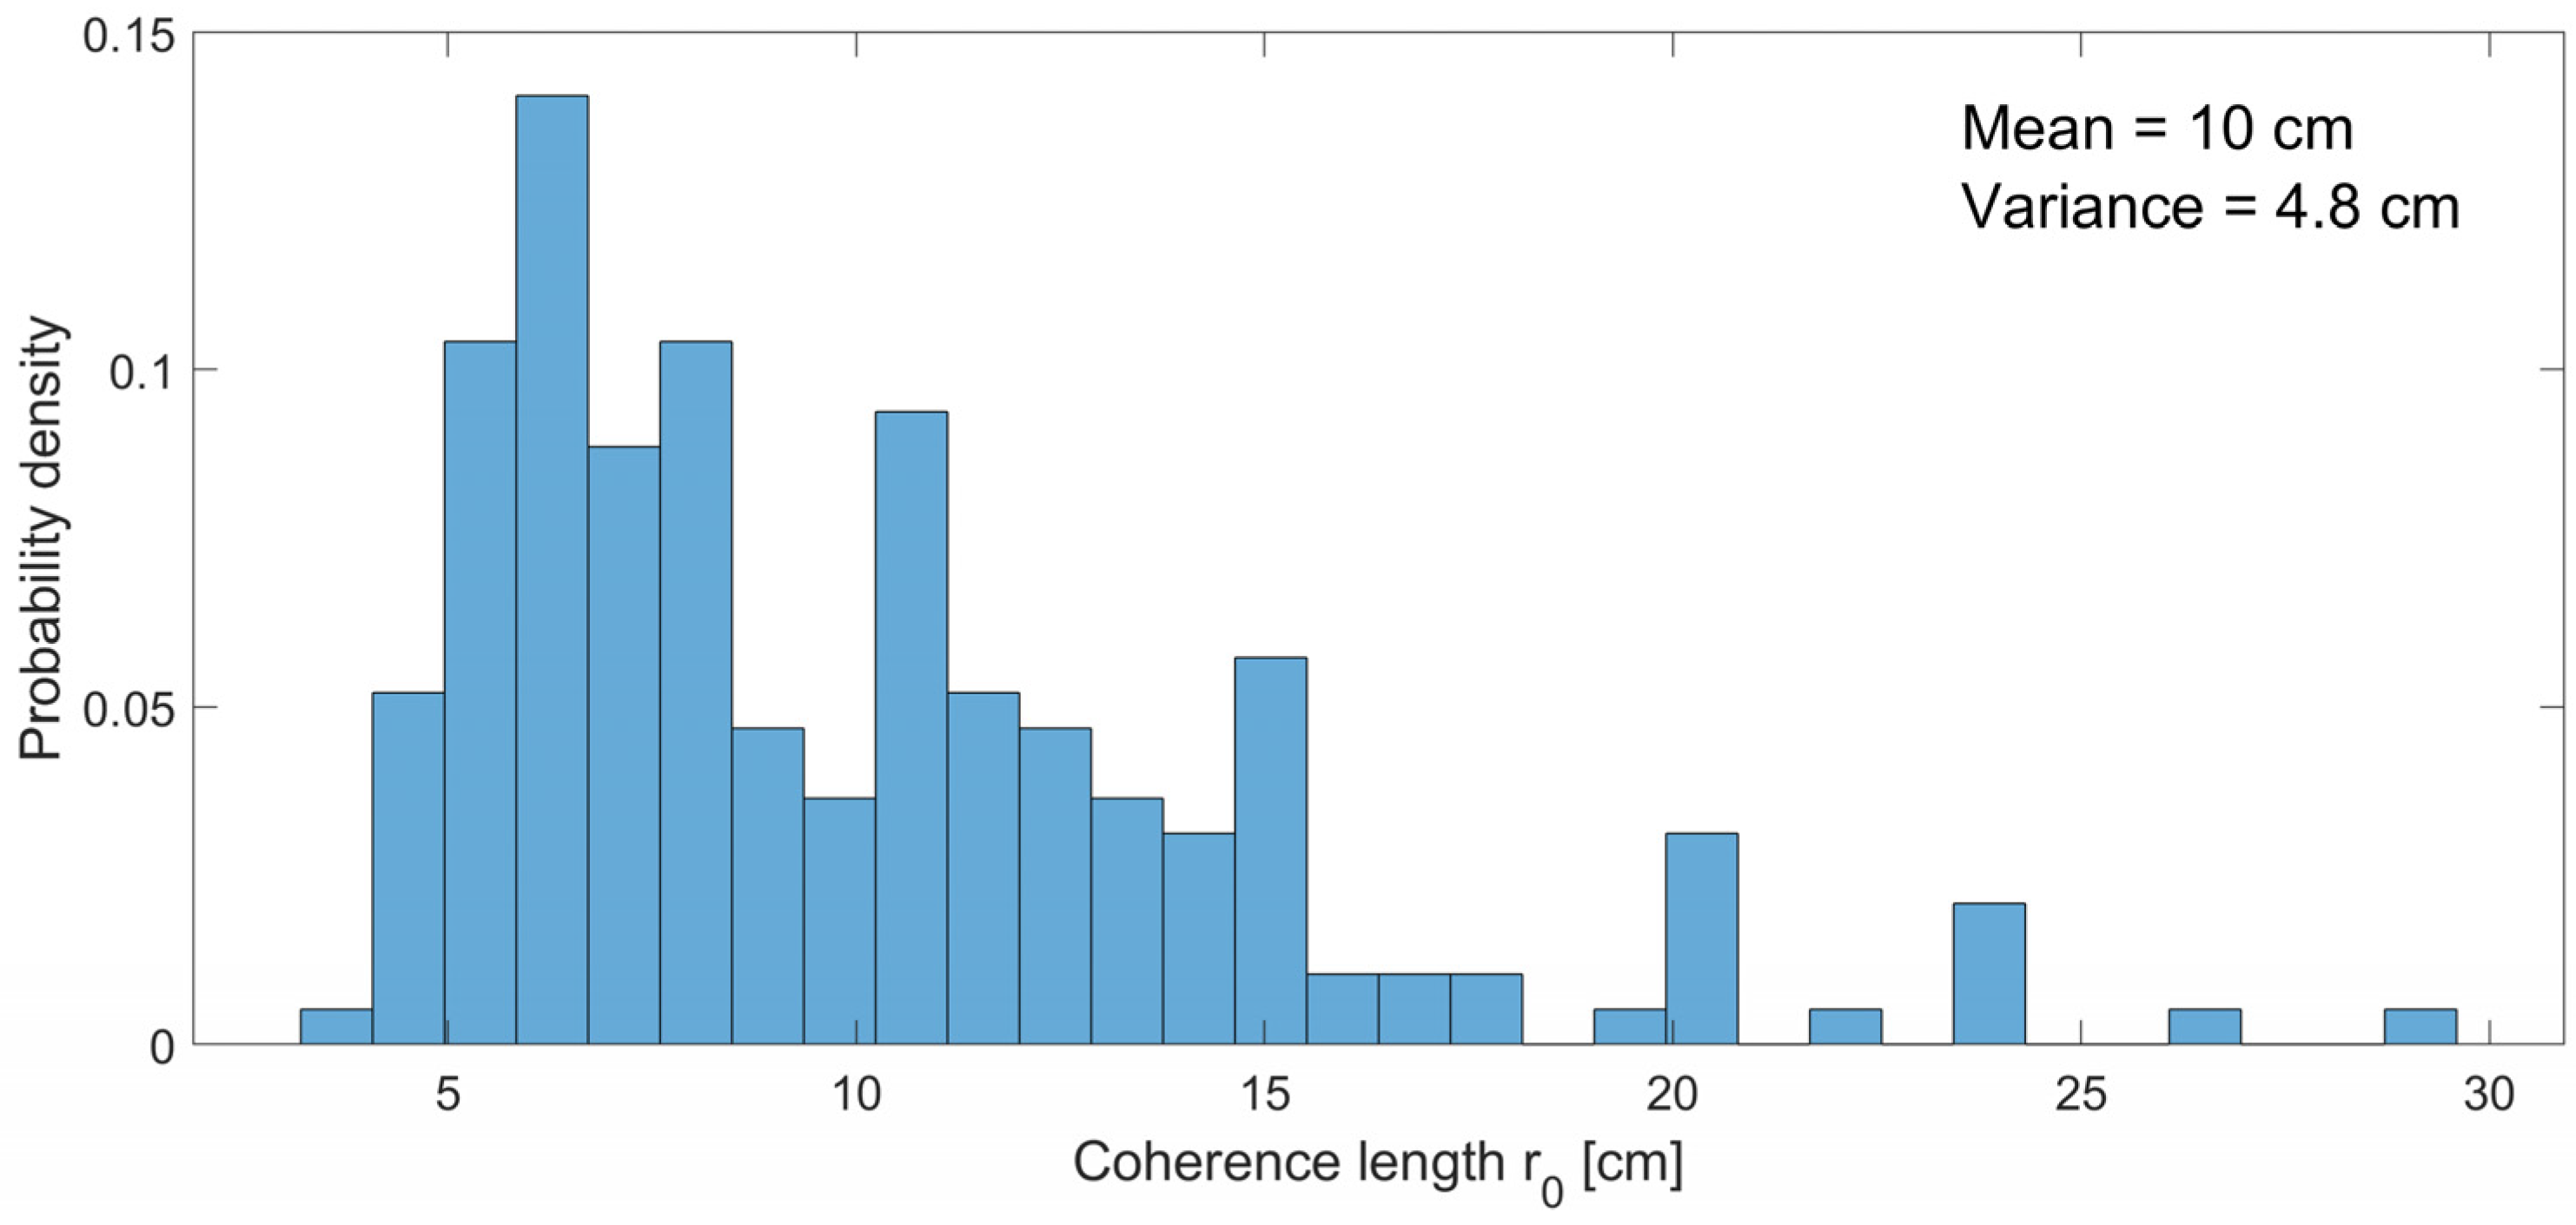
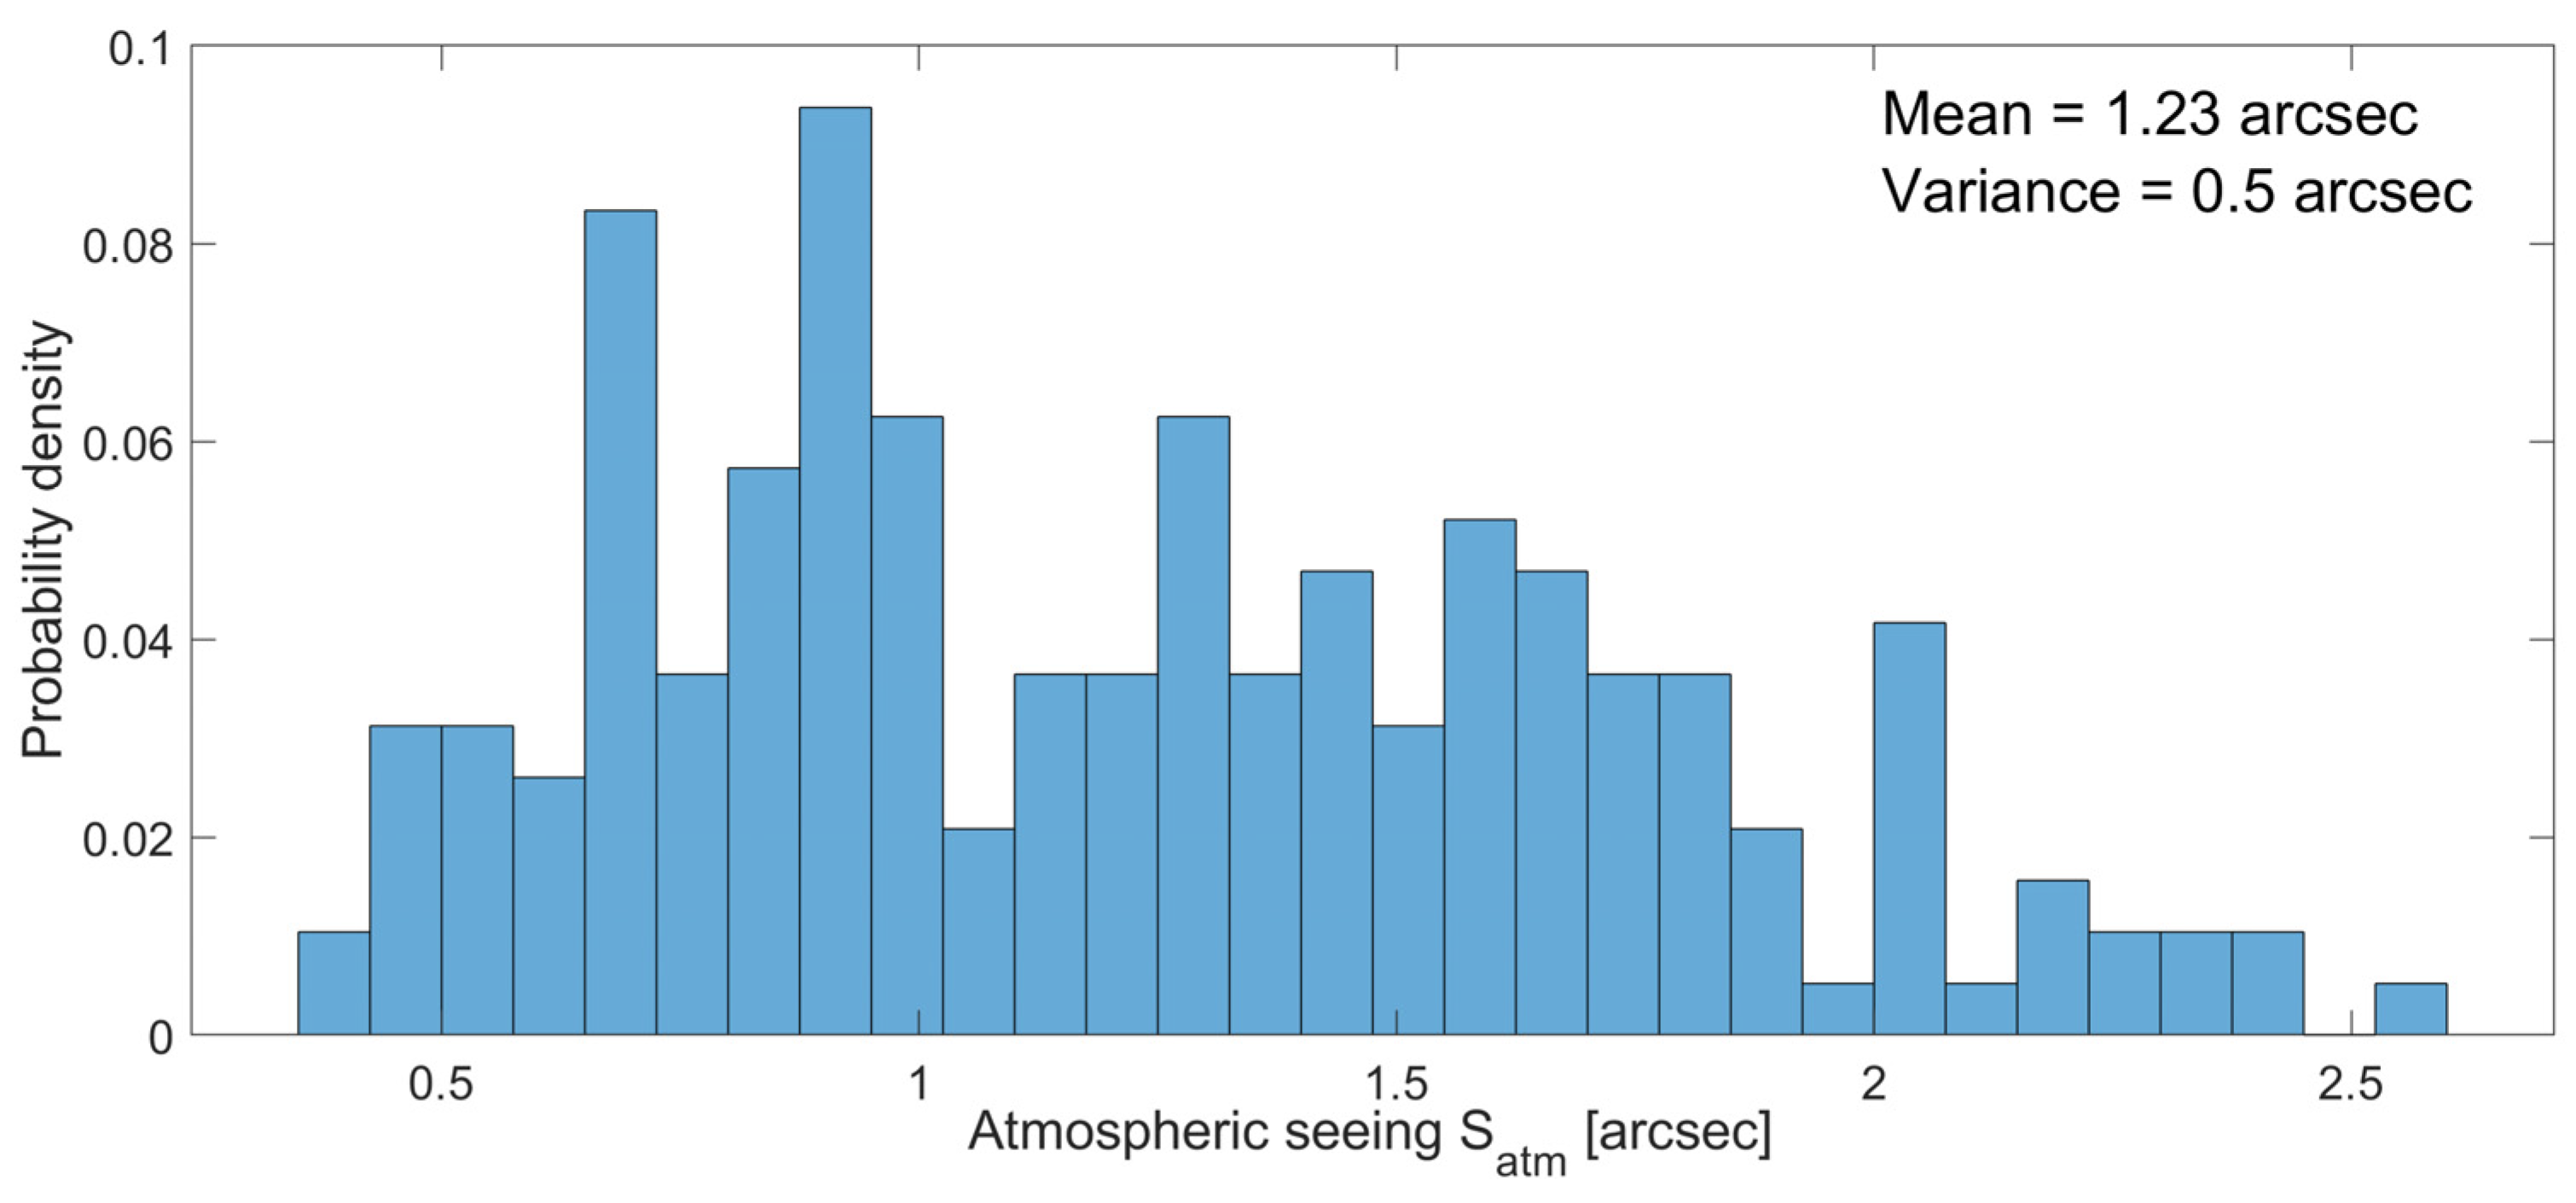
3.1. Atmospheric Turbulence Attenuation Based on RAOB Database

A key challenge is the generation of accurate atmospheric turbulence data considering the required resources for a real measurement campaign. Therefore, a precise solution is used to obtain the vertical profile of refractive index structure parameter C n 2 based on RAOB databases containing meteorological information for various geographical locations [7,23]. The radio sounding data include atmospheric vertical profile up to 30 km of various atmospheric parameters such as height z, pressure P, geopotential height, absolute temperature T, dew point temperature, relative humidity, mixing ratio, wind orientation and velocity, potential temperature θ, equivalent potential temperature, and virtual potential temperature. The proposed model is based on the Tatarski energy spectrum [24]. In particular, the C n 2 model that applies the structure–function formulation of Tatarski is given in Equation (1) [25].
C n 2 = a 2 ( K H / K M ) M 2 L 0 4 3
where a2 = 2.8 is an empirical constant, KH/KM = 1.35 is an exchange coefficient for heat and momentum, M provides information for the changes of the index of refraction in terms of height z, and L0 is the turbulence outer scale parameter. M is calculated based on (2) given in [22], and L0 is expressed with an experimentally validated Equation (3) [7].
M = 79   ×   10 6 P T 2 d T d z
L 0 = 5 ( 1 + ( z 7500 2500 ) 2 )
Consequently, C n 2 is expressed with Equation (4), which allows the use of ROAB data for precise investigation of atmospheric-turbulence-induced fading.
C n 2 = 3.78 ( 79   ×   10 6 P T 2 ) 2 ( 5 / ( 1 + ( z 7500 2500 ) 2 ) ) 4 / 3 ( d T d z ) 2
The applied absolute temperature T in [K] is dependent on the atmospheric pressure P (hPa) that changes with altitude. Consequently, this causes inaccuracies in calculating C n 2 , and potential temperature parameter θ is instead introduced [26]. The potential temperature is invariant in terms of atmospheric pressure changes that provide higher precision. Furthermore, θ is calculated with Equation (5) [26] in terms of reference pressure that is equal to 1000 hPa.
θ = T ( P 0 P ) 0.286
Having in mind Equations (4) and (5), the final equation for C n 2 is provided in (6).
C n 2 = 3.78 ( 79   ×   10 6 P T θ ) 2 ( 5 / ( 1 + ( z 7500 2500 ) 2 ) ) 4 / 3 ( d θ d z ) 2
Having obtained the RAOB data set for Vienna, Austria, including height z, pressure P, potential temperature θ, and absolute temperature T for a period of 12 months between January and December, the slant profile of C n 2 is modeled and shown in Figure 4. The irradiance fluctuation due to the atmospheric C n 2 parameter is modeled with a number of statistical distributions. While new generalized statistical models such as Malaga distribution exist, straightforward modeling based on Log-Normal and Gamma–gamma distributions is applied. Rytov variances of Log-Normal intensity distribution for horizontal terrestrial (L is the link distance) and slant FSO downlinks are provided in (7) and (8) [27].
σ r 2 = 1.23 C n 2 k 7 / 6 L 11 / 6
σ r 2 = 2.25 k 7 6 1 cos 11 / 6 ( γ ) h 0 H C n 2 ( z ) ( H z ) 5 / 6 d z
In particular, σ r 2 is used as a scintillation index in case of weak atmospheric turbulence. For the purpose of the current FSO downlink model, only Equation (8) is important where γ is the elevation angle, h0 is the height of the ground station, and H is the maximum height of the troposphere corresponding to approximately 12 km.
Nonetheless, Log-Normal intensity is valid for weak turbulence conditions, while stronger FSO intensity fluctuations are probabilistically modeled with Gamma–Gamma distribution covering all regimes (i.e., weak, moderate, and strong). Furthermore, when it is considered that receiver apertures are parameterized with a finite length and power averaging needs to be considered, the power scintillation index σ p 2 is introduced. Its final equation is given in (9), where parameter d is calculated based in (10) [27].
σ p 2 = exp ( 0.49   σ r 2 ( 1 + 0.65 d 2 + 1.11 σ r 12 / 5 ) 7 / 6 + 0.51 σ r 2 ( 1 + 0.69 σ r 12 / 5 ) 5 / 6 1 + 0.9 d 2 + 0.62 d 2 σ r 12 / 5 ) 1
d = ( k D 2 ) / 4 L
Moreover, the typical elevation angle γ of an FSO feeder link is between 20° (in LEO case from 5°), and 90°, as well as a typical accumulated OGS aperture diameter D, is in the range of 1–8 m. Consequently, scintillations described with power scintillation index σ p 2 are simulated for γ = 20° and D = 1 m (e.g., ESA’s OGS at La Teide). When Gamma–Gamma and Log-Normal modeling are applied, the turbulence attenuation Atur for maximum availability of 10−7 is calculated using Equation (11) [8].
A tur = 4.343 ( 3.67 ( 2 ln ( σ p 2 + 1 ) ) 1 2 + 0.5 ln ( σ p 2 + 1 ) )             [ dB ]
The aperture averaging mitigation technique (1 m ≤ D ≤ 8 m) significantly decreases the strength of atmospheric turbulence, which leads to a reduction of the induced scintillations ( σ p 2 << 1). Consequently, the atmospheric-turbulence-induced fading is again well described with Log-Normal distribution, and the used power scintillation index σ p 2 in Equation (11) corresponds to Rytov parameter value range. The normalized histogram of Atur is shown in Figure 5, characterized with a mean value of 3.43 dB and a standard deviation of 0.57 dB.
In order to measure the strength of the turbulence apart from optical attenuation, the coherence length parameter (Fried parameter) is also introduced. Similar to the definition of Rytov variance parametrizing received intensity distribution of an FSO slant link that operates in clear-air atmospheric turbulence, the coherence length is defined based on the refractive index structure parameter, link distance L, and wavelength. Keeping in mind that the downlink has a plane wave-front, the equation for the coherence length is given in (12) [28].
r 0 = [ 0.423 k 2 h 0 h 0 + L C n 2 ( z ) d z ] 3 / 5
Moreover, the coherence length of a vertical slant link is also dependent on elevation angle γ, namely r 0 ( sec ( 90 ° γ ) 3 / 5 . Consequently, the coherence length of a slant space-to-ground FSO link is equal to [29]:
r 0 = [ 0.423 sec ( 90 ° γ ) k 2 h 0 h 0 + L C n 2 ( z ) d z ] 3 / 5
The normalized histogram of the simulated coherence length for the simulated C n 2 parameter in Figure 4 is given in Figure 6.
A lower coherence length r0, directly proportional to the telescope diameter D, significantly decreases telescope resolving power R when the clear-air turbulence effect is present (14). On the contrary, when the coherence length is substantially larger than the aperture diameter, the telescope resolution is mainly diffraction-limited operating in no turbulence conditions [29].
R = π 4 { 1 λ F   D [ 1 + ( D / r 0 ) 5 / 3 ] 3 / 5 } 2
Having assumed that a telescope operates in the presence of atmospheric turbulence, the angular resolution Satm (i.e., astronomical seeing) in (rad) is given in Equation (15). Based on Equations (13) and (15), Satm is provided in Figure 7. If the scintillations are negligibly small, the astronomical seeing is only diffraction-limited, and the coherence length in Equation (15) is substituted with the telescope’s diameter.
S atm = λ r 0   [ rad ]

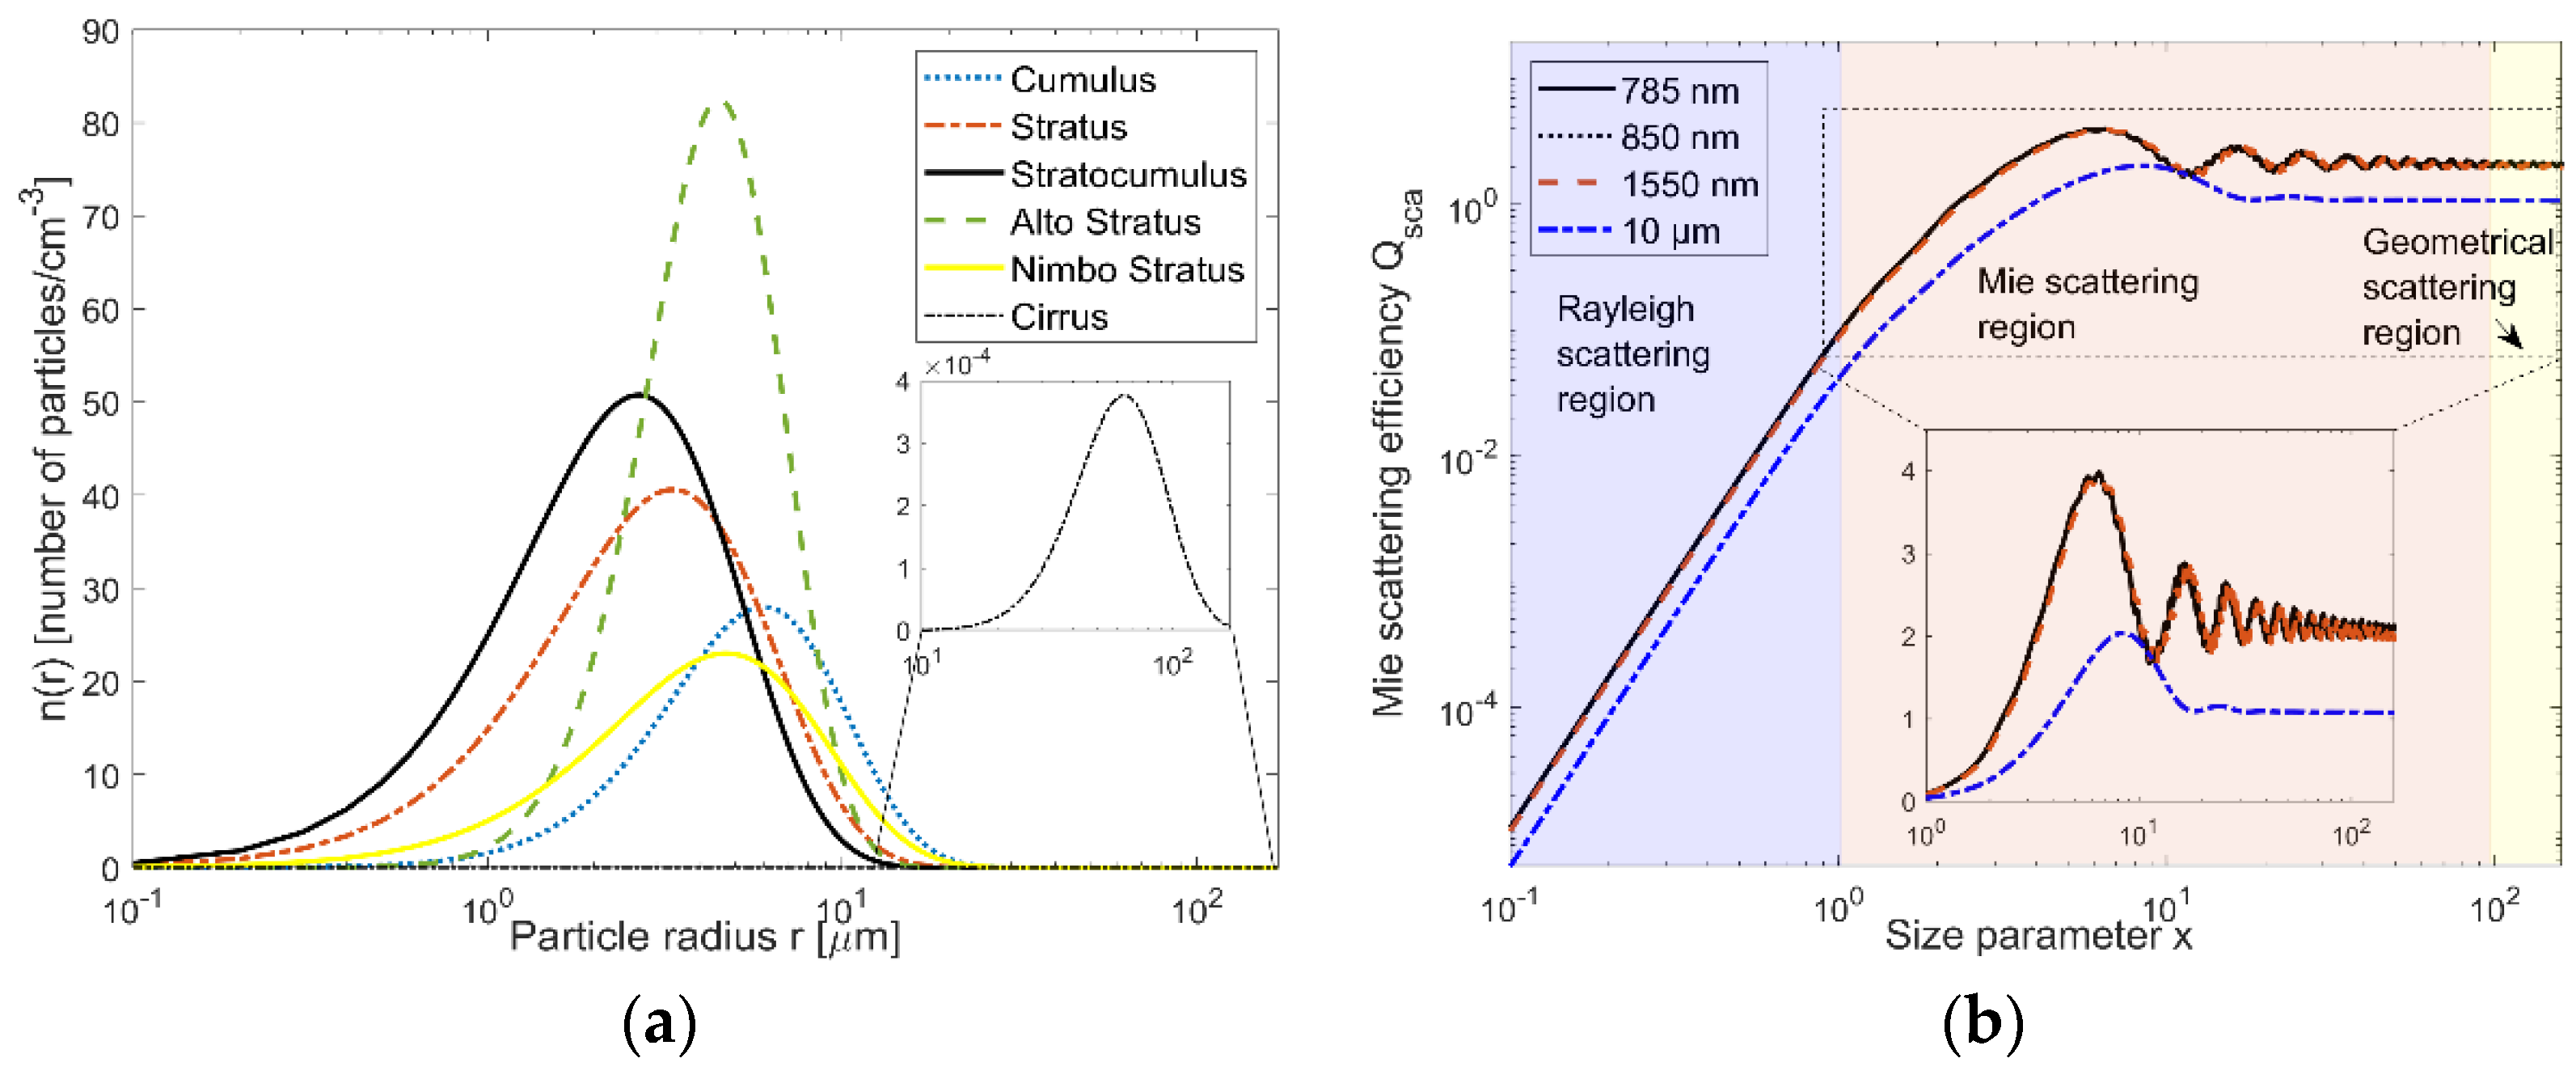
3.2. Cloud-Induced Optical Attenuation

Atmospheric cloud attenuation of an FSO optical signal is due to Mie scattering caused by suspended water particles and is well described by means of Mie theory and microphysics of cloud phenomena [11,30]. The particle size distribution (PSD) is defined in regard to the three-parameters modified gamma distribution model given in Equation (16) [31,32].
n ( r ) = a r α exp ( b )
The positive constants a, α, and b for the primary six types of clouds are listed in Table 1, and the resulting PSD graphs are given in Figure 8a [31].
Furthermore, Mie scattering efficiency factor Qsca calculated using Mie theory for the full-size spectrum of cloud water droplets is provided in Figure 8b. Finally, having implemented both PSD and efficiency factor Qsca, the equation for the Mie scattering coefficient used to calculate cloud attenuation is given in Equation (17) [8].
β s c a ( n m ,   r , λ 0 ) = r m i n r m a x Q s c a ( n m ,   r , λ 0 ) n ( r ) π r 2 d r
The average optical attenuation is determined for a single scattering case when the multipath propagation effect is neglected, and mainly ballistic photons reach the optical detector. Having used exponential Beer–Lambert law, the simulated minimum and maximum optical losses Ac due to main six types of clouds including Stratus, Stratocumulus, Altostratus, Nimbostratus, Cirrus, and Cumulus are 283.87–2.83 × 10³ (dB), 48.55–194.21 (dB), 32.2–128.82 (dB), 85.2–852.08 (dB), 692.7–1039 (dB), and 3.99–11.98 (dB), respectively. Cirrus and Stratus clouds are the only cloud types that can be overcome. Moreover, due to the high altitude of Cirrus, they are mainly composed of ice particles that random orientation additionally influences the polarization properties of the propagated FSO beam [33]. In order to statistically model the simulated cloud attenuation Ac, an empirical approach is applied based on Log-Normal distribution (i.e., Equation (18)) that offers the most accurate fitting in terms of the measured and simulated optical attenuation data. Typical Log-Normal distribution for a region where Cirrus and Stratus clouds are predominately observed is characterized by μ = 1.44 dB and σ2 = 2.31 [34].
f A c ( A c ) = 1 2 π σ A c e x p [ ( l n A c μ ) 2 2 σ 2 ]
Referring to the fact that only Cirrus and Stratus can be managed by ground-space FSO systems, the other types of clouds cause interruption of optical LoS communication links. Consequently, for the considered location of Vienna, Austria, for which the cloud cover is significant, a unique diversity technique combining 12 European OGS sites should be used in order to reach an availability of 99.9%. If such a network is built together with Germany, the outage probability is significantly higher even if the OGS number is increased to 12. Moreover, an international network considering 9 OGSs possesses outage probability reaching 10−7 that can be considered as availability of 100% [13].

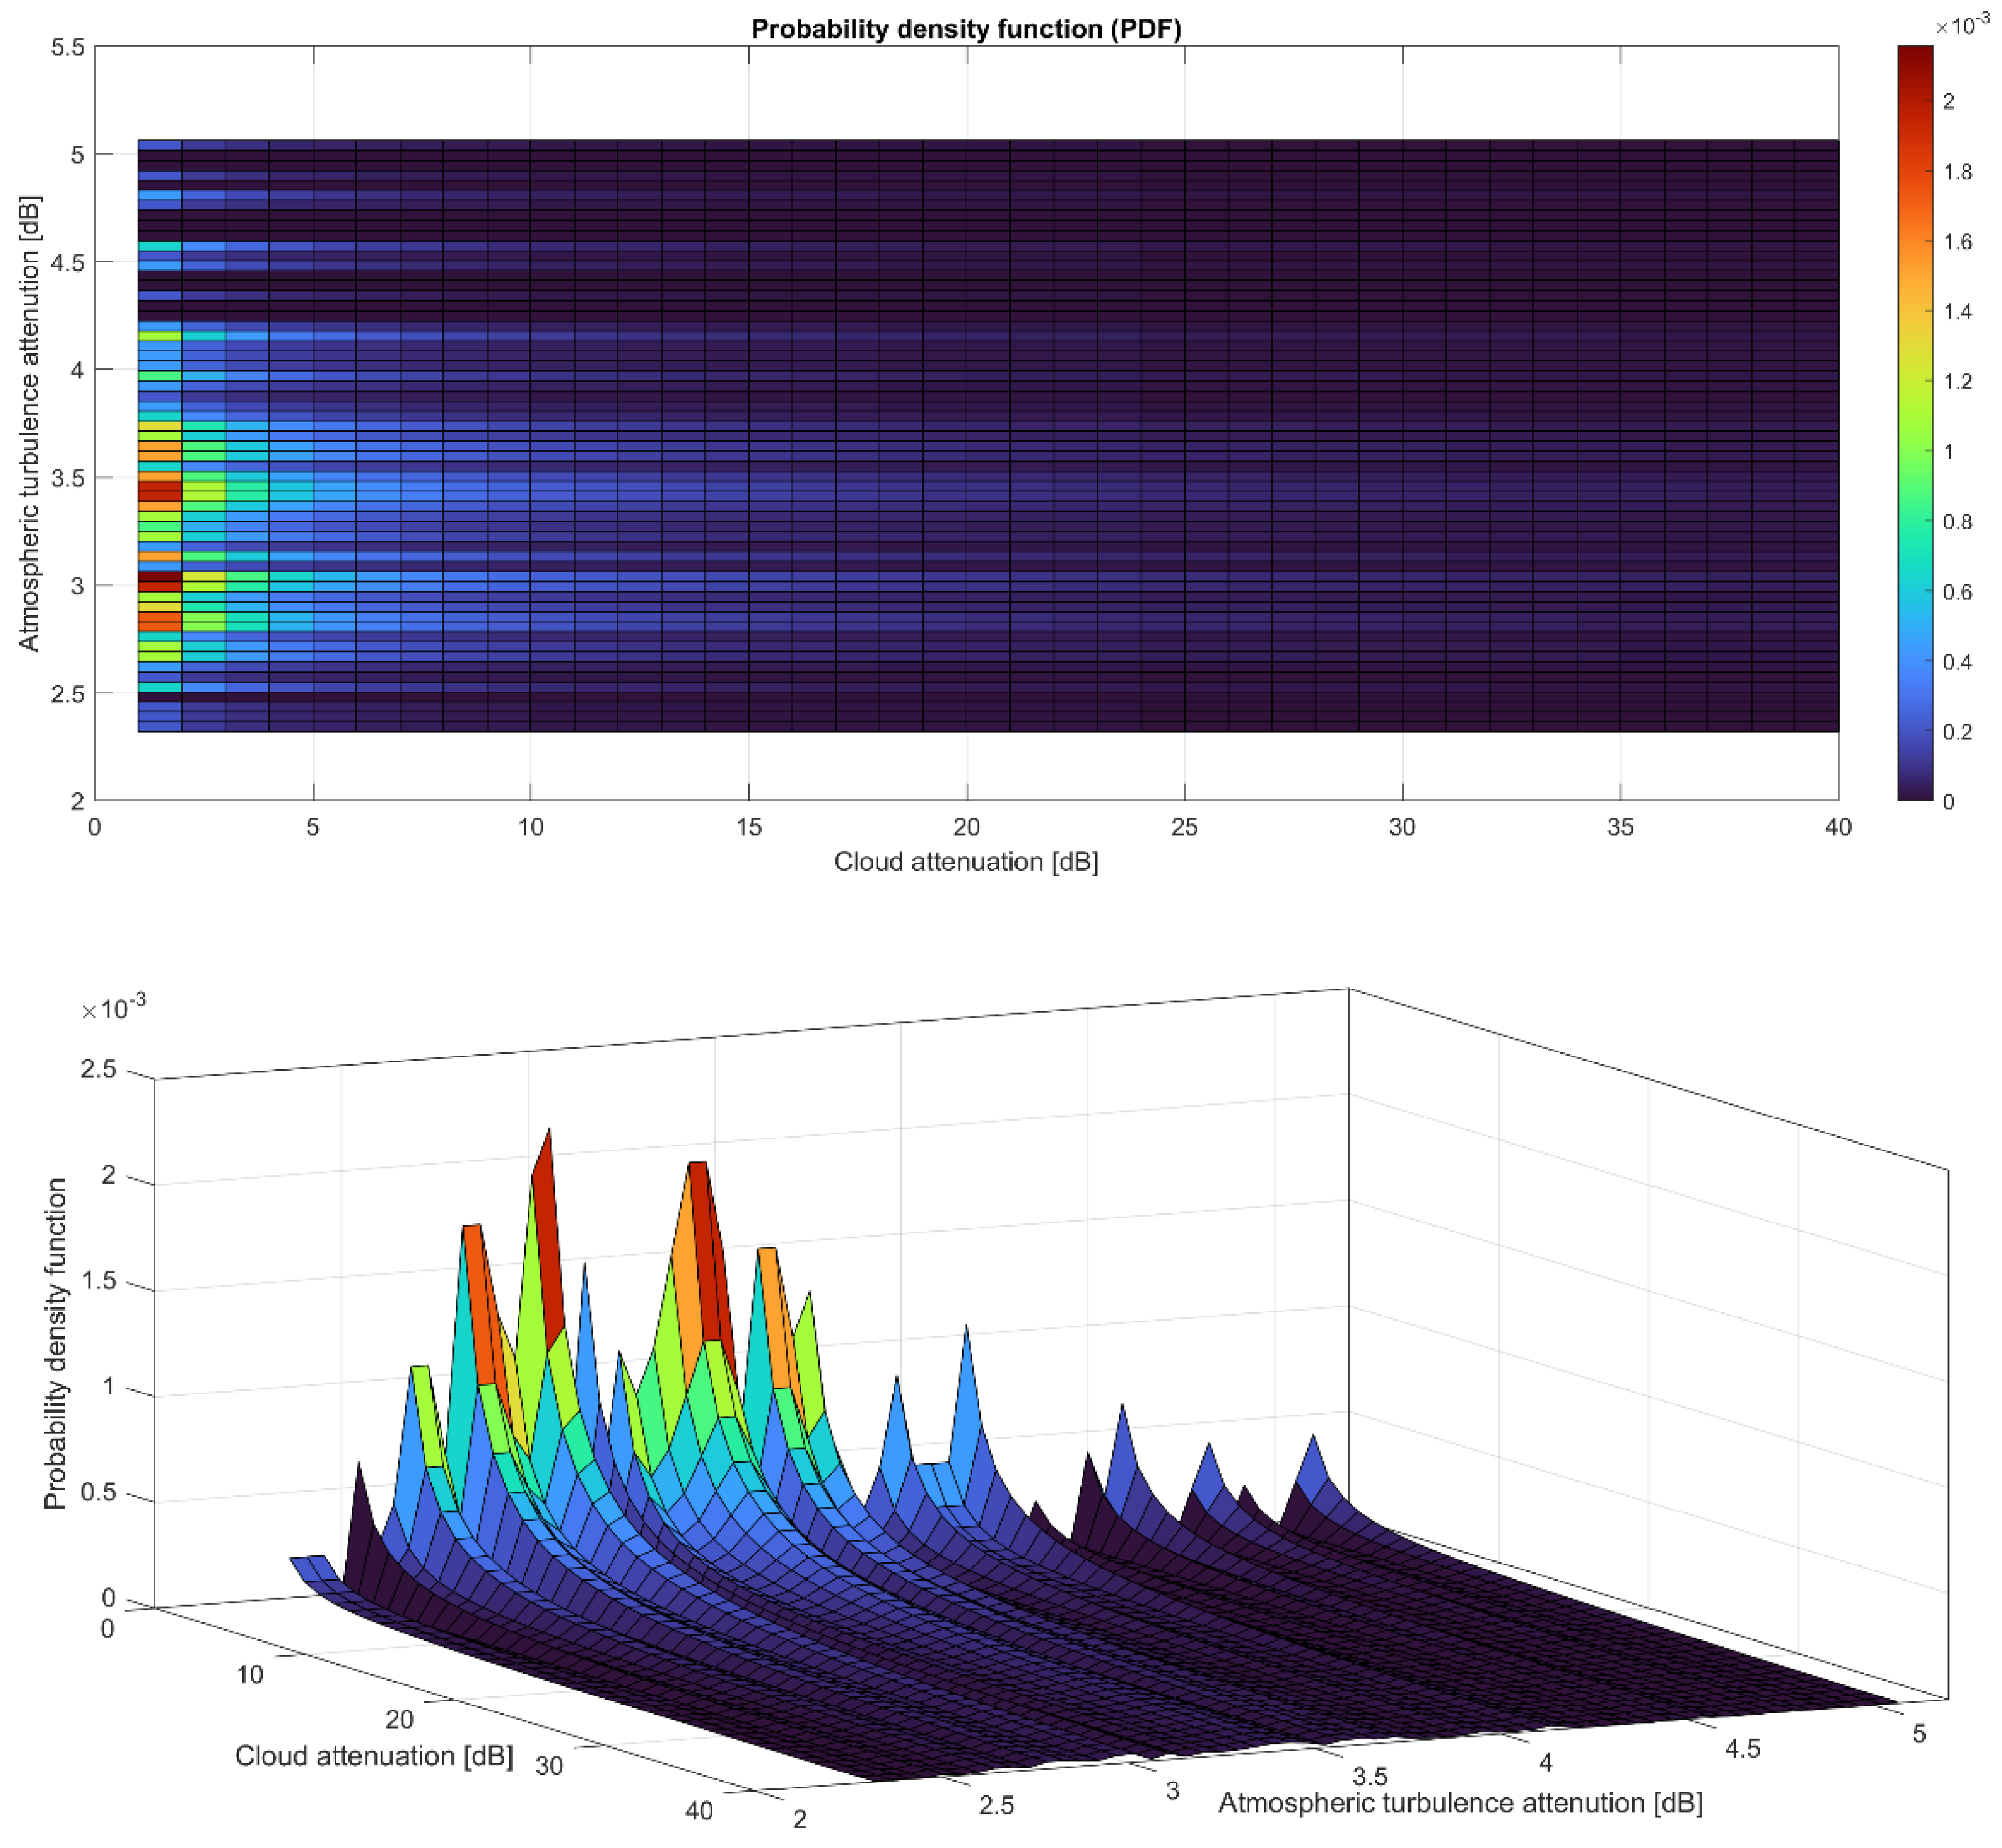
3.3. Joint Characterization of a Space-Ground FSO System Based on Scintillations and Clouds

Once the simulated normalized histogram of the atmospheric-turbulence-induced attenuation (Figure 5) together with the considered probability density function of cloud attenuation (Equation (18)) modeled as a Log-Normal distribution is provided, Multivariate Statistical Analysis is considered. Having both attenuation variables (i.e., atmospheric turbulence and clouds losses) defined in the same probability space, the simulated joint probability density function on all possible optical attenuation pairs of output is provided in Figure 9.
While the simulated joint probability density function offers a good assessment of atmospheric effects influencing FSO systems, only atmospheric turbulence is emulated based on the delivered hardware. Cloud attenuation is static compared to fast turbulence fading and is out of interest for the prototyped near-space FSO link.

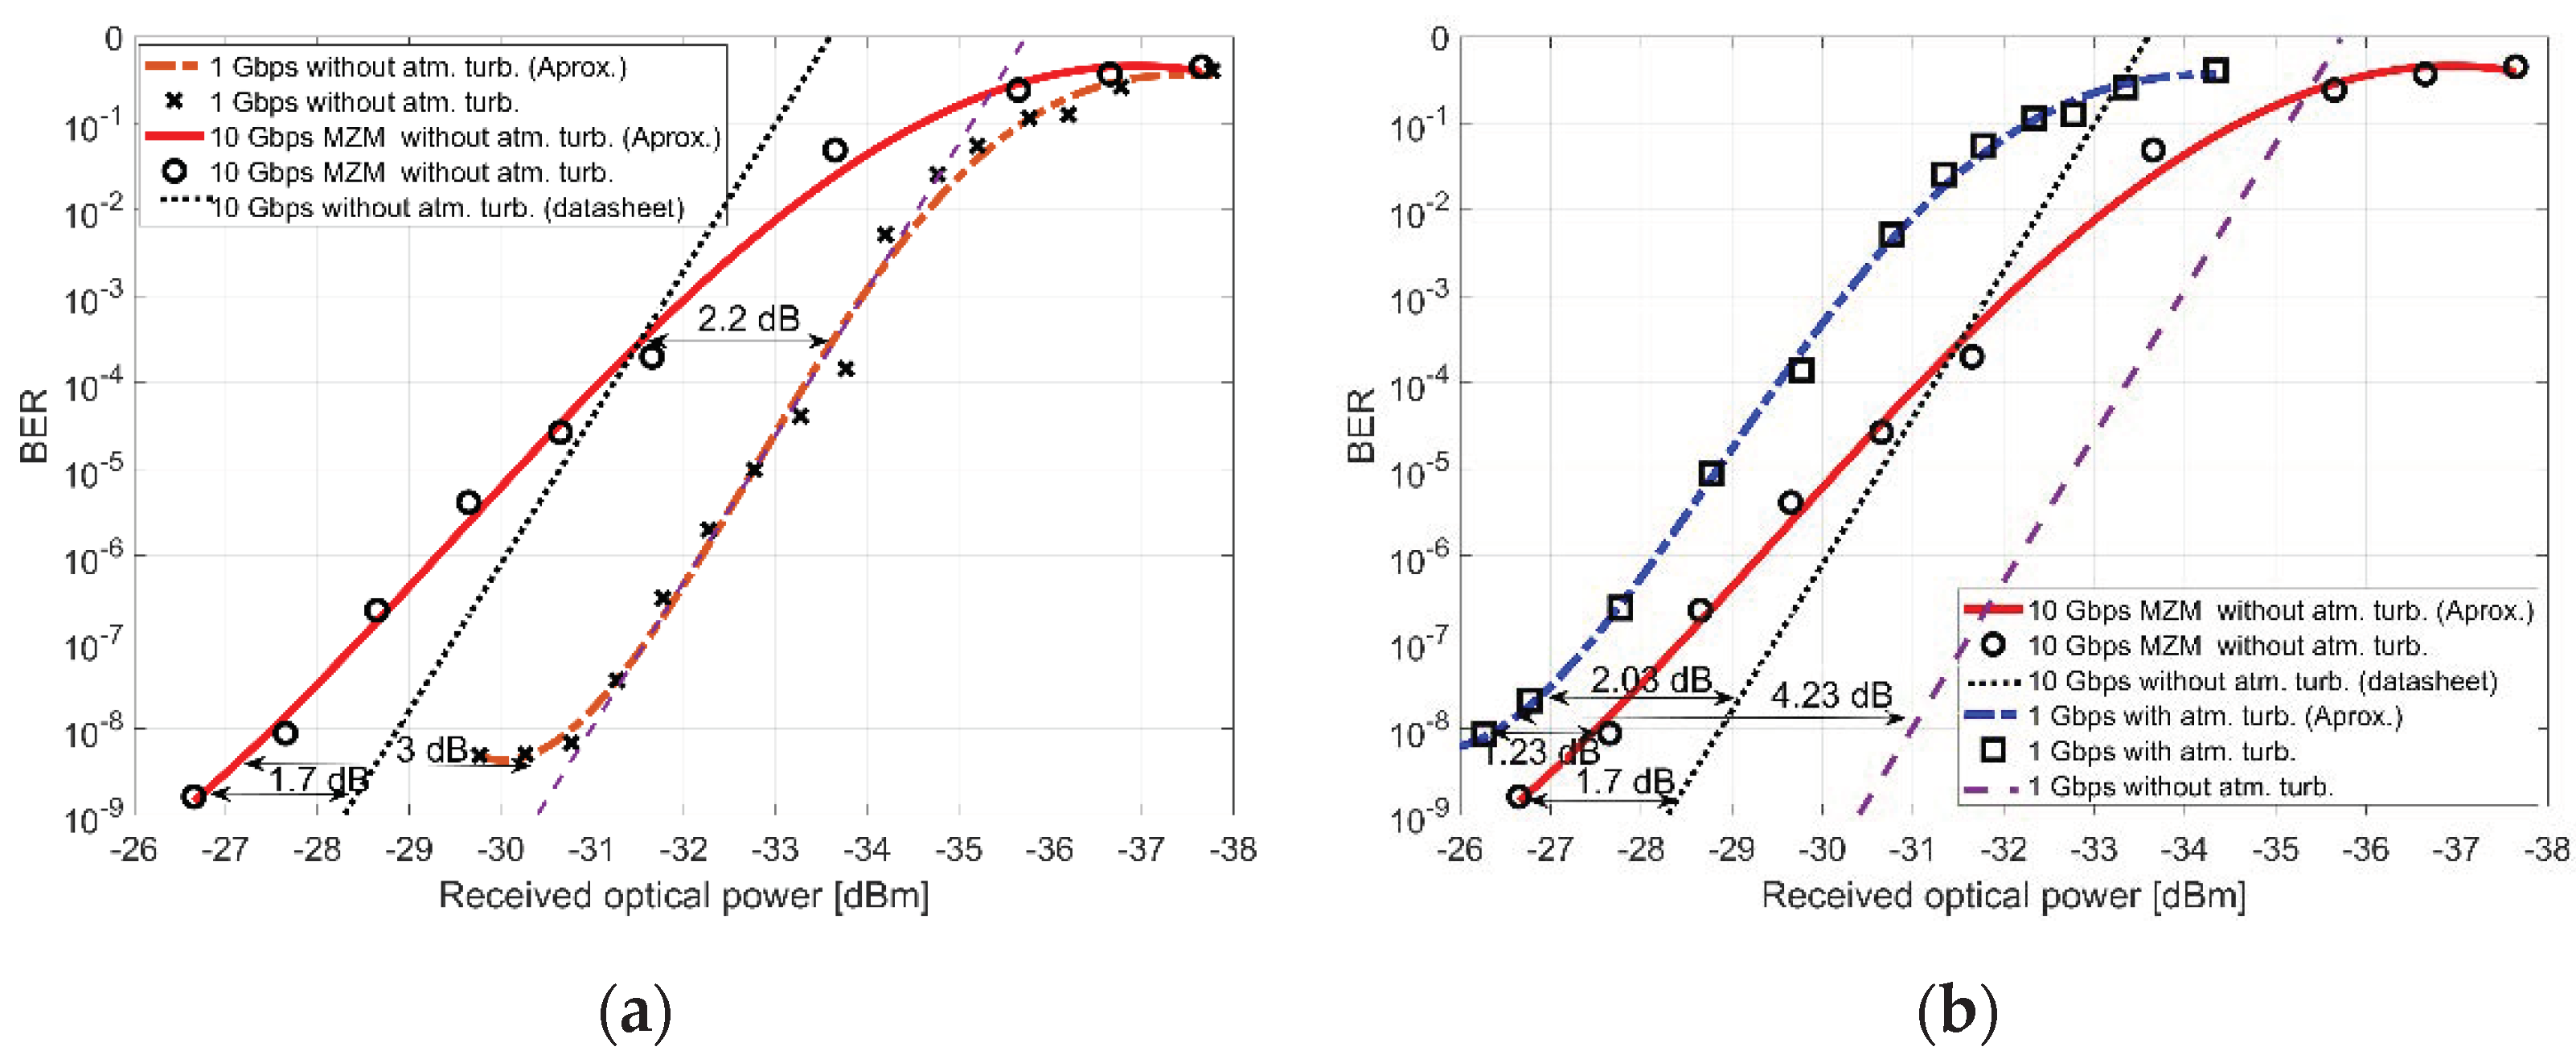
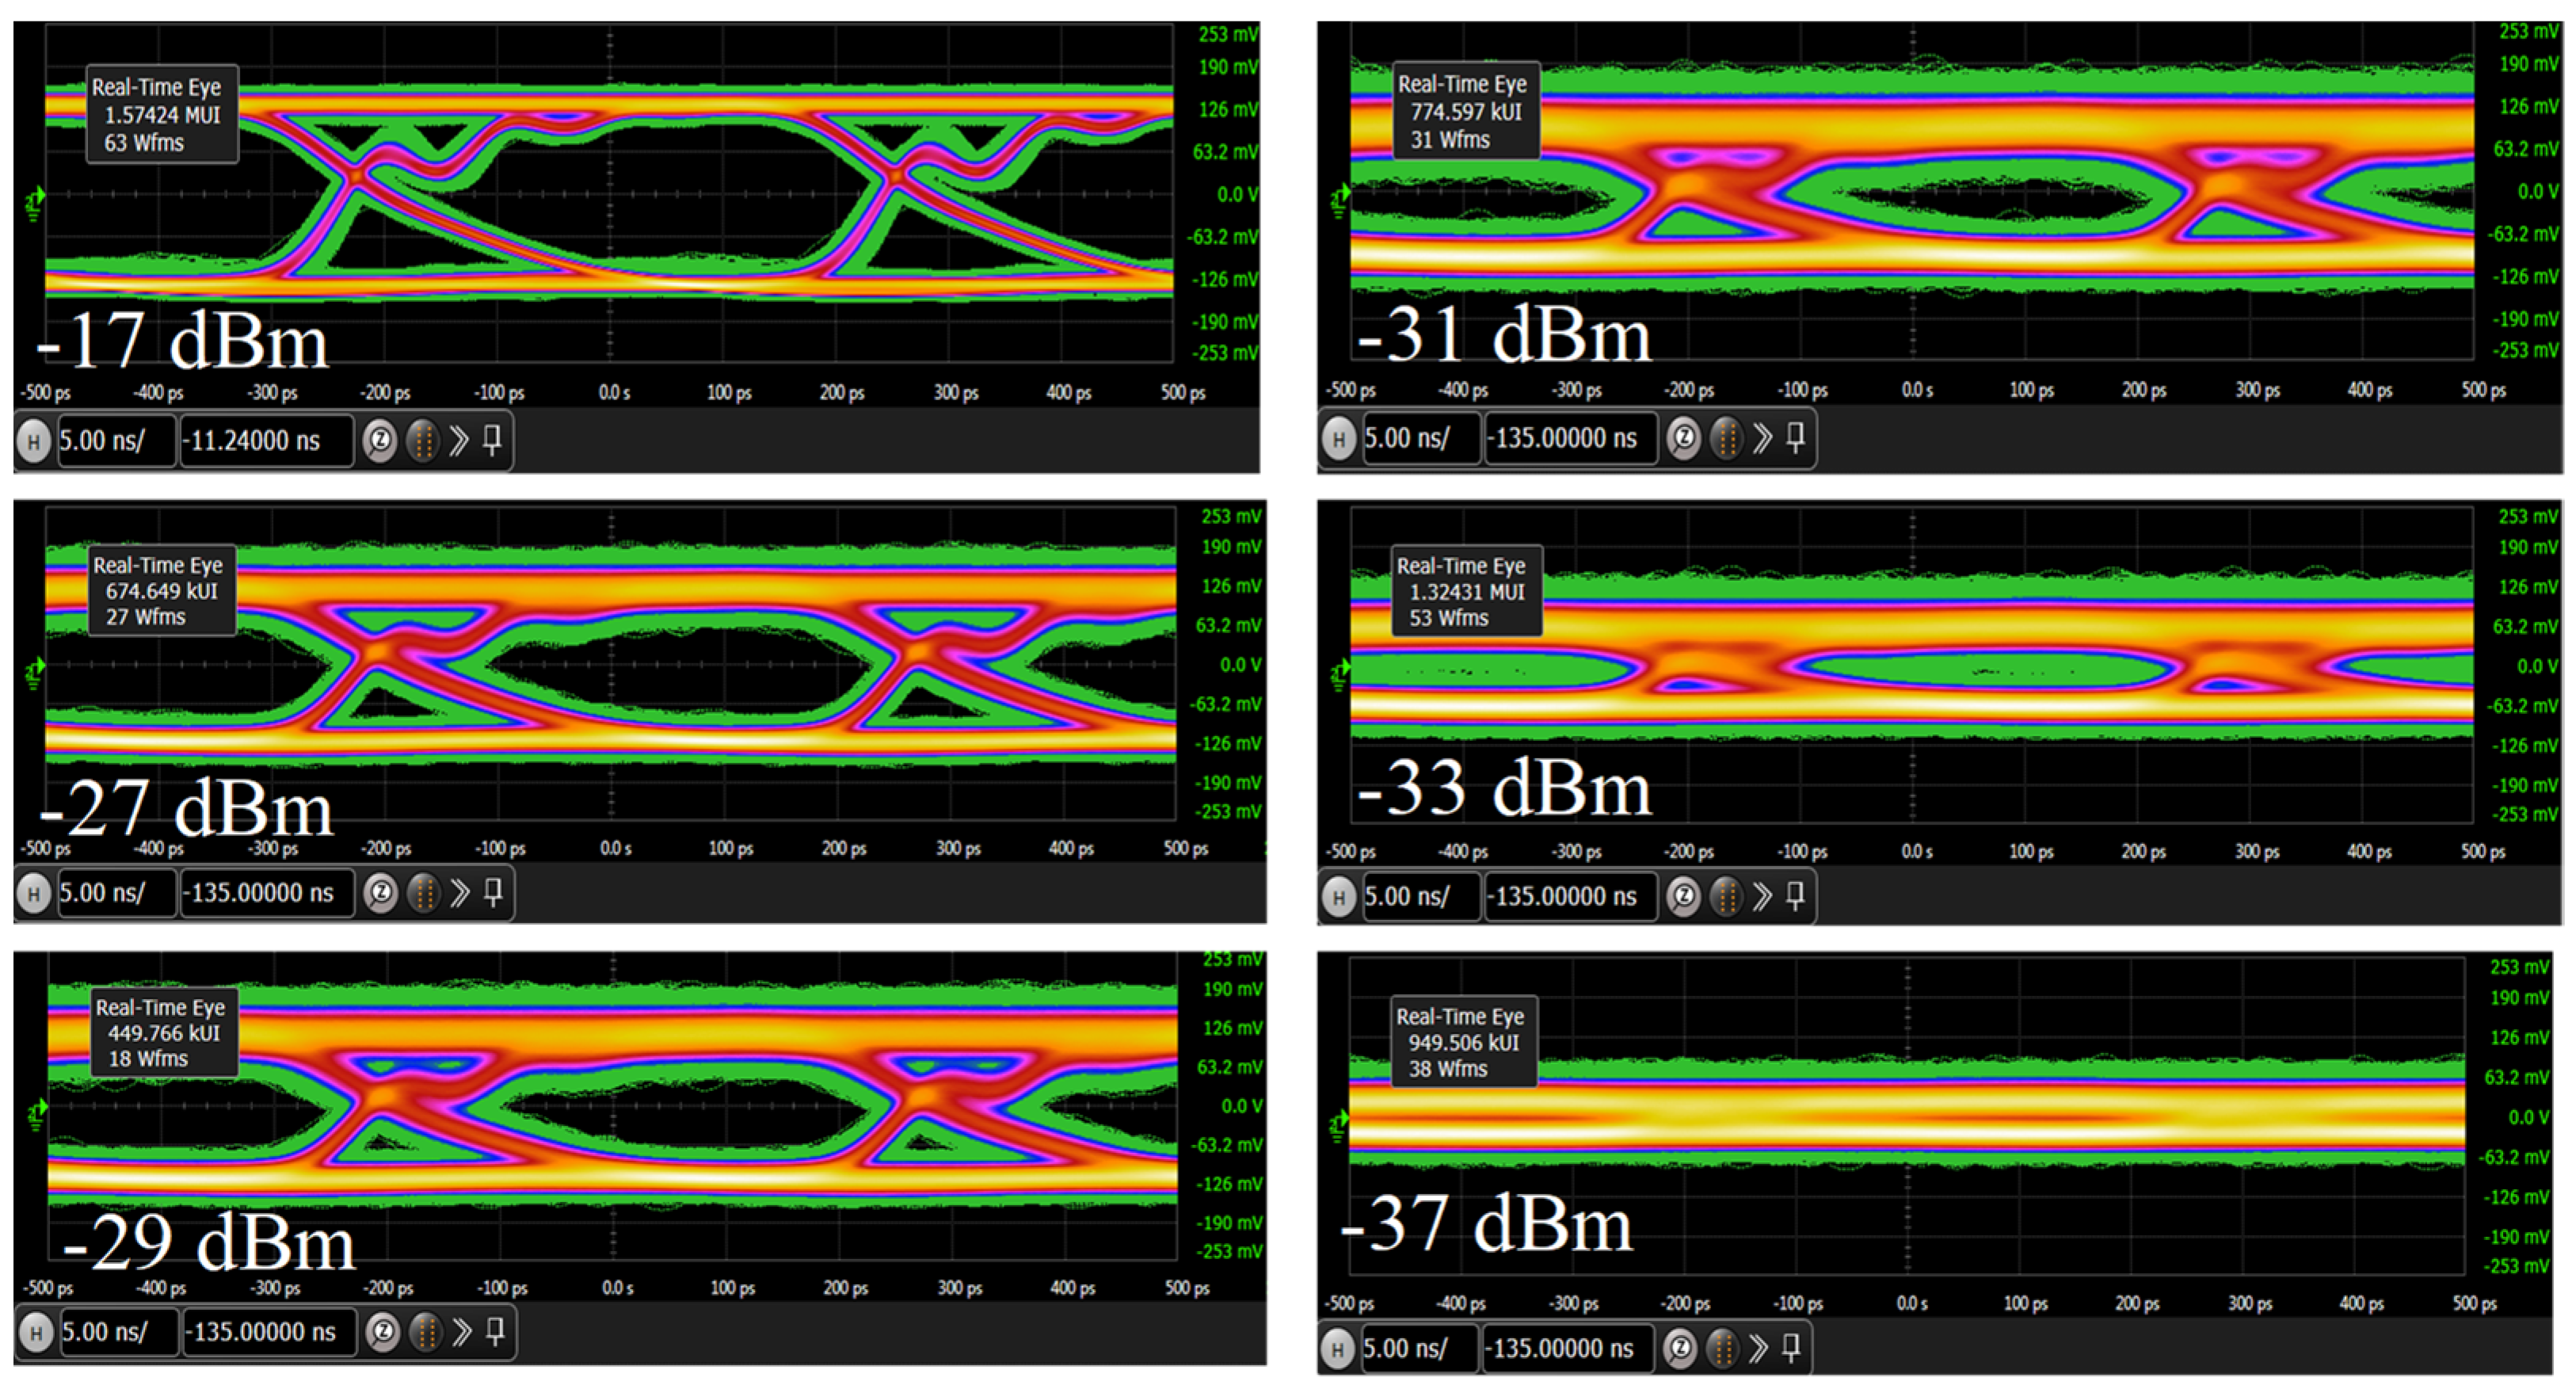
4. Performance of the Evaluated Photodetector

The FBR2178GB photodetector under test is an SMF-coupled APD-TIA produced by FiBest and operating at 1550 nm wavelength. It is soldered on a customized printed circuit board (PCB). Since this is a typical PD deployed in next-generation OGSs for near-Earth FSO communication, the supported 3 dB bandwidth is 8.4 GHz offering up to 10 Gbps. The maximum breakdown PD supply voltage (Vpd) is 31.5 V, and TIA supply voltage is 3.3 V with 1.021 A/W maximum responsivity offering high sensitivity. In order to achieve an APD M-factor = 9, the setup Vpd is 30 V providing maximum sensitivity (<−27 dBm) for a given data rate with a damage threshold Pth of −5.5 dBm.
In order to validate the maximum performance of the used FBR2178GB APD-TIA photodetector, ideal atmospheric conditions without any atmospheric-induced fading or attenuation and a maximum data rate of 10 Gbps are selected. The experimental setup is shown in Figure 10, and it is based on 10 Gbps MZM fed by a 1550 nm tunable laser source. For maximum MZM efficiency, the in-house prepared MZM driver operates at a bias point of 4.2 V, while the driving voltage is 2 V.
In addition, its extinction ratio at DC is 20 dB, which is a low value compared to the minimum 25 dB value given in the recommendations for space-qualified modulators [20]. Moreover, the channel emulator is used as a tunable VOA, allowing step measurements of the BER curve at 10 Gbps. The performance measurements of APD-TIA operating at 10 Gbps are provided in Section 5, where they are compared with the operation of APD-TIA at 1 Gbps in the presence of atmospheric-turbulence-induced fading.

5. Results and Discussions

The described channel emulator provides the benefit of introducing atmospheric turbulence effect into an FSO system used hereby for an assessment of a high-end PD whose performance is crucial for next-generation FSO feeder links. In particular, the architecture of the built prototype used for emulation of satellite-to-ground FSO downlinks in controlled laboratory conditions consists of an optical transmitter, SMF-based optical channel emulator, a few fixed optical attenuators, receiver implementing high-end APD-TIA, oscilloscope, and BERT. Its block scheme is provided in Figure 11a, while the real experiment is depicted in Figure 11b.
The transmitter is a compact-size 1.25 Gbps SFP module with built-in Distributed Feedback (DFB) laser that emits a high-quality optical beam at 1550 nm and 3.5 dBm average optical power. Furthermore, the extinction ratio of DFB is at a minimum of 9 dB, but lowering the data rates to 1 Gbps and decreasing the driving current lead to 50% better performance, and ~14 dB is achieved, which is still comparable with the real MOPA-based architecture providing 20–25 dB. In order to maintain the Pth = −5.5 dBm of the used APD-TIA, three fixed 3 dB Optical Attenuators (OA) are deployed, which, together with the 1 dB internal loss of VOA, leads to a maximum of −6.5 dBm at the receiver. The SFP is plugged into the SFP2SMA2 evaluation board that both together play the role of a transparent interface translating the incoming binary data into the optical domain based on Non-Return to Zero (NRZ) OOK intensity modulation. In the next stage, atmospheric-turbulence-induced fading is introduced by using the FSO channel emulator as well as the RAOB-based simulated attenuation data for Vienna, Austria (Figure 5). The simulations are accomplished at 100 Hz fading frequency (response time) that is set up in the developed attenuator GUI (Figure 2). Finally, the received signal is processed using a maximum likelihood receiver with hard decision decoding. The performed BER measurements are carried out with Agilent N4906B BER testers (BERT). In addition, the used pulse pattern of BERT for generating the Pseudo-Random Binary Sequence (PRBS) at 1 Gbps that internally modulates the SFP DFB laser is 231−1. In order to have a comparison when APD-TIA also operates at the maximum possible data rate, its BER at 10 Gbps is measured considering the introduced design discussed in Section 4 that uses 10 Gbps MZM. Finally, the output of the tested APD-TIA at 1 Gbps is analyzed with 33 GHz digital oscilloscope DSAV334A Agilent Keysight having 80 GS/s maximum sample rate.
The measured and the approximated BER performance based on the introduced experimental setup applying Agilent N4906B BERT (Figure 11) is provided in Figure 12. Both 1 Gbps and 10 Gbps of a slant FSO propagation channel are evaluated with and without atmospheric turbulence. In addition to the accomplished measurements with the introduced MZM-based prototype board in Section 4, an ideal BER curve at 10 Gbps, which is provided in the FBR2178GB datasheet, is given in Figure 12a. When both curves are compared, there is up to 1.7 dB offset between them, which is explained by the higher quality MZM in the datasheet that is characterized with a minimum 25 dB extinction ratio [20]. Considering the observed power penalties at BER = 10−8, when the data rate is decreased from 10 Gbps to 1 Gbps, the appeared offset of 2.2–3 [dB] is due to improved sensitivity of the APD-TIA, once the information bandwidth is reduced. Furthermore, the approximated measured BER curve subject to the introduced tropospheric scintillations (Figure 5) at 1 Gpbs throughput is given in Figure 12b.
The obtained graph is simulated for the generated turbulence attenuation with the mean value of 3.43 dB, and it is compared with the measured BER curves at 1 Gbps and 10 Gbps by assuming ideal atmospheric conditions (no scintillations). It is evident from Figure 12b that the implemented atmospheric turbulence at 1 Gbps data rate leads to a lowered gradient of BER curve for BER < 10−3 in comparison to no turbulence conditions, which results in steadily increased power loss reaching a value of 4.23 dB at BER = 10−8. Consequently, the considered satellite-to-ground FSO link that operates in continental turbulence scintillations and 1 Gbps data throughput is outperformed by the evaluated 10 Gbps scenario when no turbulence conditions are considered. The maximum difference, which depends on the performance of the selected 10 Gbps MZM, is up to 2.03 dB. Although room for further comparison with real measurements is left, such atmospheric data are still not available for Vienna, Austria, scenario to the best of the authors’ knowledge.
Finally, the six measured eye diagrams with DSAV334A (−17 dBm, −27 dBm, −29 dBm, −31 dBm, −33 dBm, and −37 dBm received optical power) that are shown in Figure 13 support the results completely. While the eye is gradually closing, there is still eye-opening even at −33 dBm that confirms the improved performance when data throughput drops. The eye is already wholly closed at −37 dBm.

6. Conclusions

The provided atmospheric FSO link emulator based on VOA significantly profits from the simulated atmospheric-turbulence-induced fading using well-known RAOB databases. Merging together the simulated scintillation data and the developed hardware enables facilitated high-end testing of ground-space FSO links. This breadboard offers not only complete control over the system parameterization but also substantial advantages in view of the extreme costs of a real test mission. Consequently, the equipment is highly beneficial for performance tests of photodetectors that have been under significant scrutiny in the last years. In other words, the device under test is a high-end APD-TIA detector that is studied in typical continental atmospheric-turbulence-induced fading with a mean attenuation value of 3.43 dB and a standard deviation of 0.57 dB. The approach is demonstrated based on BERT and a high-resolution oscilloscope comparing the system performance for 1 Gbps and 10 Gbps. While the 1 Gbps scenario outperforms the 10 Gbps one in case of no turbulence, the BER curve at 10 Gbps without turbulence is featured with up to 2.03 dB better performance when turbulence at 1 Gbps is introduced. While this testbed configuration is utilized for satellite-to-ground downlinks, the modeling of uplinks that also involves the beam wandering effect due to turbulence will be evaluated in further work. Moreover, in order to perform a complete FSO channel modeling, pointing errors and background noise will also be taken into account.

Author Contributions

Conceptualization, H.I.; methodology, H.I., F.M. and E.L.; software, H.I.; validation, F.M. and E.L.; formal analysis, H.I. and F.M.; investigation, H.I.; resources, F.M. and E.L.; data curation, H.I.; writing—original draft preparation, H.I.; writing—review and editing, P.B., F.M. and E.L.; visualization, H.I.; supervision, F.M. and E.L. All authors have read and agreed to the published version of the manuscript.

Funding

This research was supported by EU COST Action CA19111: NEWFOCUS.

Institutional Review Board Statement

Not applicable.

Informed Consent Statement

Not applicable.

Data Availability Statement

Data available in a publicly accessible repository that does not issue DOIs. Publicly available datasets were analyzed in this study. This data can be found here: [https://www.raob.com/data_sources.php; https://www.zamg.ac.at/cms/de/klima/produkte-und-services/daten-und-statistiken/messdaten; https://cds.climate.copernicus.eu/#!/search?text=ERA5&type=datasetin, accessed on 24 March 2022].

Acknowledgments

This work is based upon work from COST Action CA19111 “European Network on Future Generation Optical Wireless Communication Technologies (NEWFOCUS)”, supported by COST (European Cooperation in Science and Technology).

Conflicts of Interest

The funders had no role in the design of the study; in the collection, analyses, or interpretation of data; in the writing of the manuscript, or in the decision to publish the results.

References

  1. Toyoshima, M. Recent Trends in Space Laser Communications for Small Satellites and Constellations. J. Lightwave Technol. 2021, 39, 693–699. [Google Scholar] [CrossRef]
  2. Hauschildt, H. Global quasi-real-time-services back to Europe: EDRS Global. In Proceedings of the International Conference on Space Optics—ICSO 2018, Chania, Greece, 9–12 October 2018; SPIE: Bellingham, WA, USA, 2019; p. 111800X. [Google Scholar]
  3. Cornwell, D.M. NASA’s optical communications program for 2017 and beyond. In Proceedings of the International Conference on Space Optical Systems and Applications (ICSOS), Naha, Japan, 14–16 November 2017; IEEE: Piscataway, NJ, USA, 2017; pp. 10–14. [Google Scholar]
  4. Salfer-Hobbs, M.B.; Miletich, T.J.; Coffaro, J.T.; Kimble-Williams, H.J. Evaluation of instruments for turbulence measurements at 1 km and 13.5 km ranges. In Proceedings of the Laser Communication and Propagation through the Atmosphere and Oceans X, San Diego, CA, USA, 1–5 August 2021; SPIE: Bellingham, WA, USA, 2021; p. 1183402. [Google Scholar]
  5. Zuraski, S.M.; Fiorino, S.T.; McCrae, J.E.; VanTilburg, E.J.; Weisenbach, L.W.; Wilson, M.D. Vertical profiles of turbulence measured with a Rayleigh beacon. In Proceedings of the Laser Communication and Propagation through the Atmosphere and Oceans X, San Diego, CA, USA, 1–5 August 2021; SPIE: Bellingham, WA, USA, 2021; p. 118340T. [Google Scholar]
  6. Land, J.; Whitley, D. Experimental validation and design feasibility of a compact interferometric refractive index structure constant measurement sensor for atmospheric turbulence characterization. In Proceedings of the Laser Communication and Propagation through the Atmosphere and Oceans X, San Diego, CA, USA, 1–5 August 2021; SPIE: Bellingham, WA, USA, 2021; p. 1183405. [Google Scholar]
  7. Marzano, F.S.; Carrozzo, D.; Mori, S.; Moll, F. Clear-air turbulence effects modeling on terrestrial and satellite free-space optical channels. In Proceedings of the 4th International Workshop on Optical Wireless Communications (IWOW), Istanbul, Turkey, 7–8 September 2015; IEEE: Piscataway, NJ, USA, 2015; pp. 36–40. [Google Scholar]
  8. Ivanov, H.; Leitgeb, E.; Kraus, D.; Marzano, F.; Jurado-Navas, A.; Dorenbos, S.; Perez-Jimenez, R.; Freiberger, G. Free Space Optics System Reliability in the Presence of Weather-Induced Disruptions. In Guide to Disaster-Resilient Communication Networks. Computer Communications and Networks; Rak, J., Hutchison, D., Eds.; Springer: Berlin/Heidelberg, Germany, 2020; pp. 327–351. [Google Scholar]
  9. Gladysz, S.; Zepp, A.; Segel, M.; McDonald, D.; Bellossi, R.; Lechner, D.; Gasperin, O.J.G.; Stein, K. Wavefront sensing for terrestrial, underwater, and space-borne freespace optical communications. In Proceedings of the Laser Communication and Propagation through the Atmosphere and Oceans X, San Diego, CA, USA, 1–5 August 2021; SPIE: Bellingham, WA, USA, 2021; p. 11834. [Google Scholar]
  10. Drexler, K.; Lilledahl, S.; Laxton, B. Digital adaptive optics for turbulence mitigation. In Proceedings of the Laser Communication and Propagation through the Atmosphere and Oceans X, San Diego, CA, USA, 1–5 August 2021; SPIE: Bellingham, WA, USA, 2021; p. 118340D. [Google Scholar]
  11. Ivanov, H.; Pezzei, P.; Leitgeb, E. Estimation of Cloud-induced Optical Attenuation over Near-Earth and Deep-space FSO Communication Systems. In Proceedings of the International Conference on Software, Telecommunications and Computer Networks (SoftCOM), Split, Croatia, 23–25 September 2021; IEEE: Piscataway, NJ, USA, 2021; pp. 1–5. [Google Scholar]
  12. Alliss, R.J.; Felton, B. The mitigation of cloud impacts on free-space optical communications. In Proceedings of the Atmospheric Propagation IX, Baltimore, MD, USA, 25–26 April 2012; SPIE: Bellingham, WA, USA, 2012; Volume 8380, p. 83800S. [Google Scholar]
  13. Fuchs, C.; Moll, F. Ground station network optimization for space-to-ground optical communication links. J. Opt. Commun. Netw. 2015, 7, 1148–1159. [Google Scholar] [CrossRef] [Green Version]
  14. Biswas, A.; Wilson, K.E.; Piazzolla, S.; Wu, J.P.; Farr, W.H. Deep-space optical communications link availability and data volume. In Proceedings of the Free-Space Laser Communication Technologies XVI, San Jose, CA, USA, 25 January 2004; SPIE: Bellingham, WA, USA, 2004; Volume 5338. [Google Scholar]
  15. Alonso, A.; Reyes, M.; Sodnik, Z. Performance of satellite-to-ground communications link between ARTEMIS and the Optical Ground Station. In Proceedings of the Optics in Atmospheric Propagation and Adaptive Systems VII, Maspalomas, Spain, 13–14 September 2004; SPIE: Bellingham, WA, USA, 2004; p. 5572. [Google Scholar]
  16. Miklusis, D.; Sodnik, Z. A novel ground receiver for EDRS. In Proceedings of the Free-Space Laser Communications XXXII, San Francisco, CA, USA, 3–4 February 2020; SPIE: Bellingham, WA, USA, 2020; p. 112720T. [Google Scholar]
  17. Maho, A.; Faugeron, M.; Le Kernec, A.; Elayoubi, K.; Sotom, M. Assessment of the effective performance of DPSK vs. OOK in satellite-based optical communications. In Proceedings of the International Conference on Space Optics—ICSO 2018, Chania, Greece, 9–12 October 2018; SPIE: Bellingham, WA, USA, 2019; p. 111805T. [Google Scholar]
  18. Müncheberg, S.; Gal, C.; Horwath, J.; Kinter, H.; Navajas, L.M.; Soutullo, M. Development status and breadboard results of a laser communication terminal for large LEO constellations. In Proceedings of the International Conference on Space Optics—ICSO 2018, Chania, Greece, 9–12 October 2018; SPIE: Bellingham, WA, USA, 2019; p. 1118034. [Google Scholar]
  19. Ivanov, H.; Leitgeb, E. Characteristics of Ultra-Long Deep Space FSO Downlinks Using Special Detector Technologies Like SNSPD. In Proceedings of the 22nd International Conference on Transparent Optical Networks (ICTON), Bari, Italy, 19–23 July 2020; IEEE: Piscataway, NJ, USA, 2020; pp. 1–4. [Google Scholar]
  20. Ivanov, H. Breadboard Detailed Design. In System Study of Optical Communications with a Hybridised Optical/RF Payload Data Transmitter; Technical report; European Space Agency, ESTEC: Noordwijk, The Netherlands, 2018; Contract No. 4000115256/15/NL/FE. [Google Scholar]
  21. Ivanov, H.; Hatab, Z.; Marzano, F.; Leitgeb, E. Hardware emulation of satellite-to-ground APD-based FSO downlink affected by atmospheric turbulence-induced fading. In Proceedings of the Laser Communication and Propagation through the Atmosphere and Oceans X, San Diego, CA, USA, 1–5 August 2021; SPIE: Bellingham, WA, USA, 2021; p. 1183409. [Google Scholar]
  22. Andrews, L.C.; Phillips, R.L.; Young, C.Y. Laser Beam Scintillation with Applications; SPIE Press: Bellingham, WA, USA, 2001. [Google Scholar]
  23. Marzano, F.S.; d’Auria, G. Model-based prediction of amplitude scintillation variance due to clear-air tropospheric turbulence on Earth-satellite microwave links. J. IEEE Trans. Antennas Propag. 1998, 46, 1506–1518. [Google Scholar] [CrossRef]
  24. Tatarski, V.I. The Effects of the Turbulent Atmosphere on Wave Propagation; Technical Report; Israel Program for Scientific Translations: Jerusalem, Israel, 1971. [Google Scholar]
  25. Dewan, E.M.; Good, R.E.; Beland, R.; Brown, J. A Model for C n 2 (optical turbulence) profiles using radiosonde data. J. Environ. Res. Pap. 1993, PL-TR-93-2043, 1121. [Google Scholar]
  26. Cherubini, T.; Businger, S. Another Look at the Refractive Index Structure Function. J. Appl. Meteorol. Climatol. 2013, 52, 498–506. [Google Scholar] [CrossRef]
  27. Andrews, L.C. Field Guide to Atmospheric Optics; SPIE field guides; SPIE Press: Bellingham, WA, USA, 2004. [Google Scholar]
  28. Fried, D.L. Scintillation of a ground-to-space laser illuminator. J. Opt. Soc. Am. 1967, 57, 980–983. [Google Scholar] [CrossRef]
  29. Piazzolla, S. Atmospheric Channel. In Near-Earth Laser Communications; Optical Science and Engineering Series; Hemmati, H., Ed.; CRC Press: Boca Raton, FL, USA, 2021. [Google Scholar]
  30. Mori, S.; Marzano, F.S. Microphysical Characterization of Free Space Optical Link due to Hydrometeor and Fog Effects. J. Appl. Opt. 2015, 54, 6608–6840. [Google Scholar] [CrossRef] [PubMed]
  31. Tampieri, F.; Tomasi, C. Size distribution models of fog and cloud droplets in terms of the modified gamma function. J. Tellus 1976, 28, 333–347. [Google Scholar]
  32. Shettle, E.P. Models of aerosols, clouds and precipitation for atmospheric propagation studies. In Proceedings of the AGARD Conference, Xi’an, China, 12–14 September 1989; Volume 454, pp. 1–13. [Google Scholar]
  33. Heymsfield, A.J.; Krämer, M.; Luebke, A.; Brown, P.; Cziczo, D.J.; Franklin, C.; Lawson, P.; Lohmann, U.; McFarquhar, G.; Ulanowski, Z.; et al. Cirrus Clouds. J. Meteorol. Monogr. 2017, 58, 2.1–2.26. [Google Scholar] [CrossRef] [Green Version]
  34. Le, H.D.; Nguyen, T.V.; Pham, A.T. Cloud Attenuation Statistical Model for Satellite-Based FSO Communications. J. IEEE Antennas Wirel. Propag. Lett. 2021, 20, 643–647. [Google Scholar] [CrossRef]
Figure 1. Atmospheric FSO channel emulator: (a) hardware interface and VOA; (b) measurements providing set attenuation vs. measured attenuation curve of the used VOA.
Electronics 11 01102 g001
Figure 2. Graphical User Interface (GUI) used for controlling the hardware channel emulator.
Electronics 11 01102 g002
Figure 3. Beam camera shots of the propagated laser beam at LP01 mode in (a) vertical and (b) horizontal planes.
Electronics 11 01102 g003
Figure 4. Atmospheric turbulence simulations providing average C n 2 atmospheric profile based on 12 months of RAOB data for Vienna, Austria.
Electronics 11 01102 g004
Figure 5. Normalized histogram of the simulated turbulence attenuation Atur using the Vienna RAOB dataset.
Electronics 11 01102 g005
Figure 6. Normalized histogram of the simulated turbulence coherence length using the Vienna RAOB dataset.
Electronics 11 01102 g006
Figure 7. Normalized histogram of the simulated Satm using the Vienna RAOB dataset.
Electronics 11 01102 g007
Figure 8. Clouds characterization: (a) modified Gamma PSDs for the primary six types of clouds; (b) modelling of Mie scattering efficiency Qsca versus size parameter x.
Electronics 11 01102 g008
Figure 9. Joint PDF characterizing a space-ground FSO system that operates into Mie scattering (clouds) and atmospheric-turbulence-induced fading based on 12 months data.
Electronics 11 01102 g009
Figure 10. Experimental setup used for testing the APD-TIA performance at a maximum data rate of 10 Gbps that is based on transmitter with external MZM.
Electronics 11 01102 g010
Figure 11. An experimental setup consisting of (a) testbed architecture emulating satellite-to-ground FSO link and (b) photograph from the real experiment.
Electronics 11 01102 g011
Figure 12. Testbed measurement results including (a) BER in terms of 1 Gbps and 10 Gbps data rates at no turbulence and (b) BER in terms of 1 Gbps in clear-air atmospheric scintillations.
Electronics 11 01102 g012
Figure 13. Performance of the testbed based on Eye diagrams for received optical power between −17 dBm and −37 dBm.
Electronics 11 01102 g013
Table 1. Modified gamma PSD parameters for the primary six types of clouds.
Cloud Typeaαb
Cumulus2.630.5
Stratus 22720.6
Stratocumulus52.720.75
Altostratus6.2651.11
Nimbostratus7.6720.42
Cirrus2.21 × 10−1260.09
Publisher’s Note: MDPI stays neutral with regard to jurisdictional claims in published maps and institutional affiliations.

