1. Introduction
In the mid 1990s, highly efficient blue LEDs were proposed for generating white light lamps [
1,
2]. To do that, a thin phosphorous layer is added to blue LEDs. Then, the electrical current generates blue light, and that blue light at the same time generates a yellow light by stimulating the phosphorous layer. It is important to point out that all the blue light generated is not absorbed (reconverted) by the phosphorous layer. Therefore, the resulting light is a combination of two colors, blue and yellow, and, for the human eye, this combination of colors with the right intensity is seen as white light. In 2006, a novel way to create white LEDs was proposed by Narukawa et al. By the use of gallium-indium nitride (InGaN), they achieved efficiencies of up to 174 lm/W, using significantly low currents (around 2 mA). This new approach can be seen as a breakthrough to substitute the conventional white bulbs with LED-based lamps [
3].
In the beginning, white LED lamps were used basically for providing illumination. However, as the continuous increase in the demand for connectivity has led to a search to exploit new parts of the electromagnetic spectrum, the research efforts are focused on modulating the drive and forward current of the LEDs for transmitting information while satisfying the illumination requirements in both indoor and outdoor environments. This is known as VLC or light fidelity (Li-Fi) when integrating the communication link in the IP/TCP network [
4]. VLC is proposed as a means of moving part of the data traffic from the overwhelmed radio frequency (RF) spectrum, which is typically between 300 MHz and 30 GHz, to the optical domain based on the light-emitting diode (LED) technology [
5,
6]. In this sense, the optical domain offers a huge and unlicensed bandwidth in which several signal processing techniques can be applied in order to overcome some limitations, such as the need for line of sight (LoS) or the interference because of transmission from neighboring light points [
7]. This technology was proposed for several scenarios and applications, e.g., in environments where RF transmission is discouraged or even not allowed, such as oil and gas plants, the mining industry or hospitals [
8,
9,
10], and in alternative geolocation and positioning schemes inside buildings or industrial plants, where satellite geolocation fails [
11,
12,
13]. However, in a practical implementation, a small portion of this part of the spectrum can be exploited since LEDs currently are employed for illumination only and, consequently, are characterized for illumination purposes but not for data transmission.
Most of the works in the state-of-the-art about VLC are focused on achieving high data rates by using novel modulation schemes and solutions so that the achieved performance can be compared with commercial RF schemes, such as Wi-Fi or the fourth- and fifth-generation (4G and 5G) cellular systems [
14,
15,
16,
17]. In this sense, it is worth recalling that VLC is still in the development phase, and therefore, several issues must still be solved. Indeed, the implementation of VLC prototypes and testbeds results in the need for enhancing the bandwidth of the LEDs since this element is usually the bottleneck in order to use higher modulation rates [
18,
19].
Focusing on future sixth generation (6G) communications, VLC is considered a key technology for several applications; from indoor high-speed access to ultra-reliable low-speed communications for positioning/navigation or the Internet of Things [
20]. In [
21], the extremely large bandwidth of the optical domain is pointed out as the main advantage of VLC for 6G. However, the modulation bandwidth of LED transmitters is typically the bottleneck for exploiting this huge available bandwidth in the optical spectrum. Furthermore, beyond the knowledge of the optical spectrum, it is necessary to determine the channel response of the optical transmitter in order to design the pre-distortion model or equalizer that exploits the whole modulation bandwidth [
22].
Nowadays, VLC is halfway from the purely theoretical concept to typical commercial and industrial applications. In this sense, there are several works that obtain high data rates in laboratory environments. For instance, in [
14], it is demonstrated that a data rate of up to 3 Gb/s is achievable using a specific
-LED for this experiment. Moving to the use of commercial LEDs, in [
23], the authors achieved a data rate of up to 40 Mb/s in a laboratory environment. However, according to the last report of the European Commission about the LED lighting maker [
24], the development of VLC within the concept of “Lighting 2.0” requires the exploitation of commercial LEDs in order to achieve an efficient and sustainable technology.
In this context, it is necessary to determine the equivalent circuit model of the LEDs beyond the illumination operating point, i.e., when a high-frequency signal modulates the input current of the LED. Recently, in [
25], the equivalent circuit for a commercial LED was obtained. However, the results obtained in this work are limited to a current below 35.8 mA, which hampers its implementation for high-power LEDs. Therefore, novel measuring methodologies for determining the equivalent circuit of the LED transmitters at medium/high frequencies are mandatory for the deployment of VLC applications using medium/high power LEDs, i.e., assuming an operating current greater than 50 mA.
In this work, we analyze the electrical behavior of illumination LEDs subject to high current variations at very high frequency, in the range of MHz, as occurs in VLC applications. The dynamic response of the LEDs can be defined by the combination of passive electronic elements so that the electronic equivalent represents the physical behavior of the LEDs. Notice that the combination of these components corresponds to complex impedance measurements. First, we analyze the traditional methods for characterizing the equivalent circuit of the LEDs. The limitations of these methods when applied to LED lamps oriented to VLC applications are highlighted. After that, we propose an alternative methodology for determining the equivalent circuit of the LED lamps employed for VLC. Finally, the obtained results are validated through experimental simulations using LTSPICE software.
The remainder of this paper is organized as follows. In
Section 2, the dynamic characterization of the LED is presented. The use of traditional measurement tools is analyzed in
Section 2.1. After that, an alternative methodology for determining the equivalent circuit model is proposed in
Section 2.2. The simulation results and corresponding equivalent circuits are depicted and analyzed in
Section 3. Finally,
Section 4 provides concluding remarks.
2. Dynamic Characterization of the LEDs
To understand the dynamic behavior of illumination LEDs is indispensable to know the equivalent circuit that models it. The simplified equivalent LED circuit comprises two mechanisms that affect directly the electrical behavior at high frequencies. These two mechanisms can be modeled as capacitance, known as the diffusion, and the barrier (or depletion) capacitance, which are in fact non-linear electronic elements. The first one is related to the atom ions’ electronic charge. The second capacitance is related to the excess of minority charged carriers injected on direct polarization conditions [
26]. As the capacitance types are in parallel and cannot be measured independently, both are resumed in an equivalent capacitance, from now on, the joint capacitance. Thus, the equivalent circuit in AC of a LED is as shown in
Figure 1. Notice that the joint capacitance, i.e., the sum of the barrier and diffusion capacitance, determines the response of the LED in time and frequency. Parallel to the joint capacitance, the equivalent circuit of a LED comprises a resistance in parallel denoted by
, whose value changes with the voltage variations and series resistance (
) given by the PN junction’s neutral region of the LED.
2.1. Impedance Measurement of the LED Using an Impedance Analyzer
As mentioned earlier, to model the dynamic behavior of the LED, it is needed to obtain the equivalent electric circuit depicted in
Figure 1. The values of the passive components that compose the equivalent circuit can be obtained by performing complex impedance measurements. These measurements (magnitude and phase) were obtained at first by using an impedance analyzer, from now on, the SOLARTRON 1260 analyzer (Solartron Instruments, Hampshire, UK). The SOLARTRON 1260 can perform measurements from 0.1 MHz to 32 MHz and can supply a DC bias up to
V for voltage mode and
mA for the current mode. The white LED used to perform all the measurements is the LXHL-BW02 (
Figure 2) fabricated by Philips Lumileds LUXEON in San Jose (USA), Penang (Malaysia) and Singapore [
27].
At first, a frequency swipe from 100 Hz to 5 MHz with a 10 m
sinusoidal signal and 0 DC bias is performed. Following the bode diagram in
Figure 3, it can be seen that the LED behaves nearly as a full capacity load, i.e., phase equal to
. The resulting equivalent circuit has a resistor of 0.85
in series with a capacitance of 0.95 nF. In this configuration, the impact of
in the measurement is negligible, as shown in
Figure 4.
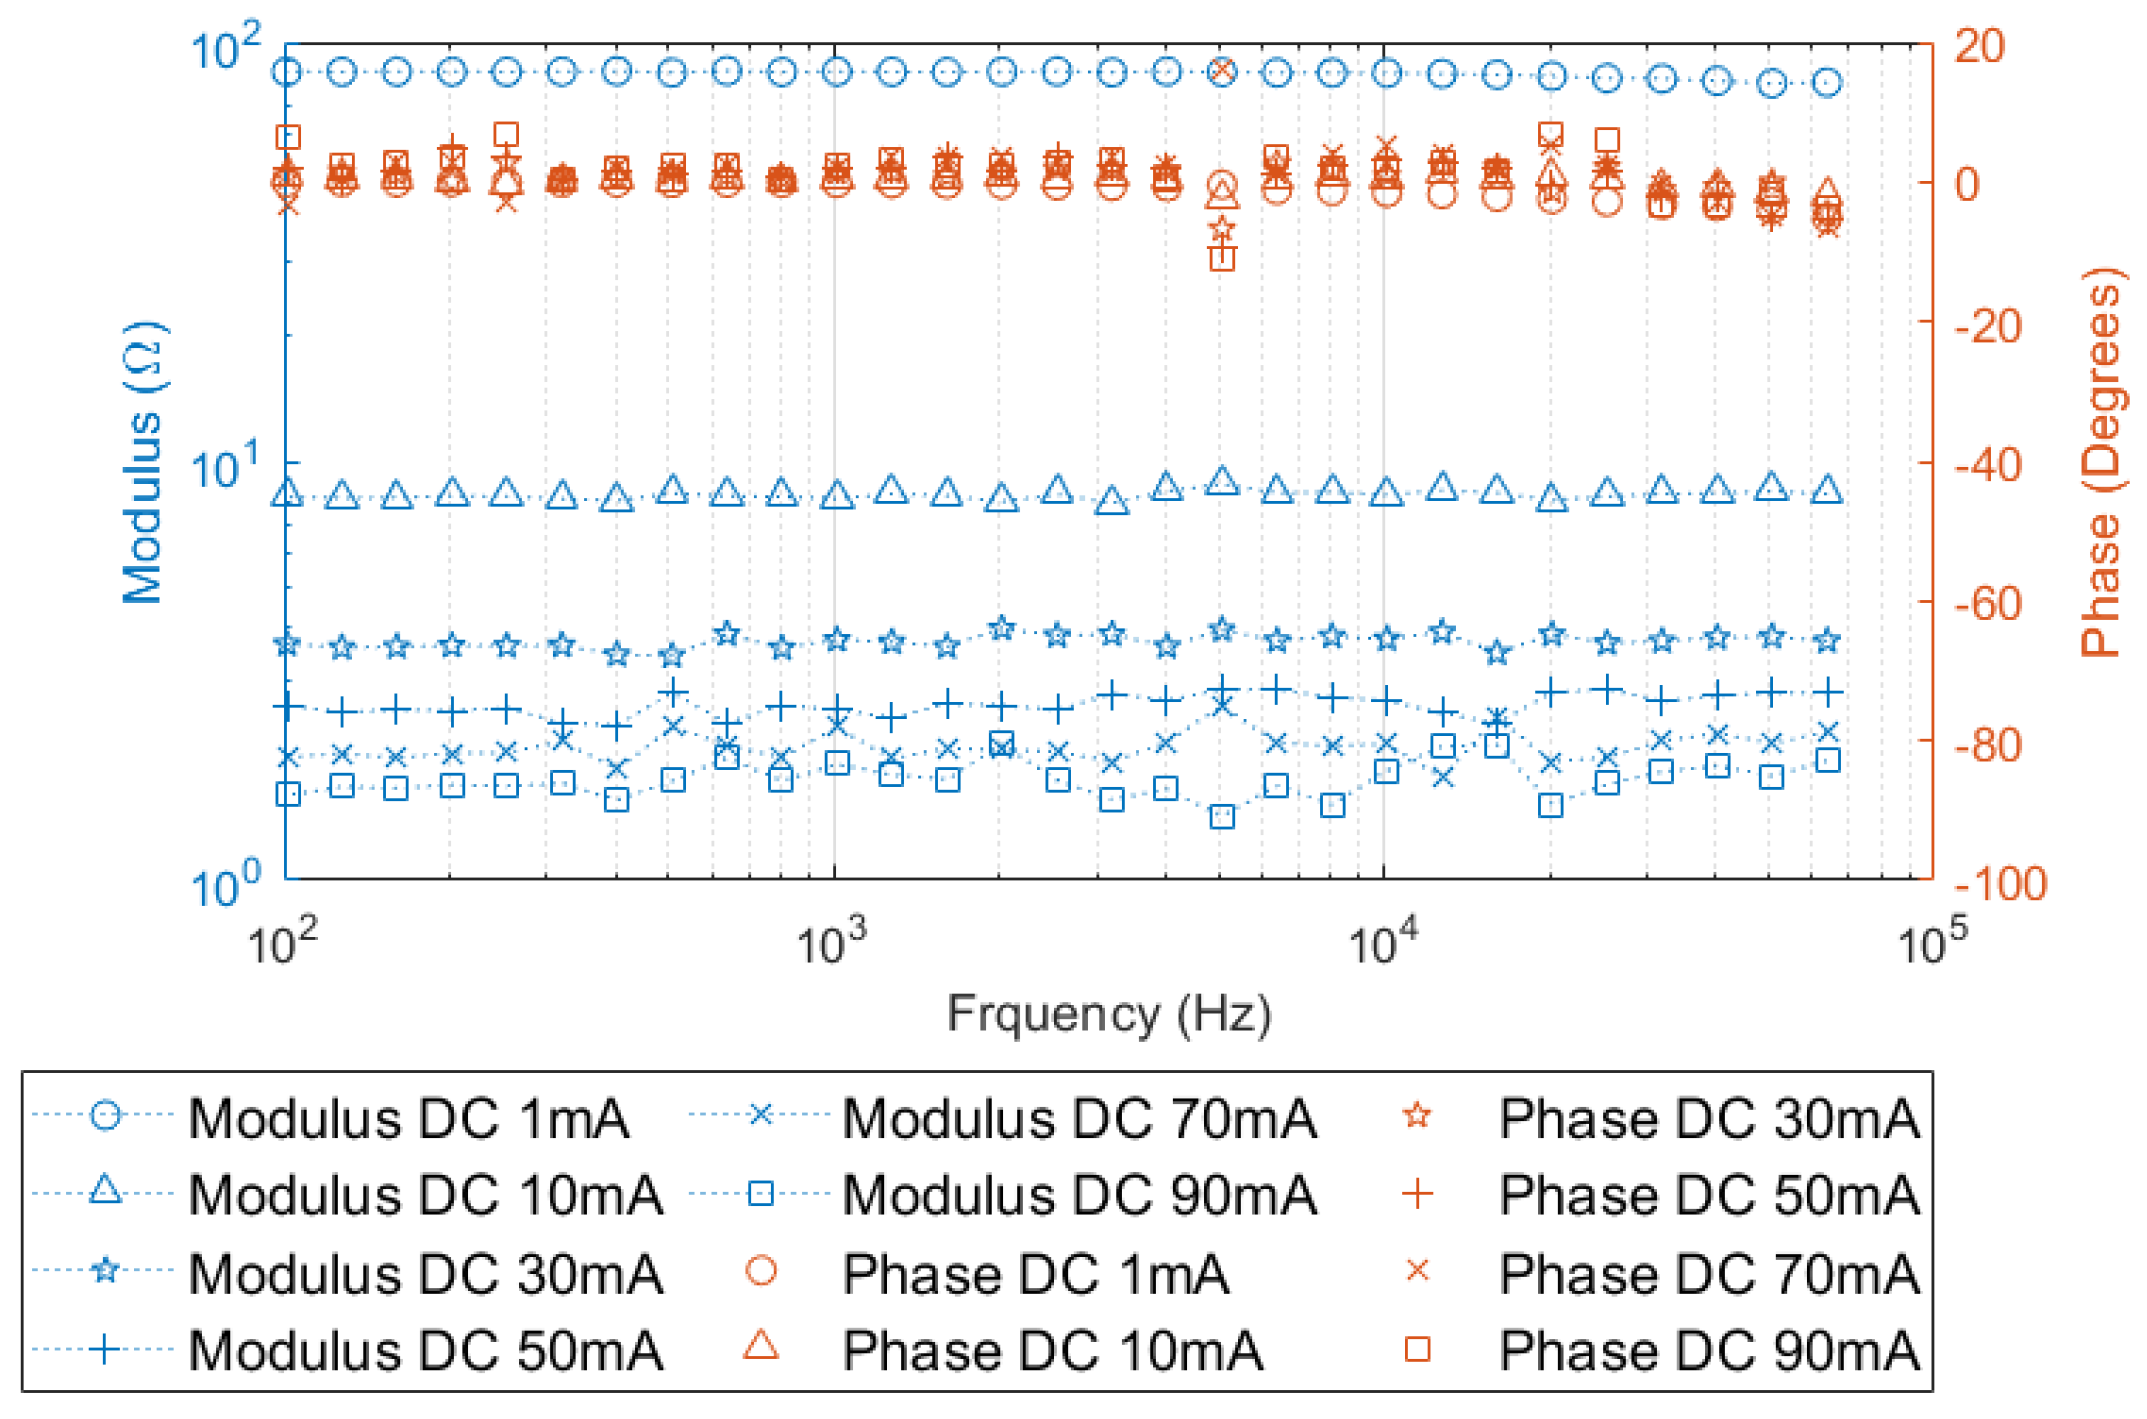
Then, the swipe is not performed in frequency but in DC bias, going from 1 to 90 mA. It is important to notice that when the impedance measured values are under 10
, the SOLARTRON 1260 analyzer can only measure up to 100 kHz; beyond this frequency, the impedance measurement has a high variation, showing peaks, and cannot be trusted. The results depicted in
Figure 5 obtained by changing the polarization current of the LED imply that the LED has a purely resistive (zero phase) behavior and corresponds to the sum of the resistances
and
as shown in
Figure 6.
It should be mentioned that
is inversely proportional to the polarization DC bias current (
Figure 7). Most importantly, it can be concluded that
is equal to a division between a constant voltage value (83.57 mV) over the LED polarization current denoted by
. Actually, the value of
can be defined as
, where
is an experimental coefficient that depends on the LED,
K is the Boltzmann constant,
T is the junction temperature, and
q is the electron charge.
The traditional measurement methodology, in this case, using a SOLARTRON 1260 analyzer for determining the electrical equivalent of the LEDs, e.g., the considered LED LXHL-BW02 is limited to frequency values below 100 kHz. Furthermore, the maximum value of polarization current that can be introduced to the LED is equal to 80 mA. Consequently, the equivalent circuit’s resistance and capacitance cannot be determined in a reliable fashion for characterizing the LEDs employed in VLC, which operates at high power and high modulation frequencies. In the following, we propose a novel methodology to characterize the LEDs’ electrical response subject to high current variation at high modulation frequencies, in the MHz range.
2.2. Impedance Measurement of the LED Using a Lock-In Amplifier
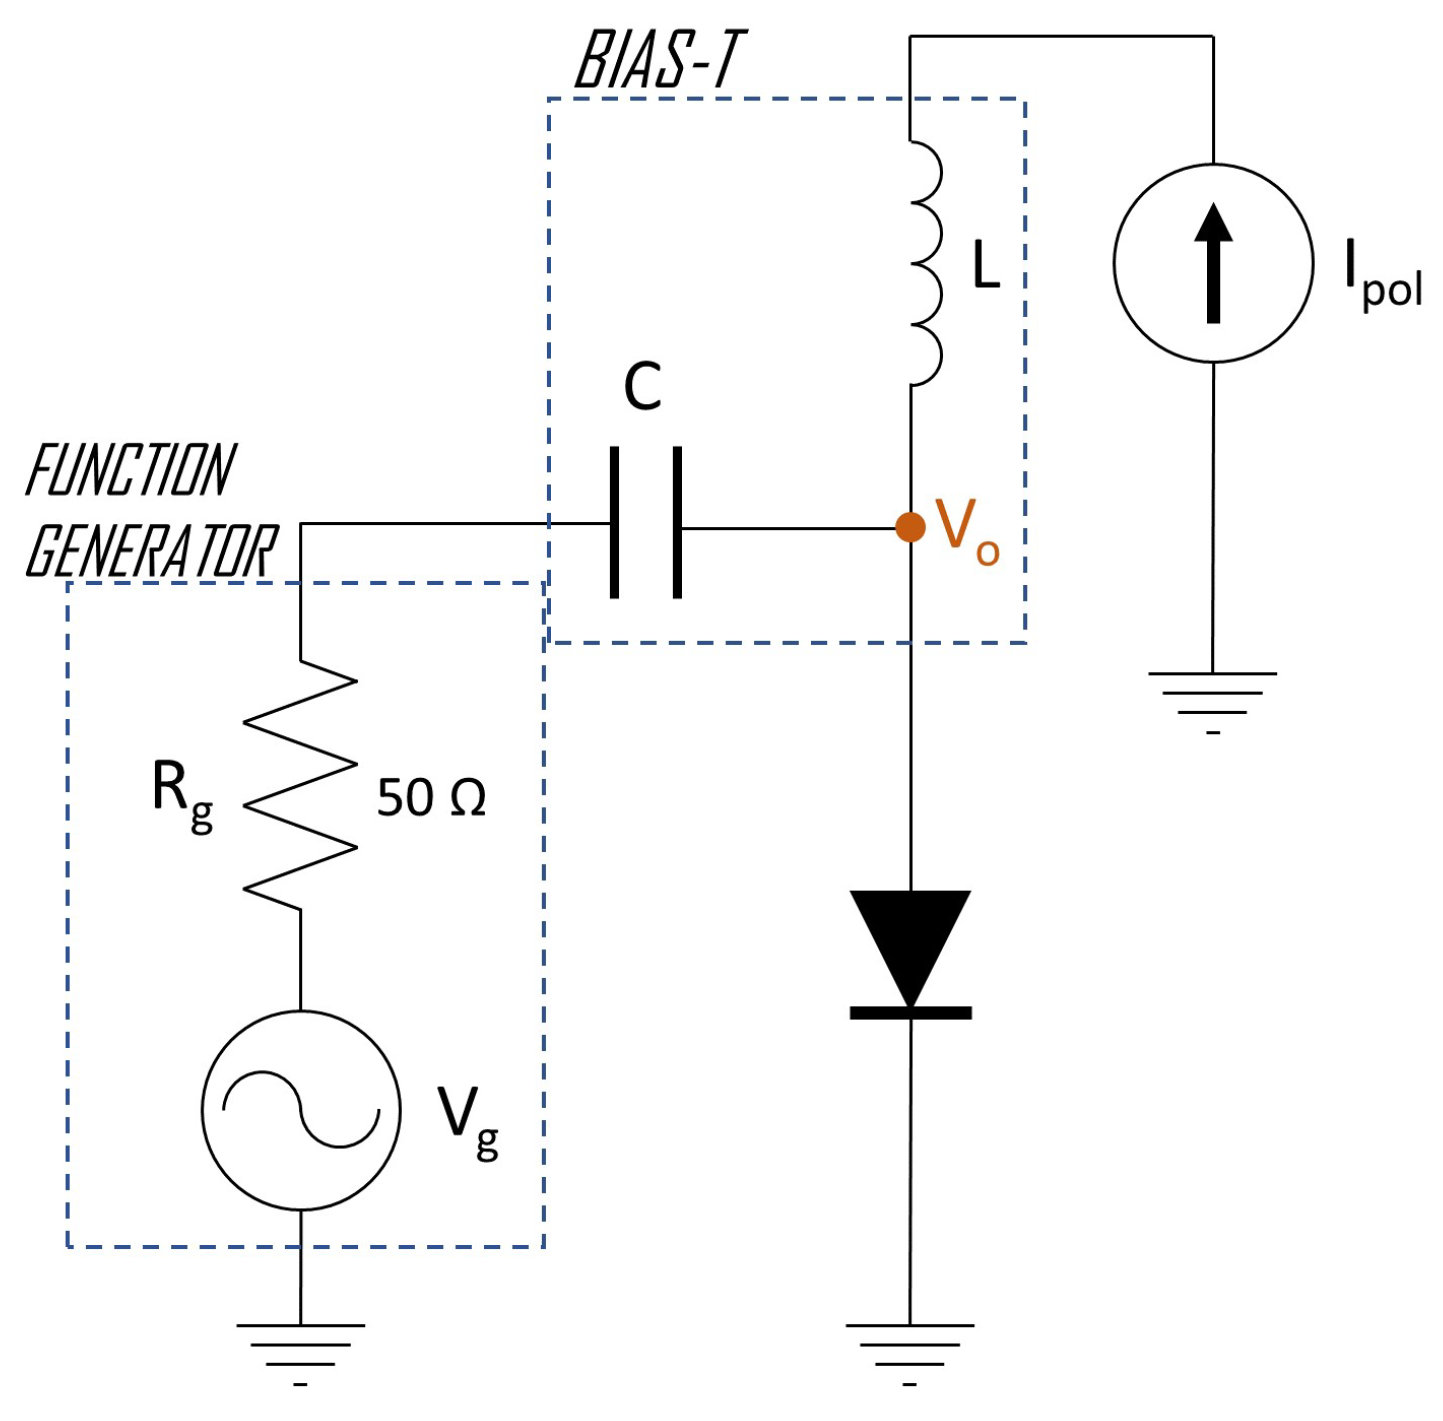
We first propose an alternative methodology for determining the electrical response of the LEDs based on the concept of a bias-tee (Bias-T) diplexer. Basically, the Bias-T allows us to configure the DC polarization point of the LED, around which the alternating current (AC) varies without affecting the performance of the DC current source and the function generator. Thus, we propose a measurement circuit, as is shown in
Figure 8. In this case, notice that the current source
controls the LED polarization point.
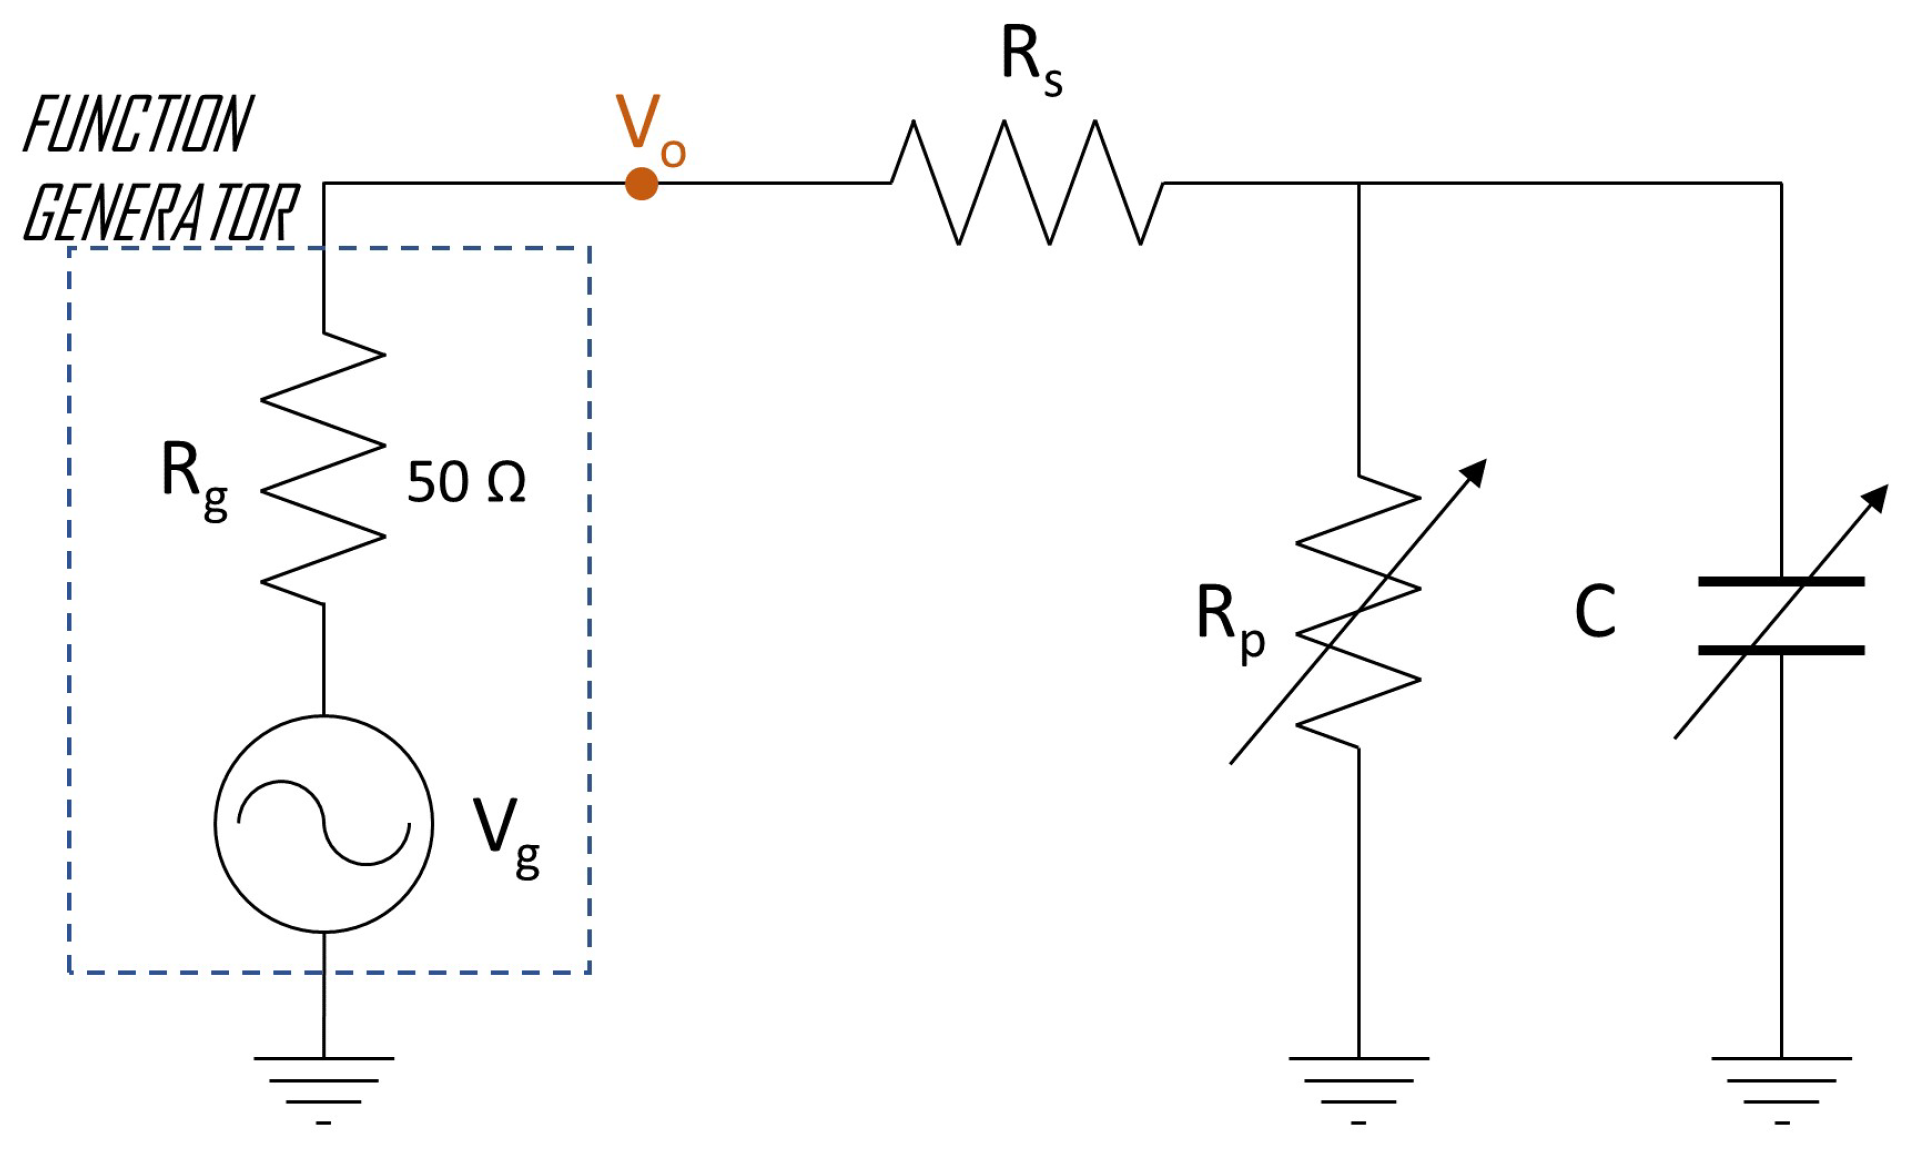
By replacing the LED with the simplified equivalent circuit (see
Figure 1), the proposed measurement circuit in the small signal is equivalent to the circuit shown in
Figure 9. As the impedance of the LED decreases while the polarization current increases, in practice, for medium-high power LEDs (typically employed in VLC applications), the value of this impedance is below 1
. As a consequence, the signal measured in the LED is extremely weak. Notice that since most of the signal intended for the LED is in fact in the generator inner resistance Rg, measuring the voltage
with an oscilloscope probe makes it such that other non-desired signals appear with power levels greater than the desired signal, and therefore, hampering to obtain a correct measurement of the electric response of the LED.
Then, we propose the use of a lock-in amplifier to measure the voltage in the above circuit. The lock-in is mostly the combination of a low-pass filter and an analog multiplier. The multiplier takes the test signal and the inner signal of the lock-in and multiplies them, then, by filtering the resulting multiplied signal, a DC equivalent value can be obtained. The low pass filter plays a key role because it has to remove or at least attenuate undesired signals (e.g., noise) while maintaining the desired signal intact. That means that the low pass filter must have an extremely narrow bandpass. Therefore, the measured signal must have the same frequency as the reference signal.
The Zurich elements lock-in amplifier HF2LI is used for this research since it provides a wide operating bandwidth (up to 50 MHz) [
28]. At first, the lock-in amplifier must be calibrated to obtain feasible measures, and this is achieved by substituting the LED (see
Figure 8 and
Figure 9) with a short resistance value. More precisely, resistance values of 0.25
, 0.5
and 1
are considered in this work. Those resistances are close to the ones expected from the LED equivalent circuit and allow the identification of the lock-in typical voltage values at the different know resistance values.
For the LED LXHL-BW02 considered in this work, the measures collected using the lock-in amplifier proposed method are depicted in
Figure 10. For these measurements, the current polarization shift used to obtain the impedance of the LED varies from 8.6 mA to 210 mA. It is worth recalling that 210 mA corresponds to an average operation forward current of the LED LXHL-BW02. It can be seen that, as occurs with the measurements obtained with the SOLARTRON 1260 analyzer, the value of the resistance
is inversely proportional to the polarization current. For current values over 160 mA, the value of the series resistance is 0.83
, and therefore, the value of the resistance
corresponds to a very small value. In comparison, the obtained resistance value is like the one obtained using the impedance analyzer.
Thus, for signals with a frequency beyond 1 MHz, i.e., for a modulation bandwidth greater than this value in VLC, the response of the LED is determined not only by the resistance factor, but the capacitance also affects its response. Moreover, the phase obtained in the lock-in amplifier is not zero. The equation that models the resulting capacitance value is the following:
where
is the value of the measured impedance obtained through the lock-in amplifier at frequency
. In this case, the capacitance response of the LED LXHL-BW02 is appreciable for frequencies below 1 MHz. Notice that the phase measured at the lock-in amplifier corresponds to a non-zero value.
The modulus of the impedance is measured, polarizing the LED with a current of 16 mA at a frequency of 10 MHz. Even when the polarization current affects the capacitance value, as the current values are relatively small for this experiment, it is assumed that the capacitance value will remain constant and approximately equal to 5.02 nF within the employed current range.
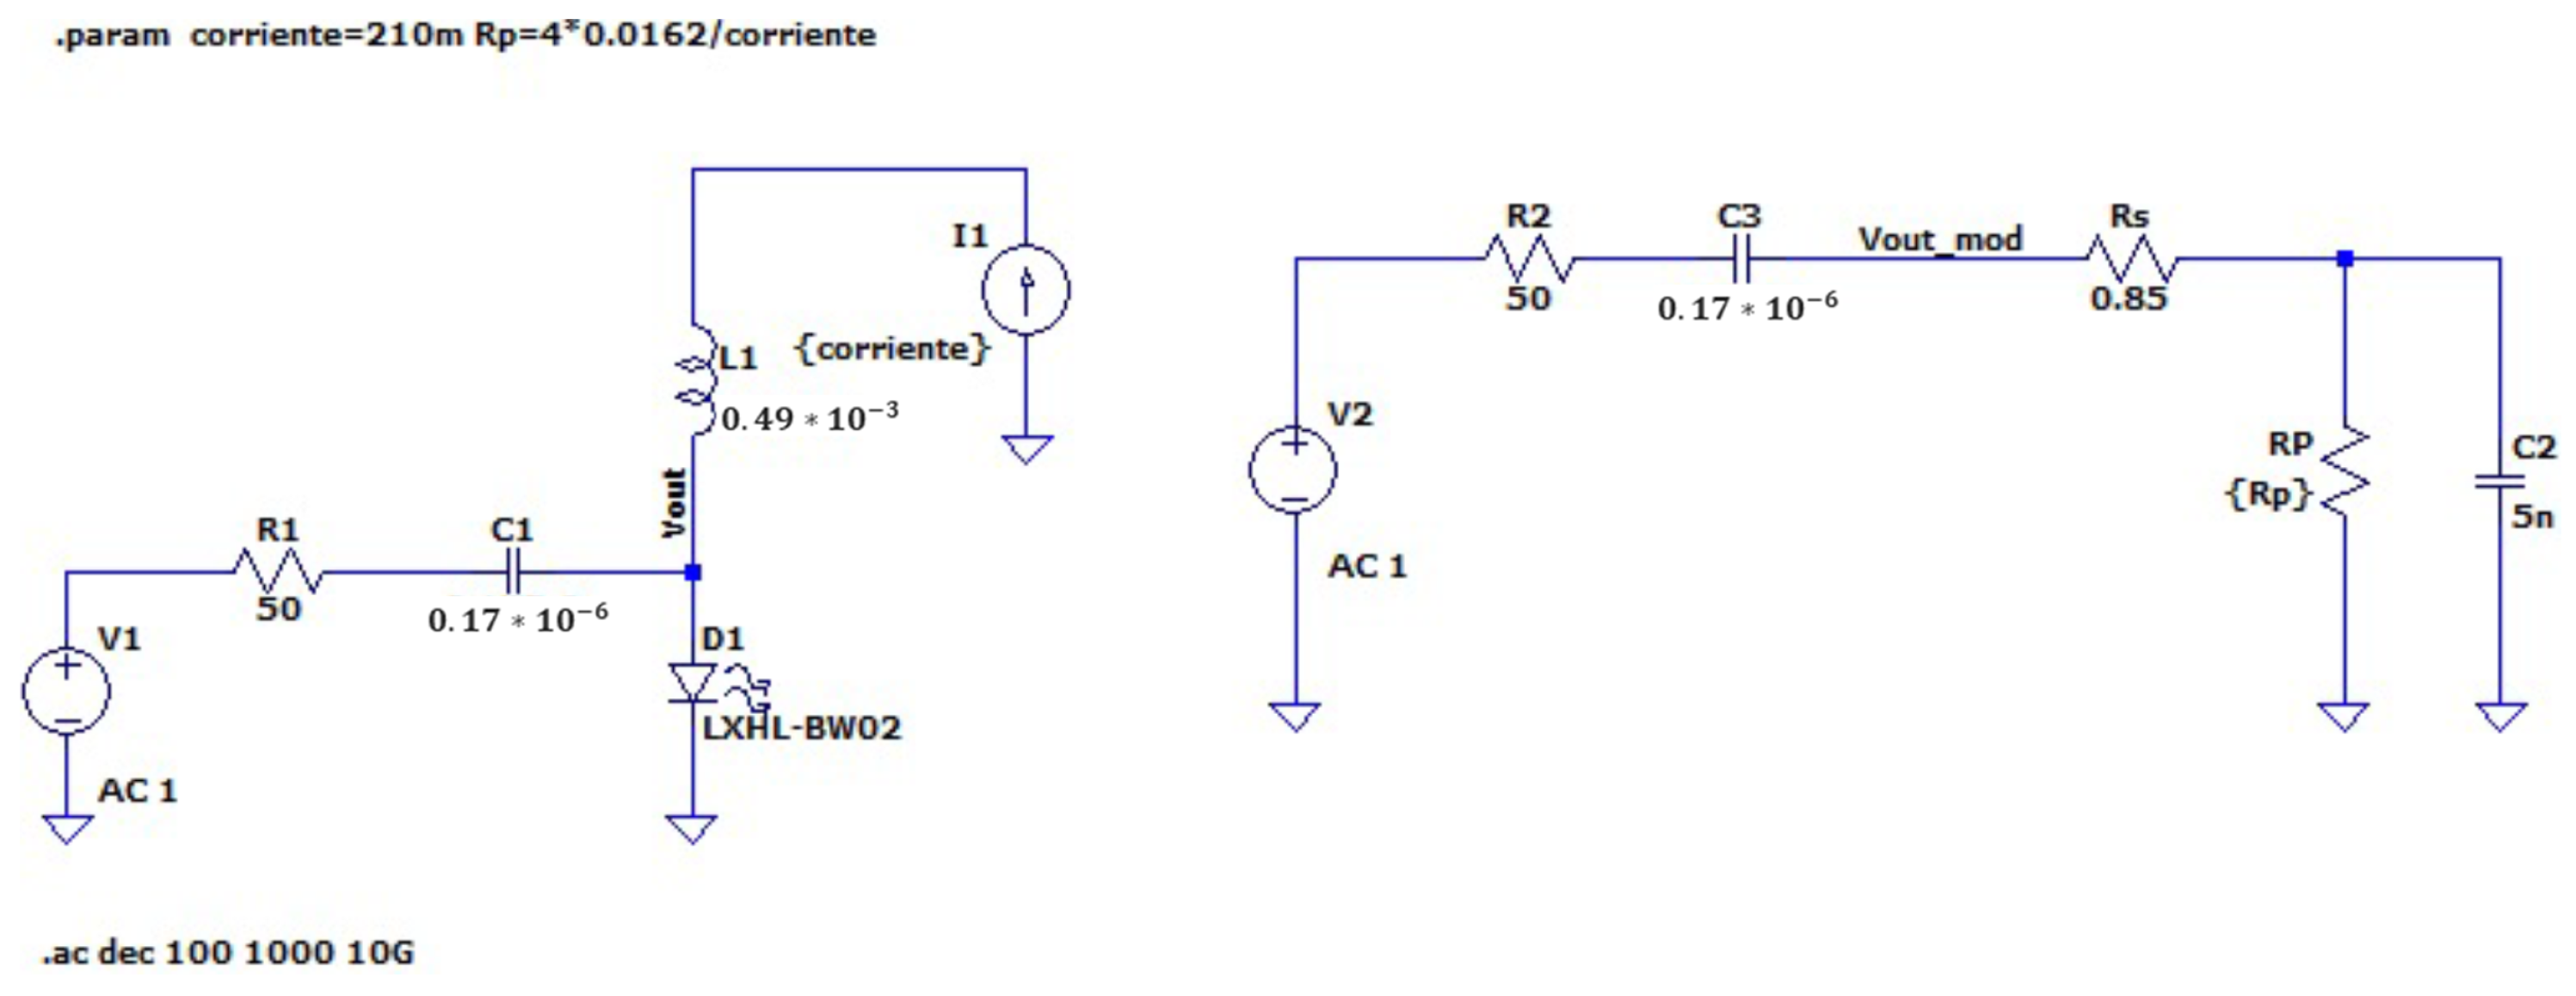
3. Resulting Electrical Equivalent Circuit
The obtained results are validated using software simulations. In this sense, the electronic circuits depicted in
Figure 8 and
Figure 9 are simulated using LTSPICE software. It is worth remarking that the selection of the LXHL-BW02 is significant since the libraries of this specific LED are available in LTS-SPICE, which does not occur for most of the medium-high power LEDs. Therefore, the results obtained through simulations can be compared with the resulting equivalent circuit obtained with the lock-in amplifier proposed methodology as shown in
Figure 11.
The simulations consider a frequency sweep from 1 kHz to 1 GHz.
Figure 12 (polarization current of 210 mA) and
Figure 13 (polarization current of 16 mA) compare the frequency response obtained for both
and
. These current values were selected following the LED parameters stated in
Table 1. Furthermore, it is worth noticing that analyzing
Figure 11, the following equation can be determined:
where
and
Checking these equations and also the simulation results, we can conclude that, in frequency, the signal generator output resistance creates a zero very close to the right-hand of the pole. Because of the influence of this pole, the gain suffers a significant reduction, remaining constant at the frequency of the zero.
Figure 12 and
Figure 13 show the measured frequency response of the considered high-power LEDs. It can be seen that the available modulation bandwidth is constant from 100 kHz to 10 MHz, approximately. This bandwidth is large enough for most of the applications in 6G. Recall that the use of signal processing techniques increases the spectral efficiency of this bandwidth. However, notice that the phase is clearly not linear within the constant bandwidth. Consequently, the implementation of signal processing techniques requires to implement a pre-distortion or an equalizer stage to exploit the modulation bandwidth of the high-power LEDs. In this sense, the methodology proposed in this work allows us to determine the electronic equivalent of the high-power LEDs, which is the first step for implementing pre-distortion or equalizer stages that overcome the non-linear or frequency selective response of the high-power LEDs.
4. Conclusions
High-power LEDs have their equivalent impedance decreased during the current rise. As these components operate with high currents, their equivalent impedance is around a few ohms, resulting in several hurdles in order to measure them by using “classical” measurement devices, such as LCR meters or impedance analyzers.
Traditional impedance analyzers have limitations in both the measurement bandwidth and the current that can be supplied to the measured component (load). Notice that these analyzers are mainly conceived to measure passive components or components with low polarization current.
A novel alternative method to measure the dynamic behavior of high-power LEDs and then define their equivalent circuit is proposed. The use of a Bias-T circuit for determining the LED equivalent circuit is proposed. However, it is shown that the use of a Bias-T to polarize the LED is not the most convenient approach, and it is because of a large part of the signal that falls into the Bias-T internal impedance.
By using a lock-in amplifier, we have enough room to characterize the capacitance and resistance of the LED equivalent circuit, as impedance measurements can be performed up to 50 MHz.
The resulting equivalent circuit allows simulating the electrical behavior of any high-power LED. In the case of this paper, the response of the resulting equivalent circuit is compared with the spice model of the LED LXHL-BW02, obtaining an equal frequency behavior (
Figure 12 and
Figure 13). As most of the high-power white LEDs do not have a frequency spice model, the equivalent circuit is the only way to analyze the frequency response of those LEDs.
By increasing the LEDs’ polarization current, the value of Rp decreases, and then, the electrical bandwidth of LEDs is increased (
Figure 5). Therefore, as the LED optical bandwidth does not reach such frequencies, it can be said that the LEDs bandwidth limitation is not electrical but optical. It may imply that using an equalization circuit on the transmitter side is not the optimal approach. A blue optical filter can increase the bandwidth of the white LED, although it considerably reduces the optical power received [
29]. In addition, the use of advanced modulation techniques for high data rate VLC transmission could improve the efficiency of the channel [
30].


 ,
, 


