
Low-Cost Data Acquisition System for Solar Thermal Collectors


Abstract
:1. Introduction
2. Components Selection
- 1.
- Cost-effectiveness: hardware cost should be as low as possible, without compromising the reliability or the quality of the measurements.
- 2.
- Availability: it should be composed of off-the-shelf components, instead of specialized devices.
- 3.
- Versatility: the system should should provide interfacing options for sensors selected according to the ISO 9806:2017 criteria, as well as for lower-spec sensors.
- 1.
- Reliability: the software should rely on already proven components and communication protocols.
- 2.
- Cost-effectiveness: should be open source.
- 3.
- Data accessibility: real-time visual inspection of measurement data should be provided. Data access should be easy both for programmers and for end users with no programming skills.
- 4.
- Easy maintenance: should be easy to maintain with minimal coding.
- 5.
- Scalability: should be able to support a large number of measurement nodes.
- 6.
- Versatility: should serve as infrastructure for different measurement node types, both centralized and decentralized.
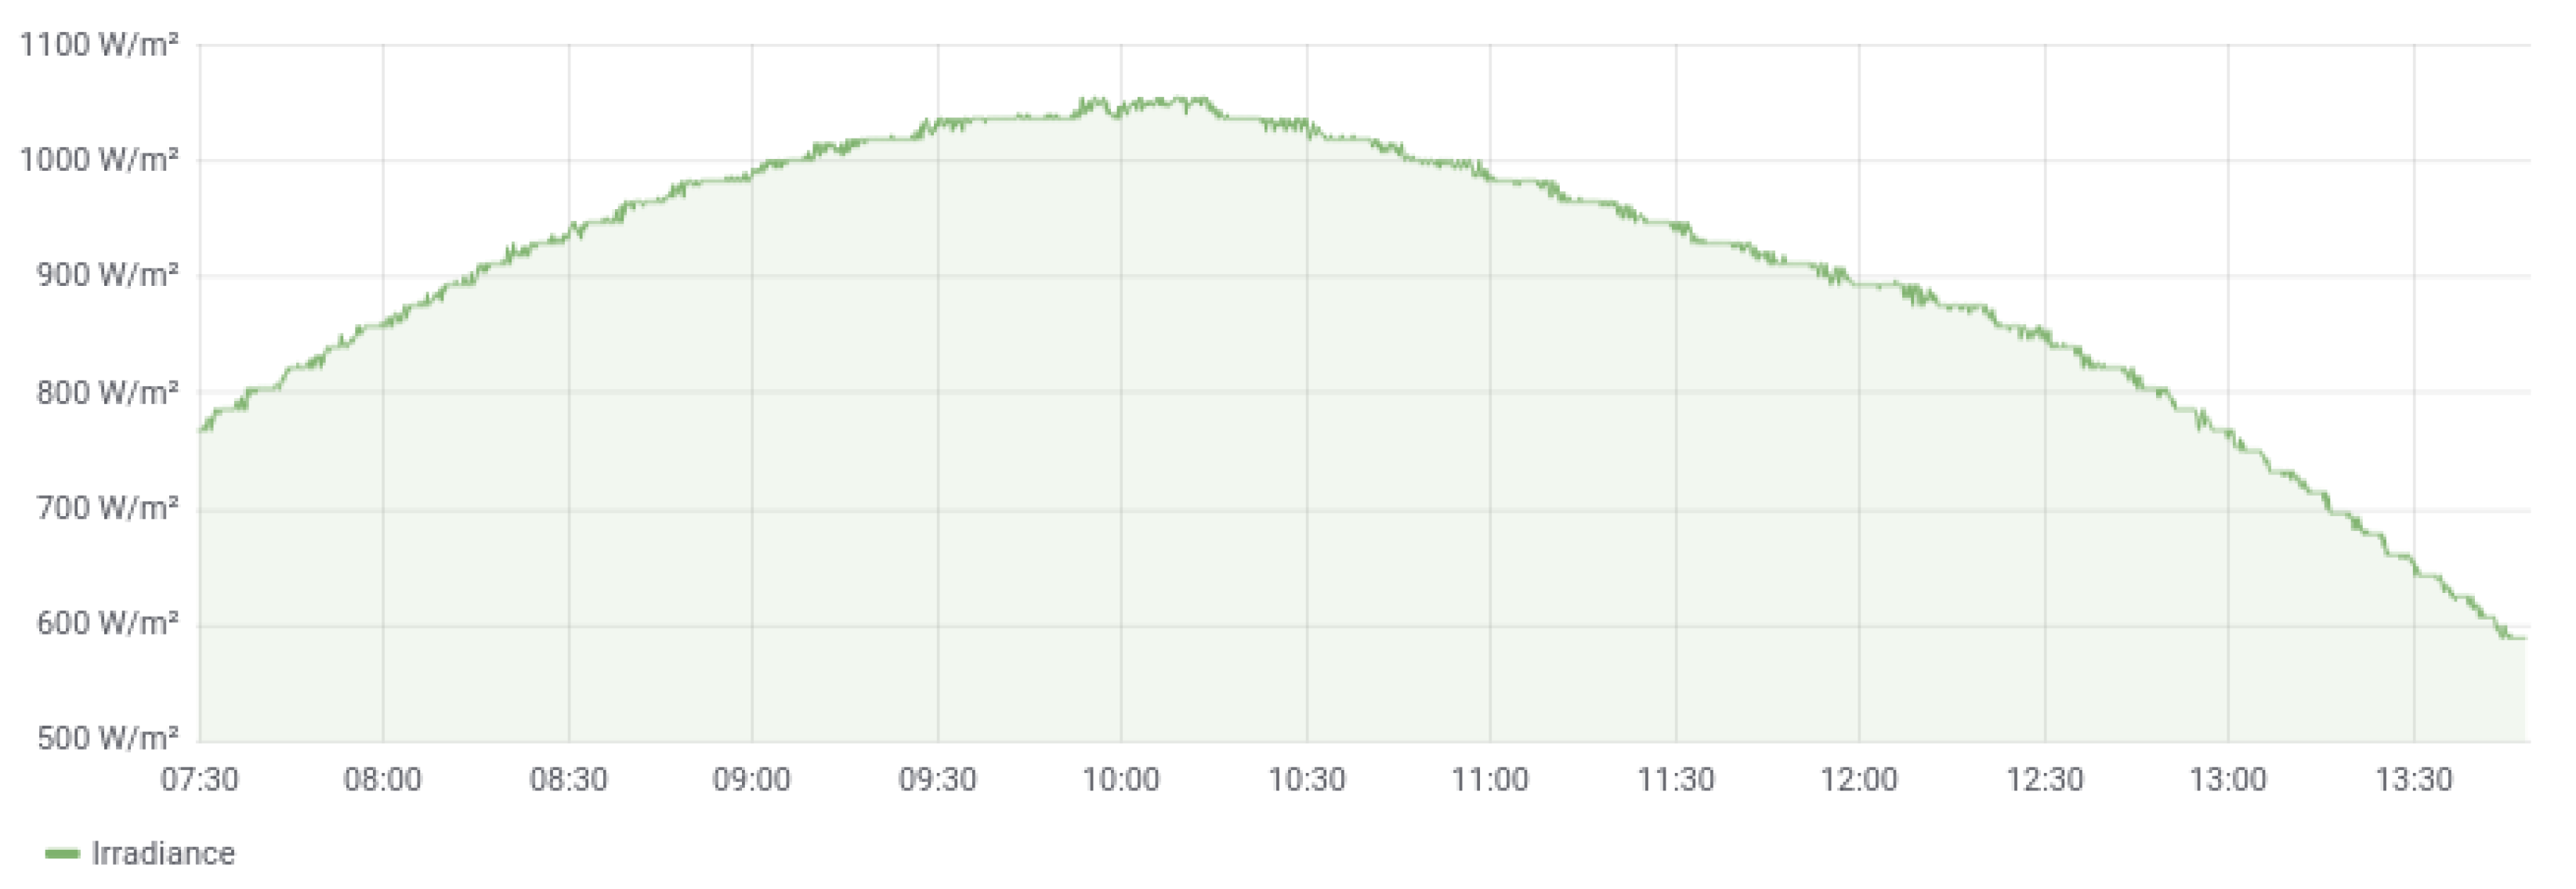
2.1. Irradiance
2.2. Temperature
2.3. Mass Flow
2.4. Relative Humidity
2.5. Wind Speed
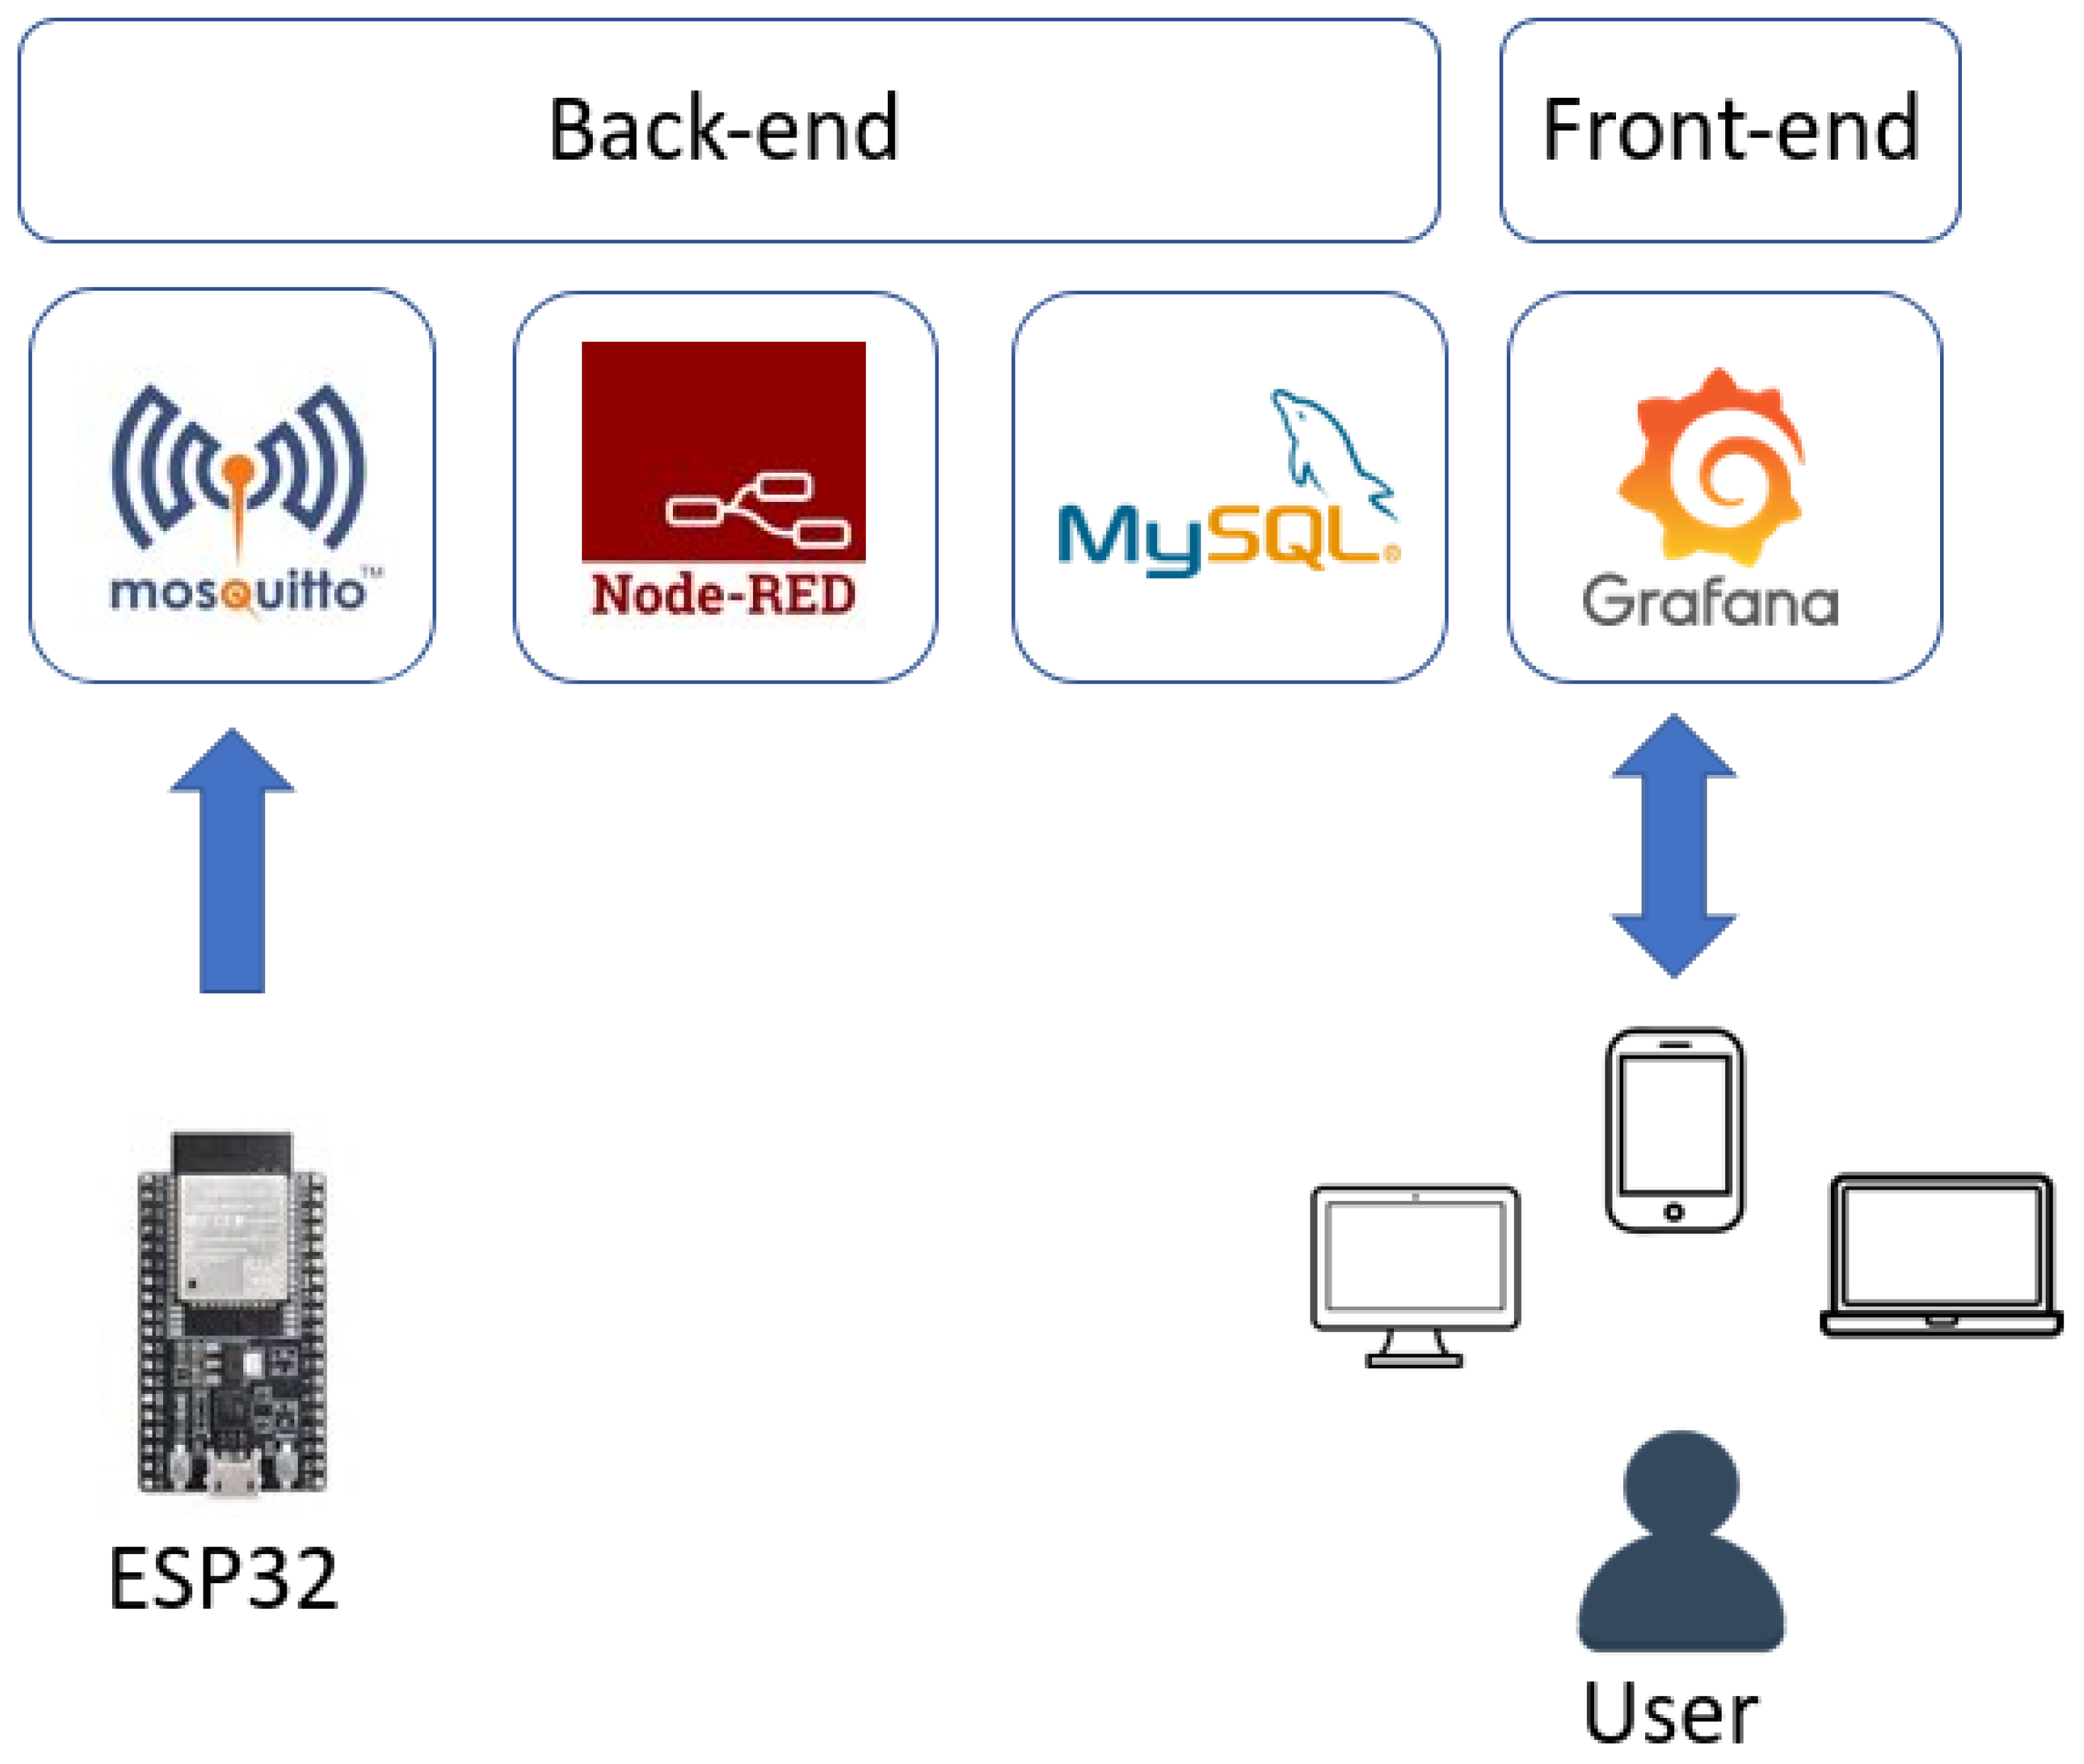
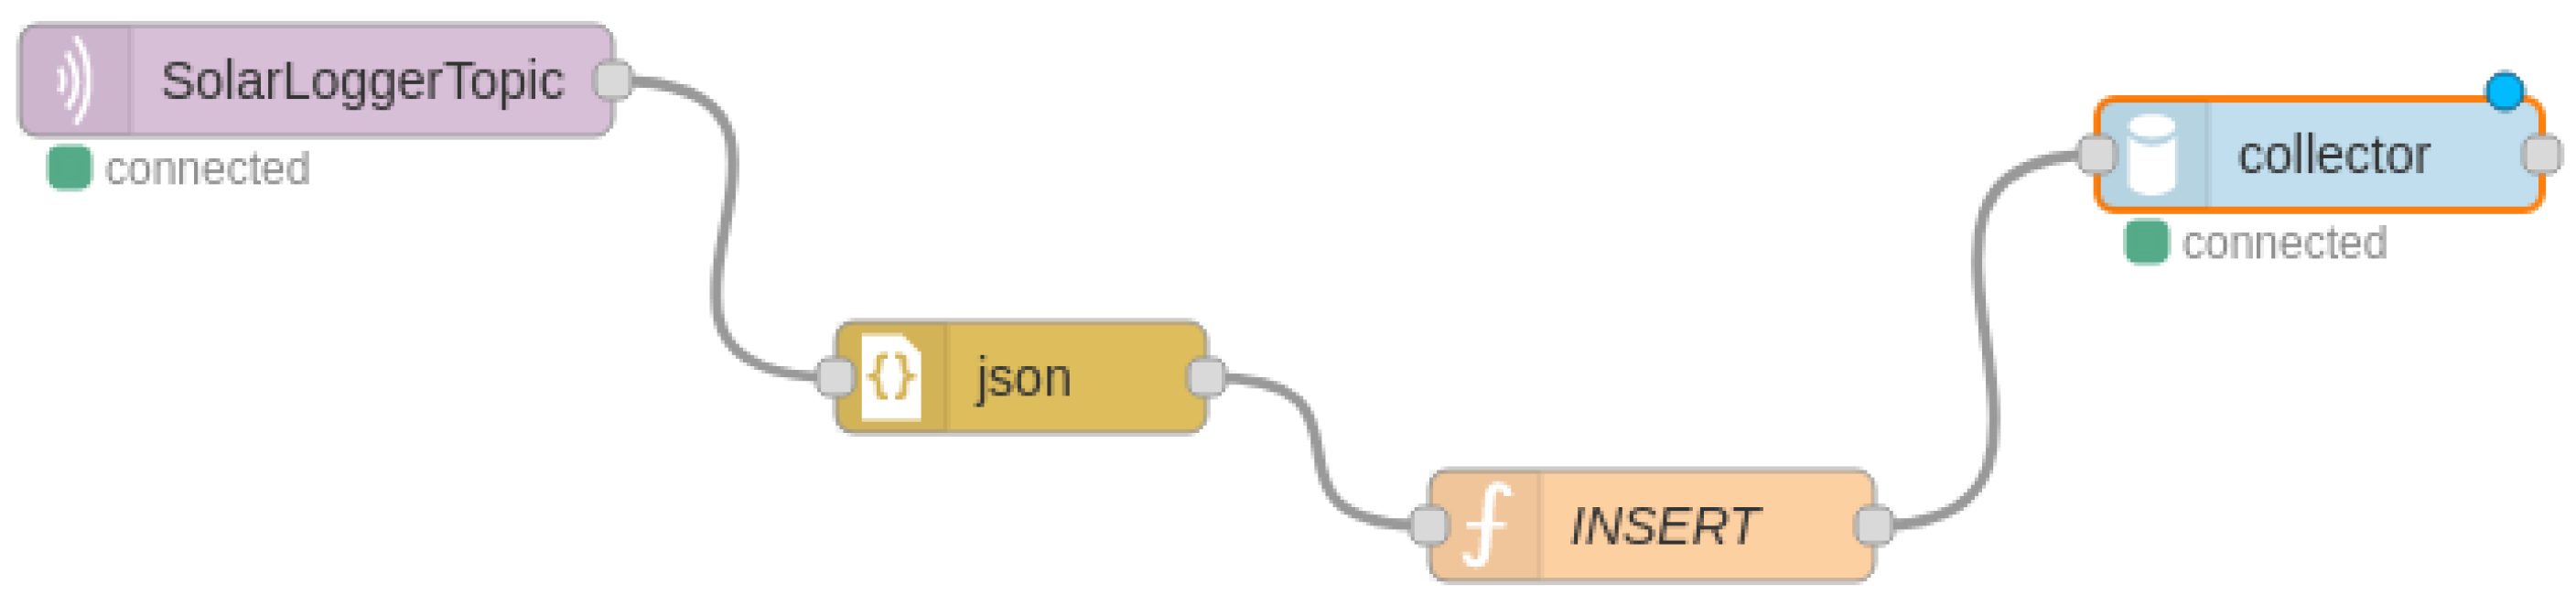
3. Application Architecture
| Listing 1. docker-compose.yml file example. |
  mysql:
    container_name: mysql_container
    image: mysql:latest
    ports:
     - 3360:3306
    volumes:
     - ./volumes/mysql/data:/var/lib/mysql
    networks:
      solar_network:
        ipv4_address: 172.20.0.2
  node-red:
    container_name: nodered_container
    image: nodered/node-red:latest
    ports:
      - 1880:1880
    volumes:
      - ./volumes/node-red:/data
    networks:
      solar_network:
        ipv4_address: 172.20.0.3
networks:
  solar_network:
    ipam:
      config:
        - subnet: 172.20.0.0/24
|
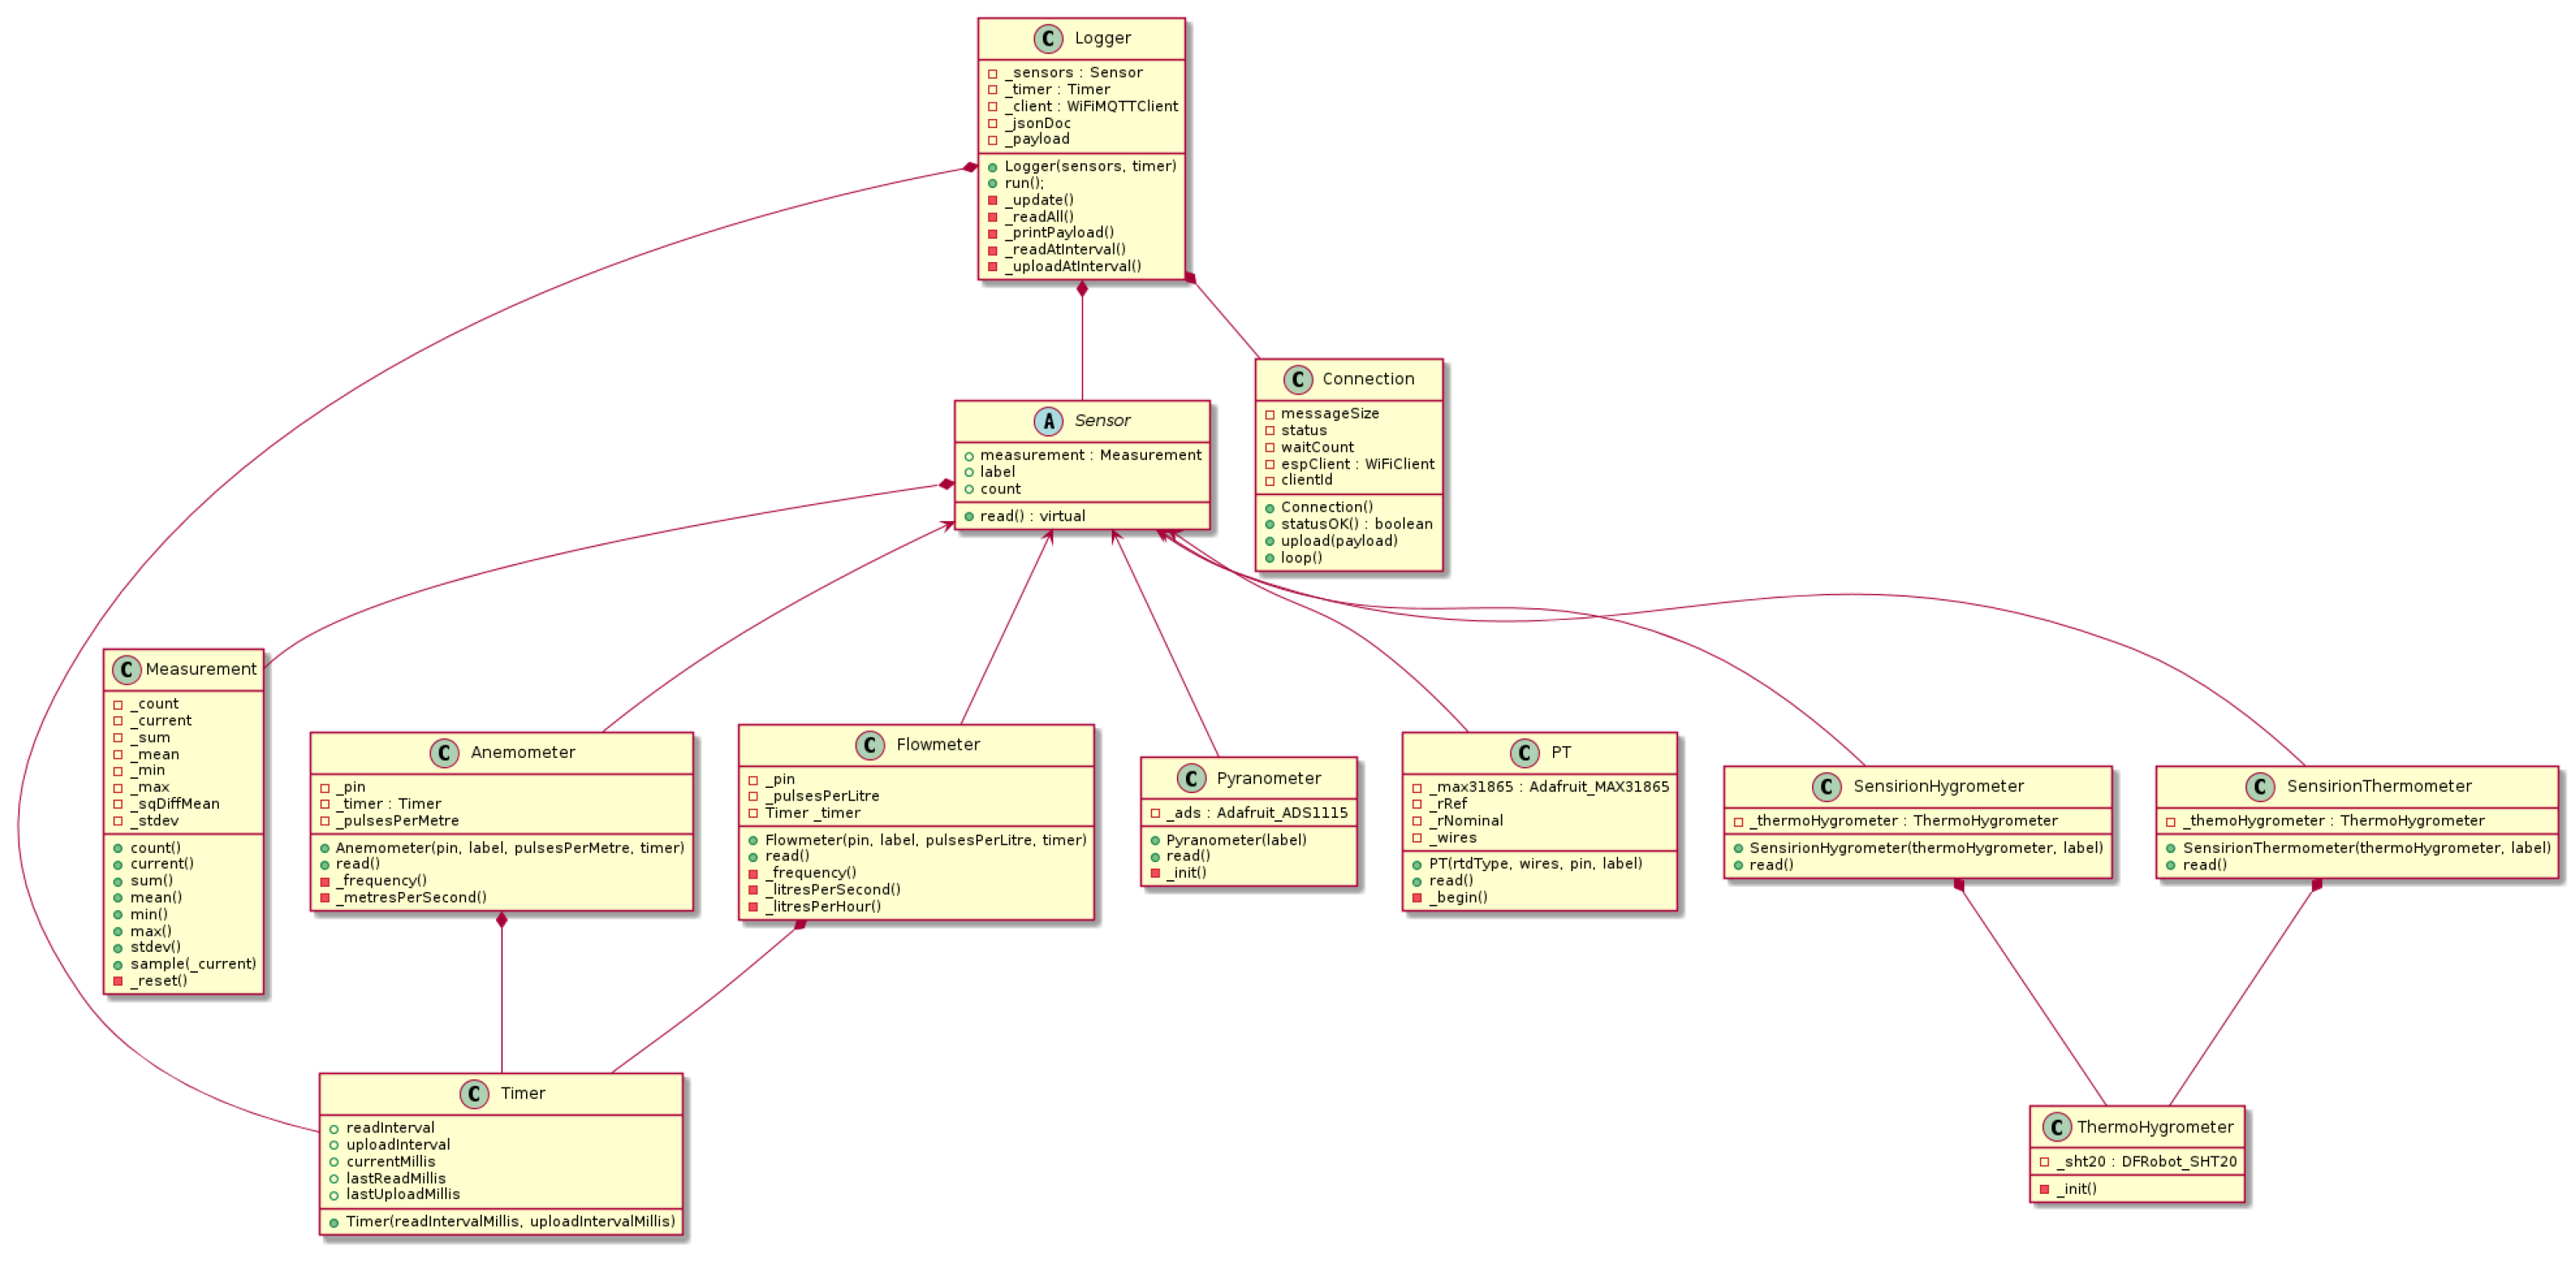
| Listing 2. main.cpp file example. |
| Sensor *sensors[] = { |
| new PT(1000, FOUR_WIRE, 26, "Tenv"), |
| new PT(100, FOUR_WIRE, 27, "Tout"), |
| new PT(100, FOUR_WIRE, 14, "Tin"), |
| new Pyranometer("Irr"), |
| new Anemometer(12, "Wind", 1.25, &timer), |
| new Flowmeter(13, "Flow", 1800, &timer), |
| }; |
| Logger logger(sensors, &timer, len(sensors)); |
| void setup() |
| { |
| Serial.begin(115200); |
| } |
| void loop() |
| { |
| logger.run(); |
| } |
4. Methodology
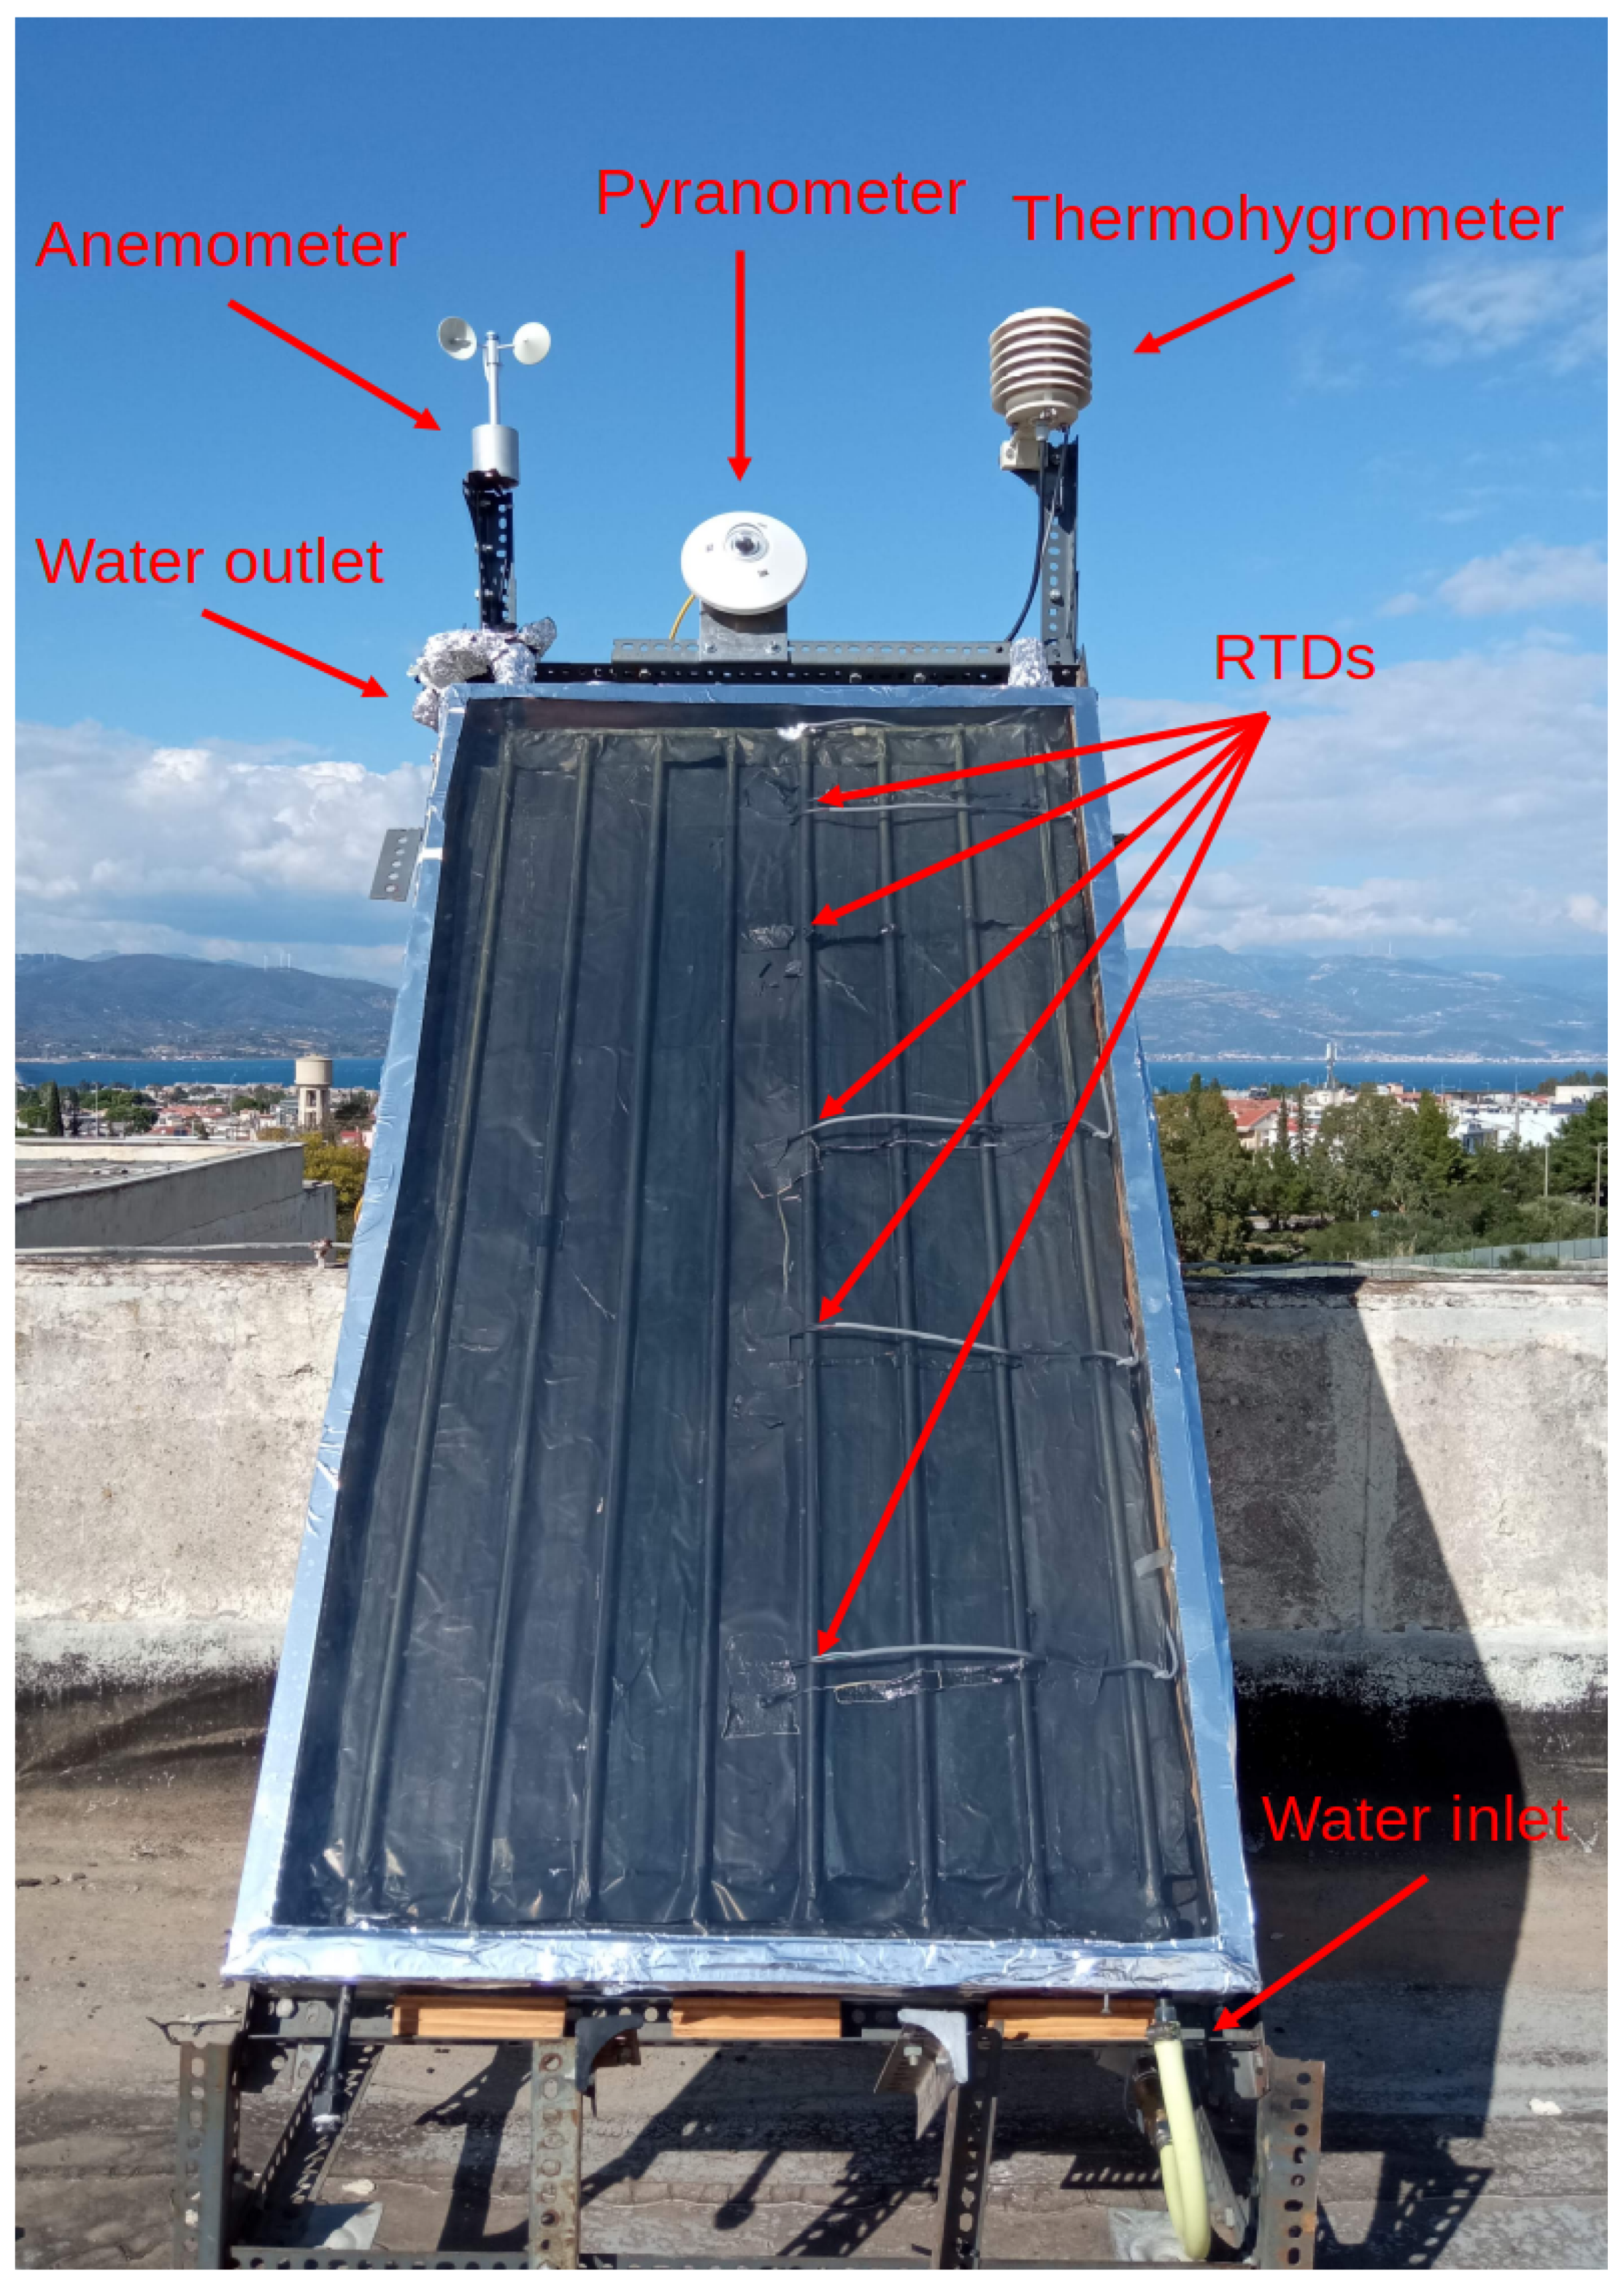
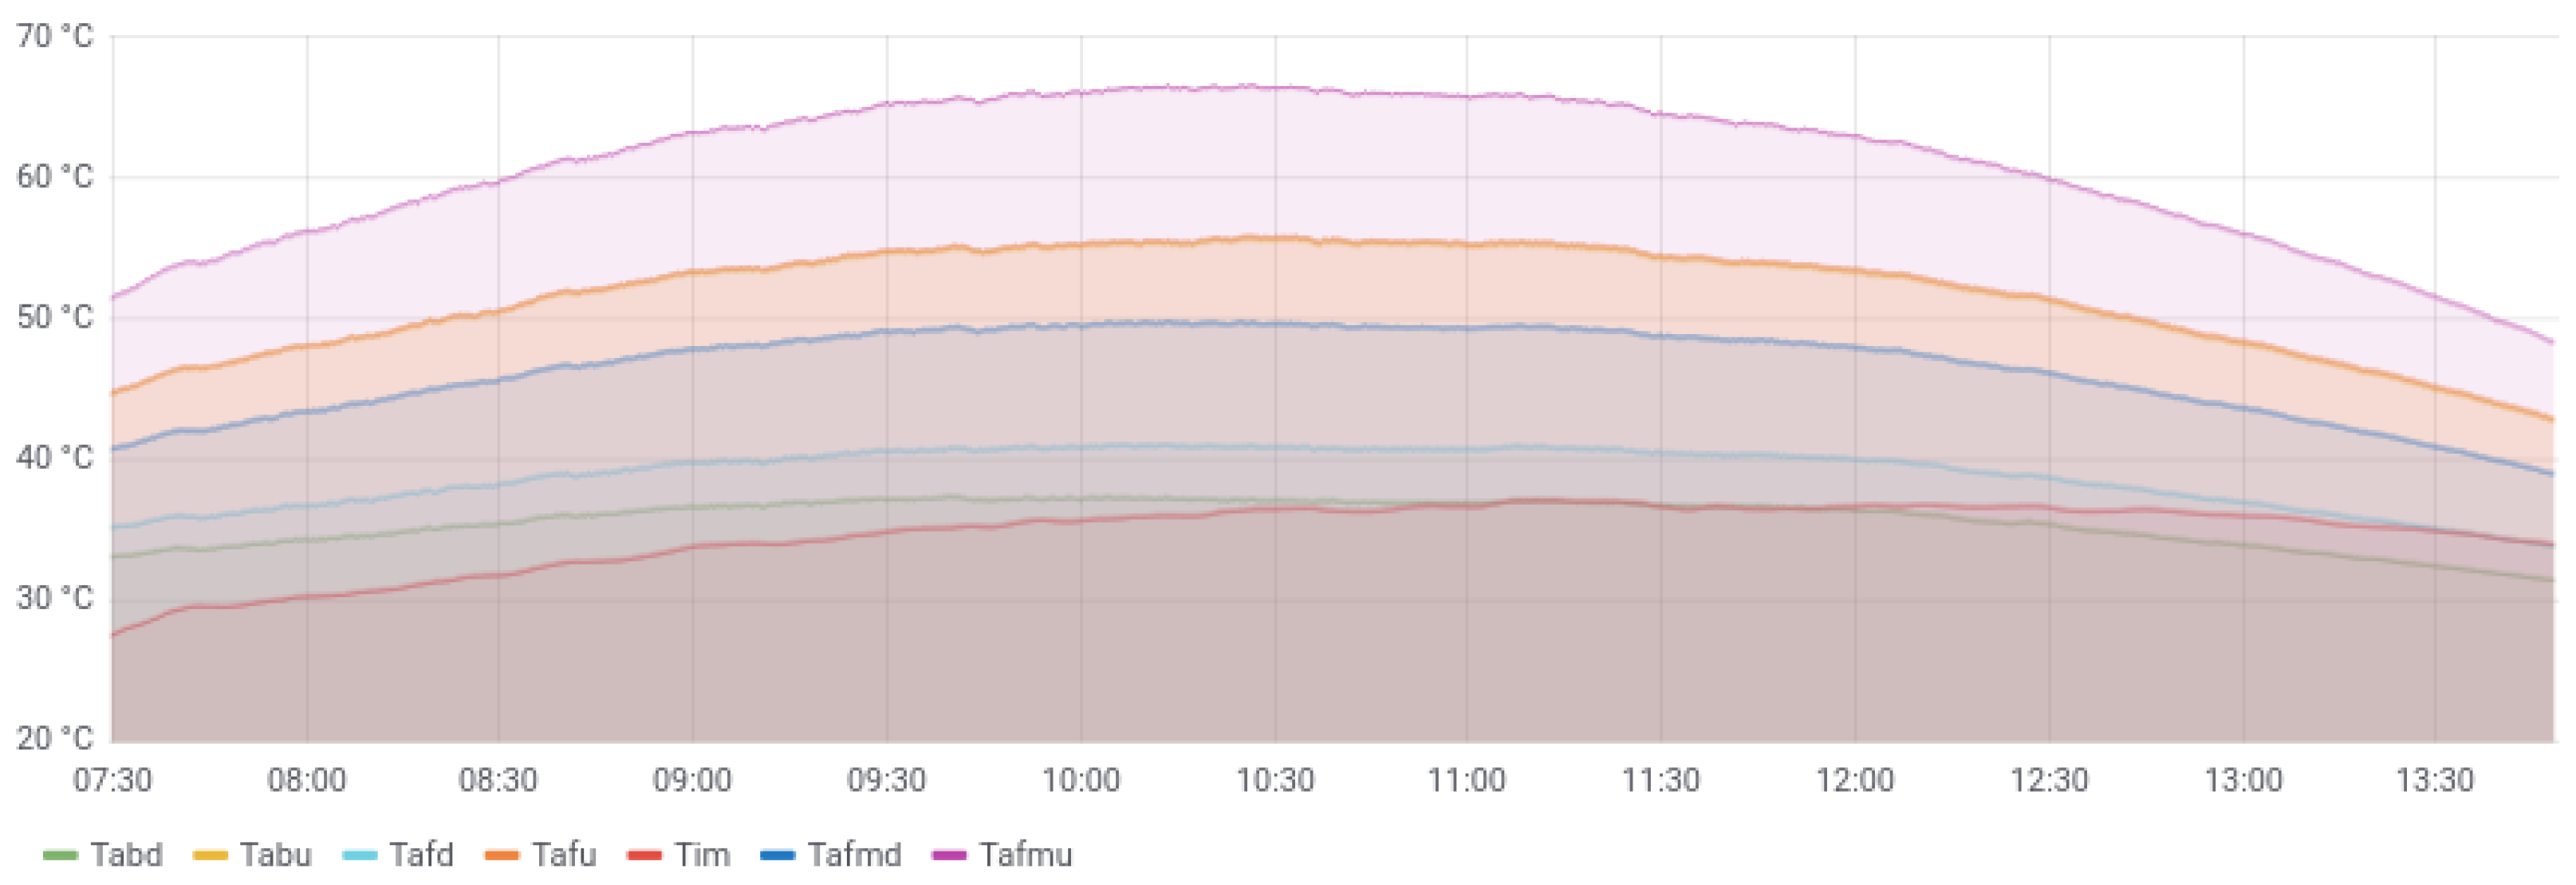
Experimental Setup
- two RTDs were placed in the water inlet and outlet tubes, labeled and ;
- one RTD inside a radiation shield to measure ambient temperature, labeled ;
- six RTDs were attached on the absorber’s surface, four on the front (facing the sun) and two on the back;
- one RTD was placed inside the insulation layer behind the absorber.
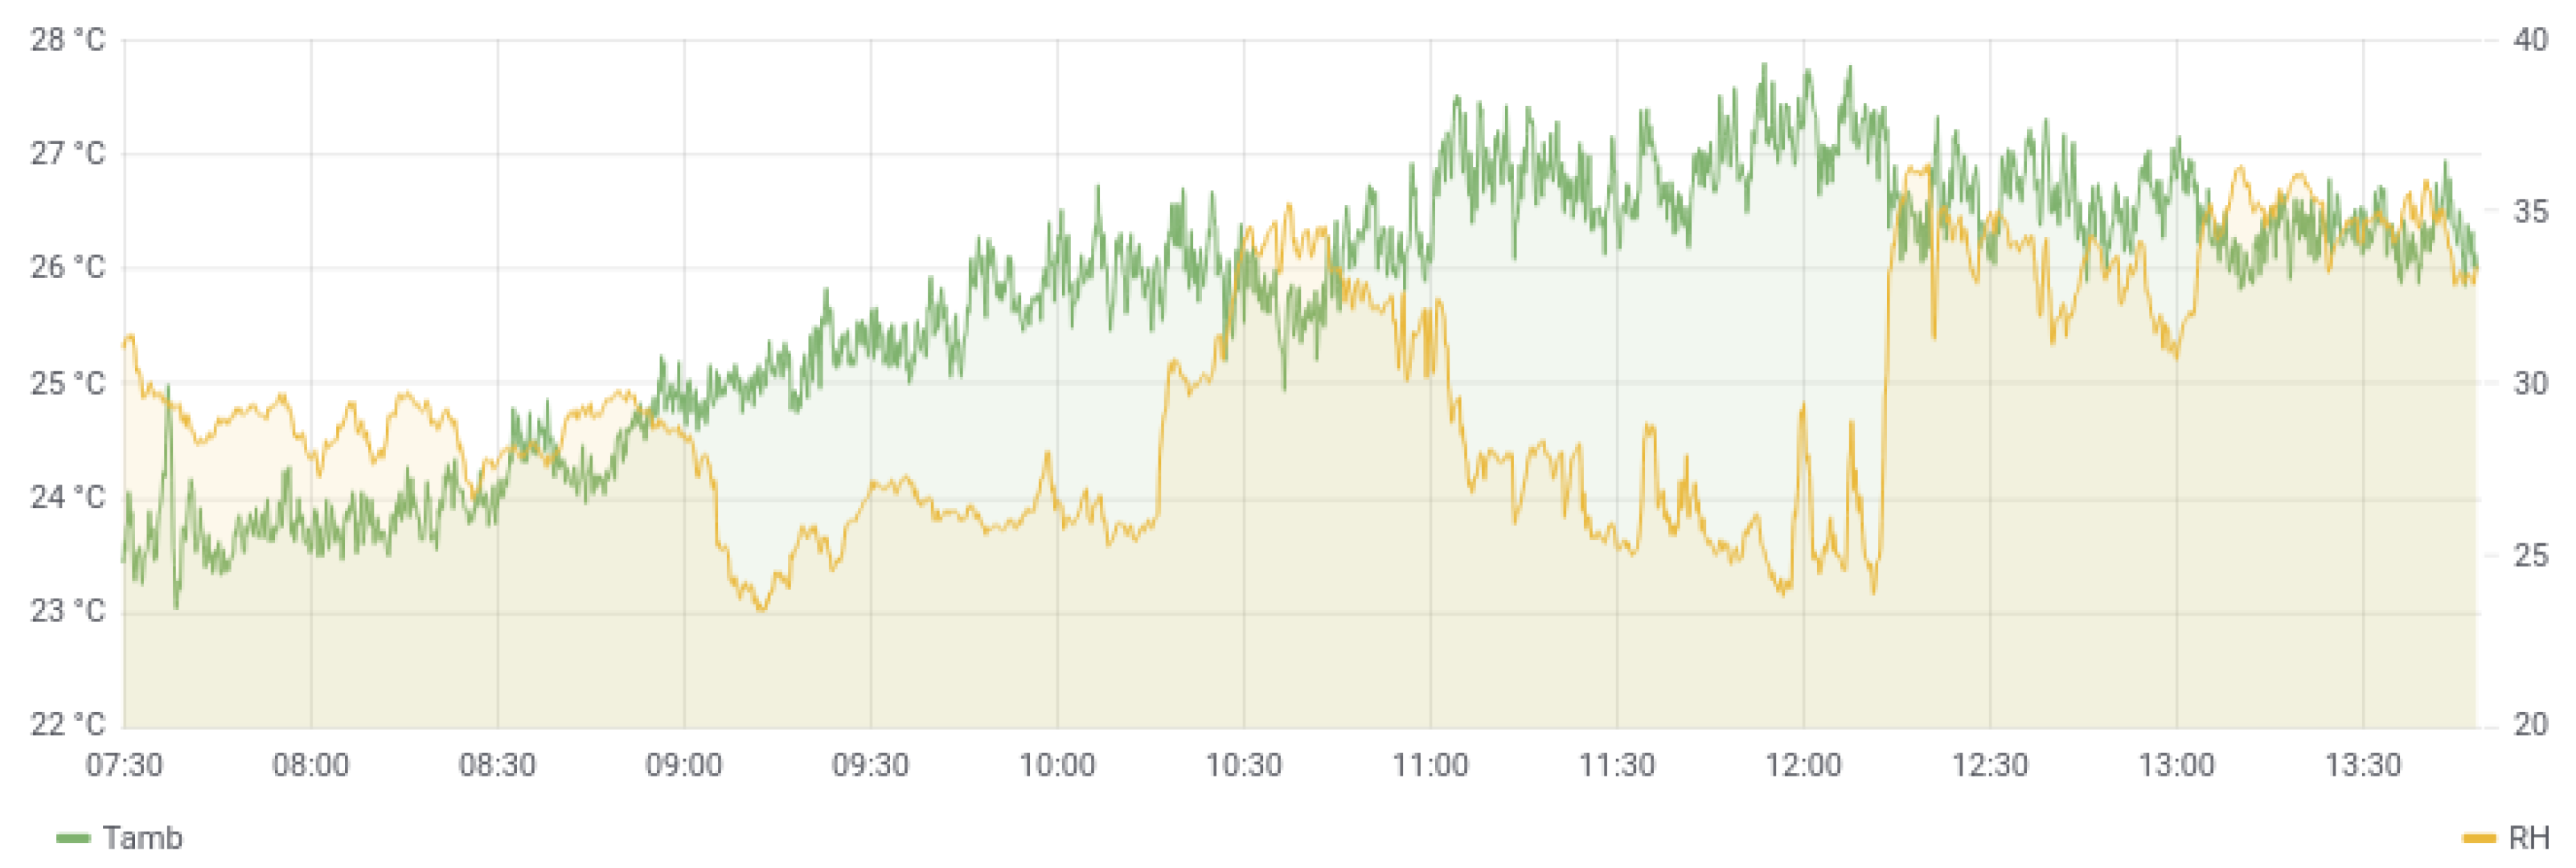
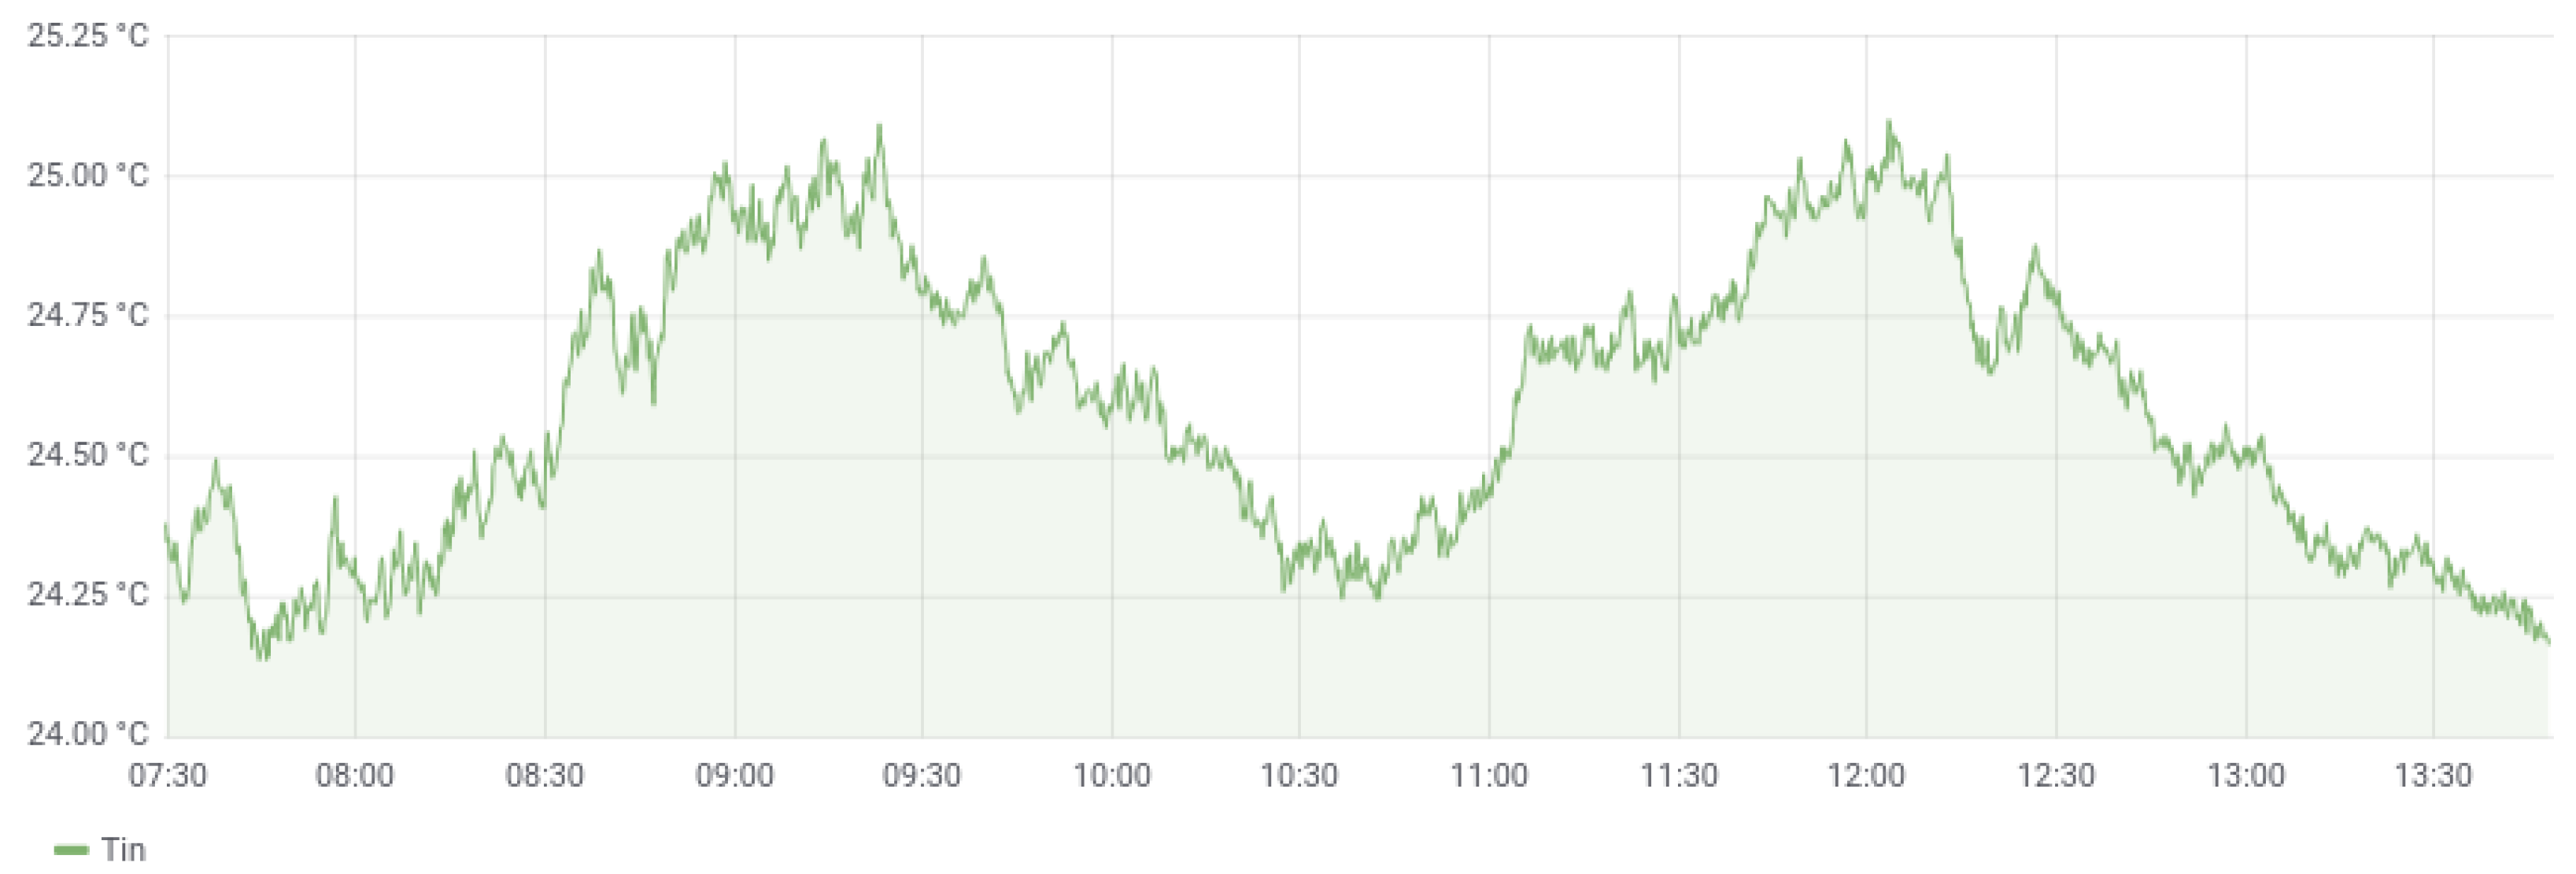
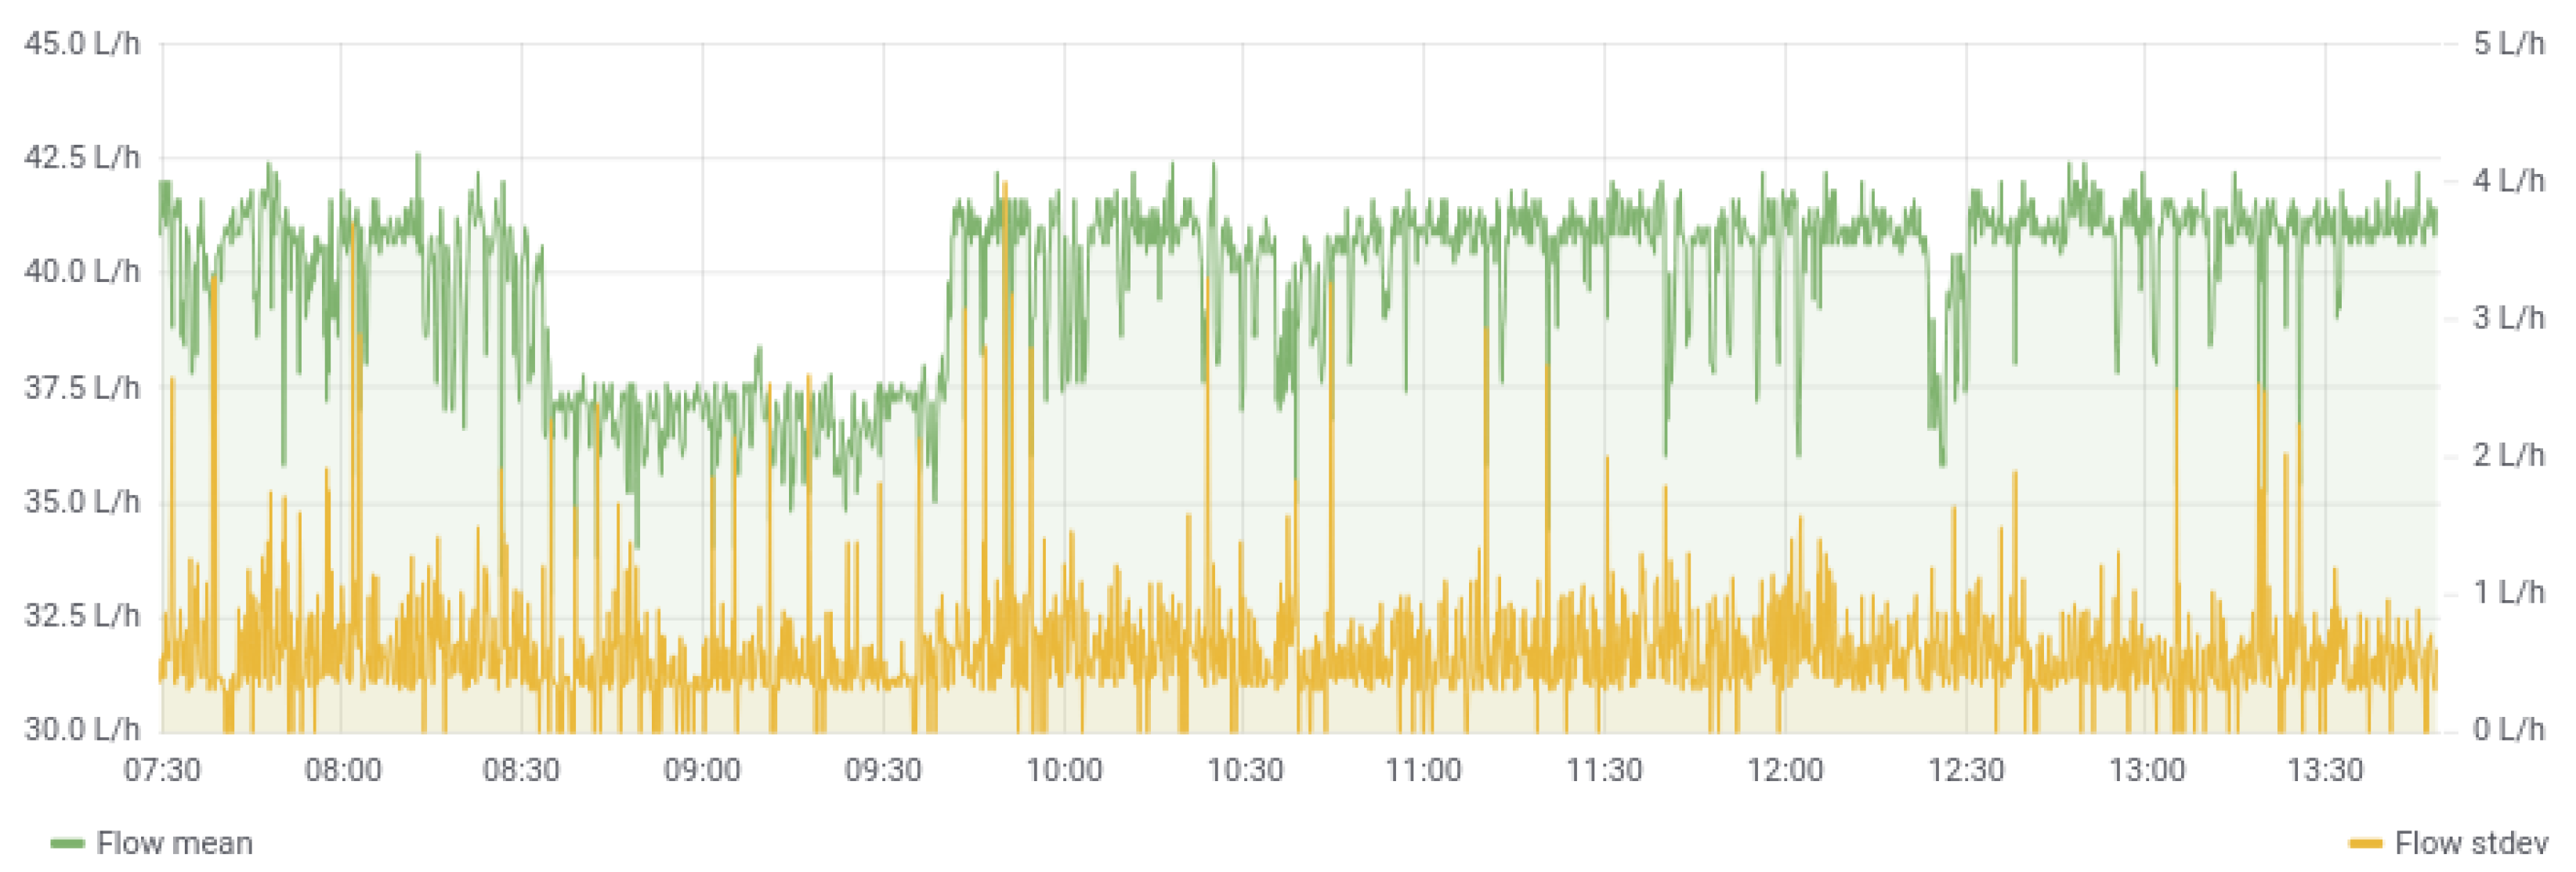
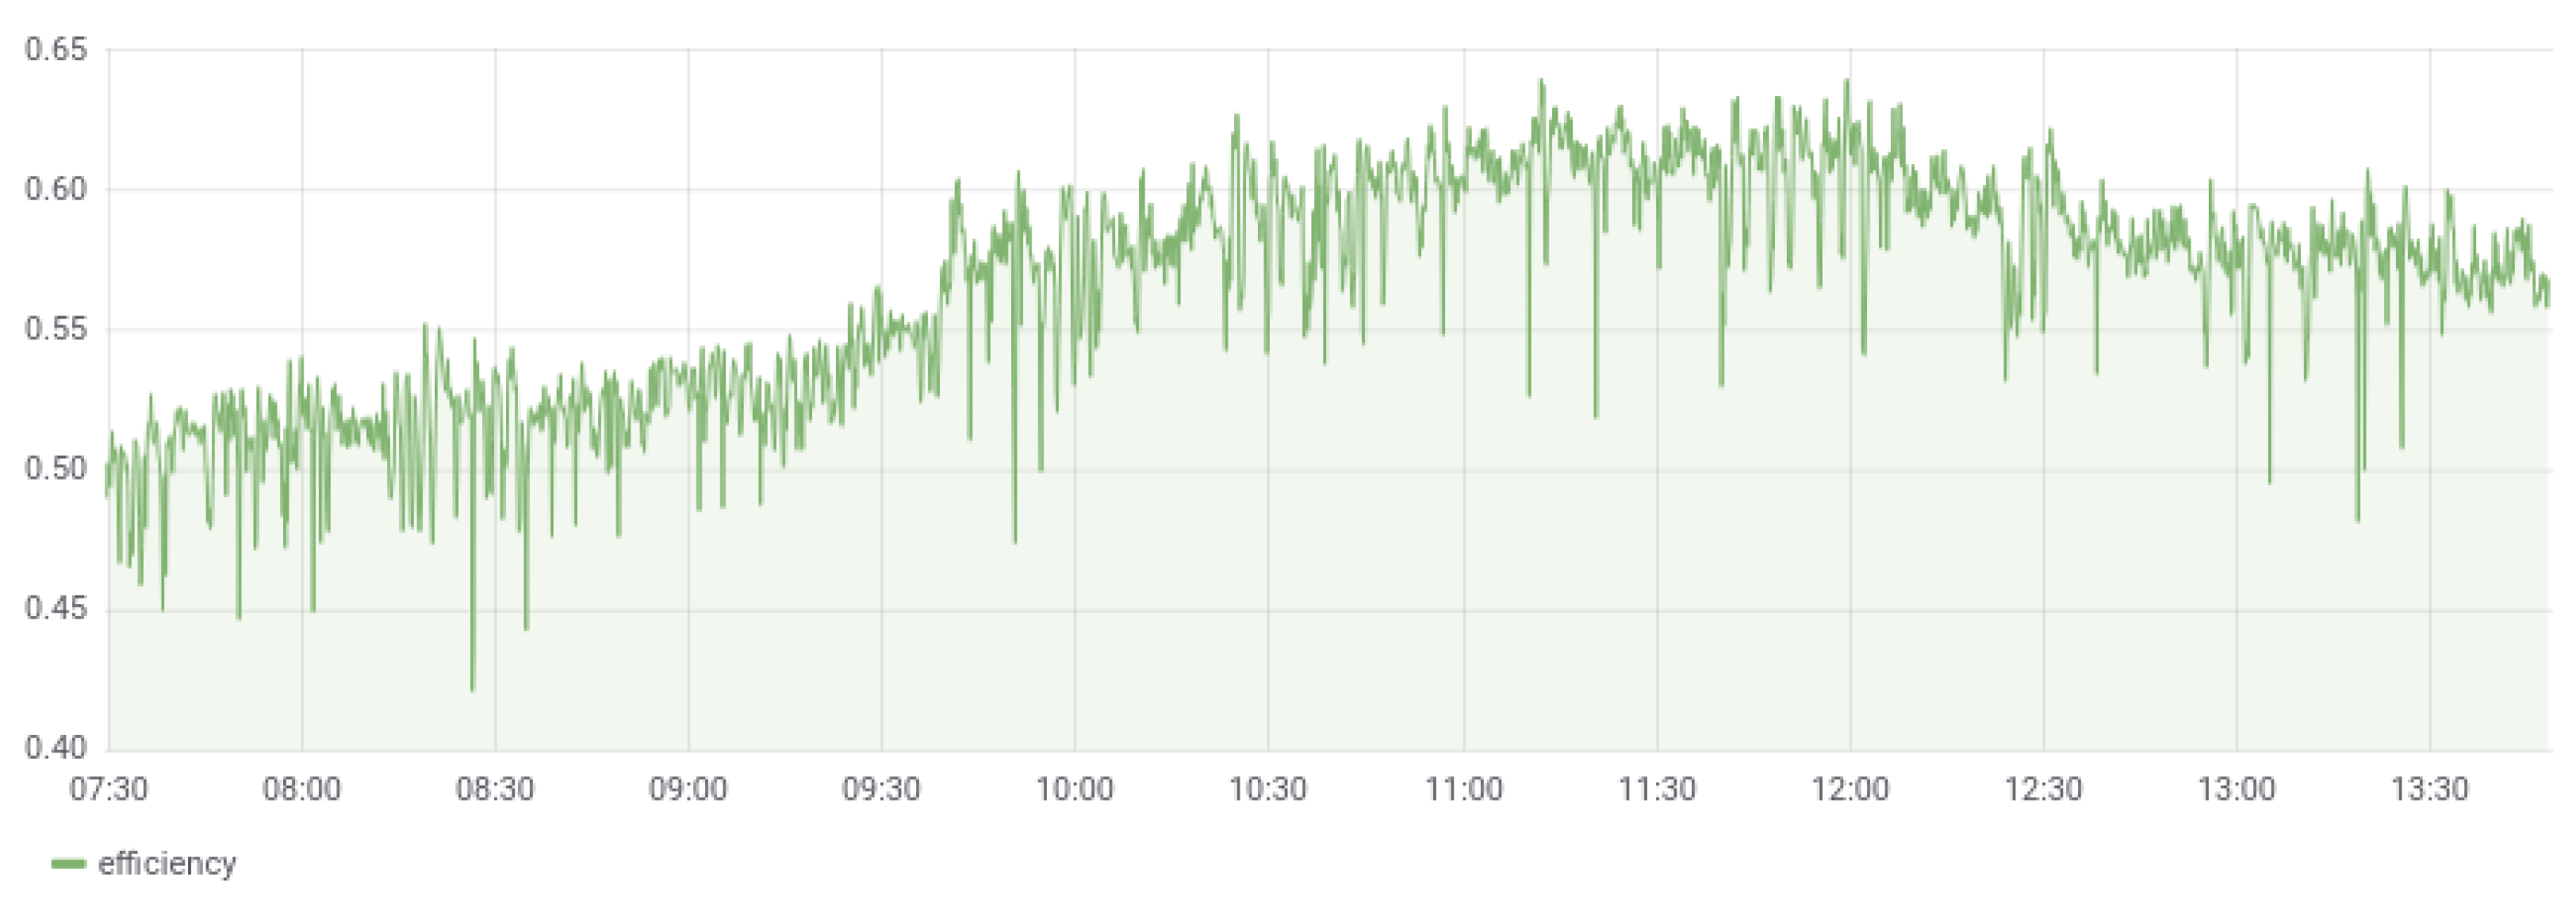
5. Results and Discussion

Advantages
6. Conclusions
Author Contributions
Funding
Conflicts of Interest
Nomenclature
| ADAS | Automatic Data Acquisition System |
| GPS | Global Positioning System |
| RTC | Real Time Clock |
| SSH | Secure Shell |
| HTTP | HyperText Transfer Protocol |
| GUI | Graphical User Interface |
| MQTT | MQ Telemetry Transport |
| RTD | Resistance Temperature Detector |
| PV | Photovoltaic |
| MCU | Micro Controller Unit |
| ADC | Analog-to-Digital Converter |
| VPS | Virtual Private Server |
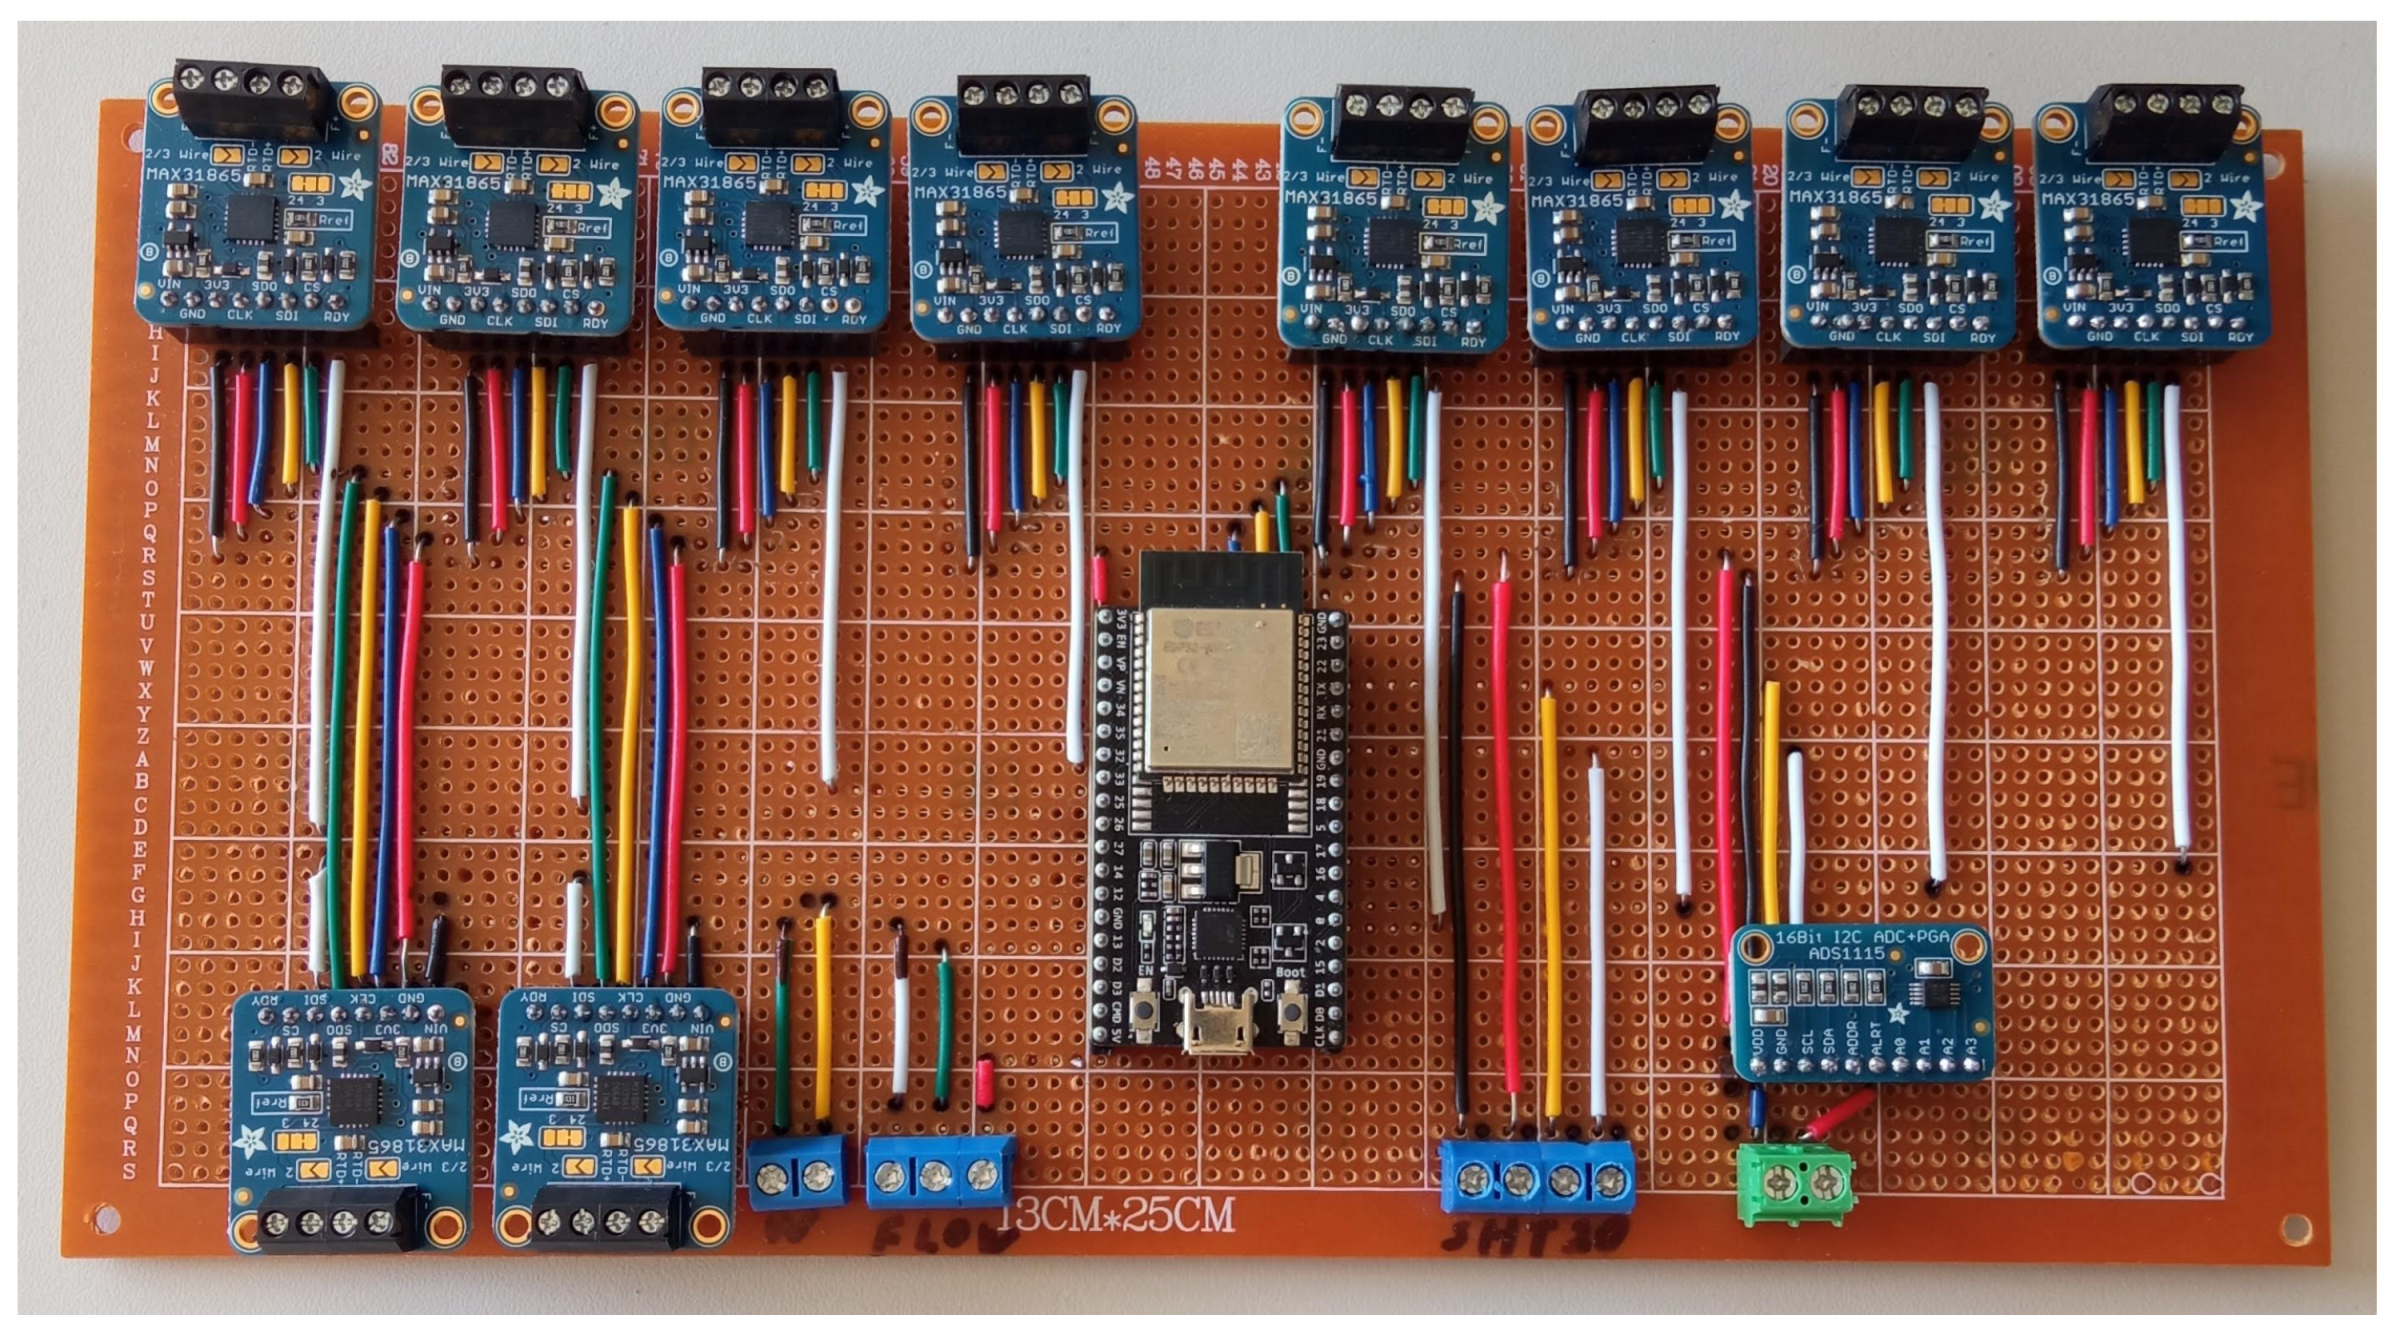
| PCB | Printed Circuit Board |
| RH | Relative Humidity |
| U | Mixing ratio |
| Saturation mixing ratio | |
| Standard deviation | |
| N | Number of measurements |
| Measurement value | |
| Mean of the set of measurements | |
| n | Collector efficiency |
| Mass flow rate | |
| Specific heat capacity | |
| Collector inlet temperature | |
| Collector outlet temperature | |
| Ambient temperature | |
| I | Irradiance |
| A | Collector effective area |
| Collector heat removal factor | |
| Transmittance | |
| Absorptance | |
| Collector overall heat loss coefficient |
Appendix A
References
- Rodriguez, M.G.; Ortiz Uriarte, L.E.; Jia, Y.; Yoshii, K.; Ross, R.; Beckman, P.H. Wireless sensor network for data-center environmental monitoring. In Proceedings of the International Conference on Sensing Technology, ICST, Palmerston North, New Zealand, 28 November–1 December 2011; pp. 533–537. [Google Scholar] [CrossRef]
- Gomes, J.M.; Ferreira, P.M.; Ruano, A.E. Implementation of an intelligent sensor for measurement and prediction of solar radiation and atmospheric temperature. In Proceedings of the 2011 IEEE 7th International Symposium on Intelligent Signal Processing, Floriana, Malta, 19–21 September 2011; pp. 9–14. [Google Scholar] [CrossRef]
- Gasparesc, G. Development of a low-cost system for temperature monitoring. In Proceedings of the 2013 36th International Conference on Telecommunications and Signal Processing, TSP 2013, Rome, Italy, 2–4 July 2013; pp. 340–343. [Google Scholar] [CrossRef]
- Baker, E. Open source data logger for low-cost environmental monitoring. Biodivers. Data J. 2014, 2, e1059. [Google Scholar] [CrossRef] [PubMed] [Green Version]
- Arnold, F.; DeMallie, I.; Florence, L.; Kashinski, D.O. Method for collecting thermocouple data via secured shell over a wireless local area network in real time. Rev. Sci. Instrum. 2015, 86, 035112. [Google Scholar] [CrossRef] [PubMed]
- Gandra, M.; Seabra, R.; Lima, F.P. A low-cost, versatile data logging system for ecological applications. Limnol. Oceanogr. Methods 2015, 13, 115–126. [Google Scholar] [CrossRef]
- Avallone, E.; Cunha, D.G.; Padilha, A.; Scalon, V.L. Electronic multiplex system using the Arduino platform to control and record the data of the temperatures profiles in heat storage tank for solar collector. Int. J. Energy Environ. Eng. 2016, 7, 391–398. [Google Scholar] [CrossRef] [Green Version]
- Simoes, N.A.; De Souza, G.B. A low cost automated data acquisition system for urban sites temperature and humidity monitoring based in Internet of Things. In Proceedings of the 2016 1st International Symposium on Instrumentation Systems, Circuits and Transducers (INSCIT), Belo Horizonte, Brazil, 29 August–3 September 2016; pp. 107–112. [Google Scholar] [CrossRef]
- Claros-Marfil, L.J.; Padial, J.F.; Lauret, B. A new and inexpensive open source data acquisition and controller for solar research: Application to a water-flow glazing. Renew. Energy 2016, 92, 450–461. [Google Scholar] [CrossRef]
- Syafii; Rusydi, M.I.; Putra, R.; Putra, M.H. Real-time measurement of grid connected solar panels based on wireless sensors network. In Proceedings of the 2016 International Conference on Sustainable Energy Engineering and Application (ICSEEA), Jakarta, Indonesia, 3–5 October 2016; pp. 95–99. [Google Scholar] [CrossRef]
- Hasanah, R.N.; Indyanto, F.R.; Maulana, E.; Suyono, H. Solar Energy Hybrid System for Seawater Distillation in the Coastal Regions. Energy Procedia 2017, 143, 662–667. [Google Scholar] [CrossRef]
- Silva, J. Real Time Temperature Monitoring. U.Porto J. Eng. 2018, 3, 42–47. [Google Scholar] [CrossRef]
- Allafi, I.; Iqbal, T. Design and implementation of a low cost web server using ESP32 for real-time photovoltaic system monitoring. In Proceedings of the 2017 IEEE Electrical Power and Energy Conference (EPEC), Saskatoon, SK, Canada, 22–25 October 2017. [Google Scholar] [CrossRef]
- Kodali, R.K.; Sahu, S. MQTT Based Smart Metering. In Proceedings of the 2018 Second International Conference on Green Computing and Internet of Things (ICGCIoT), Bangalore, India, 16–18 August 2018; pp. 399–402. [Google Scholar]
- Pereira, R.I.; Juca, S.C.; Carvalho, P.C.; Souza, C.P. IoT Network and Sensor Signal Conditioning for Meteorological Data and Photovoltaic Module Temperature Monitoring. IEEE Lat. Am. Trans. 2019, 17, 937–944. [Google Scholar] [CrossRef]
- García, L.; Parra, L.; Jimenez, J.M.; Lloret, J.; Lorenz, P. Estimation of the Best Measuring Time for the Environmental Parameters of a Low-Cost Meteorology Monitoring System. In Lecture Notes in Networks and Systems; Springer: Cham, Switzerland, 2020; Volume 92, pp. 137–144. [Google Scholar] [CrossRef]
- Kramer, K.S.; Mehnert, S.; Geimer, K.; Reinhardt, M.; Fahr, S.; Thoma, C.; Kovacs, P.; Ollas, P. Guide to Standard ISO 9806:2017; A Resource for Manufacturers, Testing Laboratories, Certification Bodies and Regulatory Agencies. Fraunhofer-Gesellschaft zur Förderung der angewandten Forschung e.V.: Freiburg, Germany, 2017. [CrossRef]
- Merkel, D. Docker: Lightweight Linux containers for consistent development and deployment. Linux J. 2014, 2014, 1–5. [Google Scholar] [CrossRef]
- Duffie, J.A.; Beckman, W.A. Solar Engineering of Thermal Processes, 4th ed.; Wiley: Hoboken, NJ, USA, 2013. [Google Scholar]


| Quantity | Maximum Uncertainty |
|---|---|
| Solar irradiance | |
| Outlet–inlet temperature | |
| Ambient temperature | |
| Mass flow rate | |
| Wind speed | |
| Specific humidity (mixing ratio) |
| Quantity | Sensor | Output | Interface Module |
|---|---|---|---|
| Irradiance | Kipp & Zonen CMP11 | Analog | ADS1115 |
| Temperature | PT100 | Analog | MAX31865 |
| Mass flow rate | Biotech VZS-007 ALU | Frequency | - |
| Wind speed | Thies compact | Frequency | - |
| Humidity | SHT20 waterproof | Digital | - |
Publisher’s Note: MDPI stays neutral with regard to jurisdictional claims in published maps and institutional affiliations. |
© 2022 by the authors. Licensee MDPI, Basel, Switzerland. This article is an open access article distributed under the terms and conditions of the Creative Commons Attribution (CC BY) license (https://creativecommons.org/licenses/by/4.0/).
Share and Cite
Panagopoulos, O.; Argiriou, A.A. Low-Cost Data Acquisition System for Solar Thermal Collectors. Electronics 2022, 11, 934. https://doi.org/10.3390/electronics11060934
Panagopoulos O, Argiriou AA. Low-Cost Data Acquisition System for Solar Thermal Collectors. Electronics. 2022; 11(6):934. https://doi.org/10.3390/electronics11060934
Chicago/Turabian StylePanagopoulos, Orestis, and Athanassios A. Argiriou. 2022. "Low-Cost Data Acquisition System for Solar Thermal Collectors" Electronics 11, no. 6: 934. https://doi.org/10.3390/electronics11060934
APA StylePanagopoulos, O., & Argiriou, A. A. (2022). Low-Cost Data Acquisition System for Solar Thermal Collectors. Electronics, 11(6), 934. https://doi.org/10.3390/electronics11060934