1. Introduction
Electrical substations are key parts of the electricity distribution system. Their main functions are to transform voltage, provide grid monitoring, and perform switching functions, such as disconnecting parts of the grid in case of fault or maintenance. A recent trend is to digitize all parts of the grid infrastructure, including substations, in order to create a smart grid—a reliable, flexible, and efficient system of electricity generation, distribution, and consumption.
Grid digitization started with primary substations, which transform high voltage in to medium voltage and serve a large number of supply points. Digitization continues with secondary substations, which transform medium voltage to low voltage. Unlike primary substations, secondary substations serve only relatively small areas, typically specific neighborhoods. On the other hand, serving smaller areas results in having a significantly higher number of secondary substations when compared with primary substations. This makes their digitization process more demanding. Moreover, secondary substations are less secure by nature—they are located in easily accessible areas (neighborhoods), they are not protected by fences, and they are not monitored by a manned crew. They are, however, integrated into the grid’s communication network in the same way as primary substations. Consequently, they are attractive entry points to launch an attack on the entire grid network.
1.1. Smart Grid Attacks
A cyber attack on a substation may disrupt the electricity supply with consequences affecting the grid operator and its customers. In 2015, remote control of circuit breakers by a cyber attacker contributed to the loss of power for 225,000 customers in Ukraine [
1]. The Ukrainian power grid experienced a similar incident in 2016, when a substation in Kiev was attacked. This time, the impact was less severe, but an analysis performed by Dragos [
2] revealed possible ambitions for the destruction of grid equipment. It has been determined that this latter attack was performed using the Industroyer malware, which has a capability to insert a payload into messages of all commonly used communication standards in substations—IEC 60870-5-101, IEC 60870-5-104, IEC 61850—and open platform communications (OPC) [
3].
In 2018, the US Cybersecurity and Infrastructure Agency published an alert about cyber reconnaissance against the energy sector, which had been ongoing for at least two years. After having gained access to corporate networks using spear phishing and water hole attacks, the attacker accessed servers and workstations containing information on the ICS of energy generation facilities [
4].
Another attack was carried out on circulation pumps of the Brown Ferry nuclear plant in the US in 2006 [
5]. The attack combined denial of service to overload control system network, hacking of smart meters, and phishing and malware injection.
Probably the most well-known cyber attack is Stuxnet, which targeted Iran’s nuclear enrichment program in 2010 [
6]. This attack did not target the smart grid, but it used SCADA commands for doing physical damage to uranium enrichment centrifuges. SCADA is also being used in smart grid networks, which shows the importance of cyber security of the entire infrastructure.
1.2. Methodology and Contributions
This article combines threat modeling and simulation in order to identify and verify threats for digital secondary substations. Firstly, threat modeling is used to analyze impact and likelihood of possible threats related to digital secondary substations and their communication with the control center. We have used the Smart Grid Threat Modeling Template (SG-TMT), implementing STRIDE-per-interaction and running the template in Microsoft Threat Modeling Tool (MS-TMT) software [
7].
Subsequently, the most critical threats were evaluated in a simulation model. Those results can then be used by grid companies to improve security measures to limit the risk of identified threats. To the best of our knowledge, the combination of those two techniques is unique and no similar work has been carried out in the area of digital secondary substations.
The main contributions of this article are the following:
Identification of possible cyber threats to a digital secondary substation using the smart grid threat modeling tool implementing the STRIDE model.
Selection of the most critical threats—with high priority, high likelihood, and high need of investigation.
Development of a precise simulation model for verification and evaluation of critical threats to digital secondary substations.
1.3. Terminology
This section explains the various terminology used in the present article.
1.3.1. Threat Terminology
The article uses the following terminology connected with threats:
Priority—determines how dangerous the threat is. It is a combination of threat impact and probability. It can be low, medium, or high.
- -
Impact—considers consequences in terms of equipment damage, revenue and reputation loss, and consumer and operator safety.
- -
Probability—shows how likely is the threat to happen. It depends on gains for the attacker and the effort required to carry out the attack.
Needs investigation—classifies threats which could be dangerous for the company and for which security countermeasures should be implemented.
Likelihood—defines how easy it is for an attacker to exploit the threat. It is a combination of required knowledge and availability of specific tools which can be used for the attack.
Critical threats—they have high likelihood, belong to the high-priority category, and need investigation groups.
1.3.2. Threat Modeling Terminology
Threat modeling used in this article uses the following terminology:
Element—a building block in the model of the system, represented by rectangle, circle, or solid line, as shown in
Figure 1 and
Figure 2. Examples of elements from the figures are “RTU Process” and “SCADA Server Process”.
Tuple—grouping of a source element, a flow element, and a target element. An example of a tuple from
Figure 1 and
Figure 2 is the “Human Operator” element, sending “Human Input” to the “SCADA Server Process”.
Trust boundary—in the Smart Grid Threat Modeling Template (SG-TMT), trust boundaries are used to denote that the traffic is not trusted and should be investigated for threats. This may be because the source of the data flow is not trusted. It can also be the case that both source and target are trusted, but threats may be present in the networks connecting the two elements.
Smart Grid Threat Modeling Template (SG-TMT)—a template of smart grid elements and predefined threats intended for creating smart grid threat models.
Microsoft Threat Modeling Tool (MS-TMT)—a software created by Microsoft used to create threat templates (such as the SG-TMT). Templates can be used to create models (such as
Figure 1 and
Figure 2) and to automatically generate threats.
STRIDE-per-interaction—one of two alternative ways of using the STRIDE (mnemonic for Spoofing, Tampering, Information disclosure, Denial of service, Elevation of privilege) threat modeling method. In STRIDE-per-interaction, every tuple of source, target, and flow is analyzed for threats. In the other alternative way, STRIDE-per-Element, each element is analyzed for threats.
1.3.3. Simulation Model Terminology
The created simulation model uses a combination of simulation and emulation approaches. The definition of these terms in this article is as follows:
Simulation is a technique which models only selected parts of the system—it abstracts from specific details and often substantially simplifies the system functionality. The scope of the simulation is highly dependent on the effort put into it, which can be expressed in terms of man-hours. Time in the simulation can be also independent of the actual system running in real time. A simulation can be easy to use, but its results are limited to a very narrow scope.
Emulation is a technique which embeds and runs real code in a virtual environment (for example operating systems, software of networking devices, or programs generating ISO/OSI-compatible networking datagrams). The biggest advantage of emulation is that it provides accurate results and helps real-life verification of code before a deployment on a real system.
1.4. Structure
The remainder of this article is structured as follows:
Section 2 summarizes relevant research in areas of threat modeling and simulation modeling of digital secondary substations;
Section 3 presents the threat modeling process;
Section 4 describes the simulation model used for the verification of the selected threats;
Section 5 evaluates impacts of tested attack scenarios;
Section 6 discusses findings of threat modeling and the simulation model; and
Section 7 concludes the article.
2. Related Work
In this article, we performed threat modeling of a smart grid digital secondary substation (DSS) using the Smart Grid Threat Modeling Template (SG-TMT) to automatically generate several different threats to the DSS. Based on the result of the threat modeling, the most critical threats are simulated in order to study them further. Therefore, this section covers both threat modeling and simulation related work in the literature.
2.1. Threat Modeling of Digital Substations
Several approaches to threat modeling of substations exist in the literature. In [
8], the SCL-Lang attack simulation language for substations was created based on the Meta Attack Language [
9]. SCL-Lang facilitates the creation of attack graphs for substations, where attack graphs can be analyzed further to identify attack paths leading to certain attack goals. The attack scenarios provided in the article are inspired by the MITRE ATT&CK [
10] on industrial control systems. Objects and relations between objects are formed using the substation system configuration language (SCL) files, a part of the IEC 61850 standard [
11]. As SCL files are used to describe the automation of substations, it is unknown if the language is able to capture attacks between substation and the control room. With regards to the expressiveness of the language, the inclusion of some objects such as RTUs is left for further work. Furthermore, only five attacks are modeled to illustrate the capabilities of the language. Based on the work by Rencelj Ling and Ekstedt [
8], the language is extended with more objects and other attack scenarios by Sun [
12]. Despite this extension, objects such as the RTU and SCADA servers are still not included.
Hawrylak et al. [
13] demonstrated how hybrid attack graphs can be used by modeling an attack on a substation which causes a transformer to overheat. The authors advocate for use of hybrid attack graphs as these are claimed to allow the modeling of discrete cyber security changes, as well as changes to physical quantities, such as temperature. However, the article only demonstrates one specific attack and states that information on additional exploits and asset parameters is needed to model other attacks.
Omerovic et al. [
14] use a simplified version of the CORAS framework to identify cyber security risks to the same digital substation topology as in our work. They organized several workshops together with power industry and cyber security experts, and created a risk model consisting of threats, assets, vulnerabilities, and unwanted incidents. However, the process is entirely manual and has a wider focus than just threats, and it therefore required 109.5 man-hours to complete. Only 14 of 24 identified threats are undisclosed for confidentiality reasons, the remaining 10 are disclosed. Furthermore, threats are not further studied through simulation, like in this work.
The STRIDE model has been previously used for threat modeling in the smart grid, but to the best of our knowledge, without support of a threat modeling tool and only on two smart grid components—smart meter and PMU [
15,
16]. STRIDE relies on data flow diagrams (DFDs) which have several disadvantages [
17]—-inability to model countermeasures and express attacker assumptions, imprecise description of data (e.g., should data be interpreted as data or code), inability to express how security properties rely on lower abstraction levels (e.g., is confidentiality provided by the application or the VPN), and inability to express deployment information (where processes are physically located). The SG-TMT is able to remedy some of these disadvantages through the use of element properties. For example, SG-TMT is not able to express security concepts directly, but does model the effect of security concepts. Although the use of element properties makes the models in the tool more expressive, Sion et al. [
18] state that this approach may cause ambiguities and uncertainty.
2.2. Simulation Modeling of Digital Substations
Related work in the area of high-detailed simulation models of digital secondary substations is practically non-existent. To our best knowledge, there is only one work by Salazar et al. [
19], which uses emulated IEC104 communication between SCADA and RTU. Selected IEC104 messages are generated by the Scapy tool and authors reportedly continue to work on implementation of all remaining messages. The main difference between their contribution and our work is that Salazar et al. [
19] use Mininet network emulation. Because Mininet does not support routers, the entire topology had to be simplified—SCADA was connected to RTUs via a single switch. Moreover, Mininet uses lightweight virtualization, which results in much higher forwarding performance than in reality. This makes the model unsuitable for verification of specific attacks (mostly denial of service attacks).
Other works use only theoretical mathematical models to evaluate specific vulnerabilities—for example, a cascading failure attack [
20] or a model for detection of stealthy attacks [
21].
To the best of our knowledge, there is no work in the literature that combines threat modeling with simulation of high-priority threats, as is carried out in our work.
3. Threat Modeling
This section describes the threat modeling performed using the Smart Grid Threat Modeling Template.
3.1. Use Case
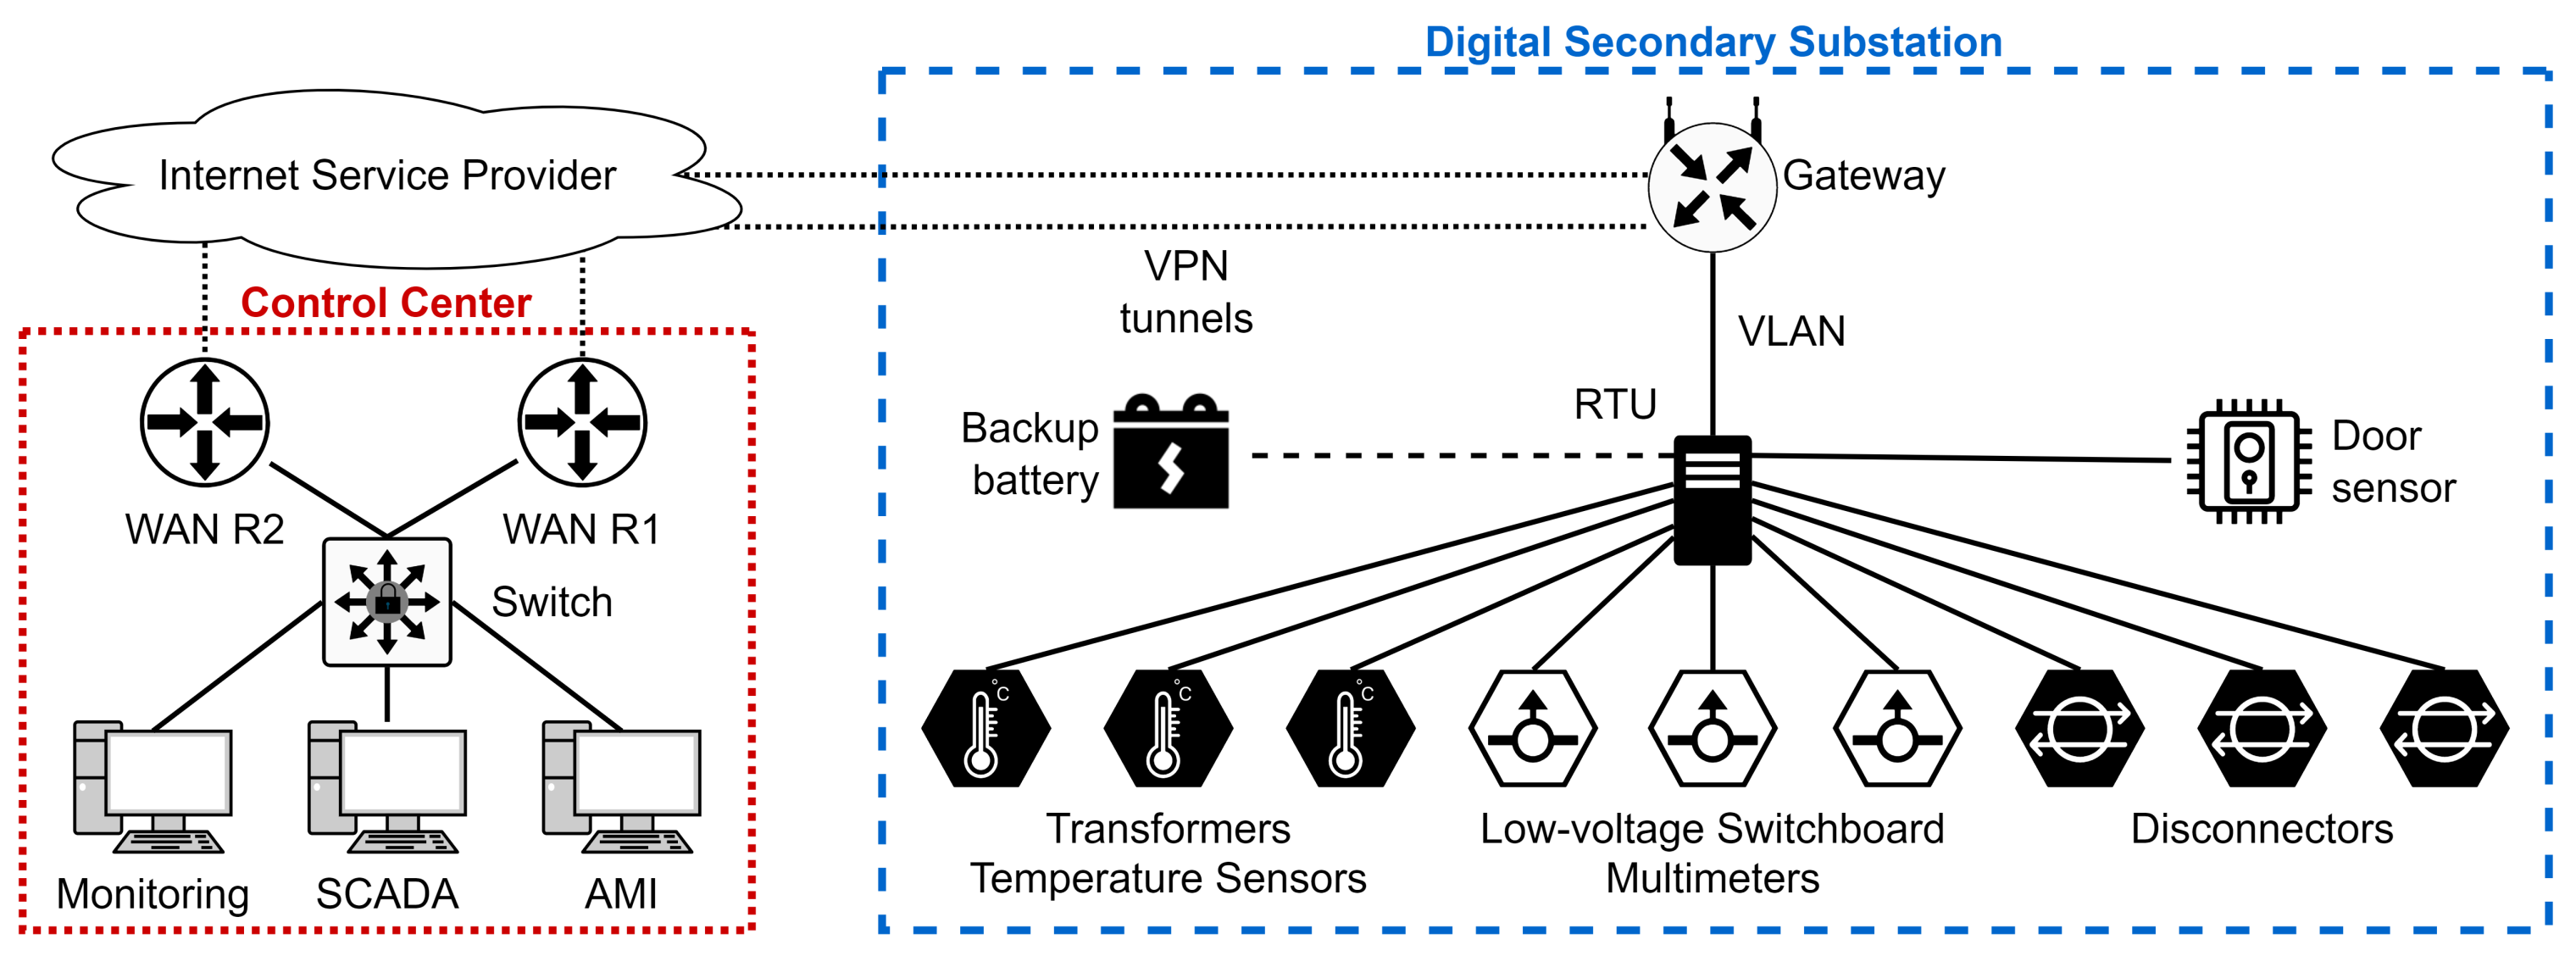
Our use case is a digital secondary substation connected to a remote control center with a SCADA system, as illustrated in
Figure 3. The use case is constructed in order to evaluate the possible threats to 31 digital secondary substations operated by a distribution system operator (DSO). The primary concern for the DSO is the loss of power, with resulting consequences to reputation, economy, and safety.
The digital secondary substation (DSS) is equipped with remotely controlled disconnectors (breakers) on incoming and outgoing cables, a remote terminal unit (RTU), and several sensors. The RTU communicates with the control center and the equipment in the substation (sensors and disconnectors). Additionally, the substation contains a backup battery for case of power outage. Sensor values are transmitted to the control center across fiber cables protected by VPN.
3.2. Scope
The scope of the threat modeling includes all ICT components inside the substation (sensors, disconnectors, RTU, and the gateway router), the communication between the substation and the control center, and the part of the SCADA system that communicates with the substation. The scope corresponds to the topology in
Figure 3.
3.3. Smart Grid Threat Modeling Template
The SG-TMT (
https://github.com/SINTEF-Infosec/Smart-Grid-Threat-Modeling-Template, accessed on 20 January 2022) [
7] allows for threat modeling of use cases in the smart grid, using data flow diagrams (DFDs) and STRIDE-per-interaction. The threat modeling is performed by applying the SG-TMT in the MS-TMT software, and is completed in three stages. First, a model of the use case is created and configured. Secondly the MS-TMT software generates a list of threats by analyzing every tuple of source, target, and flow against a list of threats included in the SG-TMT. The identification of threats rely on Boolean expressions made up of element types and element properties. Lastly, the generated threats are discussed and classified by the group performing the threat modeling.
3.4. Threat Modeling Process
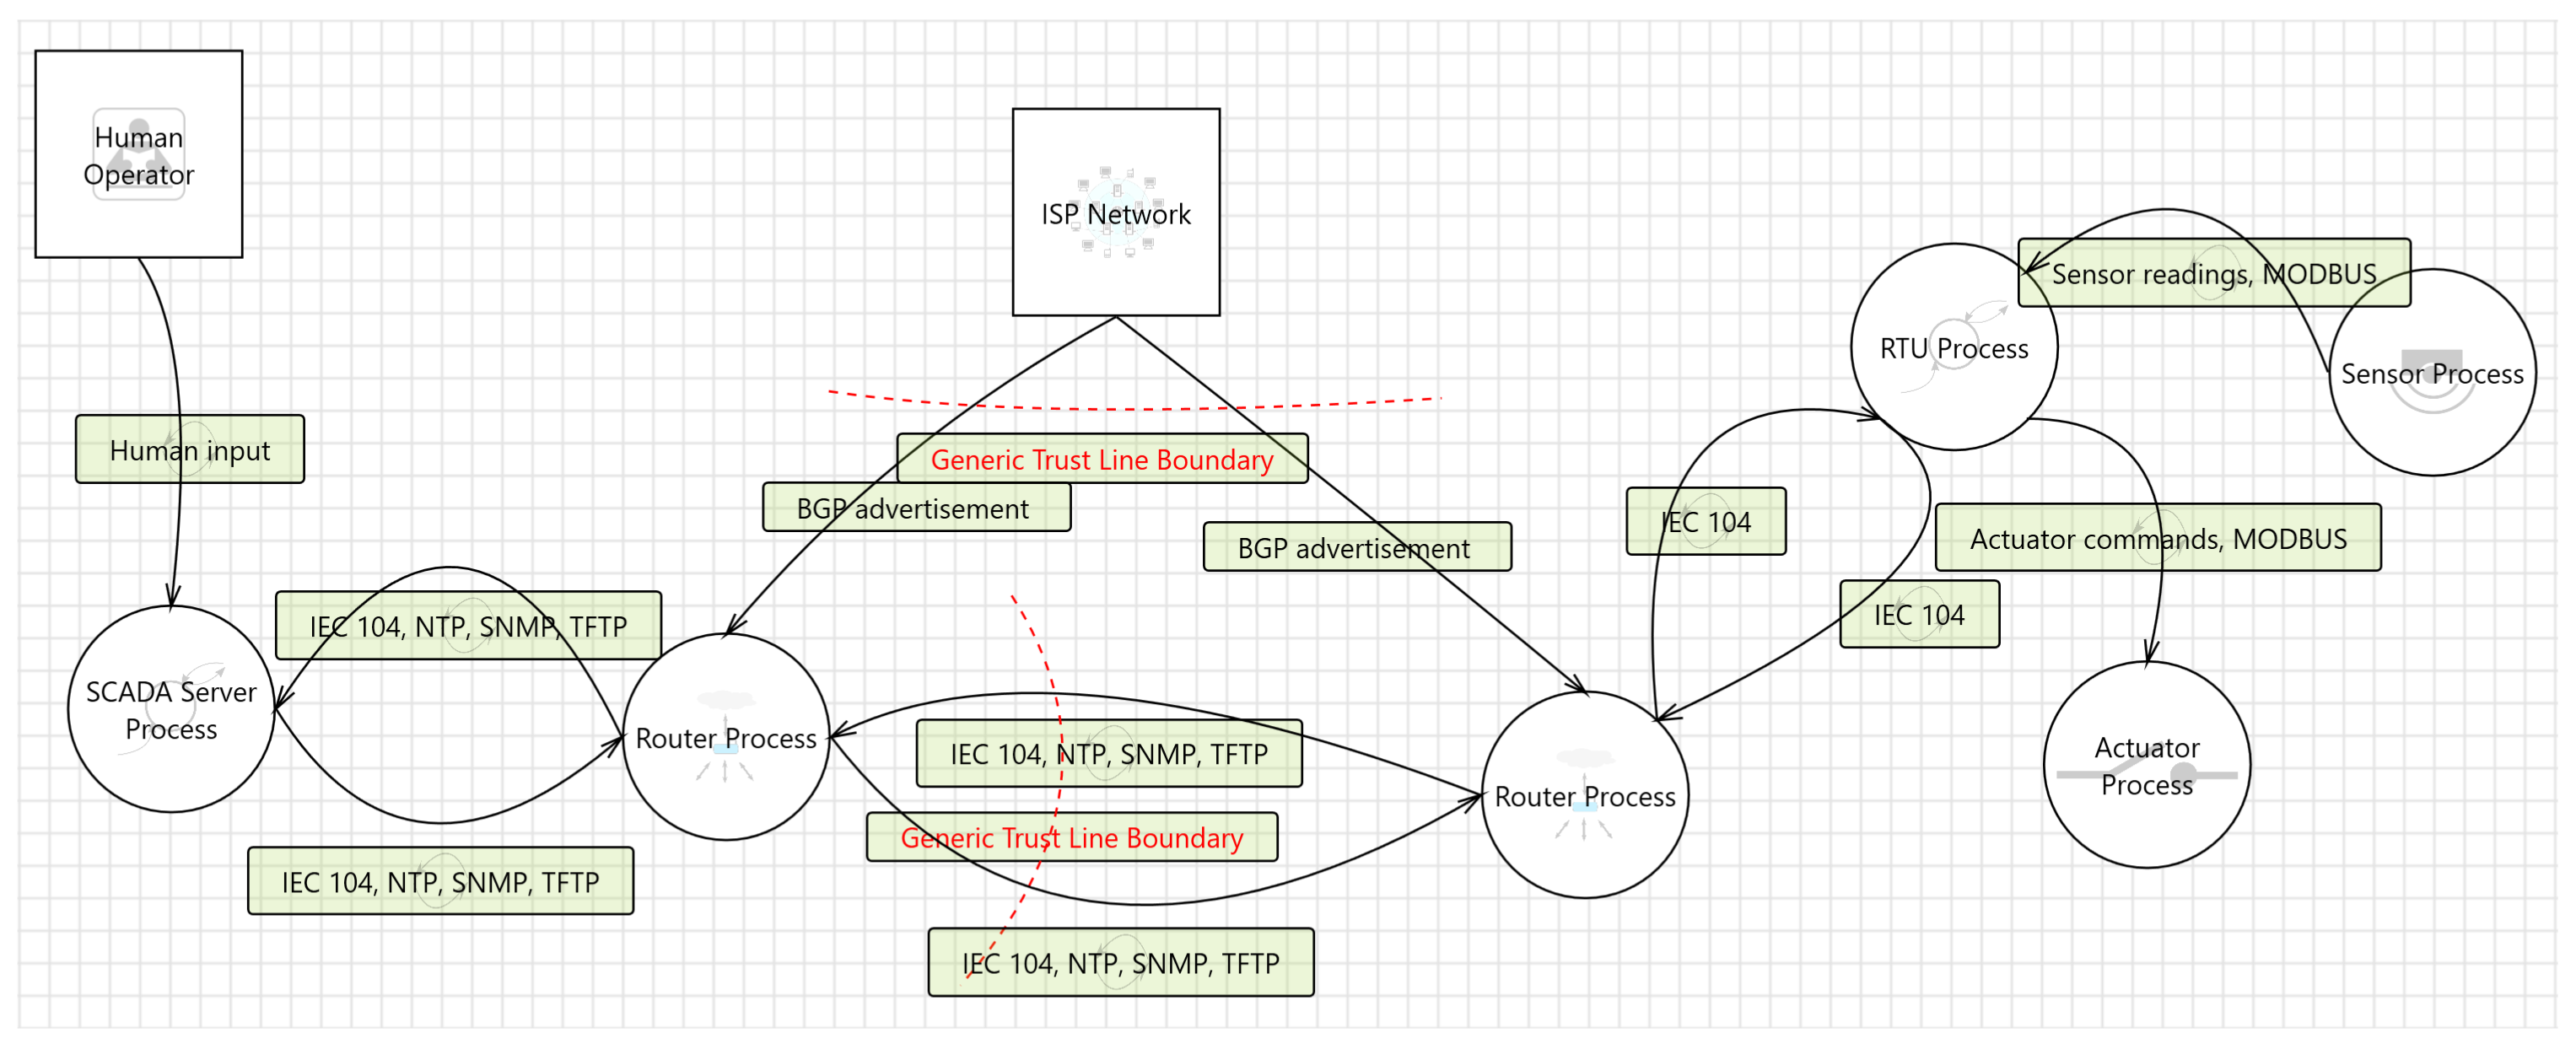
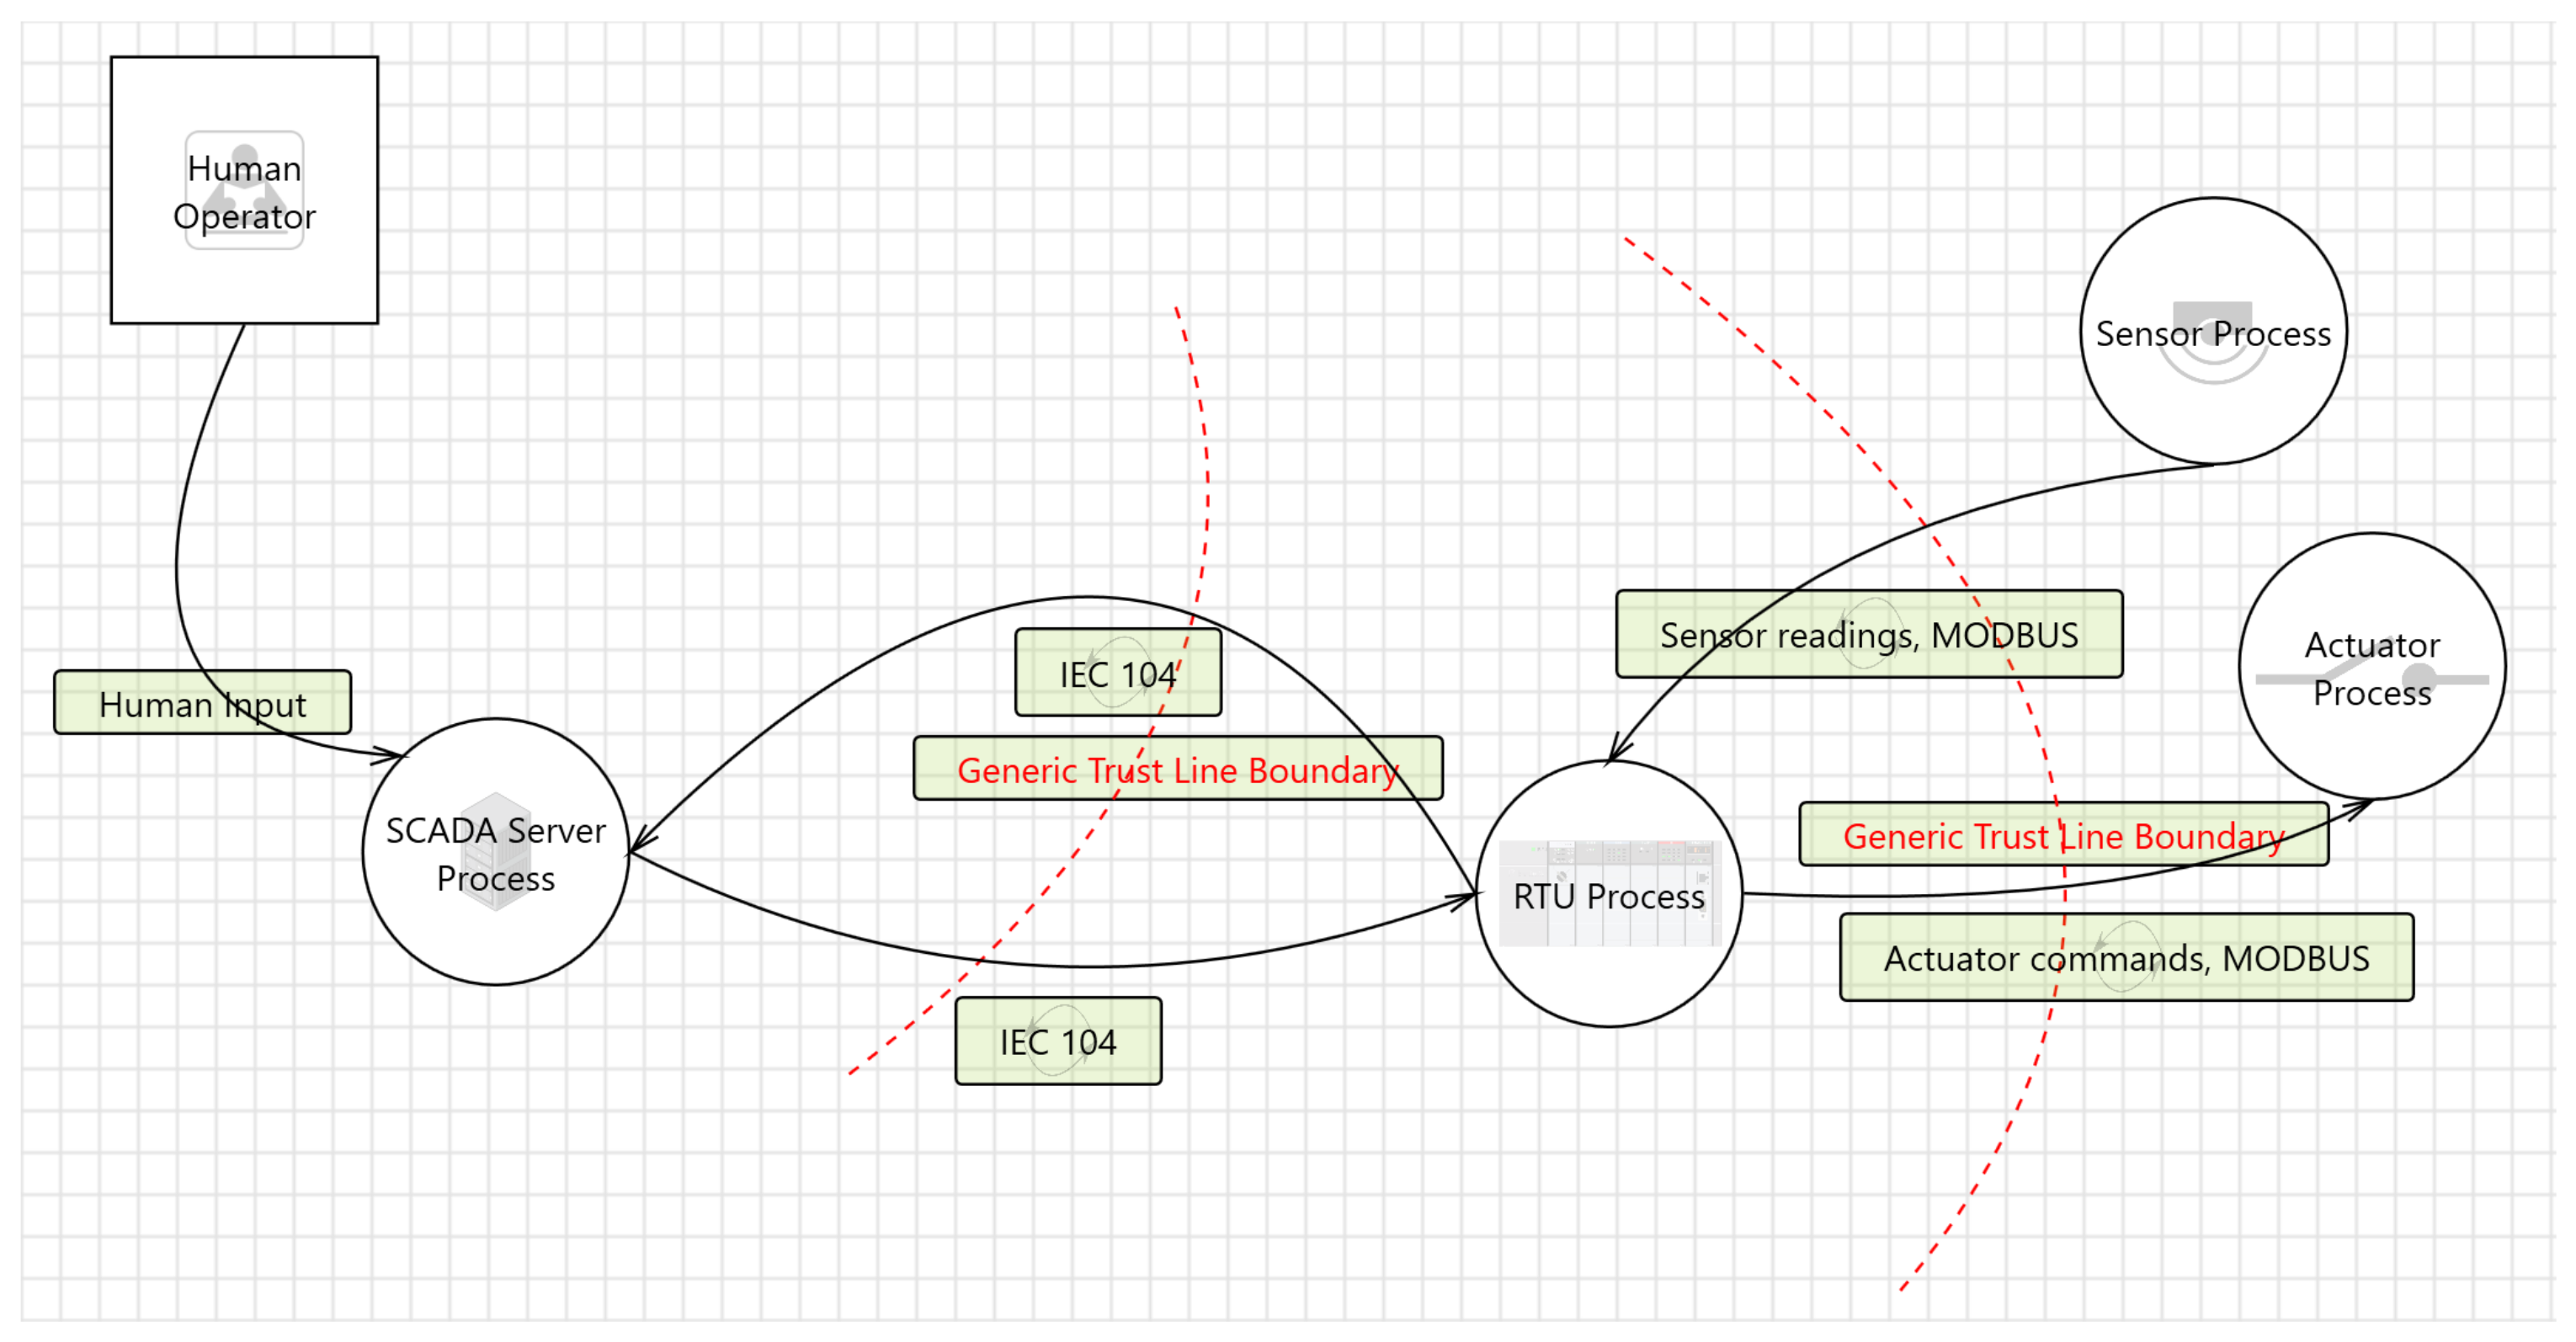
The use case was represented using two different models, as shown in
Figure 1 and
Figure 2. The network-oriented model shown in
Figure 1 focuses on remote attacks originating from the network. As a result, trust boundaries were only placed on the VPN connection between the control center and the secondary substation router, along with BGP communication from the internet service provider network to the router. The process-oriented model focuses on the threats that may result from an attacker being physically present inside the DSS. The attacker would not be able to access the VPN connection established between the routers, but they can instead access the RTU and unencrypted IEC 104 traffic directly. What is then relevant is the traffic between the RTU and the SCADA system, and, as a result, the routers are omitted.
The two models were first created and used as input for the threat modeling performed in a group by the authors. An overview of threat modeling participants, activity, duration, and total man-hours is listed in
Table 1.
3.5. Threat Modeling Results
The network-oriented model primarily investigates threats against the encrypted link between the substation and control center routers, threats against and originating from the BGP traffic between the routers and the ISP network, and other threats from the ISP network—for instance, distributed denial of service (DDoS). For this model, the tool generated 34 threats. The threats were then evaluated and classified by the threat modeling group. Of the identified threats, 23 were marked as “needs investigation”, and 11 were marked as “not applicable”. Of the 23 threats in need of investigation, 13 were given a high priority, and 10 were given a low priority.
The process-oriented model primarily investigates the threats originating from physical access to the substation. In total, 58 threats were identified and 53 threats were marked as “needs investigation”. Of these threats, 11 were given a high priority, 22 were given a medium priority, and 20 were given a low priority. As the communication inside the substation is not secure, the number of threats is greater than in the network-oriented model.
The combined results from both models are shown in
Table 2.
3.6. Threat Likelihood Assessment
In the threat likelihood assessment, our first step is to further analyze high-priority threats which were identified as “needs investigation” in
Section 3.5. We have ignored low priority threats, because they only affect observability and operation of a single DSS. Even if these threats lead to bringing the DSS offline, they would cause only a small-scale blackout. An example case of such a small-scale blackout occurs when threats are targeted on the gateway router, RTU, or sensors and disconnectors. Examples of such threats include specially crafted messages, malware injection, data flow interruption, or unauthorized command execution.
On the other hand, high-priority threats may affect the entire grid network if they target the SCADA system, which monitors and controls all digital substations (primary and secondary). In such a scenario, the attacker exploits the DSS only as an entry point to the network in order to reach SCADA and consequently cause widespread damage [
22].
Our next step was to consider likelihood of these high-priority threats. Likelihood is determined by a combination of required knowledge of the attacker (knowledge of exploitable vulnerabilities, grid operation, and grid reaction to the attack) and availability of specific tools. For example, creating a specialized malware requires deep knowledge without an option to use a single already prepared tool (and such an attack is therefore less likely). On the other hand, performing denial of service attacks can be carried out with a single command using publicly available tools (such as
ping3), which does not require any special knowledge. Denial of service threats were therefore identified as the most critical among the STRIDE categories of threats (followed by elevation of privilege and spoofing as indicated by the number of “high priority, need investigation” threats in
Table 2) and we have focused on them in our simulation model.
The process of performing a DoS attack is explained in the following subsection.
3.7. Denial of Service Attack Process
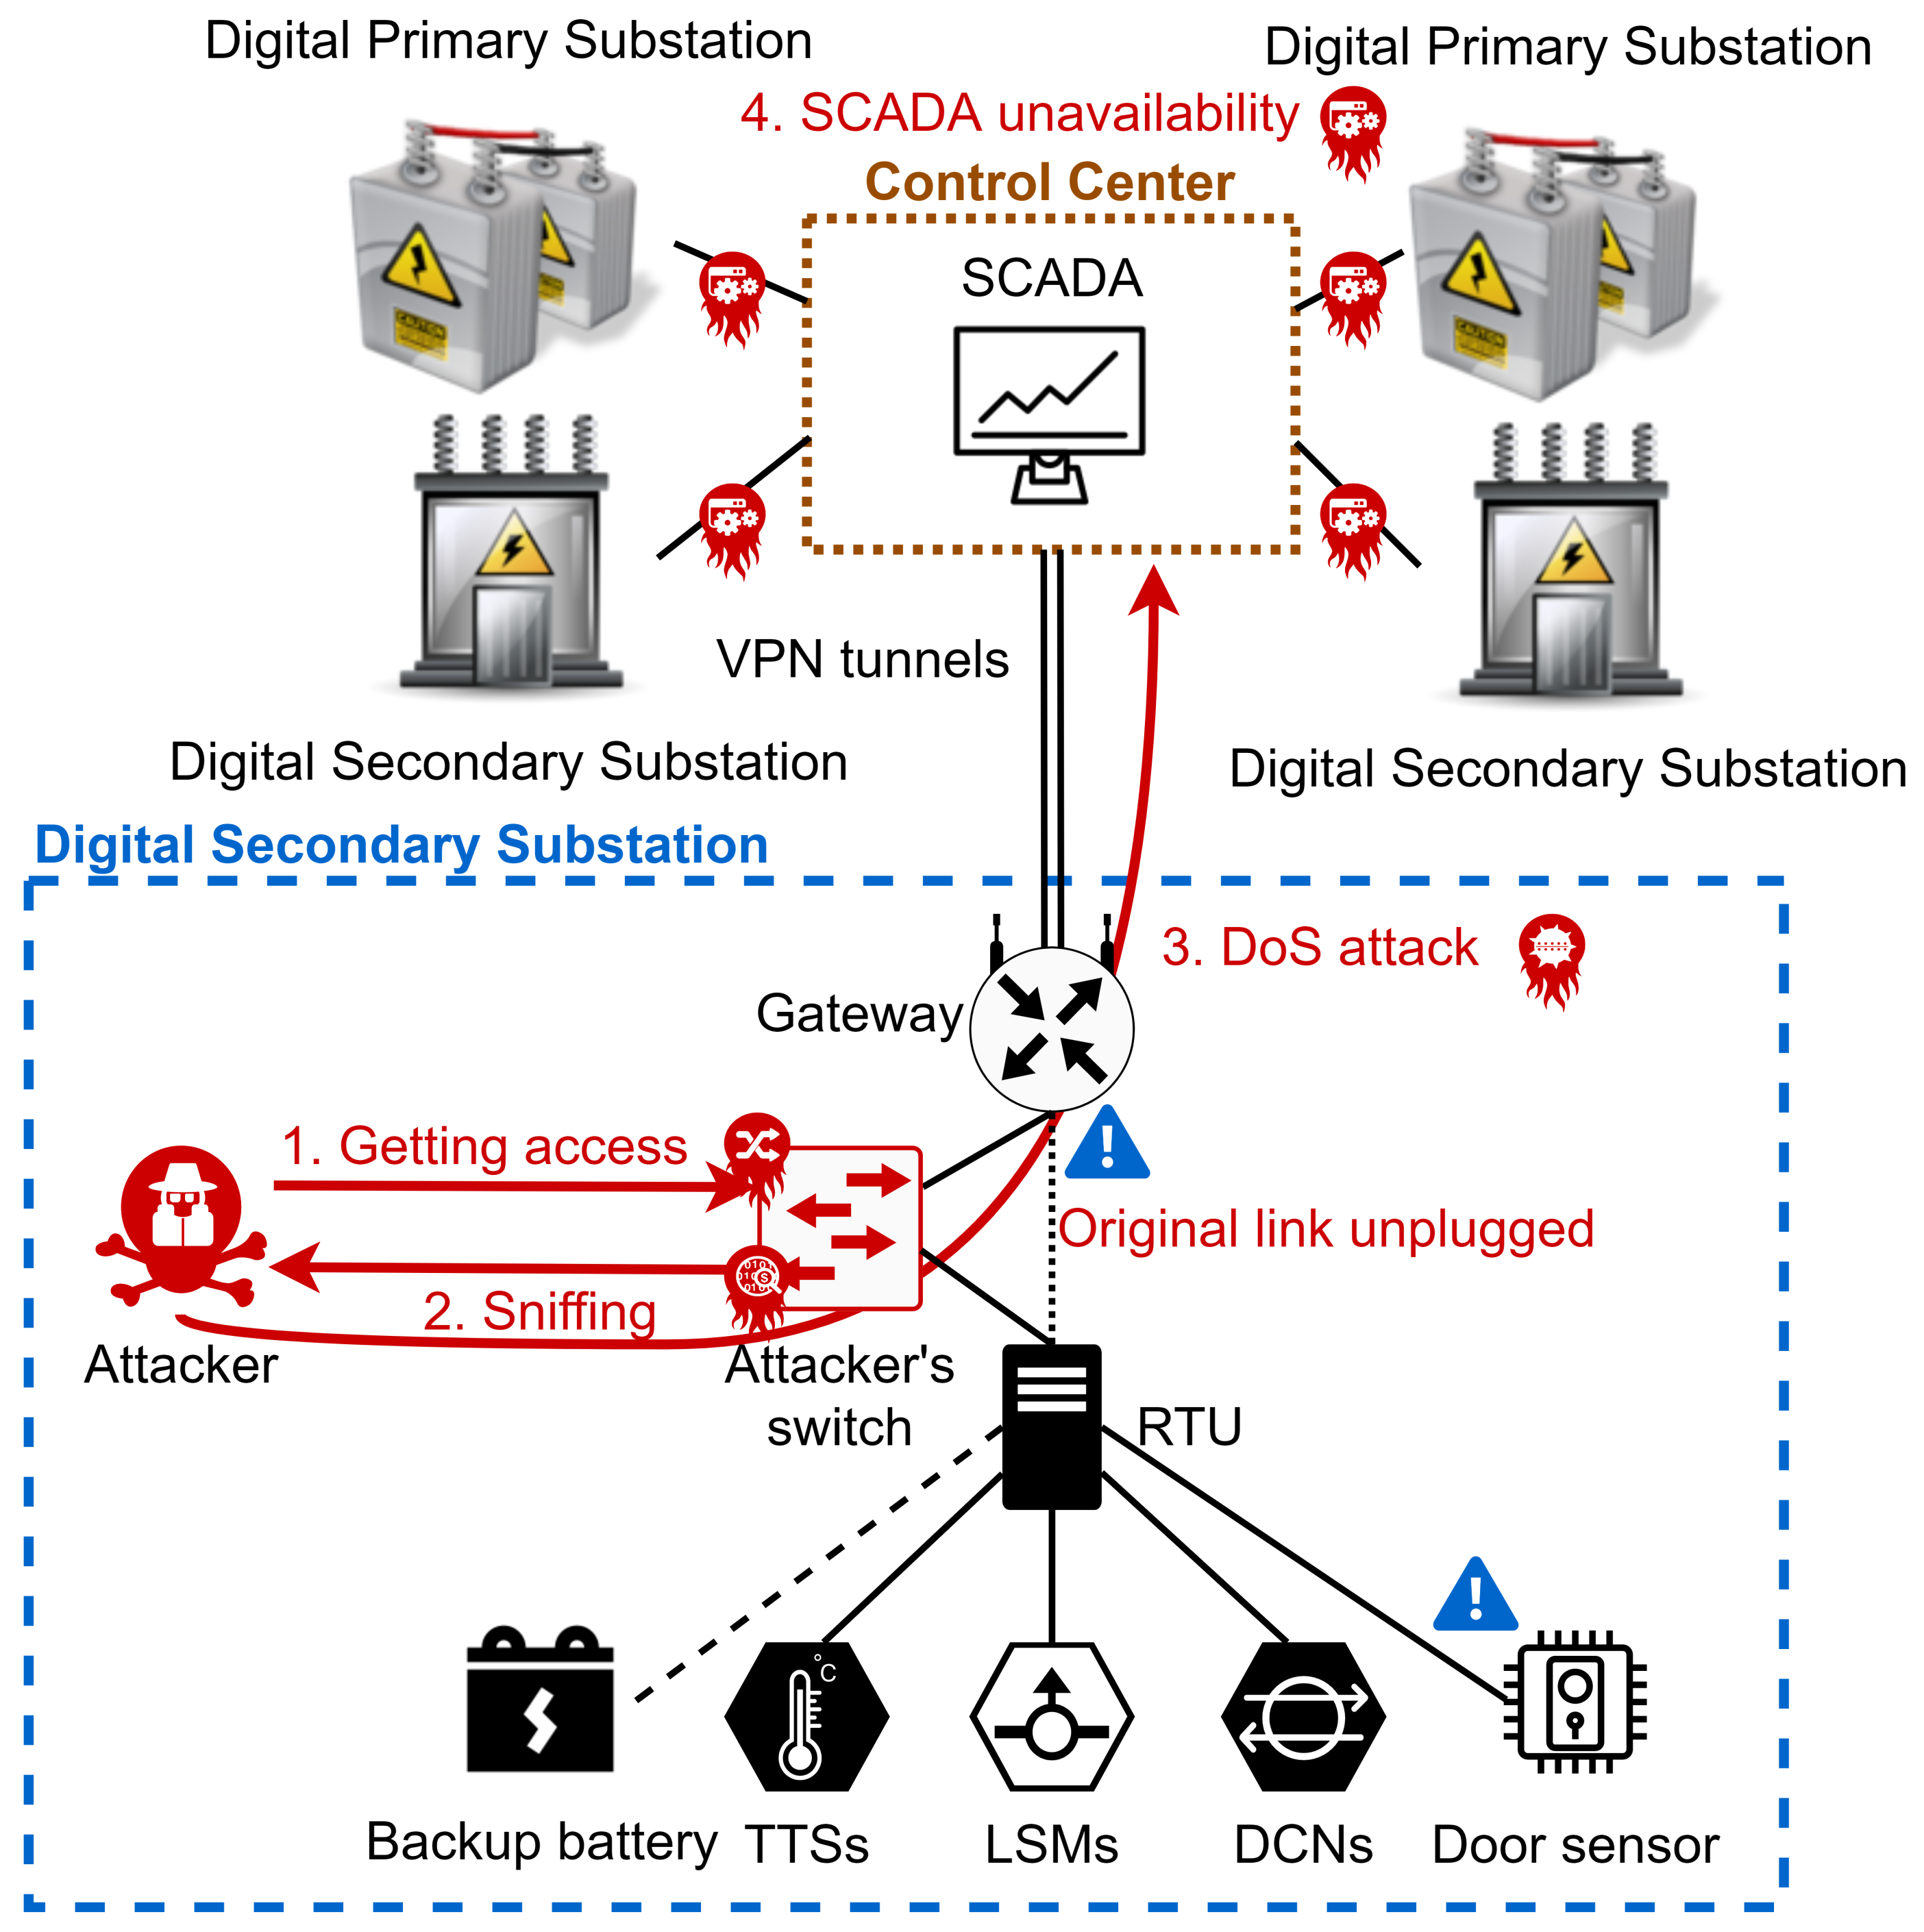
Figure 4 shows the execution process of a DoS attack in the following steps:
Gaining access—the attacker gains access to the secondary substation and connects a switch between the gateway and the RTU. This step can be detected by generated notifications from the door sensor and “link down detection” on the gateway, as indicated by blue exclamation marks.
Sniffing—the attacker configures the switch for hub behavior (or uses port mirroring), in order to see all the traffic and to get the IP address of the SCADA server.
Launching the attack—the attacker starts sending DoS traffic to the SCADA server to consume its resources.
SCADA server unavailability—if the attack is successful, the observability and controllability of the entire smart grid is lost.
4. Simulation Model
We have developed a simulation model which combines simulation and emulation techniques to accurately represent communication between a DSS and the control center. The main purpose of the model is to provide an option to verify real-life behavior of attacks for selected threats identified by the SG-TMT. The model scope, topology, and behavior were discussed with DSOs and authorities in Norway. This ensured high accuracy of the model, corresponding to a real digital secondary substation and the model’s usability in practice. The mentioned companies will be using the model to test additional threats on top of the work carried out in this article.
In the simulation model, we focus on DoS attack types as a result of the modeling process carried out in
Section 3. According to the threat modeling, eight of the threats are DoS threats that can lead to an attack with high likelihood. These include the distributed DoS, DoS through specially crafted message, TCP-SYN or UDP flooding, IP flooding, flooding DoS, interruption of data flow, and ARP flooding.
4.1. The Simulation Model Scope
The simulation model scope is shown in
Figure 5. The model contains a control center and one DSS. It is composed of four virtual machines, which represent the following devices:
Monitoring device—simulates behavior of a SCADA server, which would collect IEC104 messages. It uses Linux Lite 5.4 and the lib60870-5 library [
23], which provides the IEC104 communication—collecting messages from the RTU, replying with ACKs, and querying the RTU for specific information.
WAN R1—emulates a network router using pfSense 2.4.5—a router operating system. It is configured for routing and a VPN connection with the gateway.
Gateway—emulates the DSS router, which provides connectivity to the control center via a secured VPN connection. It uses the same pfSense software as the WAN R1.
RTU—simulates behavior of a real RTU with connected substation sensors. It uses the same software as the monitoring device—Linux Lite 5.4 and lib60870-5 library [
23]). The library is extended by custom scripts, which generates traffic corresponding to a real DSS (coming from several transformers’ temperature sensors and low-voltage switchboard multimeters).
The simulation model fully emulates only routers (WAN R1 and Gateway). The monitoring device and RTU are implemented by a combination of simulation and emulation. They do not run real SCADA software nor the RTU firmware, but they are based on a general Linux-based operating system (it therefore presents a certain simplification). On the other hand, IEC104 communication is fully emulated and corresponds to traffic from a real DSS.
4.2. Emulated IEC104 Communication
IEC104 communication used in the simulation model is fully emulated and can be therefore analyzed in tools such as Wireshark [
24]. This also allows to connect a real attacker machine (for example with Kali Linux [
25]) and to perform realistic attacks using real tools.
The model uses the lib60870-5 library with custom made scripts which modify the behavior to match data from a real DSS, which were provided by the Norwegian National Smart Grid Laboratory [
26].
The scripts establish two types of communication:
Periodical—type I messages are generated on the RTU every second. Every message contains aggregated data from 5 sensors placed into 5 IOAs (information object addresses). The messages use M_ME_TF_1 format (floating point values with a timestamp). All the values are randomly generated from intervals corresponding to real sensors and they are unique for every message. Reception of every message is confirmed by an ACK sent from the monitoring device.
Read requests—the monitoring device sends a read request in random intervals in a range of 1–60 s. Once a request is sent, a new interval is generated. A request is destined to the RTU and it queries one of its 7 IOAs, based on a randomly generated number from the interval 1–7. The RTU replies with a unique value corresponding to a real grid network. The monitoring device then confirms the receipt by an ACK.
We have provided the mentioned scripts for download at GitHub [
27] with two files:
control.c for the monitoring device and
rtu.c for the RTU.
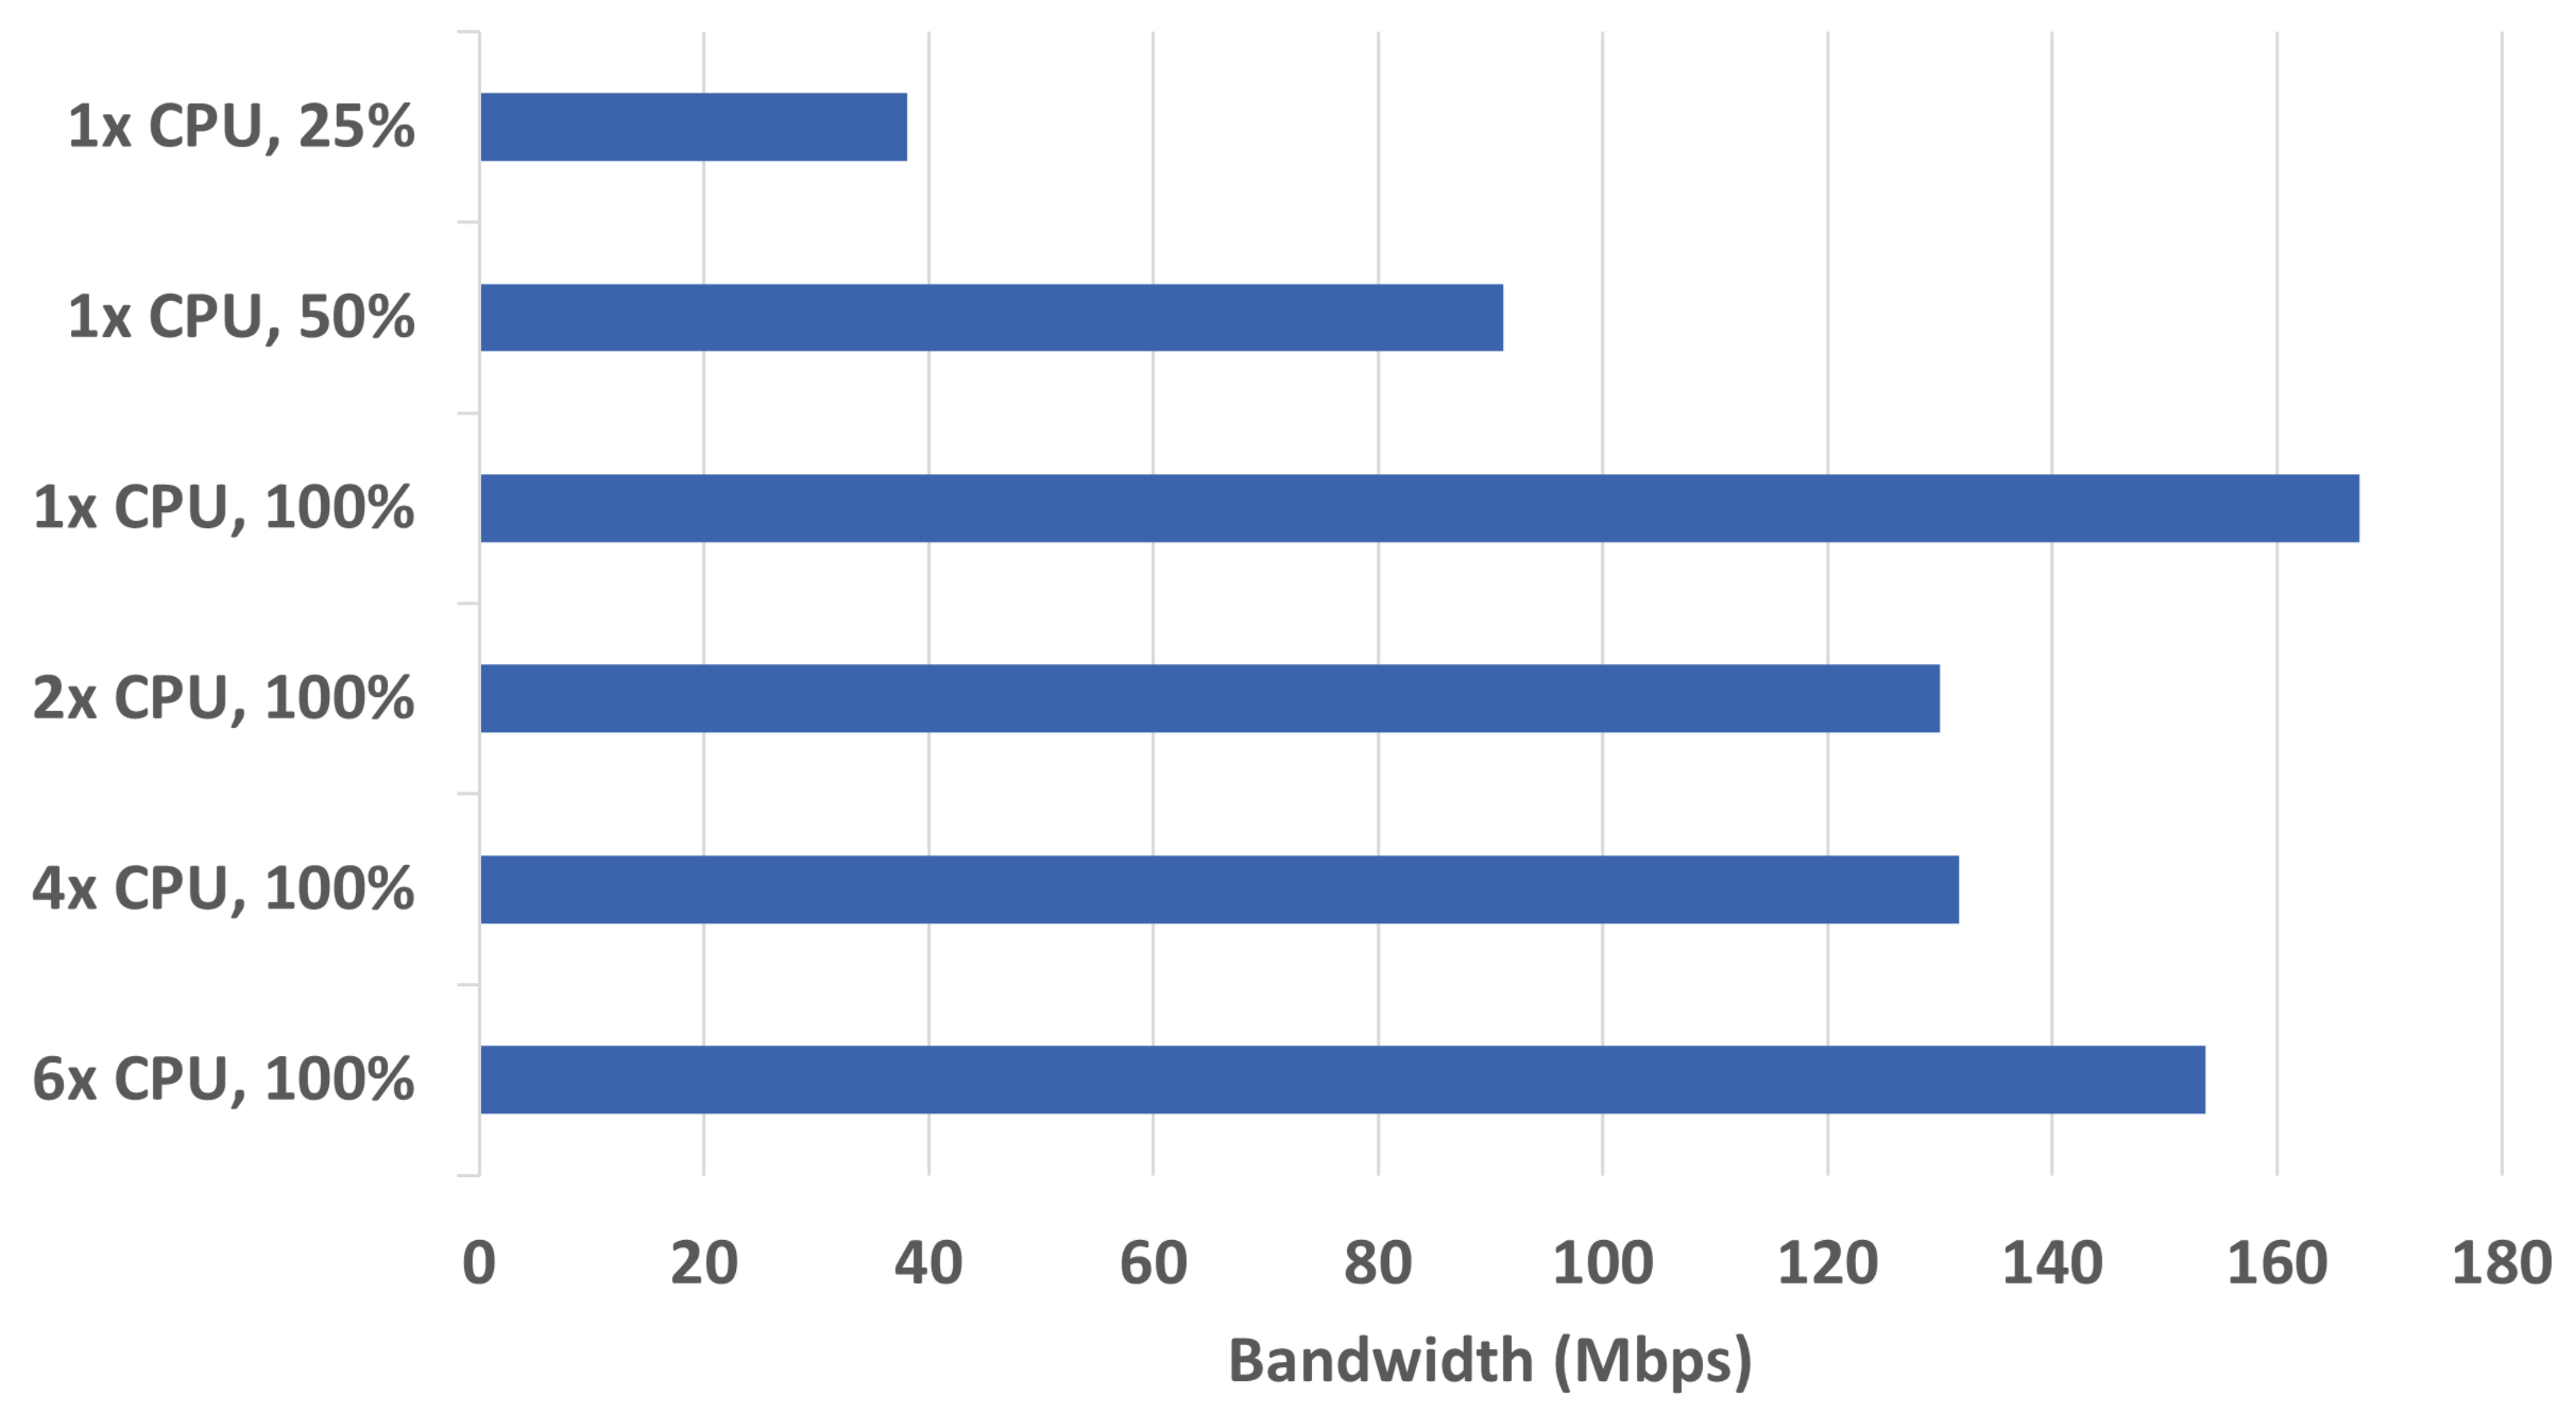
4.3. Model Performance
The simulation model was tested with various configurations of virtual machines CPUs—from 6 cores, to 1 core, to various maximum CPU utilizations (from 100% to 25%). All the tests were performed on a Dell Precision 5550 laptop with Intel Core i7-10850H at 2.7 GHz (with “Turbo Boost” disabled to eliminate varying cooling conditions), 32 GB RAM, and 512 GB SSD.
Performance was measured between the monitoring device and the RTU using iPerf for bandwidth measurement. Every experiment was repeated 5 times, and the highest and lowest values were eliminated. The average values from the remaining 3 measurements are shown in
Figure 6. The results show that the model achieves the best performance when all devices have assigned 1 CPU and can use up to 100% of the CPU. In this setting, each VM could use a dedicated core without a need to compete with other VMs as in the case of more cores (which introduces an additional overhead resulting in lower bandwidth). In all the following experiments, the model was therefore set to run with those parameters. RAM was assigned to the VMs so that its utilization was under 50% during all conditions (1 GB for routers and 2 GB for other devices).
5. Denial of Service Attack Evaluation
In
Section 3.6, we have identified DoS attacks as one of the most critical for the grid operation. In this section, we evaluated impacts of these attacks in the simulation model environment.
In general, DoS attacks can be divided into three categories:
Volume-based attacks—the simplest type uses brute force to overwhelm the target by traffic of any type.
Protocol-based attacks—this type uses more sophistication as it targets specific features of a network protocol, which can present a bottleneck (for example TCP SYN, ping of death, or packet fragmentation).
Application layer attacks—the last type targets only a specific service running on the target. This might be easier to achieve, but it does not have to influence other services running on the target.
In our experiments, we were focusing on volume-based attacks as they represent the most general type of attack, and give the most relevant and generic results.
5.1. Dos Attack Evaluation Methodology
This section describes the process of DoS attack evaluation.
5.1.1. Key Parameters
The methodology for performing attacks and measuring performance followed these principles:
The attacker was always connected between the RTU and the gateway and was targeting the monitoring device.
Performance metrics were measured between the monitoring device and the RTU (except the attacker’s metrics).
Every experiment was conducted for 30–40 s.
Time was synchronized on both the monitoring and the RTU devices using NTP.
Every metric was measured in 5 experiments, the lowest and the highest values were discarded, and the average value was calculated from the remaining 3 values.
5.1.2. Measured Metrics
The following metrics were measured:
Attacker’s outgoing bandwidth—shows the traffic generated by the attacker and sent out of their port. It is measured in Mbps and “packets per second” using the ethstats tool.
Available bandwidth—measures the bandwidth available for legitimate traffic during the attack in Mbps. The iPerf tool is used for the measurement with the monitoring device being configured as a server and the RTU as a client.
RTT (round trip time)—measures time an ICMP packet takes from the RTU to the monitoring device (Echo Request) and back (Echo Reply). It is measured using the ping tool.
Packet loss—the ping tool is used to calculate the percentage of lost packets.
Jitter—is defined as an absolute value of a difference between one way delays of two successfully received consecutive packets (if a packet is lost, the jitter is not defined). Maximum and average values are calculated using a custom IEC104 communication quality measurement script.
5.1.3. Iec104 Communication Quality Measurement Scripts
We have modified the scripts providing IEC104 communication to perform quality measurement between the RTU (
perfsend.c) and the monitoring device (
perfmon.c). These scripts are also published on GitHub [
27]. The scripts measure the following characteristics:
Delay—time between sending a message from the RTU and receiving it at the monitoring device, measured one-way only. The script uses timestamp information placed in information objects as the source time. The script measures current value, maximum, average, and number and percentage of messages exceeding defined threshold (marked as err—configured to 500 ms by default).
IPDV (instantaneous packet delay variation)—a difference between one-way delays of two consecutive packets. The script measures current value, maximum, minimum, average, and number and percentage of messages exceeding defined threshold (marked as err—configured to 500 ms by default).
Jitter—an absolute value of IPDV. The script calculates current value, maximum, and average.
Packet loss—the script estimates number and percentage of lost packets (based on duration of the experiment, received packets, and 1 s sending frequency). The script uses a sequence number inserted into the OA field to detect lost packets.
An example of the script results is shown in the following output (values in brown are also automatically saved into a .csv file for each received message—the rest of the values can be calculated from them).
--- Measurement in progress (54/60 s) ---
Delay: 2 ms, max: 11 ms, avg: 1 ms, err: 0 (0.00%)
IPDV: 3 ms, min/max: -4/35 ms, avg: 2 ms, err: 0 (0.00%)
Jitter: 3 ms, max: 35 ms, avg: 2 ms
5.1.4. Quality Metrics Definition
Our IEC104 communication quality measurement scripts can perform automated measurements and determine whether the traffic complies with defined QoS policies. These policies can be set in the scripts by configuring maximum thresholds of delay, IPDV, and packet loss. Results from such a measurement are shown in
Figure 7 for two DSS: DSS1 was under a DoS attack during the experiment, while DSS2 operated normally.
Concrete setting of thresholds depends on the application, but based on general best practices from communication networks, we have defined the following parameters to be accepted as borderline values for SCADA applications monitoring DSS:
Note: Our scripts use non-intrusive measurement via timestamps inserted in IEC104 messages, and they can therefore not measure available bandwidth. For this purpose, a dedicated tool such as iPerf has to be used if needed. However, such a measurement will saturate the network with traffic and can disrupt the legitimate communication. For this reason, it should not be used in a production network.
5.2. Attacker Performance
DoS attacks depend mostly on brute force power of the attacker. For this reason, distributed versions (DDoS), where a large number of infected devices are generating the attack traffic, are much more successful. In the model scenario, the performance of the system depends on virtual machine configuration, and it can be scaled down as shown in
Figure 6. Achieving enough “attack power” can therefore be easy.
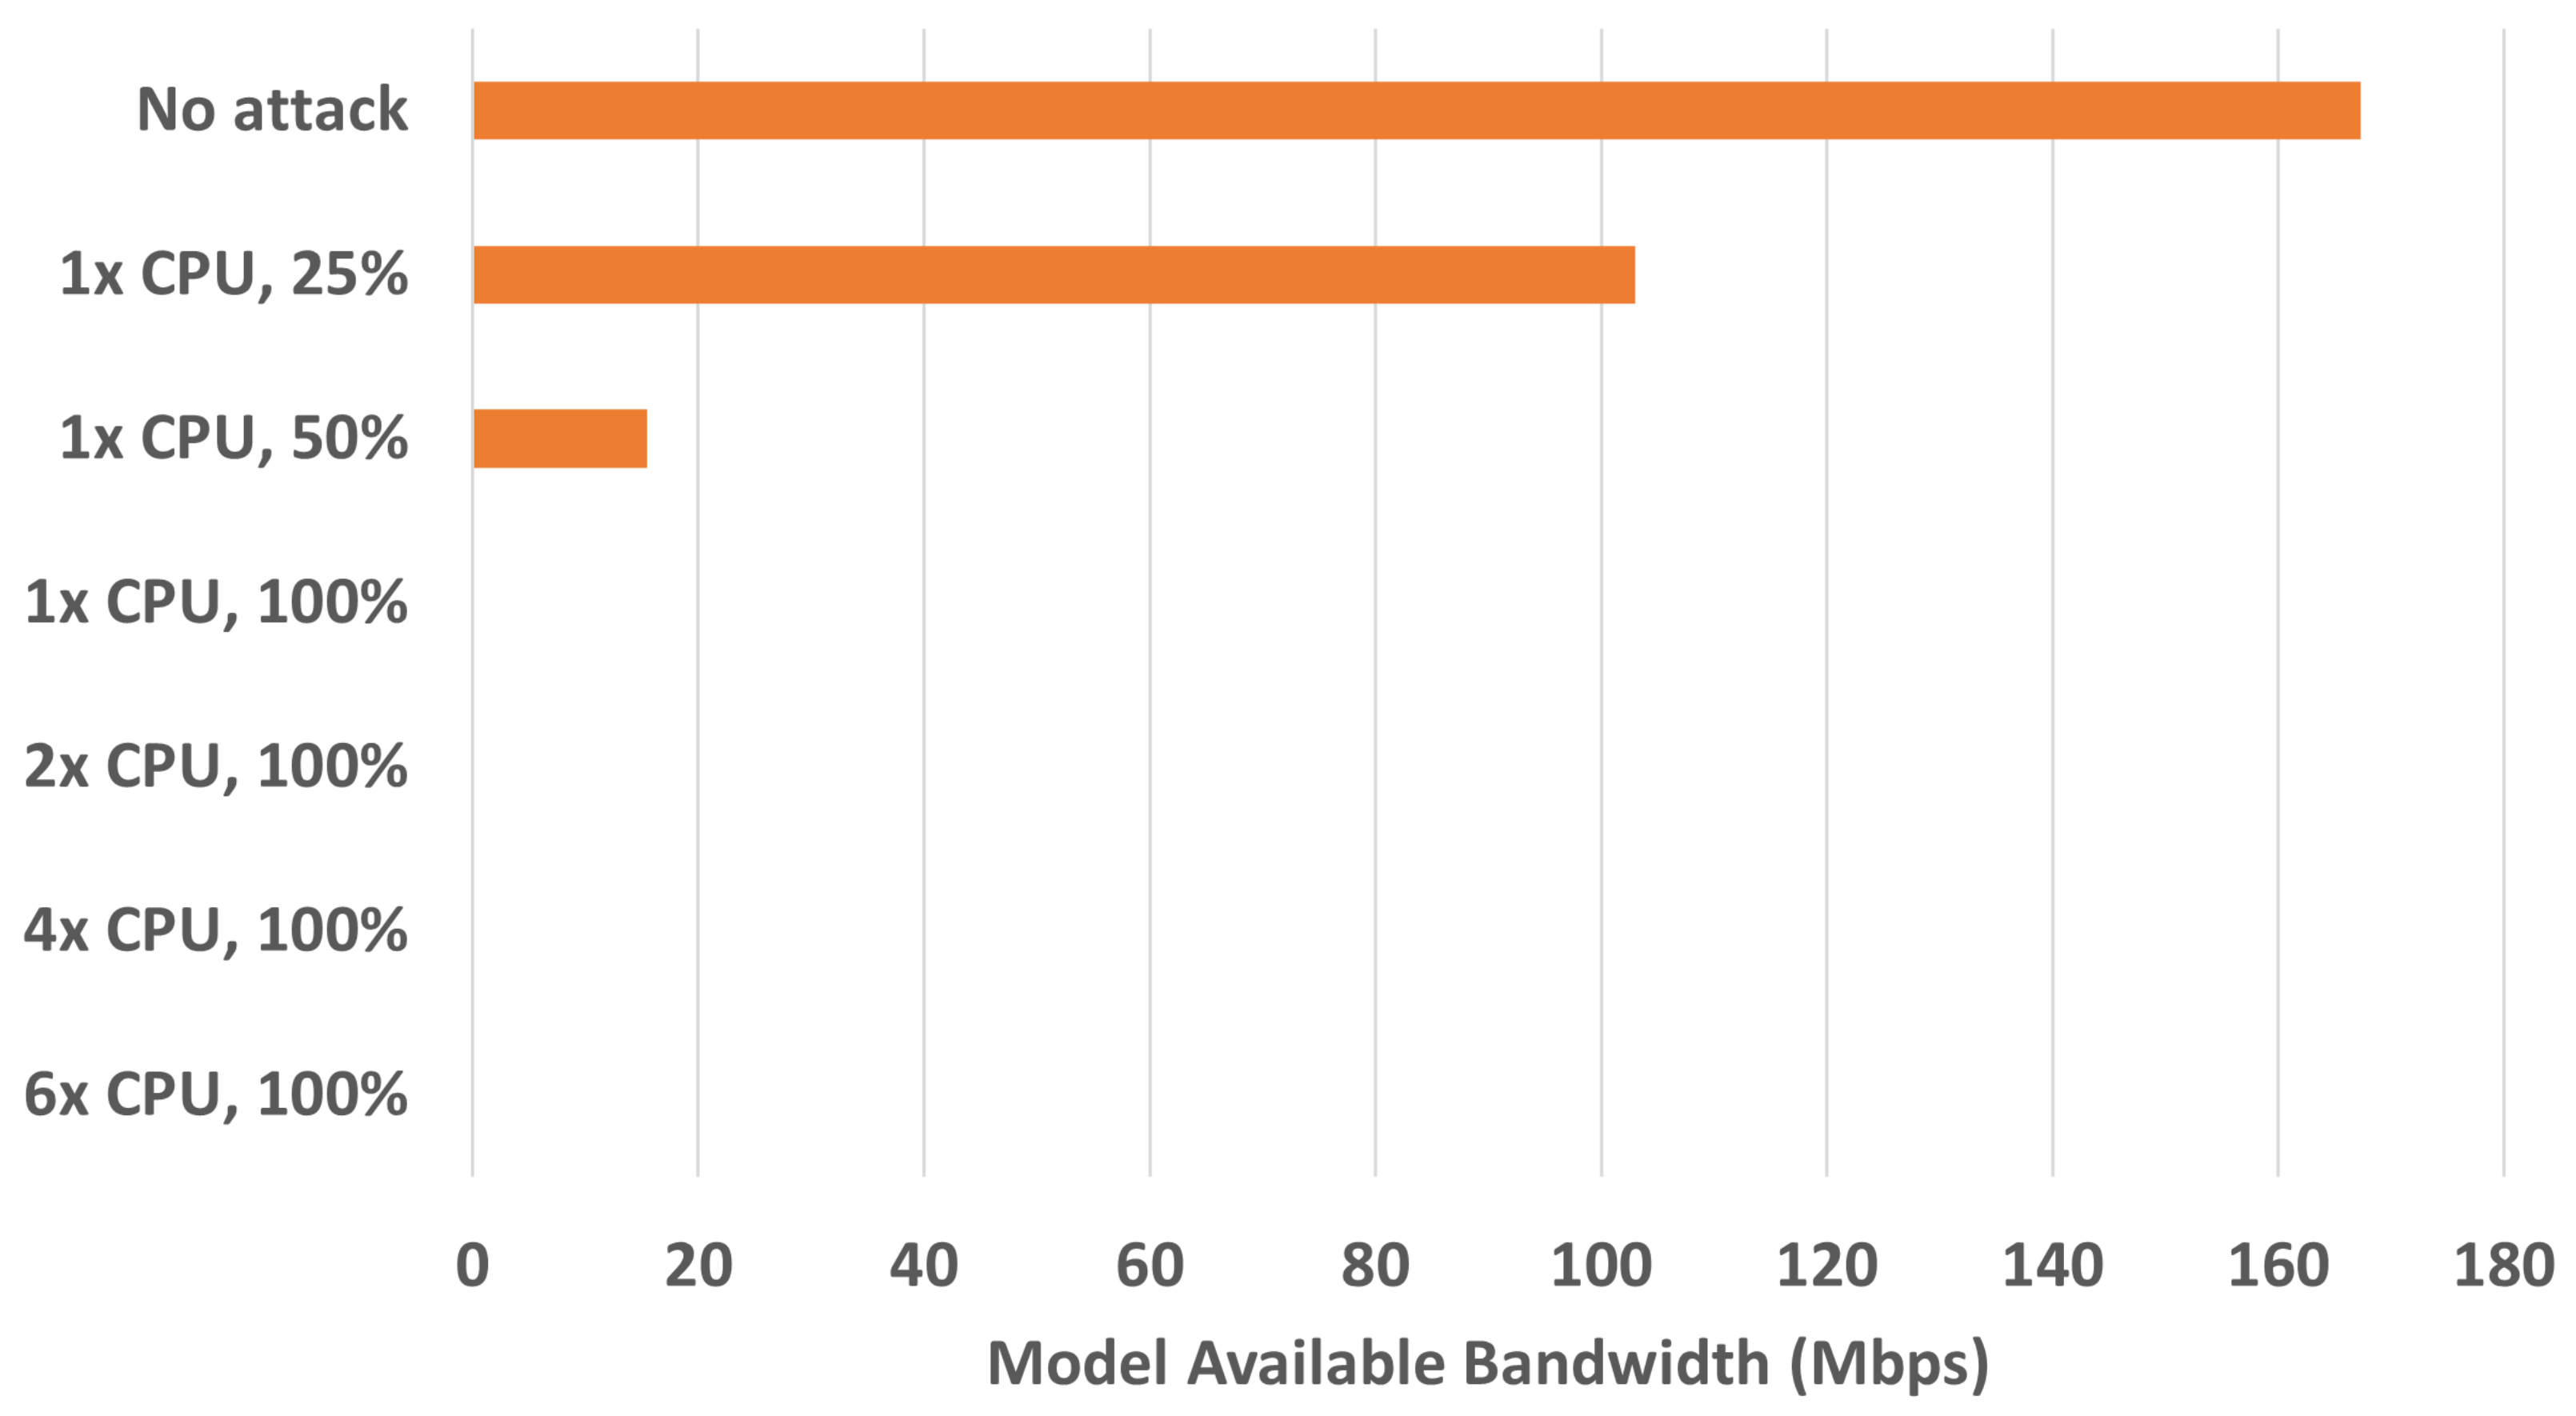
The effect of the attacker’s performance on the model is shown in
Figure 8. The attacker’s virtual machine is tested with the same CPU configurations as before, and RAM set to 4 GB. The figure shows that the attacker is able to perform a successful attack only when the attacker’s virtual machine performance is higher than the simulation model’s performance. This is the case of configurations where maximum CPU utilization was not limited, regardless of number of available cores. In these cases, all the packets of the legitimate traffic (between the monitoring device and the RTU) were lost as is shown from 0 available bandwidth. Limiting the attacker’s maximum CPU utilization (to 50% and 25%) resulted in attacks which were not able to completely overwhelm the model resources, as can be seen from the increasing available bandwidth of the model.
5.3. Attack Evaluation
5.3.1. Tested Attack Types
In all except one case, we used the hping3 tool to perform the attacks. In the remaining case, we used the Metasploit framework. We have tested the following attack types:
TCP SYN flood—the attack is generating initial connection request packets with varying TCP port numbers, forcing the monitoring device to keep half-open connections.
FIN/RESET flood attacks—these two types of attacks send fake packets which the monitoring device has to compare and process.
SYN FIN flood attack—this attack combines SYN and FIN by setting the both flags in generated packets.
UDP flood—the attack generates requests to services on random UDP port numbers, which the monitoring device has to process.
Push ACK flood—the attack uses TCP messages with push and ACK flags set, which forces the monitoring device to carry out extra processing when determining that no such connections exist.
Smurf attack—the attack uses spoofed ICMP messages to generate fake echo requests with source address of the RTU. The monitoring device is then trying to reply to the RTU (if it has enough resources), potentially making the attack dangerous for the RTU as well.
5.3.2. Performing the Attacks
Performing attacks with the hping3 tool is extremely simple as it requires only a single line command. Hping3 can be installed on most Linux distributions, or downloaded for Windows. An example of the TCP SYN flood attack is shown in the following line:
sudo hping3 -S --flood 1.1.10.10
Here, parameter -S generates SYN packets, parameter --flood performs flooding (sending as many packets as possible) and the IP address is the target (the monitoring device).
5.3.3. Testing the Attacker’s Brute Force Output
Volume-based DoS attacks rely on the attacker’s ability to generate as much traffic as possible. The first step was therefore to verify how much traffic the attacker’s virtual machine can generate. The results are shown in
Table 3.
The results show very consistent output traffic generated by all the attacks with the hping3 tool—except a slightly lower output in the case of the smurf attack. On the other hand, the Metasploit framework was able to generate only about 6% of the traffic generated by hping3.
5.3.4. Attack Results
Results of all the attacks’ impacts on the model are shown in
Table 4. Firstly,
iPerf was used to measure available bandwidth—it shows how much legitimate traffic could be still used during the attack. Secondly,
ping was used to measure RTT and packet loss of legitimate ICMP traffic. Finally, the custom script was used to measure average one-way delay and jitter (maximum and average).
Results are ordered from the least impacting attacks to the most impacting, while the SYN attack from the Metasploit framework had no negative impact on the model, the smurf, UDP, and RESET attacks were able to almost stop the legitimate traffic. The last four attacks made the IEC104 communication impossible as all the legitimate messages were lost.
5.4. The Attack Impacts
Results from the attacker’s output and the model behavior show that if the generated attack traffic is about 14 Mbps with traffic of around 30,000 PPS, it can stop the IEC104 communication. The fact that all the hping3 attacks had such similar results suggests that the network might have been a bottleneck, as opposed to performance of the monitoring device. This was examined in the following experiments.
5.4.1. The Monitoring Device Impacts
Figure 9 shows output from a system monitoring software running on the monitoring device. It shows CPU, memory, and network usage in three graphs during normal operation (no attack, normal IEC104 communication) and during a SYN attack using the
hping3 tool (period marked by the red rectangle). It is clear that the attack has almost no impact on the monitoring device CPU or RAM usage—a slight increase in CPU usage is a few percent at best while RAM utilization was not affected at all. The biggest impact was on the network interface card (NIC).
This was verified in a scenario where an additional DSS was connected to the monitoring device via a second NIC. During the attack, the RTU from DSS1 lost connection to the monitoring device, while the RTU from DSS2 was completely unaffected (measured statistics did not show any drop in performance).
5.4.2. The Network Impacts
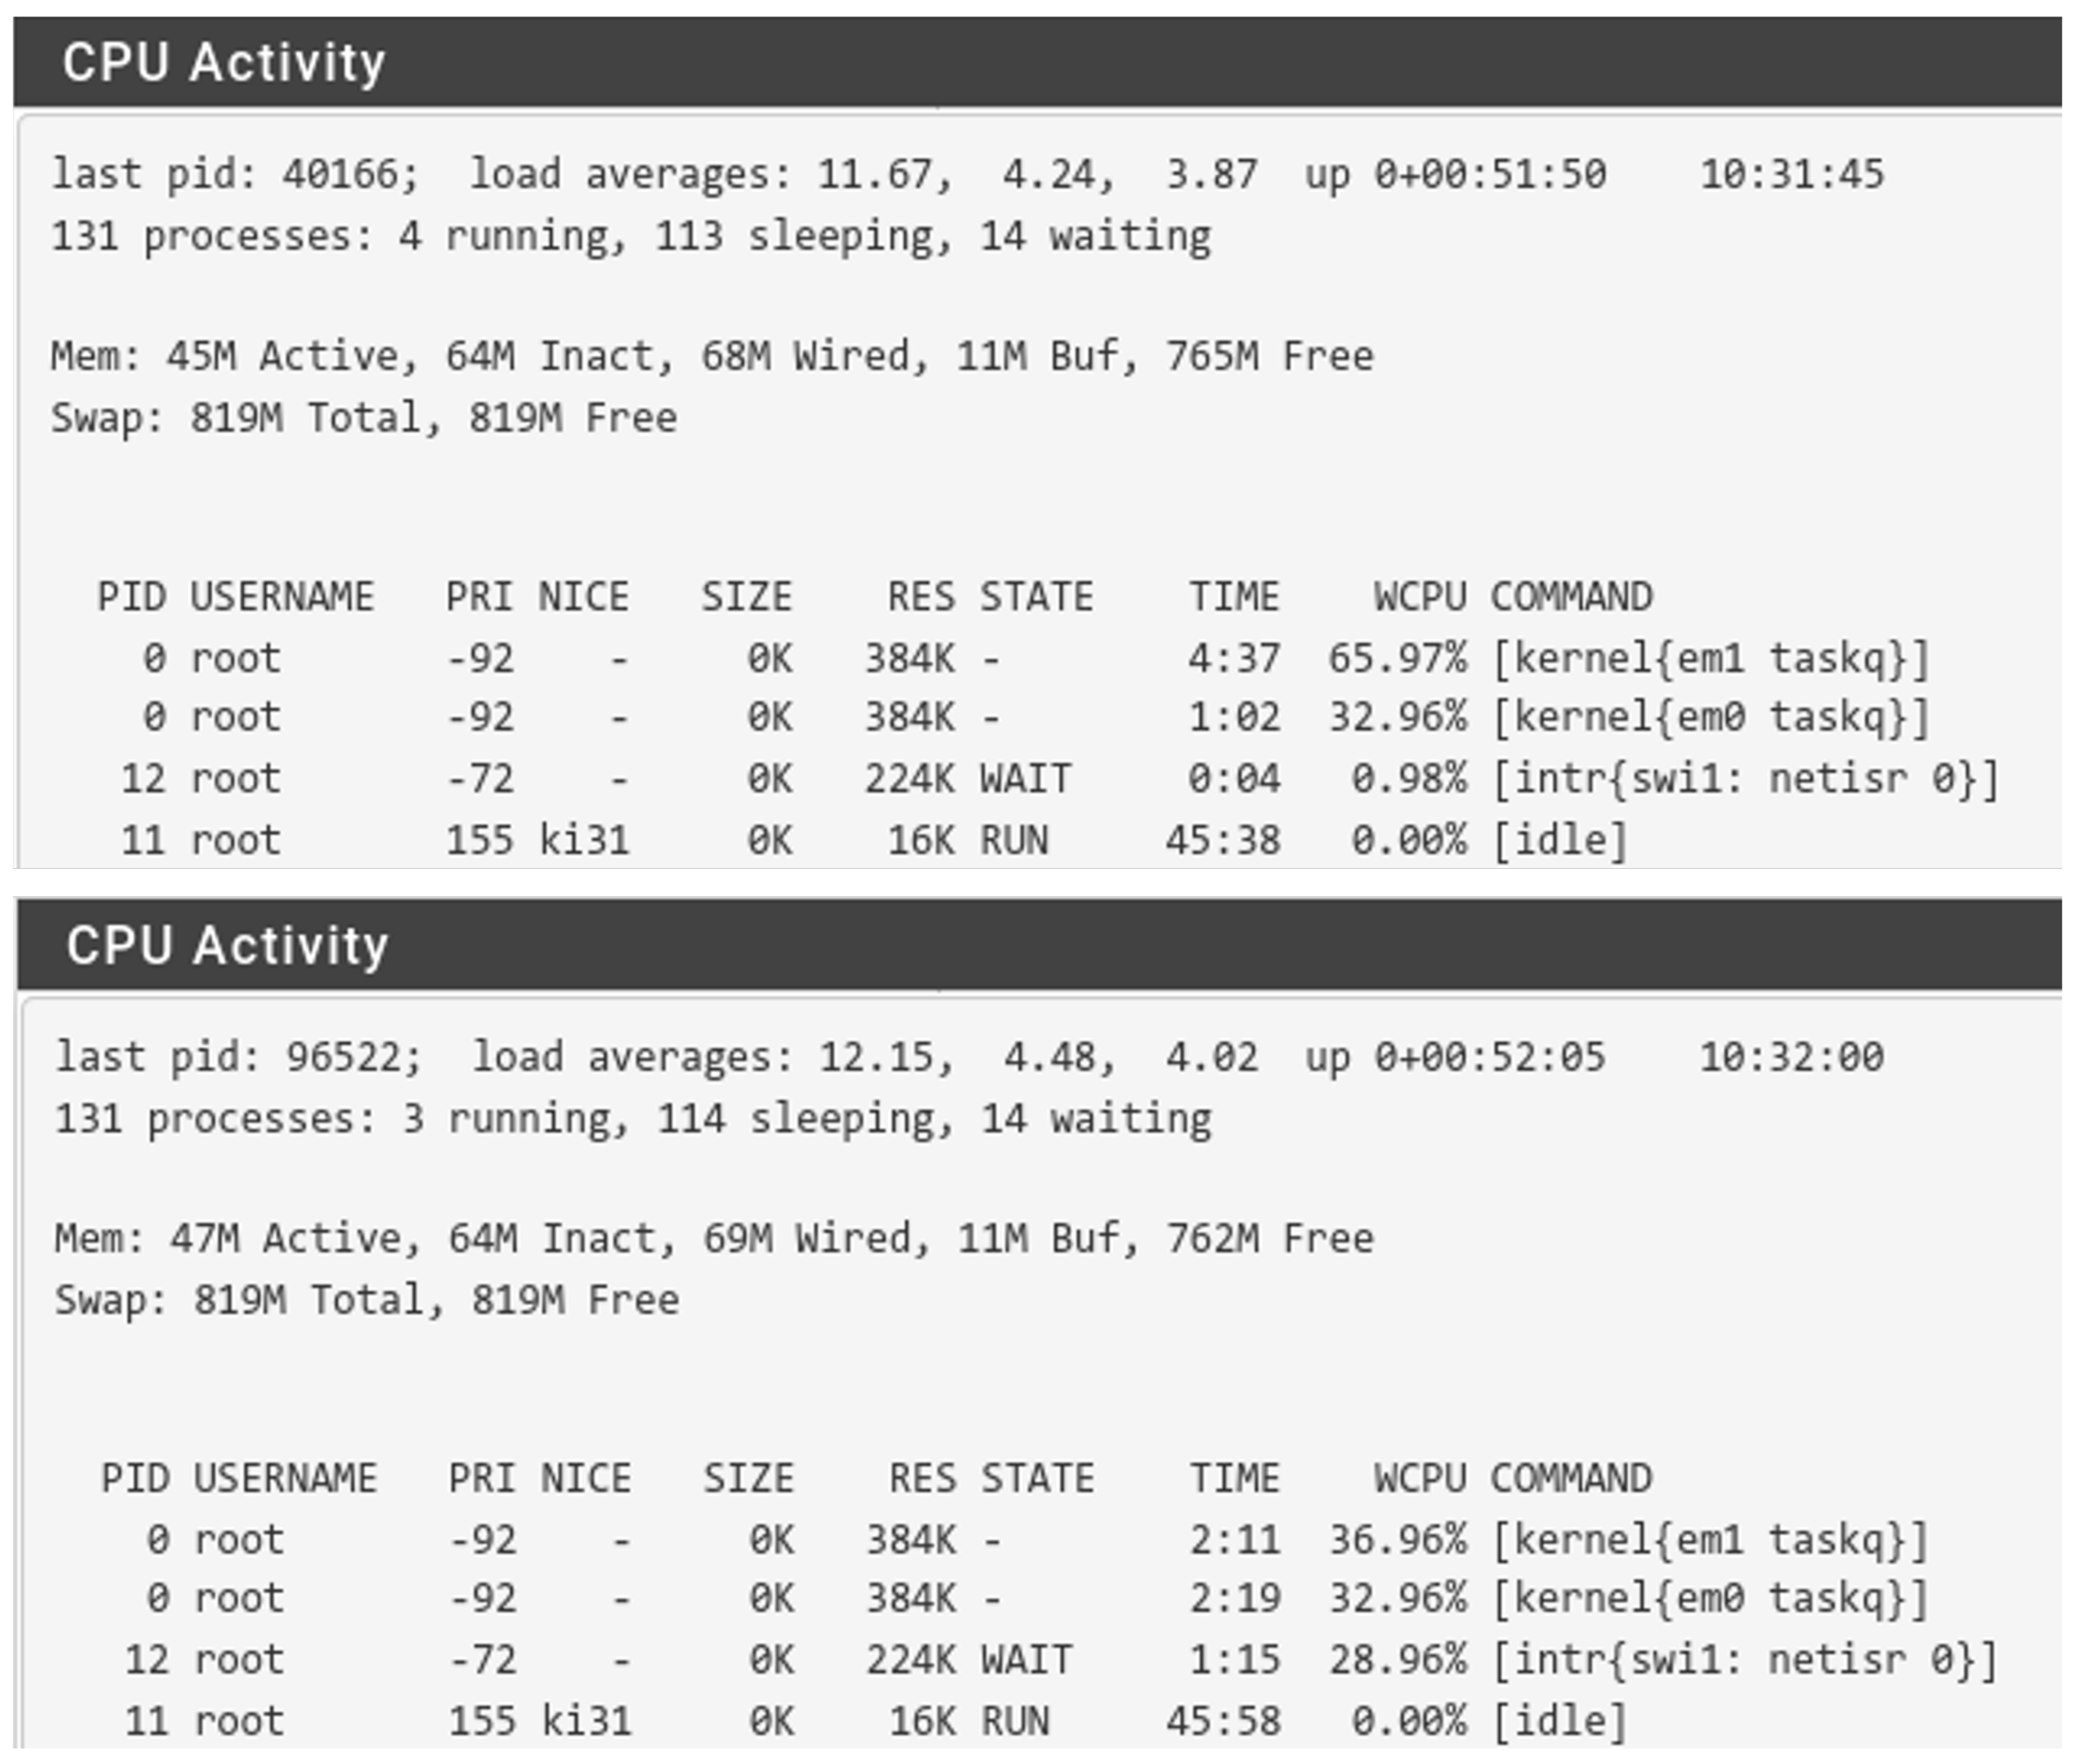
Low load of the monitoring device signifies that the performance bottleneck of the model might be the network itself. We have therefore explored utilization of both routers without and during the attack.
Figure 10 shows output of the “Diagnostics/System Activity” tool during the attack. Both routers’ CPUs were utilized at 100% as is apparent from the 0% idle process. The load is different between routers. On the GW, the most load (66%) comes from the
em1 interface, which is the source of the attack. The router is then unable to forward all the attacking traffic, which is apparent from a lower load (33%) on the interface leading to WAN R1 (
em0). Interface utilization on WAN R1 is more symmetric (37% and 33%), as the router is trying to cope with traffic destined to the monitoring device, as well as with the returning traffic. This cross traffic also results in higher ISO/OSI processing load (29%), which is represented by
swi1: netisr 0.
This load resulted in unresponsiveness of both routers when accessed by a GUI web interface or directly via a command line interface (CLI).
6. Discussion
6.1. Threat Modeling Challenges
During the threat modeling, a number of challenges with the SG-TMT were identified. Many of these challenges originate from trying to use STRIDE-per-interaction on a cyber physical system. The STRIDE model was created for use in threat modeling of software, and it is normally applied at a lower abstraction level than is the case with the SG-TMT.
Our research goal was to locate different types of threats in the secondary substation architecture, and for that reason we have developed and used two models. The use of two models was at times perceived as confusing by the threat modeling participants, and raised questions about what elements were involved or affected by a threat. However, the two models offered different points of views, whereas using only one model would cause some threats to be overlooked.
The scope of the threat modeling, in terms of number of modeled elements, affects the outcome of the process. One example from our model is an insider threat which is able to affect most parts of the SCADA system. Another example is the data flow between SCADA and the RTU in
Figure 2. This flow abstracts from a geographical distance, several routers, VPN, and two hops, where traffic is unprotected.
Evaluation of threats depends on what criteria the threat modeling participants agree upon. As an example, the priority of a threat can rely on consequence of the threat, probability of the threat, a combination of the two, or other properties (such as importance for the company or how easy it is to mitigate the threat). Scope and evaluation criteria should therefore be clearly defined by the threat modeling participants in order to define priority and applicability (“needs investigation” or “not applicable”) of a threat. Note that in this article the definition in
Section 1.3.1 is used. However, the evaluation of threats carried out in this work is subjective, even if the same evaluation criteria are used. As a result, two different teams performing threat modeling of the same use case are likely to arrive at different results.
The true target of a threat may be overlooked because of how STRIDE and the SG-TMT function. As an example, a malicious SCADA operator can send commands to the DSS from the control center and thus become a source of many threats affecting different elements in the model. This will result in generation of all insider threats between the operator and the SCADA server, including the threats that in reality affect the RTU in the DSS and not the SCADA server. Therefore, the real target of a threat may be a different element than what is indicated by the SG-TMT.
Lastly, the number and types of generated threats rely on how the element properties are configured. If element properties are given incorrect values when the model is created, the result of the threat modeling will be incorrect. For example, if the “Provides Encryption” property of a data flow is set to “true”, when it in fact is “false”, then threats to information disclosure will be excluded although they are relevant.
6.2. Threat Modeling Discussion
The automatic generation of threats makes it less likely that threats are overlooked. However, despite the automatic generation of threats, a substantial amount of discussion in the group is still needed for evaluation and classification of the threats; while this is a time consuming process, the discussion is useful for clarifying misunderstandings and identifying areas in need of further investigation.
The threat modeling in this work took 29.5 man-hours, compared with 109.5 in the CORAS study [
14]. This comparison is however not quite valid, as the simplified CORAS study included representatives of the grid company, something we have not carried out in our work. Furthermore, considerable time appears to have been devoted to establishing context and validating the results. Lastly, the CORAS study had an emphasis on risk and identified both vulnerabilities and assets in addition to threats.
6.3. Simulation Model Discussion
The attack experiments on the model showed that performing a DoS attack is extremely simple when an attacker gains access to a DSS. A publicly available tool, hping3, can be used on almost any device and the generated traffic has a potential to disrupt the grid communication.
In the simulation model, the performance bottleneck were the routers; while the simulation model showed high precision in emulated communication, this feature does not correspond to most real-world scenarios, where networking devices can typically handle much more traffic than end devices. Paradoxically, this makes the attack more dangerous—if the router would be a bottleneck, then only a portion of the attacker’s traffic would reach the SCADA server, potentially leaving the rest of the network unaffected. On the other hand, if all the attacker’s traffic reach the server, it has a higher potential to overcome the server’s resources, which would result in complete loss of observability and controllability of the entire grid.
7. Conclusions
Threat modeling carried out with the Smart Grid Threat Modeling Tool has identified 92 threats, of which 35 were classified as high-priority threats, and 24 of these, in turn, needed further investigation. These threats were further assessed based on their likelihood of occurrence. The most critical threats, which also represented the largest category according to the STRIDE model, were denial of service threats, which thus were selected for detailed testing in the high-precision simulation model.
The simulation model utilized emulation of IEC 104 communication and provided custom scripts for periodical and request/reply communication between a substation and the control center. These scripts can optionally measure various QoS parameters and can automatically determine—if the communication parameters are within set thresholds. These scripts were made publicly available on GitHub [
27].
Seven denial of service attacks were tested in the simulation model using the hping3 tool and the SYN attack was also replicated using the Metasploit framework. Results show that even with a simple tool and one command, the attacker can saturate the network bandwidth and potentially also infrastructure devices and the SCADA server, which would interrupt the entire smart grid observability and controllability.
Complete results from threat modeling and simulation validation are being used by grid companies in Norway to improve their security measures. Results provided in this article can be used by grid operators to better protect the electric power grid’s networks, especially against denial of service attacks—for example, by appropriate firewall configurations.
In our future work, we intend to keep using the simulation model to validate impacts of less critical threats, such as elevation of privilege and spoofing. In parallel, we are starting to replicate the described methodology of threat modeling, threat classification, and threat simulation in the area of digital primary substations. This will require the use of simulation model extensions, including different types of emulated communication.
Author Contributions
Conceptualization, M.G.J. and J.F.; methodology, M.G.J., J.F. and S.Y.Y.; software, F.H. and L.H.F.; validation, F.H. and L.H.F.; formal analysis, all authors; investigation, L.H.F. and F.H.; resources, L.H.F. and F.H.; data curation, F.H.; writing—original draft preparation, F.H. and L.H.F.; writing—review and editing, F.H., L.H.F., S.Y.Y. and M.G.J.; visualization, F.H. and L.H.F.; supervision, M.G.J., J.F. and S.Y.Y.; project administration, J.F.; funding acquisition, J.F. All authors have read and agreed to the published version of the manuscript.
Funding
This research was funded by the Research Council of Norway, Innovation Project for the Industrial Sector–ENERGIX program, project number 296381 (Security of supply in smartgrids with interacting digital systems).
Conflicts of Interest
The authors declare no conflict of interest.
Abbreviations
The following abbreviations are used in this manuscript:
| ACK | acknowledgment |
| BGP | border gateway protocol |
| BW | bandwidth |
| CLI | command line interface |
| CPU | central processing unit |
| DFDs | data flow diagrams |
| DoS | denial of service |
| DDoS | distributed denial of service |
| DSO | distribution system operator |
| DSS | digital secondary substation |
| GUI | graphical user interface |
| ICMP | internet control message protocol |
| IEC | International Electrotechnical Commission |
| ICT | information and communications technology |
| IOA | information object address |
| IP | internet protocol |
| IPDV | instantaneous packet delay variation |
| ISP | internet service provider |
| MS-TMT | Microsoft Threat Modeling Tool |
| NIC | network interface card |
| NTP | network time protocol |
| PMU | Phasor measurement unit |
| PPS | packets per second |
| QoS | quality of service |
| RAM | random access memory |
| RTT | round trip time |
| RTU | remote terminal unit |
| SCADA | supervisory control and data acquisition |
| SG-TMT | Smart Grid Threat Modeling Template |
| SSD | solid state drive |
| TCP | transmission control protocol |
| UDP | user datagram protocol |
| VM | virtual machine |
| VPN | virtual private network |
| WAN | wide-area network |
References
- ICS-CERT. Cyber-Attack Against Ukrainian Critical Infrastructure. IR-ALERT-H-16-056-01. 2016. Available online: https://us-cert.cisa.gov/ics/alerts/IR-ALERT-H-16-056-01 (accessed on 17 September 2021).
- Slowik, J. Crashoverride: Reassessing the 2016 Ukraine Electric Power Event as a Protection-Focused Attack; Dragos, Inc.: Hanover, MD, USA, 2019. [Google Scholar]
- Cherepanov, A. WIN32/INDUSTROYER: A New Threat for Industrial Control Systems. 2017. Available online: https://www.welivesecurity.com/wp-content/uploads/2017/06/Win32_Industroyer.pdf (accessed on 17 September 2021).
- CISA. Alert (TA18-074A) Russian Government Cyber Activity Targeting Energy and Other Critical Infrastructure Sectors. 2018. Available online: https://www.cisa.gov/uscert/ncas/alerts/TA18-074A (accessed on 20 January 2022).
- Goel, S.; Hong, Y. Security Challenges in Smart Grid Implementation. In Smart Grid Security; Springer: London, UK, 2015; pp. 1–39. [Google Scholar] [CrossRef]
- Langner, R. Stuxnet: Dissecting a Cyberwarfare Weapon. IEEE Secur. Priv. 2011, 9, 49–51. [Google Scholar] [CrossRef]
- Flå, L.H.; Borgaonkar, R.; Tøndel, I.A.; Jaatun, M.G. Tool-assisted Threat Modeling for Smart Grid Cyber Security. In Proceedings of the 2021 International Conference on Cyber Situational Awareness, Data Analytics and Assessment (CyberSA), Dublin, Ireland, 14–18 June 2021; pp. 1–8. [Google Scholar] [CrossRef]
- Rencelj Ling, E.; Ekstedt, M. Generating Threat Models and Attack Graphs based on the IEC 61850 System Configuration description Language. In Proceedings of the 2021 ACM Workshop on Secure and Trustworthy Cyber-Physical Systems, Virtual Event, USA, 28 April 2021; pp. 98–103. [Google Scholar]
- Johnson, P.; Lagerström, R.; Ekstedt, M. A meta language for threat modeling and attack simulations. In Proceedings of the 13th International Conference on Availability, Reliability and Security, Hamburg, Germany, 27–30 August 2018; pp. 1–8. [Google Scholar]
- The MITRE Corporation. MITRE ATT&CK®. 2021. Available online: https://attack.mitre.org/ (accessed on 20 January 2022).
- IEC TR 61850-1:2013. 2013. Available online: https://webstore.iec.ch/publication/6007 (accessed on 20 January 2022).
- Sun, L. SCLEX-Lang: A Threat Modeling Language for Substation Automation Systems. 2020. Available online: http://www.diva-portal.org/smash/get/diva2:1505938/FULLTEXT01.pdf (accessed on 20 January 2022).
- Hawrylak, P.J.; Haney, M.; Papa, M.; Hale, J. Using hybrid attack graphs to model cyber-physical attacks in the smart grid. In Proceedings of the 2012 5th International Symposium on Resilient Control Systems, Salt Lake City, UT, USA, 14–16 August 2012; pp. 161–164. [Google Scholar]
- Omerovic, A.; Vefsnmo, H.; Gjerde, O.; Ravndal, S.T.; Kvinnesland, A. An Industrial Trial of an Approach to Identification and Modelling of Cybersecurity Risks in the Context of Digital Secondary Substations. In International Conference on Risks and Security of Internet and Systems; Springer: Cham, Switzerland, 2019; pp. 17–33. [Google Scholar]
- Tøndel, I.A.; Jaatun, M.G.; Line, M.B. Threat modeling of AMI. In Critical Information Infrastructures Security; Springer: Berlin/Heidelberg, Germany, 2013; pp. 264–275. [Google Scholar]
- Khan, R.; McLaughlin, K.; Laverty, D.; Sezer, S. STRIDE-based threat modeling for cyber-physical systems. In Proceedings of the 2017 IEEE PES Innovative Smart Grid Technologies Conference Europe (ISGT-Europe), Turin, Italy, 26–29 September 2017; pp. 1–6. [Google Scholar]
- Sion, L.; Yskout, K.; Van Landuyt, D.; van den Berghe, A.; Joosen, W. Security Threat Modeling: Are Data Flow Diagrams Enough? In Proceedings of the IEEE/ACM 42nd International Conference on Software Engineering Workshops, Seoul, Korea, 27 June–19 July 2020; pp. 254–257. [Google Scholar]
- Sion, L.; Yskout, K.; Van Landuyt, D.; Joosen, W. Solution-aware data flow diagrams for security threat modeling. In Proceedings of the 33rd Annual ACM Symposium on Applied Computing, Pau, France, 9–13 April 2018; pp. 1425–1432. [Google Scholar]
- Salazar, L.; Ortiz, N.; Qin, X.; Cardenas, A.A. Towards a High-Fidelity Network Emulation of IEC 104 SCADA Systems. In Proceedings of the 2020 Joint Workshop on CPS; IoT Security and Privacy (CPSIOTSEC’20), Virtual Event, 9 November 2020; Association for Computing Machinery: New York, NY, USA, 2020; pp. 3–12. [Google Scholar] [CrossRef]
- Nguyen, T.N.; Liu, B.H.; Nguyen, N.P.; Chou, J.T. Cyber Security of Smart Grid: Attacks and Defenses. In Proceedings of the ICC 2020—2020 IEEE International Conference on Communications (ICC), Dublin, Ireland, 7–11 June 2020; pp. 1–6. [Google Scholar] [CrossRef]
- Mohammadpourfard, M.; Weng, Y.; Pechenizkiy, M.; Tajdinian, M.; Mohammadi-Ivatloo, B. Ensuring cybersecurity of smart grid against data integrity attacks under concept drift. Int. J. Electr. Power Energy Syst. 2020, 119, 105947. [Google Scholar] [CrossRef]
- Gunduz, M.Z.; Das, R. Cyber-security on smart grid: Threats and potential solutions. Comput. Netw. 2020, 169, 107094. [Google Scholar] [CrossRef]
- Zillgith, M. libIEC61850/lib60870-5|Open Source Libraries for IEC 61850 and IEC 60870-5-104. 2020. Available online: https://libiec61850.com/libiec61850/ (accessed on 17 September 2021).
- Wireshark. 2021. Available online: https://www.wireshark.org/ (accessed on 17 September 2021).
- Limited, O.S. Kali Linux. 2021. Available online: https://www.kali.org/ (accessed on 17 September 2021).
- Smart Grid Laboratory-SINTEF. 2017. Available online: https://www.sintef.no/en/all-laboratories/smartgridlaboratory/ (accessed on 17 September 2021).
- Holik, F. GitHub: Filipholik/DSS: Emulation of Digital Secondary Substation Communication. 2021. Available online: https://github.com/filipholik/DSS/tree/main/Communication (accessed on 17 September 2021).
| Publisher’s Note: MDPI stays neutral with regard to jurisdictional claims in published maps and institutional affiliations. |
© 2022 by the authors. Licensee MDPI, Basel, Switzerland. This article is an open access article distributed under the terms and conditions of the Creative Commons Attribution (CC BY) license (https://creativecommons.org/licenses/by/4.0/).


 ,
, 


