1. Introduction
Modern power systems are subjected to variability, uncertainty, and location dependency. In conventional power systems, the generation reserve capacity of the power system determines the system flexibility. When the uncertainty pervades to the demand side to a larger scale than supply side, the types of required flexibility change simultaneously. Advances in technology for power system planning and operation have helped flexibility with new resources and services [
1,
2]. Power imbalances between generation and demand can occur, among others, due to the loss of power generators or increase in load. These imbalances cause frequency fluctuations, and subsequently the grid becomes unstable, even leading to black-outs [
3]. Power and voltage instability is one of the main problems of power systems operation. Hence, the stability margin is kept within a sufficient range by several costly procedures such as load shedding [
4]. Developing countries sometimes face a huge mismatch which leads to the two-fold energy crisis which is either unreliable electricity or system failure. While the former affects the utility’s credibility, the latter affects the power system infrastructure. In both cases, this damage to the power system has negative implications on the country’s economy [
5]. Therefore, it is vital to minimize this mismatch with efficient techniques and produce claims close to the practical application for the betterment of the power system and consequently improve the economy.
When there is an excessive generation, the mismatch is reduced by providing incentives to businesses and industry i.e., increasing the demand in a resourceful manner, while, in the case where the demand exceeds generation, the mismatch is reduced by shedding power from certain feeders or regions such that the overall demand remains under generation [
6]. This shutdown of power is known as selective load shedding or forced load shedding (FLS) [
7,
8]. FLS keeps the demand under generation at all times, but there are certain challenges associated with this method which include the price to be paid by the utility for the value of the lost load, inefficient utilization of available generation, utility’s credibility to provide energy, and hurting the consumer comfort. One of the possible solutions to keep demand under generation involves the usage of smart electricity meters which provide highly granular data of electricity consumption [
9].
The smart electricity meter data are being used in various applications as it provides greater detail of insight into consumer routine and consumption patterns. The highly granular time series data with a timestamp has given rise to several big data applications that can benefit the power sector both financially and administratively [
10]. The collected data can drive the company to wisdom and efficient decision-making by deducing information from collected data and applying expert knowledge for data-driven decision-making A review of smart grids and efforts by different sectors emphasize the importance of modern smart technologies in the power sector deployments [
11]. The optimal generation scheduling, storage, and management enhance the overall efficiency of power sector utilities using smart technologies [
12,
13]. The detailed study of distribution transformer loading using the highly granular data collected by these distribution transformers indicates the effects of increasing load, allowable percentage penetration of renewable, installation of efficient storage techniques, and a mega infrastructure replacement plan for increased load and higher penetrations of renewable energy [
14,
15].
Aslam et al. uses several techniques to implement SLS without having highly granular data and applies to all meters irrespective of their consumption pattern [
5]. Stefan et al. use a dynamic load model to shed load and stabilize the power system when the system goes under voltage [
16]. Crucian et al. introduce a similar concept of soft load shedding where some percentage of load is to be shed on customer meters in case of voltage collapse, the approach differs in use case and data-driven methodology applied in our soft load sheddingalgorithm [
17]. Sanaye et al. use a genetic algorithm to solve the steady-state load shedding optimizing problem to restore power system to a normal condition after generator tripping [
18]. Sakikala et al. used two fuzzy logic algorithms to detect shed able load and predict the amount of load shed [
19]. Noman et al. presented a centralized and distributed algorithm to enable control of distributed solar capacity that enforces fair grid energy access [
20]. Srinivasan et al. demonstrate a city-scale smart meter data set that can be used for correlation between size and age of building to its energy use and renewable penetration also provides a detailed study on the impact of increasing renewable penetration at city-scale [
21]. Haroon et al. demonstrate that measuring demand consumption helps understand consumers’ energy consumption and suggests demand response programs [
22]. Noman et al. proposed a novel building DLC system that allows several user-defined voltage levels other than power or no power [
23]. Madhur et al. predict building consumption in real-time using historical data and propose several demand response models [
24]. James et al. proposed a method to select optimal customers to target for shifting of power from peak hour to off-peak time [
25]. Similarly, Kelkar et al. implemented such a strategy using the smart control unit (SCU) using the categorization of loads as essential (E) and non-essential (N) and giving the switching control to user [
26].
Since the demand and supply balance is crucial for any electrical power system, the proposed study addresses the respective field. More work has been carried out in the research areas considering the hardware of metering infrastructure and involves lesser resolution data; such architectures can lead to irregular claims in the real-world application. With the advent of Advanced Metering Infrastructure (AMI), the smart electricity meters periodically record energy consumption data in the form of time series. This enormous time-series energy consumption data are useful for the solution of challenges associated with the power system including the demand and supply mismatch. The incoming data can be used for the determination of consumption patterns and evaluation of consumer comfort with the targeted approach to reducing demand such that the demand curve follows the generation curve at all times using a defined architecture.
This study proposes a novel strategy based on Soft Load Shedding (SLS), which uses highly granular real-world time series energy consumption data and implements a strategy to minimize the mismatch between demand and supply. The highly granular 1-min consumption data obtained from the consumer site provides detailed insight into consumer behavior, while the consumer patterns can be resourceful to evaluate the energy quanta and reduce the peak demand especially, in the period of excessive demand. SLS uses the consumer insight and follows the real-world classification of feeders and regions, and observes a reduction in demand based on the real-world consumption data, imitating the consumer’s consumption pattern. This partial reduction of load ensures that the residential demand is alleviated while minimizing the surplus un-utilized generation. The proposed strategy allows the utility grid to carry out the partial load reduction such that the demand remains under supply while ensuring minimum mismatch. The novelty and contribution of the study are summarized as:
The technique proposes the underlying constraints and relations between demand and supply of a power system in context to the latest state-of-the-art research and formulate a problem related to energy supply and demand mismatch.
The proposed strategy uses brownout strategy or SLS to allocate percentage of energy quantum to the connected consumers. SLS extracts useful consumer behavioral insight to deduce patterns from high resolution energy consumption data and define a linear objective function within the relations and constraints defined based on the literature.
The SLS is validated upon different real-world dataset to reduce the demand and supply mismatch; and offer a base case comparison to measure the SLS performance. The technique proposes a significant reduction in the energy mismatch and is beneficial in future concepts of smart grids.
The rest of the paper is arranged as follows: The problem description in
Section 2 defines the problem statement and summarizes data granularity and resolution.
Section 3 discusses the proposed methodology to minimize the mismatch.
Section 4 demonstrates and illustrates the outcomes of the simulation after implementation of the proposed methodology for the given problem.
Section 5 describes the conclusions of the paper.
2. Problem Description
The problem description is comprised of the problem statement
Section 2.1 which defines the underlying problem and highlights the need to resolve the issue, and data description
Section 2.2 which identify the type of data, the data resolution/granularity, and data pre-processing.
Section 2.3 extracts useful features from incoming raw data.
2.1. Problem Statement
The research problem caters to minimize the demand and supply mismatch using high-resolution real-world time series obtained as a referenced output signal from a consumption site. The obtained data are pre-processed and provided to the proposed architecture which imitates the real-world constraints, and settings of power system also imitate the consumer’s usage patterns to reduce mismatch for an efficient performance of the power system.
2.2. Data Description
The generation and consumption of electrical power is an instantaneous process as the stipulated power is generated at the same instant. Therefore, the constraint to maintain the balance between demand and supply at all times is ensured for reliable electricity and optimal power dispatch. Being instantaneous in nature, the time variance of electrical consumption data is essential to identify uniqueness of each data point in the electrical consumption data.
In AMI or the traditional architecture, the electricity consumption pattern is collected after a fixed interval, which comprises of energy consumption units, the maximum demand indicator, and other related auxiliary attributes. In the traditional architecture, the electricity consumption data are recorded once a month and are kept accordingly, i.e., attributed monthly. This monthly consumption data are solely used for billing and serve no other purpose due to its lack of granularity. However, the AMI architecture integrates modern technologies in the traditional framework to reduce the fixed interval from a single record per month to a single record per minute. With the support of the state-of-the-art technologies and optimal architecture, the specified transformation provides highly granular data, which provides an insight into consumers’ energy patterns. The resultant patterns help to solve major power system problems such as electricity theft, harmonics reduction, fault detection, load shedding, and many more. Although the AMI architecture provides a framework and data to resolve major power system problems, it introduces some challenges which were not previously discussed in traditional architecture such as security, and the exponential increase in the incoming data. This introduces a domain of big data technologies in the field of the electrical power system. The electricity consumption data record in any fixed interval is uniquely identified with a timestamp defined in that particular interval, i.e., month-wise or minute-wise. The series or data which is uniquely identified using a timestamp is known as a time series or data. A time series unlike other sequences or series tracks the movement of a chosen attribute over a fixed interval of time; this tracking helps to observe the factors influencing the designated attribute over time. The growth of the specified attribute can be predicted using a technique named the time series analysis. This technique predicts the event through a sequence of time by analyzing the trends of the past with two main goals, which are as follows:
2.3. Data Processing
The data set used for implementation is the PRECON data set [
27]. The smart meters are placed in the second largest city of the region, which is also a cultural hub with great diversity with a population of more than 10 million. Some important considerations include a minimum two-person residence and one meter per house to achieve an accurate consumption level. For installation eGauge, smart meters are installed having three voltage sensors, current sensors, and a memory to retain data for 1-year at 1-min granularity. The device also has a built-in web server and is fully configurable over the internet. The smart meter connectivity is either over LAN, Wi-Fi, or 4G network based on the location. The data set is comprised of 42 households sharing consumption data at 1-min granularity. All selected 42-households belong to different regions of the city with different financial statuses and different numbers of residents; such a data set is good in terms of diversity. Smart energy meters provide highly granular, high-resolution energy consumption data which can be used for data analytics. A traditional energy meter provides a single reading per month, 1 data point/month or 1 dp/mon, while the smart meters are operational and the same residence records 1 dp/mon. If we extrapolate to a month, we have
= 43,200 dp/mon. For a single residence, the increase in the incoming data points is enormous, i.e., 1 dp to 43,200 dp.
If the energy consumption data are used only for billing purposes, then 1 dp/mon is suitable; however, in the AMI domain where consumption patterns and consumer behavior play a vital role, 1 dp/mon is insufficient. The highly granular incoming data can be used for the determination of consumer behavior, observation of Non-Intrinsic Appliance Load Management (NILM), identification of electricity theft, study equipment healthiness, and perform short, medium, and long term load forecast with high accuracy. All of these and many other applications can be utilized in the up gradation of the existing electrical power system to an advanced network of sensors and meters connected to utilities, consumers, and independent system operators (ISO).
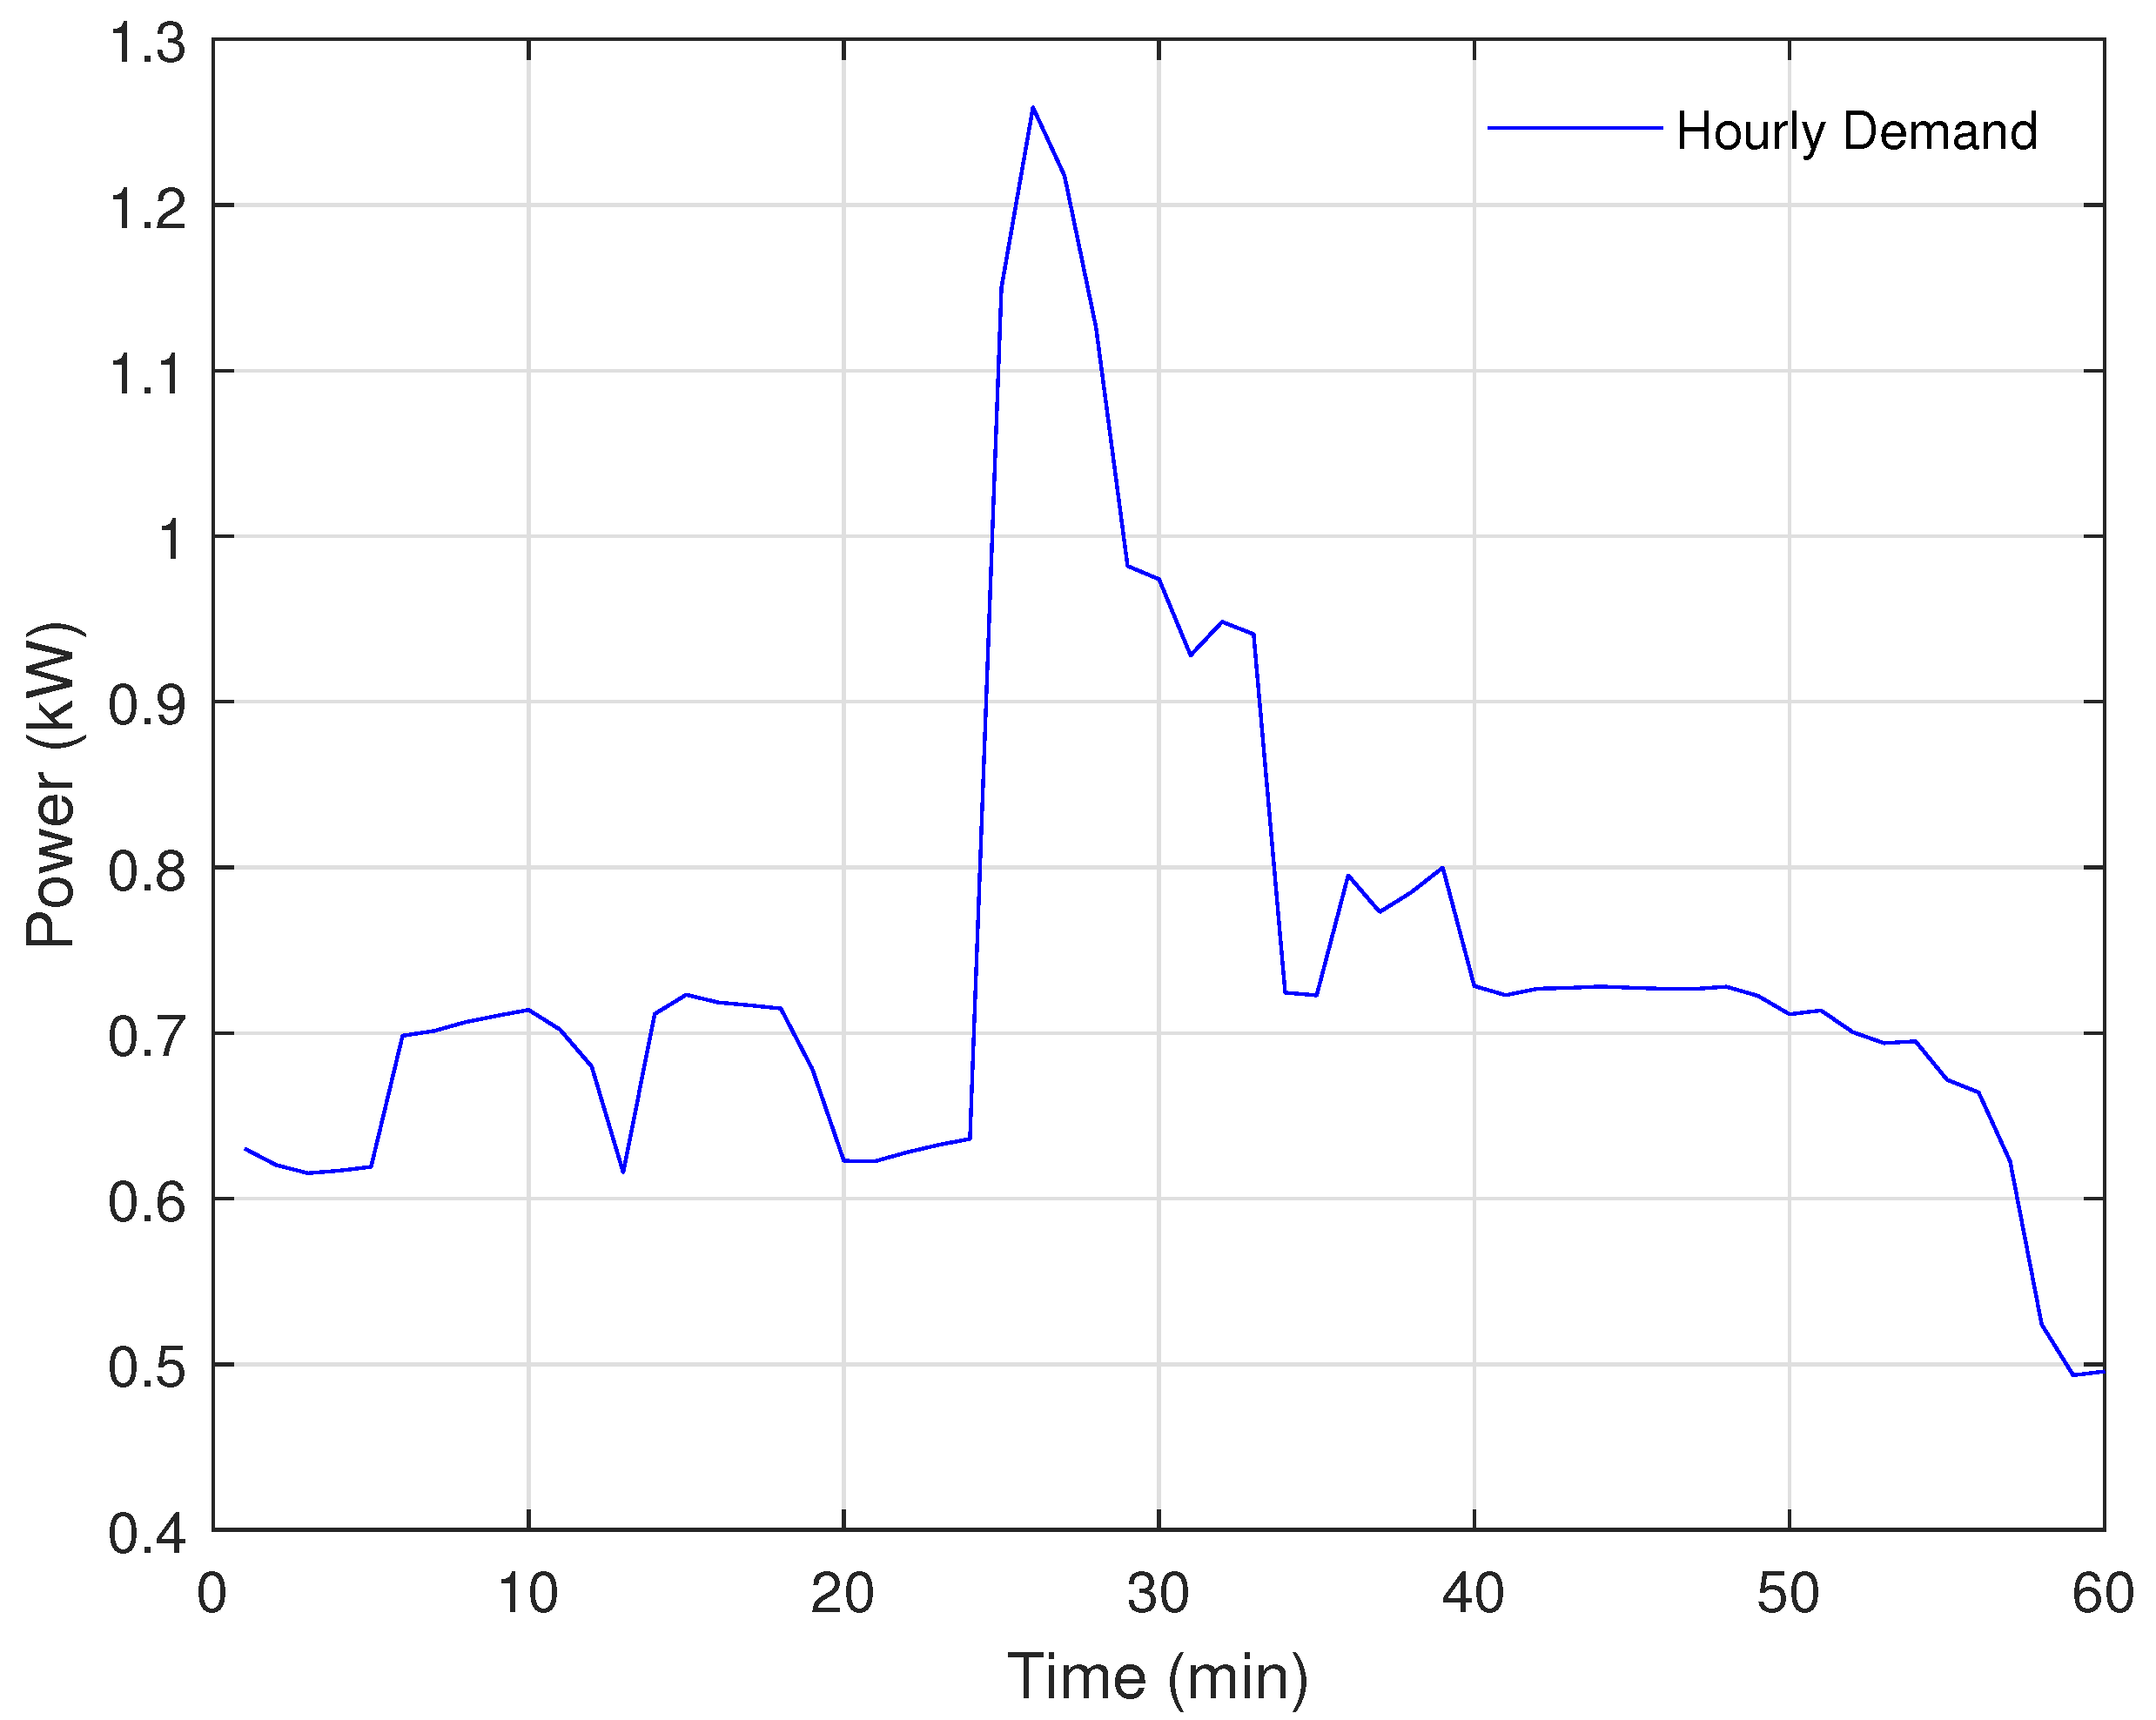
Figure 1 shows the consumption pattern of a consumer during 1 h with a 1-min resolution. The resultant pattern provides greater detail and insight regarding consumer behavior and routine. Each data point is uniquely identified with a timestamp and belongs to time series data. With such data, one can easily obtain a daily consumption pattern and perform analysis to determine load reduction percentage for a brownout strategy.
3. Proposed Methodology
Let us a consider a modern power system in which there are k number of feeders installed, where ith feeder has number of consumers connected, and . The total demand forecast for the next 24 h is represented by d, and the overall generation available for the next 24-h is represented by g. With the inclusion of timestamp, these series become a time-series; therefore, a better representation of demand and generation with respect to time t is and , respectively.
Several time series models are used to define incoming time series data, and these models simplify the understanding of data and also provide an easy analysis of present and future events. The time-series mathematical descriptions include the use of regression model denoted as follows:
where
defines the output sequence as a result of summation of the original signal
and independently and identically distributed random variable white noise
. In a scenario where demand exceeds generation, the shortfall between demand and generation or mismatch is denoted by
, where
; in an ideal case with no shortfall, the mismatch should be less than or equal to zero
. The total demand of the
ith feeder for time period
t is given as follows:
where
(
) is the hourly demand of the consumer (
) for a 24 h period, and
denotes the overall demand of
ith feeder for time period
t. The overall demand
of consumers at time
t and the total generation
at time
t is given in (
3) and (
4), respectively:
where
is the total demand of all connected consumers during the period
t,
is the total generation available, and
is the electricity that the
ith feeder can provide to the connected
consumers for the period
t. The (
5) represents the total electricity shortfall as follows:
where
denotes the difference or mismatch between demand and supply while
represents mismatch of the gap between demand and supply for each consumer (
). The problem, therefore, is to distribute
optimally upon each selected consumer such that the demand and supply mismatch is minimized.
Proposed Strategy
The SLS implementation comprises both external and internal parameters based on user input and topology of the power system respectively. Initially, we iterate over all available feeders, and, for each feeder, we iterate over each consumer to determine the average demand on a given feeder.
System Model: The strategy is to utilize output energy consumption data of installed smart meters. The dataset has 1-minute granularity. The individual consumer is a black box where the input to the black box is an electrical power signal and output is the received consumption data. Further investigations into the model/transfer function of the black box introduce the NILM characteristics; however, the time series energy consumption data received at the output are being used as the source for the implementation of the SLS strategy. A typical AMI system architecture is shown in
Figure 2, where the input parameters, i.e., voltage (
v), current (
i), and frequency (
f) are related to data acquisition. The rated values of the parameters in this region are voltage:
V, current: depends upon the consumer site and behavior, frequency:
Hz. The input output attributes are region related and are related to the data acquisition process.
Objective Function: The above model obtains the analyzed and stored energy consumption data from the database at the output signal of the system diagram and optimizes the objective function shown in (
6):
s.t.:
where
is the mismatch on
ith feeder,
is the mismatch on
consumer after SLS, and
is reduced demand after SLS, which approaches generation. The expression in
6 tries to minimize the error between the shortfall and reduced load demand of consumer using linear optimization such that the demand and supply mismatch is reduced; the solution must also remain within constraints represented by (
7) and (
8).
Tool: The optimized reduction in demand is implemented in Python, creating the model, objective function, and constraints with the time-series data analytic to produce meaningful results. The general flow of paper is shown in
Figure 3.
The strategy proceeds with computing the average demand of each feeder as shown in (
9):
where
represents the average demand on
ith feeder. Before further processing, we determine whether the mismatch is positive (excess demand
) or negative (excess generation
). Using the difference technique, the consumer demand is related to one of the specified region in the consumption spectrum:
where
r denotes the class of consumer, while
h defines the interval between two classes. The interval
h is computed on the basis of an external parameter, i.e.,
c. We set
, which indicates that we have two classes above average and two classes below average, i.e., four classes. If the demand exceeds generation, the excessive mismatch is distributed among consumers belonging to the above average class and update the mismatch if required:
where
S holds the summation of
where the demand is above average
, while
represents the quantum of load shutdown allowed on the subject class. If the suggested quantum of load shedding is above the prescribed limit, then the maximum prescribed quantum is selected for shutdown while remaining power is taken from the next lower class:
where
e denotes the error or leftover mismatch after the first iteration. The remaining mismatch is once again adjusted to a class that has a quantum of shedding less than its prescribed limit which is
for classes above average and
for classes below average; meanwhile, we update the counter to record the number of iterations taken to minimize the mismatch. Furthermore, the method has a few limitations such as the lifeline consumers marked by the utility must remain unchanged, and the number of categories in feeders must be four as it imitates the real-world utility architecture. The algorithm finishes on either of the two conditions which are as follows:
- (1)
as defined in (
13), or
- (2)
counter which identifies that there is not enough generation.
The methodology is given as following Algorithm 1:
| Algorithm 1: Soft Load Shedding using Time Series Data. |
- 1:
for data point in () do - 2:
Calculate mismatch - 3:
end for - 4:
for All do - 5:
Determine periods T where () - 6:
end for - 7:
for All T do - 8:
Determine and of ith feeder - 9:
Identify consumer category, based on , , and - 10:
Label lifeline consumers as - 11:
Set constraints on , , and - 12:
Evaluate reduced demand as and load shedding quanta as - 13:
for All at ith feeder do - 14:
for Consumer do - 15:
Iteratively, disburse upon a subset of consumers to find optimal solution - 16:
Compute the term e - 17:
if then - 18:
- 19:
operation complete & break - 20:
else - 21:
- 22:
Not enough generation within constraints - 23:
end if - 24:
end for - 25:
end for - 26:
end for
|
4. Simulation Results and Discussion
To evaluate the performance of SLS, two-month data of June and July with 87,840 data points per site is selected, since, during summers, usually, the demand grows beyond the available generation. The SLS segregates time intervals where demand exceeds generation. For each period, the algorithm evaluates the mismatch and distributes the mismatch to selected consumers in the form of load shedding quanta.
The methodology produces a percentage load shedding quanta for a certain number of selected consumers based on learned consumption patterns. Since the smart energy meters are installed on feeders as well as consumers, the daily supply and load profiles are available. The demand and supply profile provides detailed insight into consumer behavior and assist in a load forecasting mechanism. For any given day, if the utility forecasts a load profile and evaluates its available generation capacity, both supply and demand forecast can be visualized on a 24-h or daily load curve. The visualization of demand and supply profile on day-ahead planning can be useful in the identification of periods where demand exceeds generation. During these periods, the utility has to force shed the demand on feeders such that the demand is brought under generation. The real-world supply and demand profile forecast for a 24-h duration is shown in
Figure 4.
For the validation of the technique, different real-world datasets are used. Each of the four available data sets has different connected consumers. Based on the grouping, each feeder observes different supply and demand profiles throughout the day. Therefore, each feeder experiences a different mismatch profile. The algorithm output of two out of four data-sets are tabulated in
Table 1, where ‘Meter ID’ identifies each consumer, ‘Meter Demand (kW)’ shows the peak demand of associated consumers, the ’Allocated Load Shedding Quanta (%)’ is the percentage quanta of load shedding assigned by the algorithm to each consumer, and ‘Reduced Meter Demand (kW)’ is the net reduced demand after shedding of allocated quanta for each consumer. From the tabulated data, some consumers who have been marked as lifeline consumers remain unaffected while the mismatch between the demand and supply has been reduced such that the term
. The allocation of load shedding quanta will allow the consumers to adjust their consumption within the window of consumption by switching some flexible or semi-flexible loads during the period of excessive demand to a period of reduced demand.
From the results of different data sets, there is a significant reduction in peak demand (kW) for the selected consumers during the peak hours as shown in
Figure 5. To assess the outcome of the optimization, the results of SLS are compared with the base case of FLS, where demand exceeds generation, and the peak demand of all connected consumers is reduced to zero. The comparison for Dataset-1, the connected peak demand for the period of 02:03–02:33 is 16.416 kW, for the base case, the peak demand is reduced to almost 0, whereas, for the SLS, the peak demand is reduced to 14.386 kW, i.e., 12.36% reduction. Similarly, the comparison for the Dataset-2, during the period 13:59–14:59, the peak demand of 14.6391 kW is reduced by almost 100% for FLS and 13.66% for SLS. The comparison with the base case highlights a significant improvement in the amount of unserved energy or value of lost load as the demand and supply mismatch is reduced. From
Figure 5, it is observed that a few consumers have not been affected, and these consumers are labeled as lifeline consumers by the utility, whereas a few selected consumers have experienced a reduction in the peak demand. These selected consumers have been assigned a window of energy and may use the available energy efficiently with the adjustment of flexible or semi-flexible loads.
For the first data set, the feeder’s day-ahead analysis identifies eight peak hour periods of different lengths where the available generation is less than the connected demand. The analysis is carried out based on the consumption pattern, the available generation, and the demand forecast produces the percentage quanta of load shedding. The net reduced demand is computed after deduction of percentage quanta of load shedding from the selected meters. The net reduced demand is under the available generation capacity for each peak hour period with the minimum mismatch. A comparison between the available generation and the net reduced demand after SLS for the first data-set feeder is shown in
Figure 6.
Similarly, for the second, third, and fourth data-set feeders, the day-ahead analysis results in four, five, and five peak hour periods of different lengths where the available generation is less than the connected demand. The algorithm proposes the percentage quanta of load shedding for each feeder during the peak hour period. The net reduced demand is below generation for each period with a minimum mismatch as per the desired objective. A comparison between the available generation and the net reduced demand after SLS for the second feeder is shown in
Figure 7; for the third feeder, it is shown in
Figure 8, and, for the fourth feeder, it is shown in
Figure 9. Each figure shows the generation and demand profile for the time instances where there was generation shortfall; the overall demand has been reduced such that the mismatch is minimum and also the demand remains under generation at all time.
The main objective of the proposed strategy is to reduce the demand and supply mismatch with minimum impact of lifeline consumers and the value of lost load (VOLL). The improvement in VOLL can be indirectly related to consumer comfort, i.e., minimum impact on consumer comfort. The simulation results and discussion on the SLS strategy on four different data sets have shown a significant reduction in demand and energy requirement for each data set. Furthermore, the disbursement of load shedding quanta for various diversified data sets has been achieved optimally within the associated constraints using Data Analytics for the Demand Side Management at consumption sites.
5. Conclusions
Demand side management plays an important role in the deployment of stable and a reliable utility grid, as well as benefiting the power system operation and power market effectiveness. DSM is employed to maintain the grid’s overall load and supply. However, a mismatch typically exists between energy demand and supply which can have negative implications as its results in system failure or non-utilization of the generated power. Developing nations usually encounter a greater mismatch in the power demand and supply and in cases where electric power demand exceeds the power supply, a typical and common approach, called full load shedding (FLS) is practised. However, there are a number of challenges and problems associated with FLS which include inefficient utilization of power generation, utility grid’s credibility, and lack of consumer comfort. To solve the issues related to mismatch in supply and demand, and FLS, a novel strategy based on Soft Load Shedding (SLS) or brownout, is proposed in this study, which uses highly granular real-world time series energy consumption data and implements a software-based solution to minimize the mismatch between demand and supply. This partial reduction of load ensures that the residential demand is alleviated while minimizing the excessive non-utilized generation. The proposed strategy allows the utility grid to this partial load reduction such that the demand remains under generation while keeping the mismatch to minimum. The proposed study based on the SLS strategy has shown a significant reduction in the mismatch between demand and energy requirement for multiple datasets.The consumption pattern of each dataset provides insight into consumer behavior, and such an insight is helpful in many research problems. The SLS observes the behavior and takes out a partial load such that the demand and supply mismatch remains within 10–15% unlike the 100% load reduction in FLS. During the process, lifeline consumers are identified as per the utility’s policy and such consumers remain unaffected from any load reduction due to their low energy consumption. In a scenario where the available generation is scarce such that the partial load demand can not be fulfilled, the SLS recommends the implementation of FLS, since such a system could lead to system collapse. The threshold of the allowed load reduction for each category is defined by the utility; therefore, SLS may incorporate different categories among different utilities and provide different load shedding quanta or partial load reduction parameters within the defined constraints. Furthermore, SLS has been observed with efficient disbursement of load shedding quanta for various diversified data sets. The proposed strategy reduces the demand and supply mismatch, minimizes the non-utilized excessive generation in case of FLS, and results in a minimum effect on consumer comfort. In addition, it is critical for developing economies facing an energy crisis as it directly impacts the country’s economic growth. The SLS is one of the many problems of the electrical power system which can be solved based on the huge incoming energy consumption data. This DSM method can further be extended into the paradigm of NILM where it can access the energy consumption, operation duration and time, and type of machine available at a consumer site. The NILM based DSM can actively assign the energy quanta based on flexible and non-flexible appliances and also suggest the operation of each type of load with the time-of-day and duration for efficient utilization of assigned energy quantum with a higher accuracy.


