
Waveform and Spectral Characteristics of Supraharmonic Unsymmetrical Conducted EMI of Switched-Mode Power Supplies


Abstract
:1. Introduction
2. Selected SMPSs and Measurement Setup
2.1. SMPS Operation and Characteristics
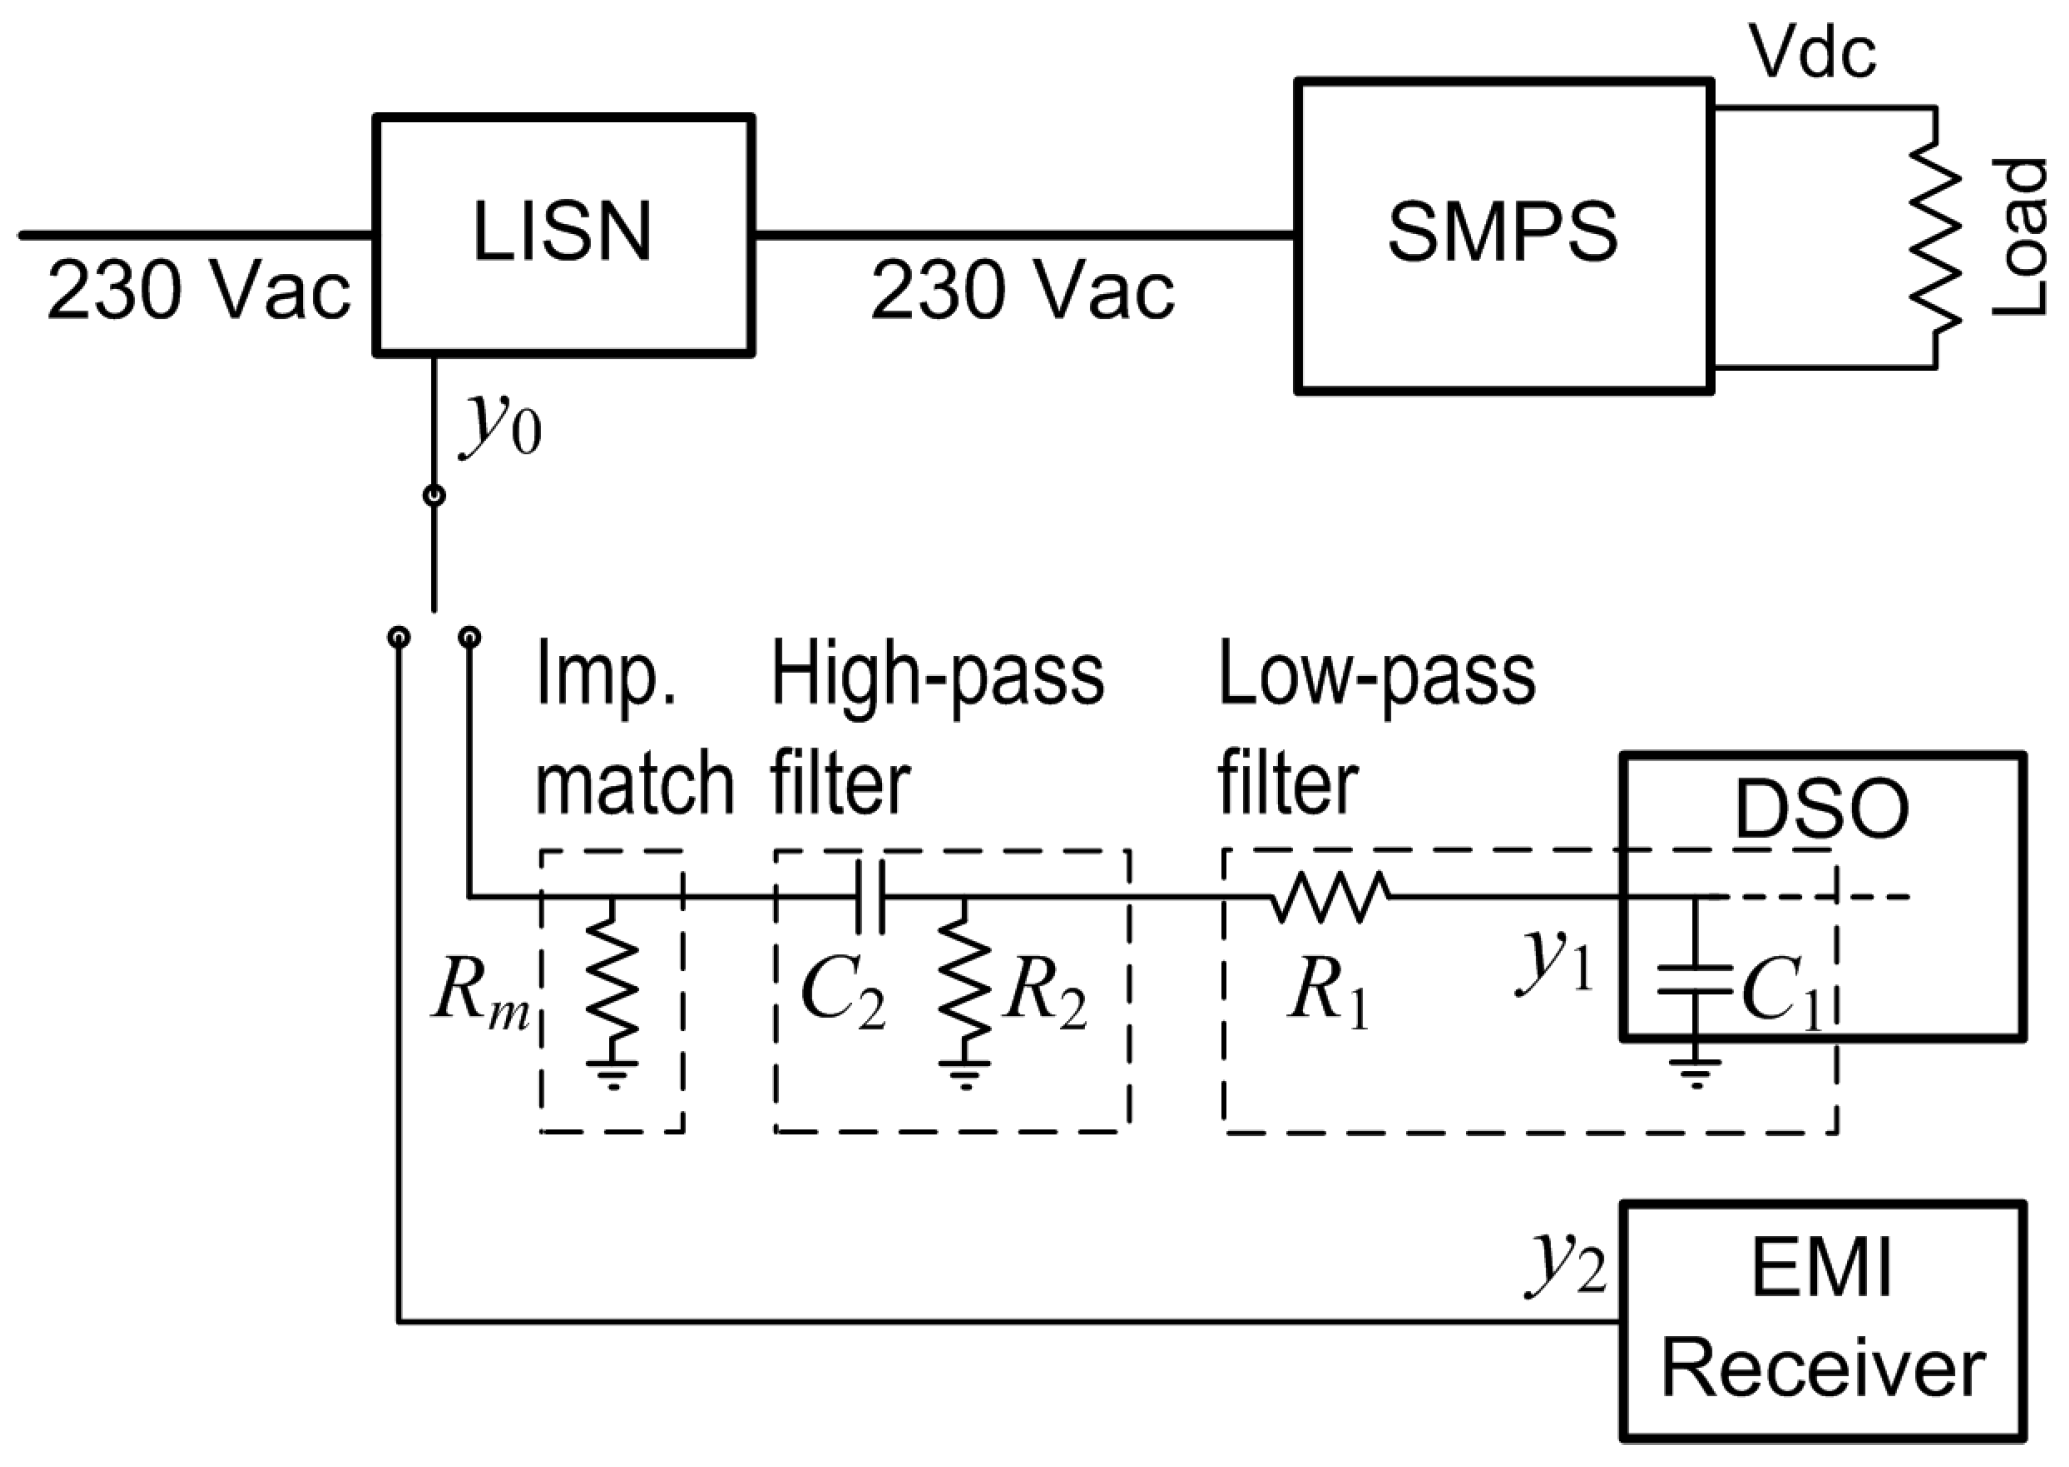
2.2. Setup for Time- and Frequency-Domain Measurements
- Either to an 8-bit DSO with a sampling rate of 10 MSa/s (ensuring that the target frequency interval of 2–150 kHz could be achieved in terms of the sampling time and record length);
- Or to an EMI receiver with a peak detector, followed by max hold and dwell time ranging between 1 and 200 ms.
- A 50 Ω impedance-matching barrel Rm to implement the mentioned 50 Ω loading of the capacitive branch of the LISN;
- An anti-aliasing low-pass filter R1C1, which was designed starting from a maximum frequency of 1 MHz (positioning its cutoff frequency one octave above at 2 MHz, which was very compatible with the said sampling frequency of 10 MHz) and exploiting the input capacitance of the DSO channel (found to be quite accurate and stable at 15 pF), thus resulting in a resistive value R1 = 1.5 kΩ (negligible in terms of the voltage drop in series to the 1 MΩ input resistance of the DSO);
- A high-pass filter C2R2 that further attenuated the 50 Hz mains fundamental and its harmonics and designed around a resistive value large enough not to disturb the impedance matching and to remarkably influence the low-pass filter (set to 5 kΩ) and a resulting series capacitance C2 with a negligible reactance over the desired frequency interval. The use of a high-pass filter is supported by the suggested increase of the decoupling factor in [26] and confirmed by [27] for similar measurements.
3. Discussion of the Form of Data and Their Variability
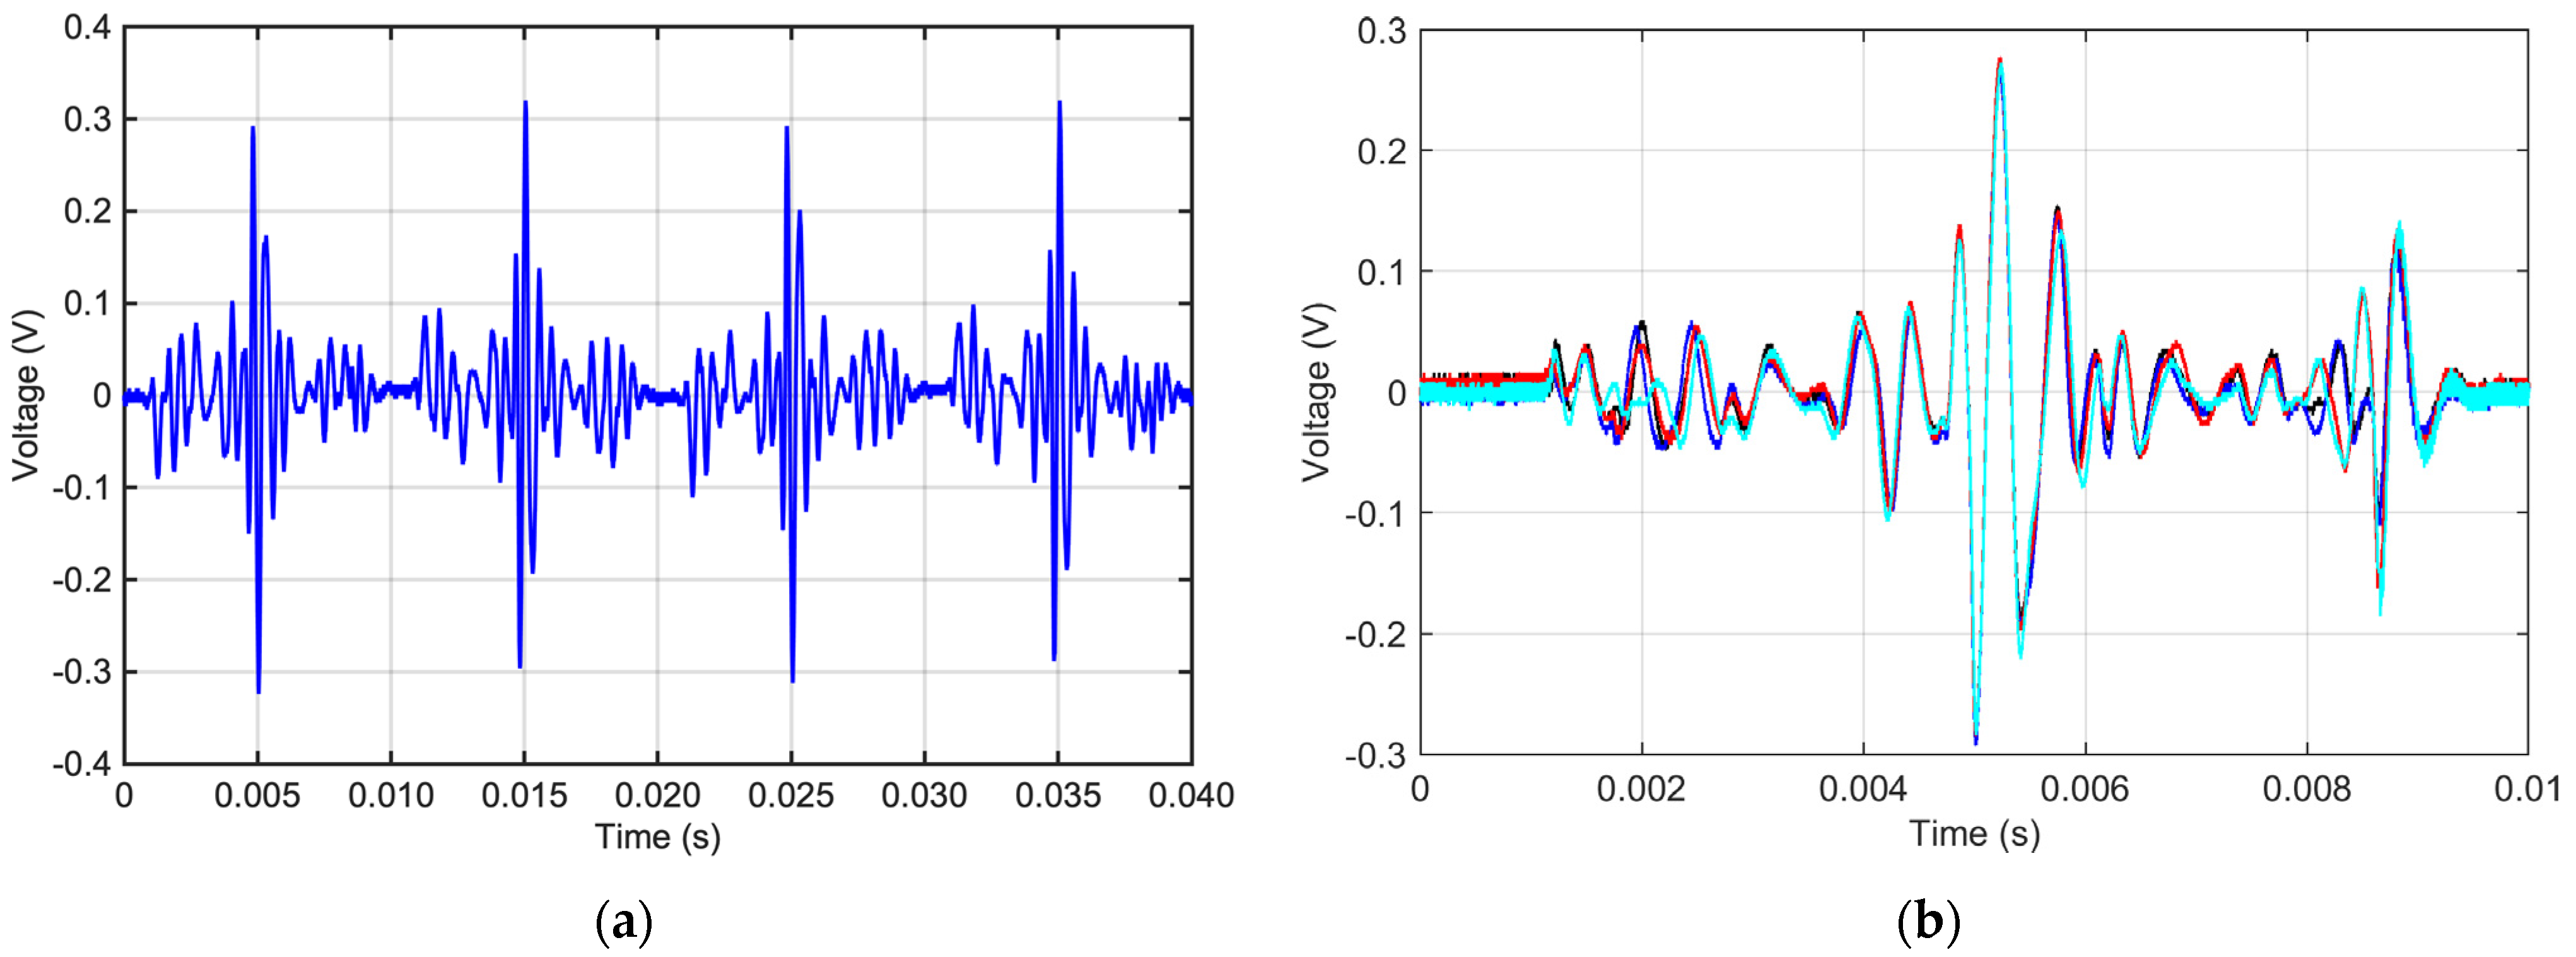
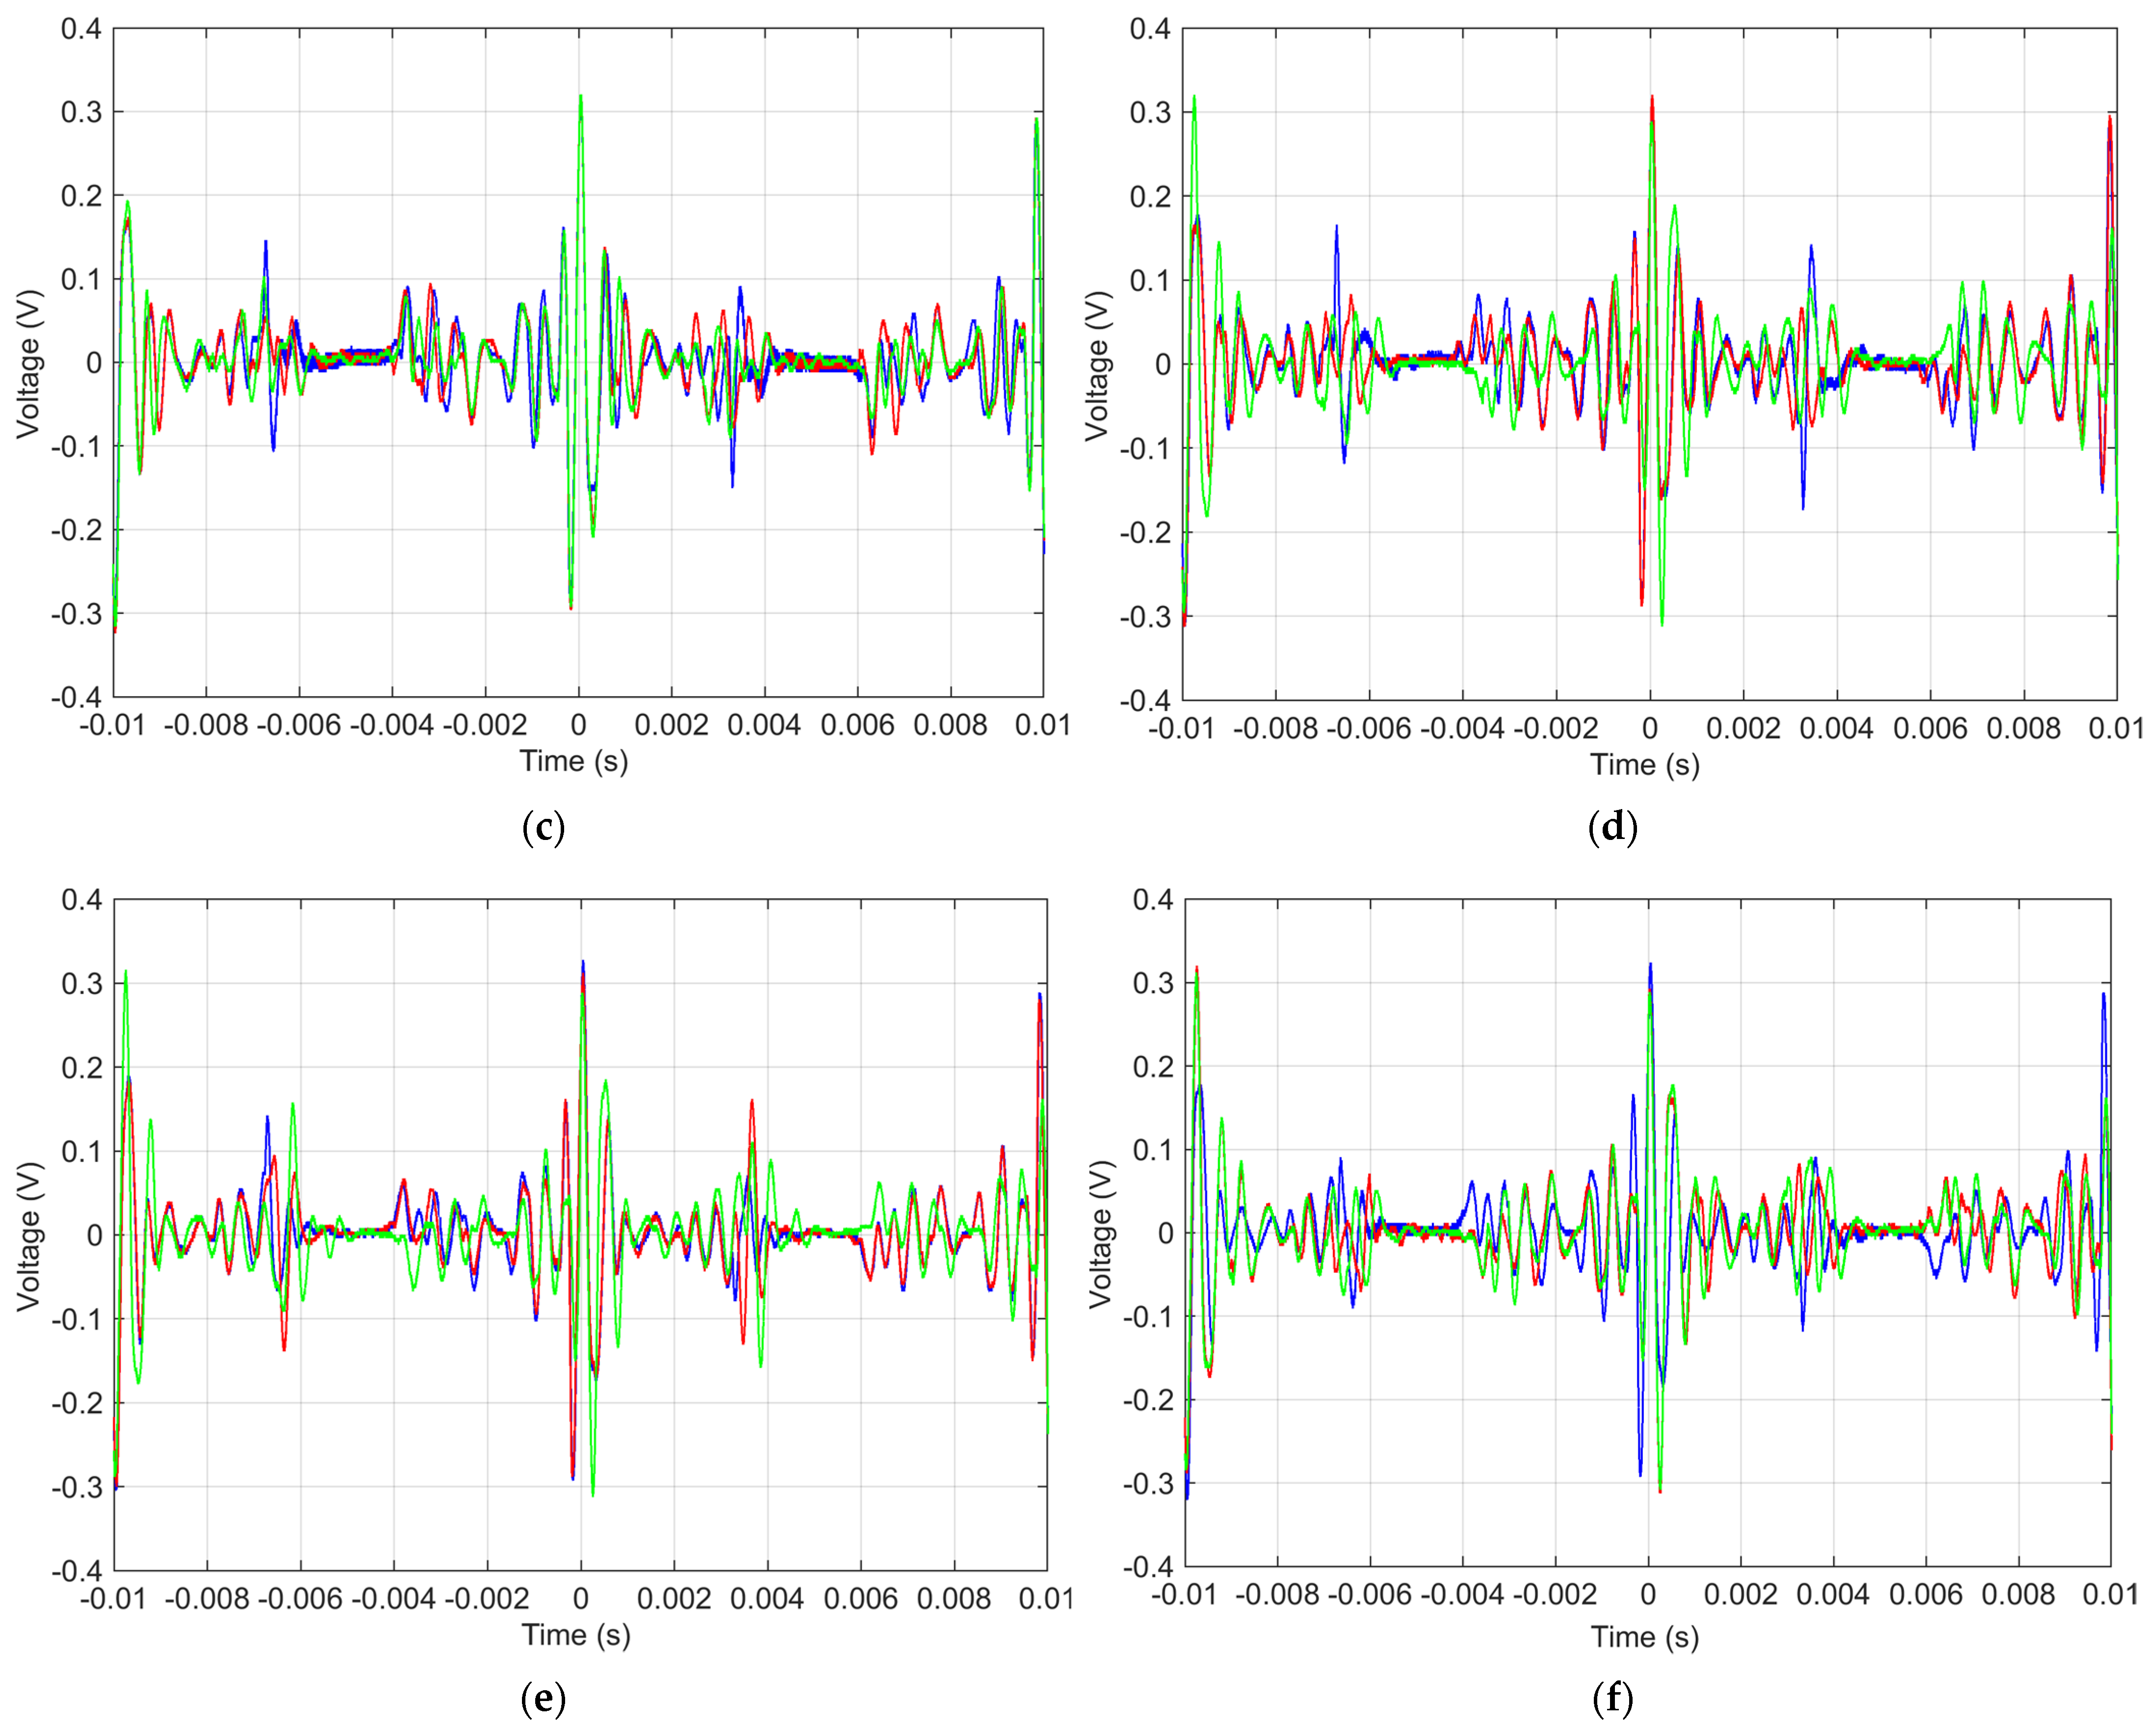
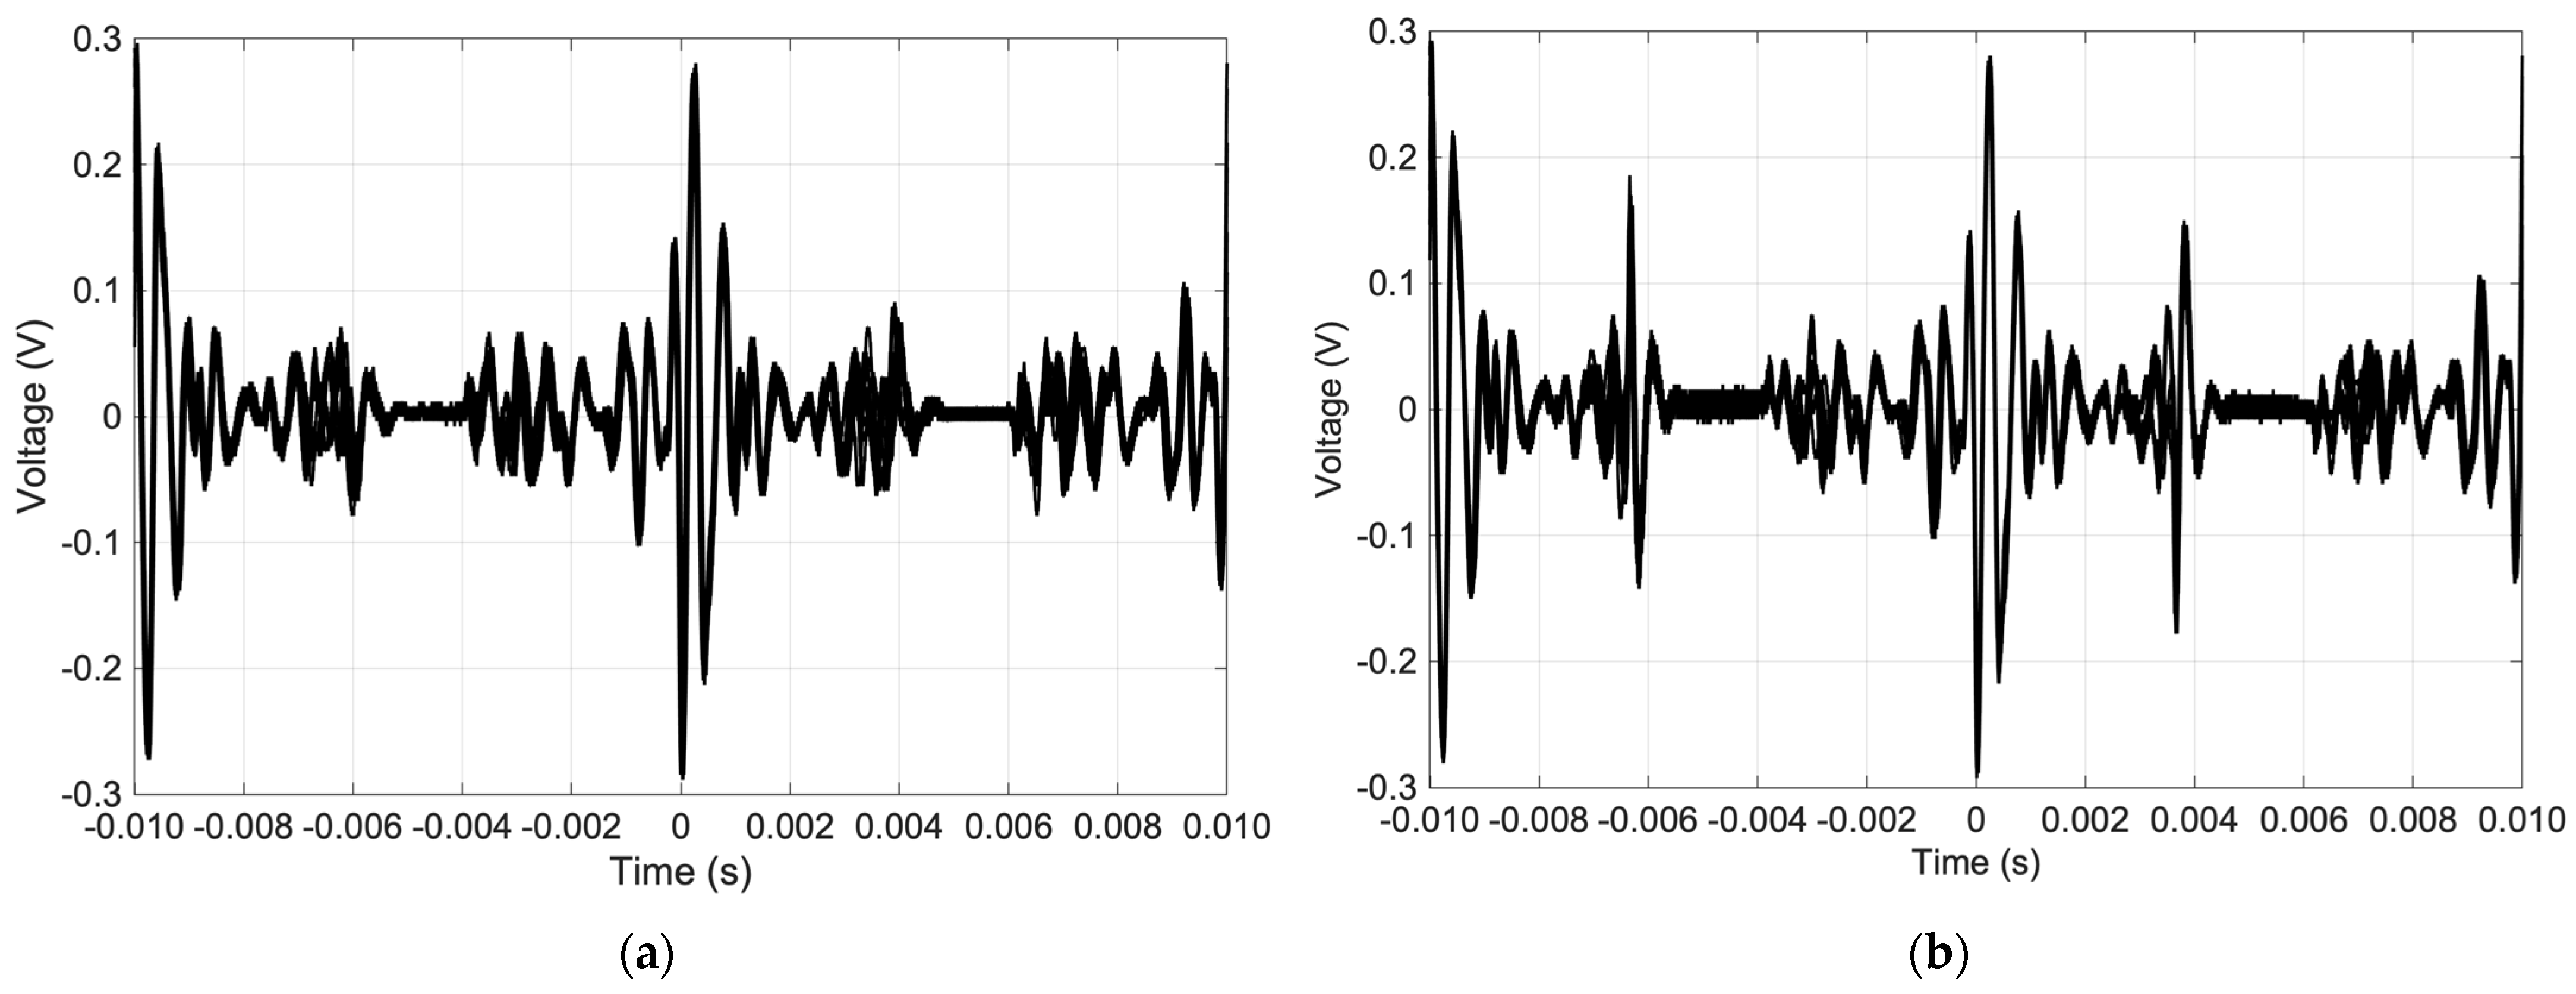
3.1. Apparent Characteristics of Time-Domain Waveforms
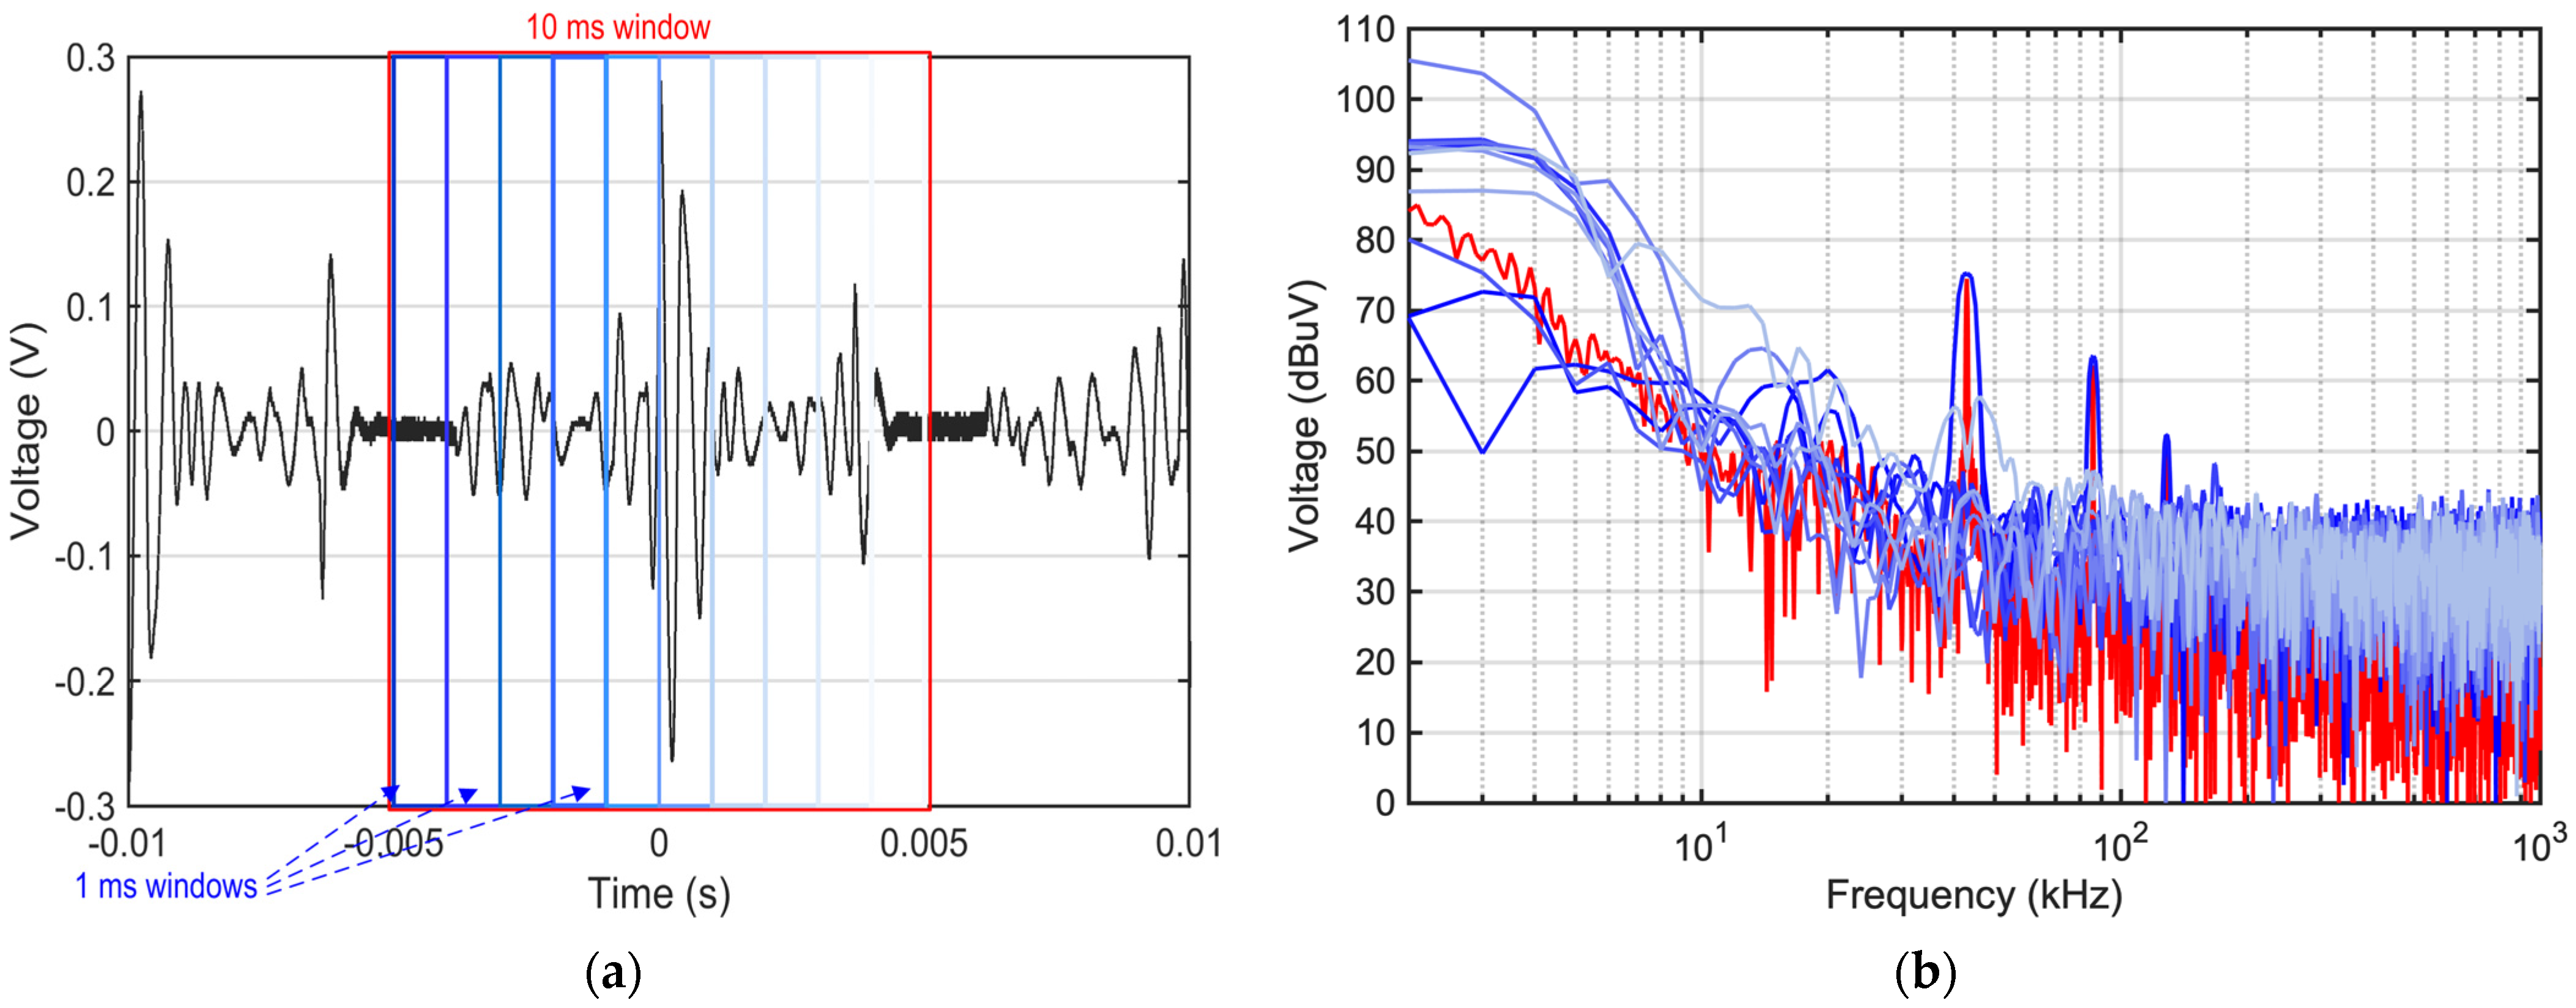
3.2. Basic Post-Processing Methods for the Analysis of Spectral Characteristics
4. Unprocessed Reference Data
- Time-domain waveforms, where signal details in various operating conditions are shown to provide a first visual assessment of signal characteristics, also to better understand the behavior of the processed data; data were sampled at 10 MHz and low-pass filtered for anti-aliasing exigency at 2 MHz, ensuring they are fully valid up to 1 MHz.
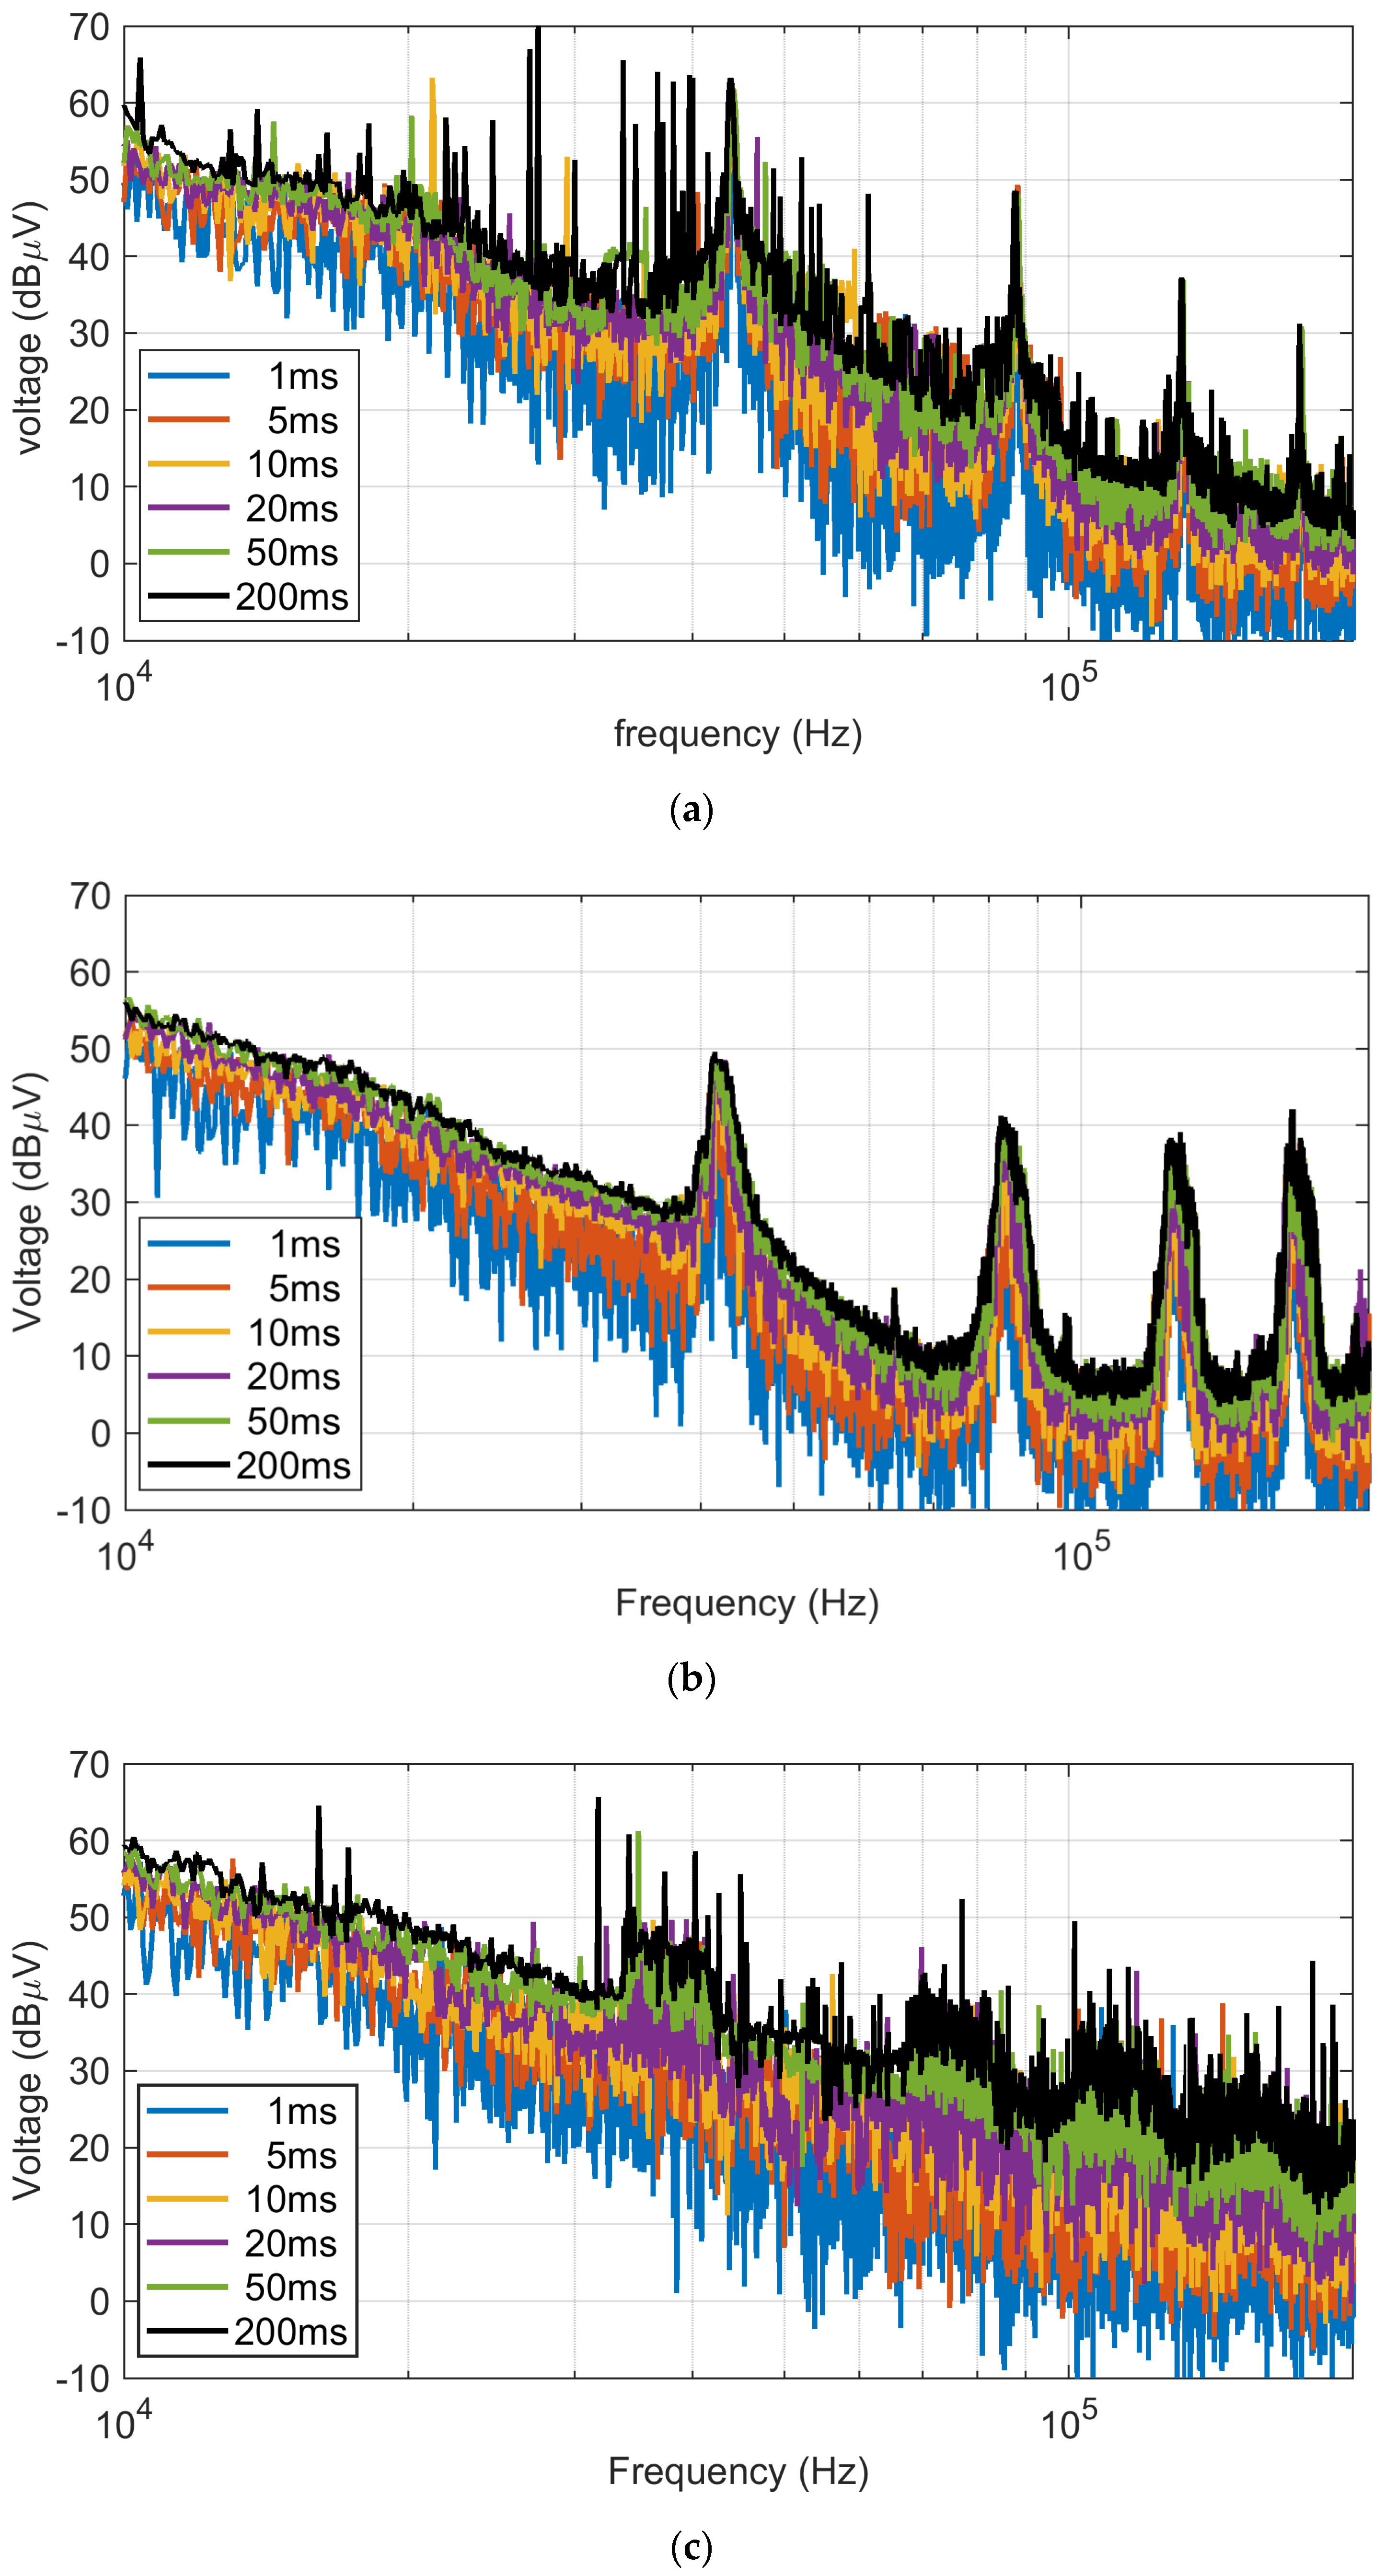
- EMI receiver scans similarly extending up to 1 MHz and using an RBW value of 200 Hz, which is compatible with requirements of EMC standards for the 9–150 kHz interval; the adopted dwell time was 1 ms.
4.1. Time-Domain Waveforms
4.2. Frequency-Domain Spectra
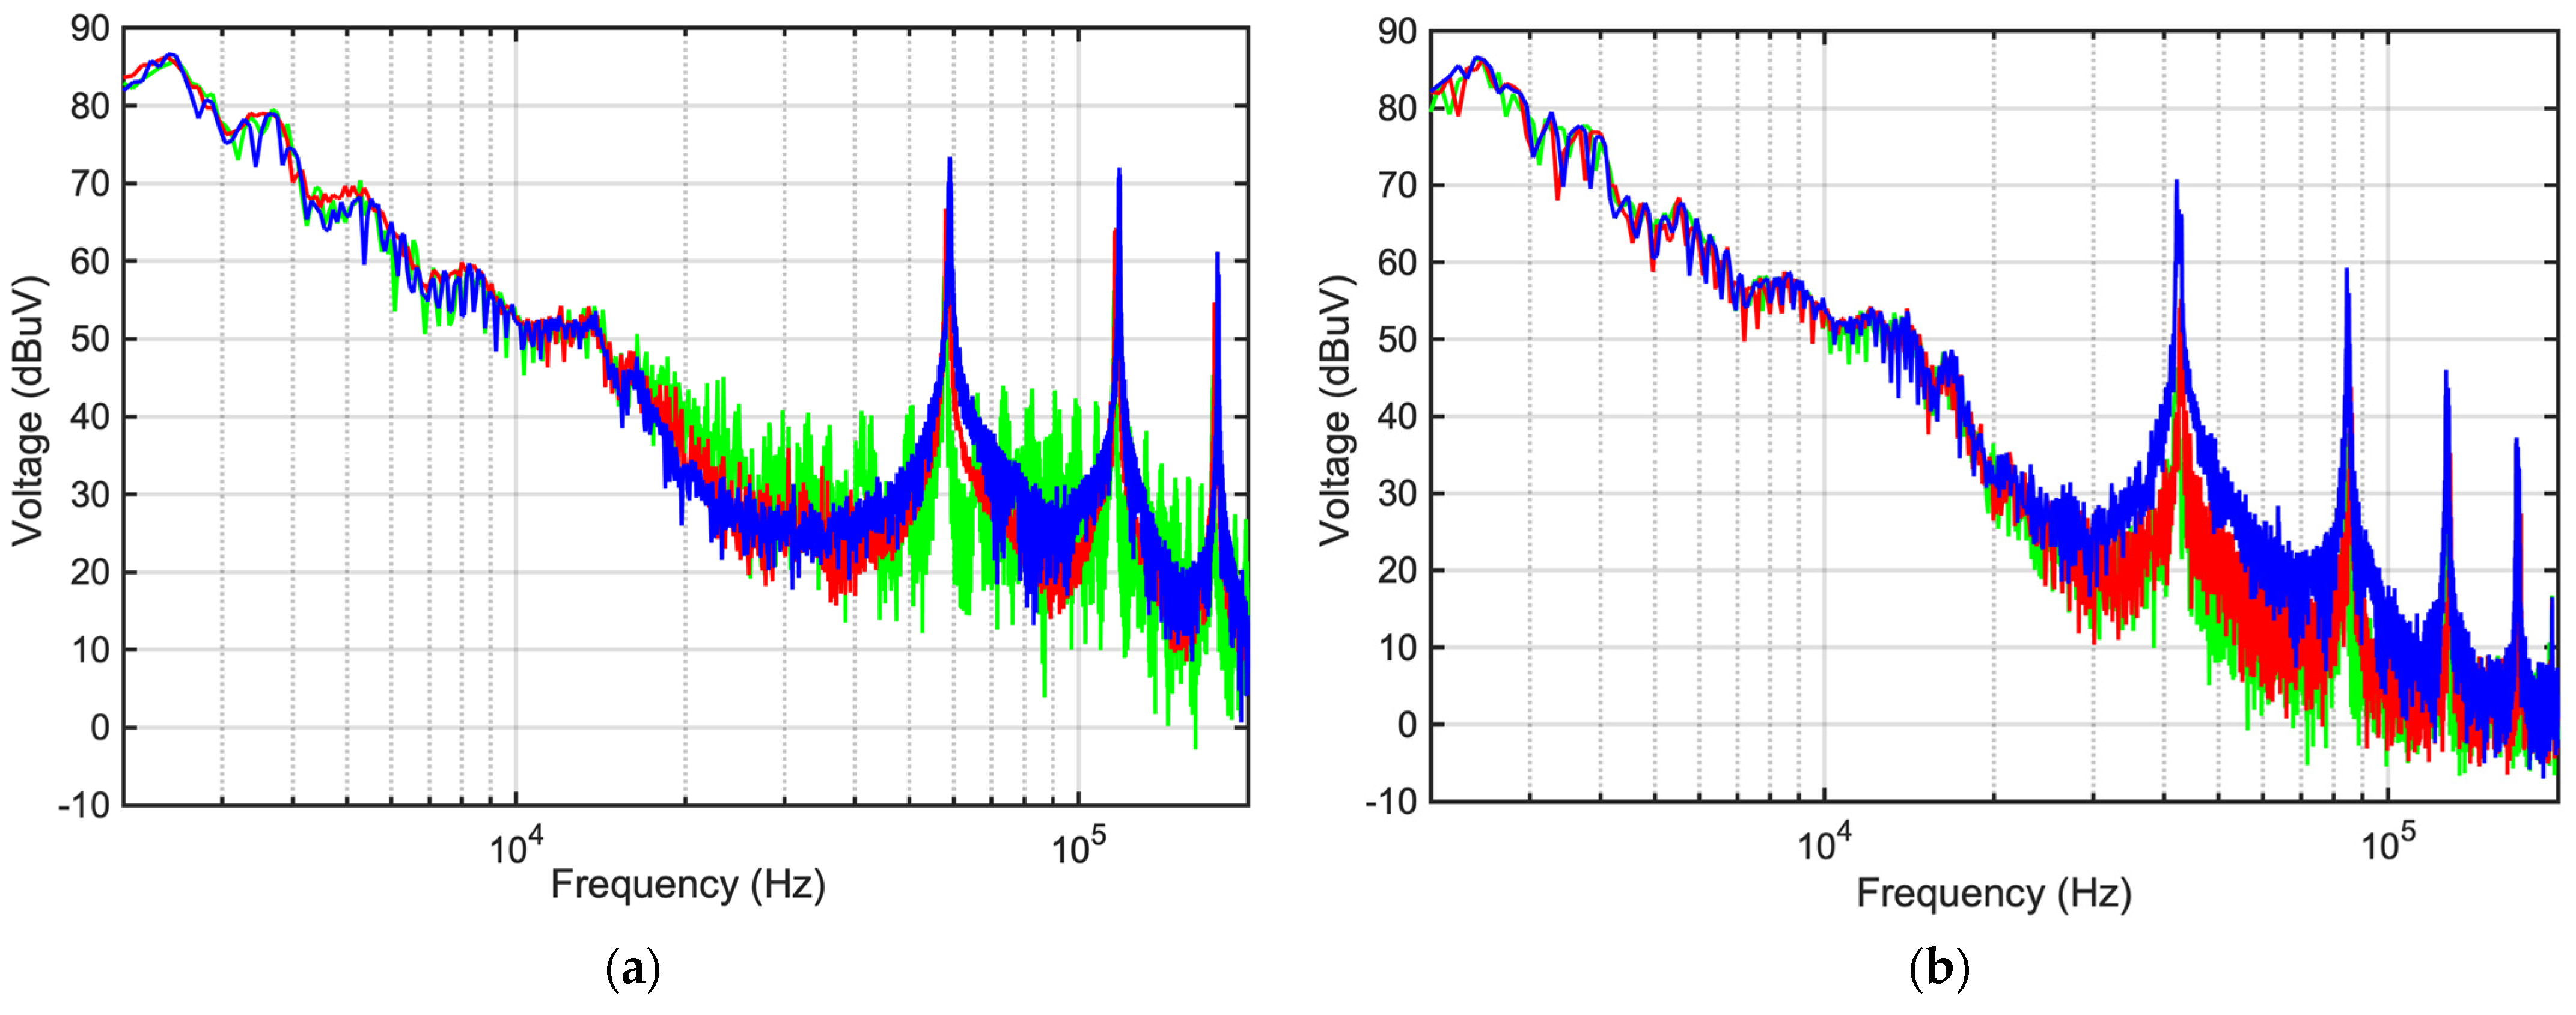
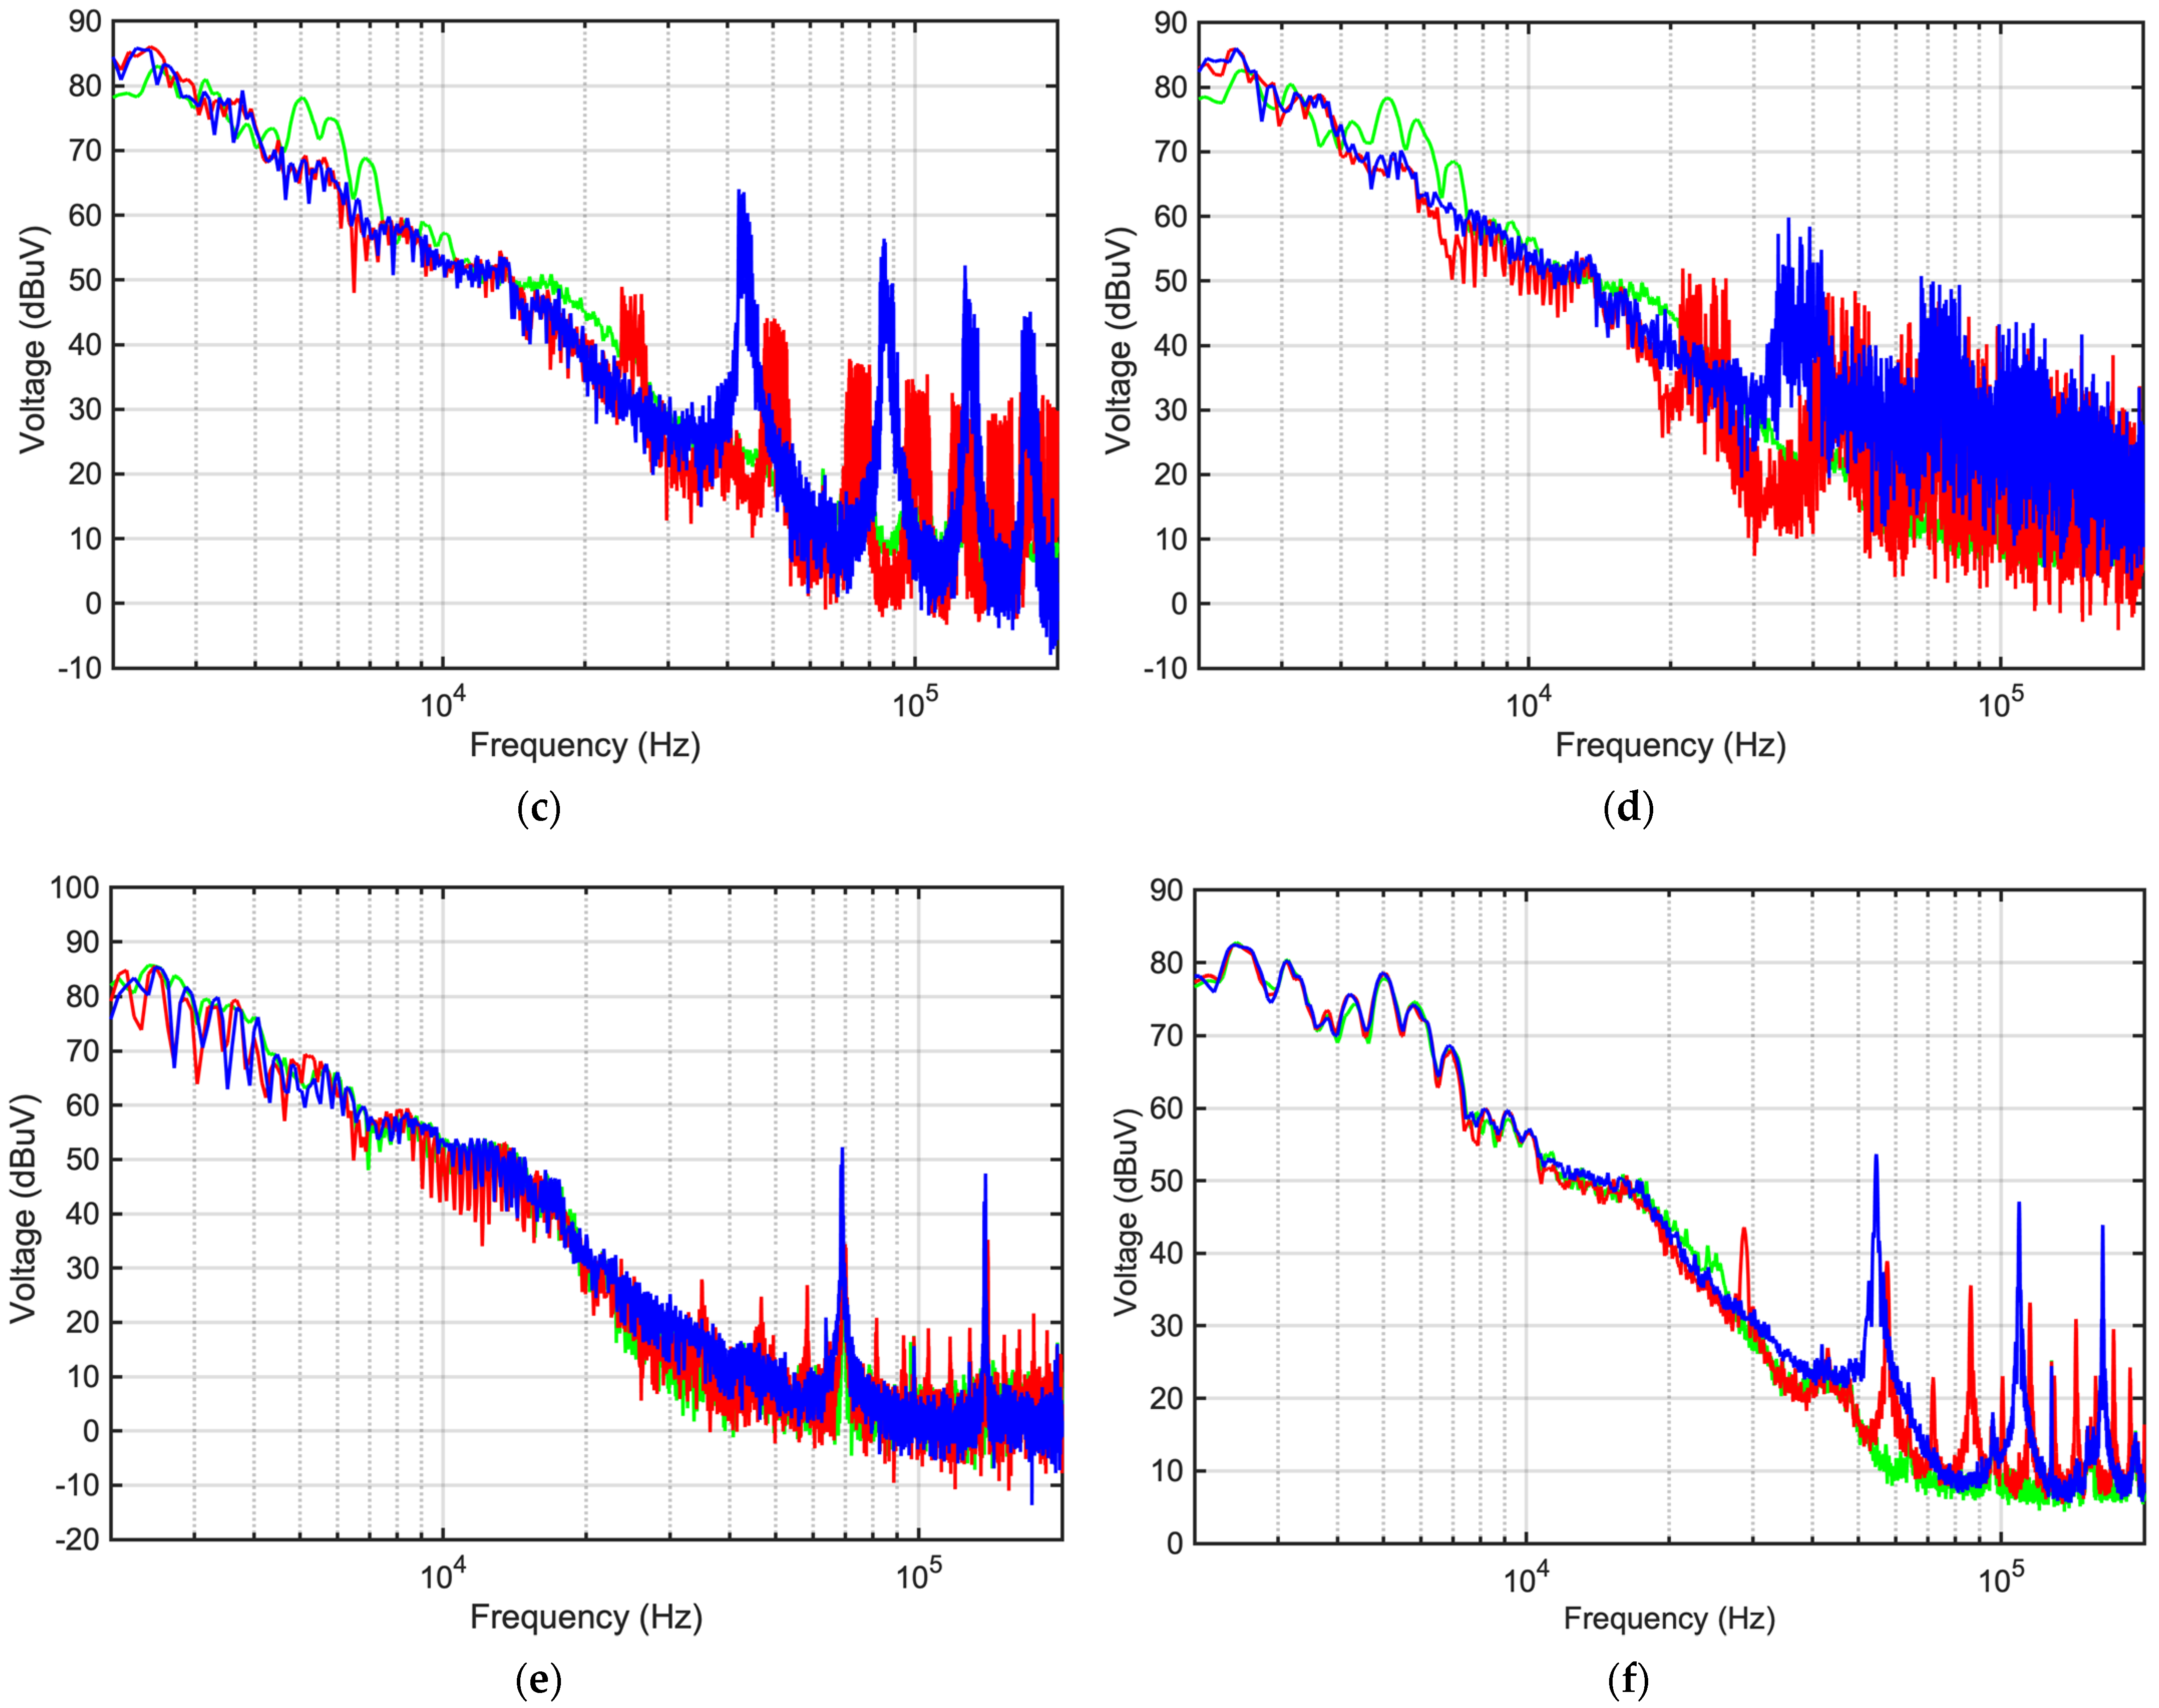
- No-load emissions (green curve) could sometimes and for some frequency intervals be larger than curves for the other test conditions such that no load is an important operating condition to include in a test program; see, in particular, Figure 10a, where there was a consistent increase of about 10 dB above 20 kHz, with the appearance of many secondary components.
- The 25% condition, however, presented some secondary emissions that were not visible in the high-load condition, as evident in Figure 10e,f.
5. Conclusions
Supplementary Materials
Author Contributions
Funding
Conflicts of Interest
Appendix A
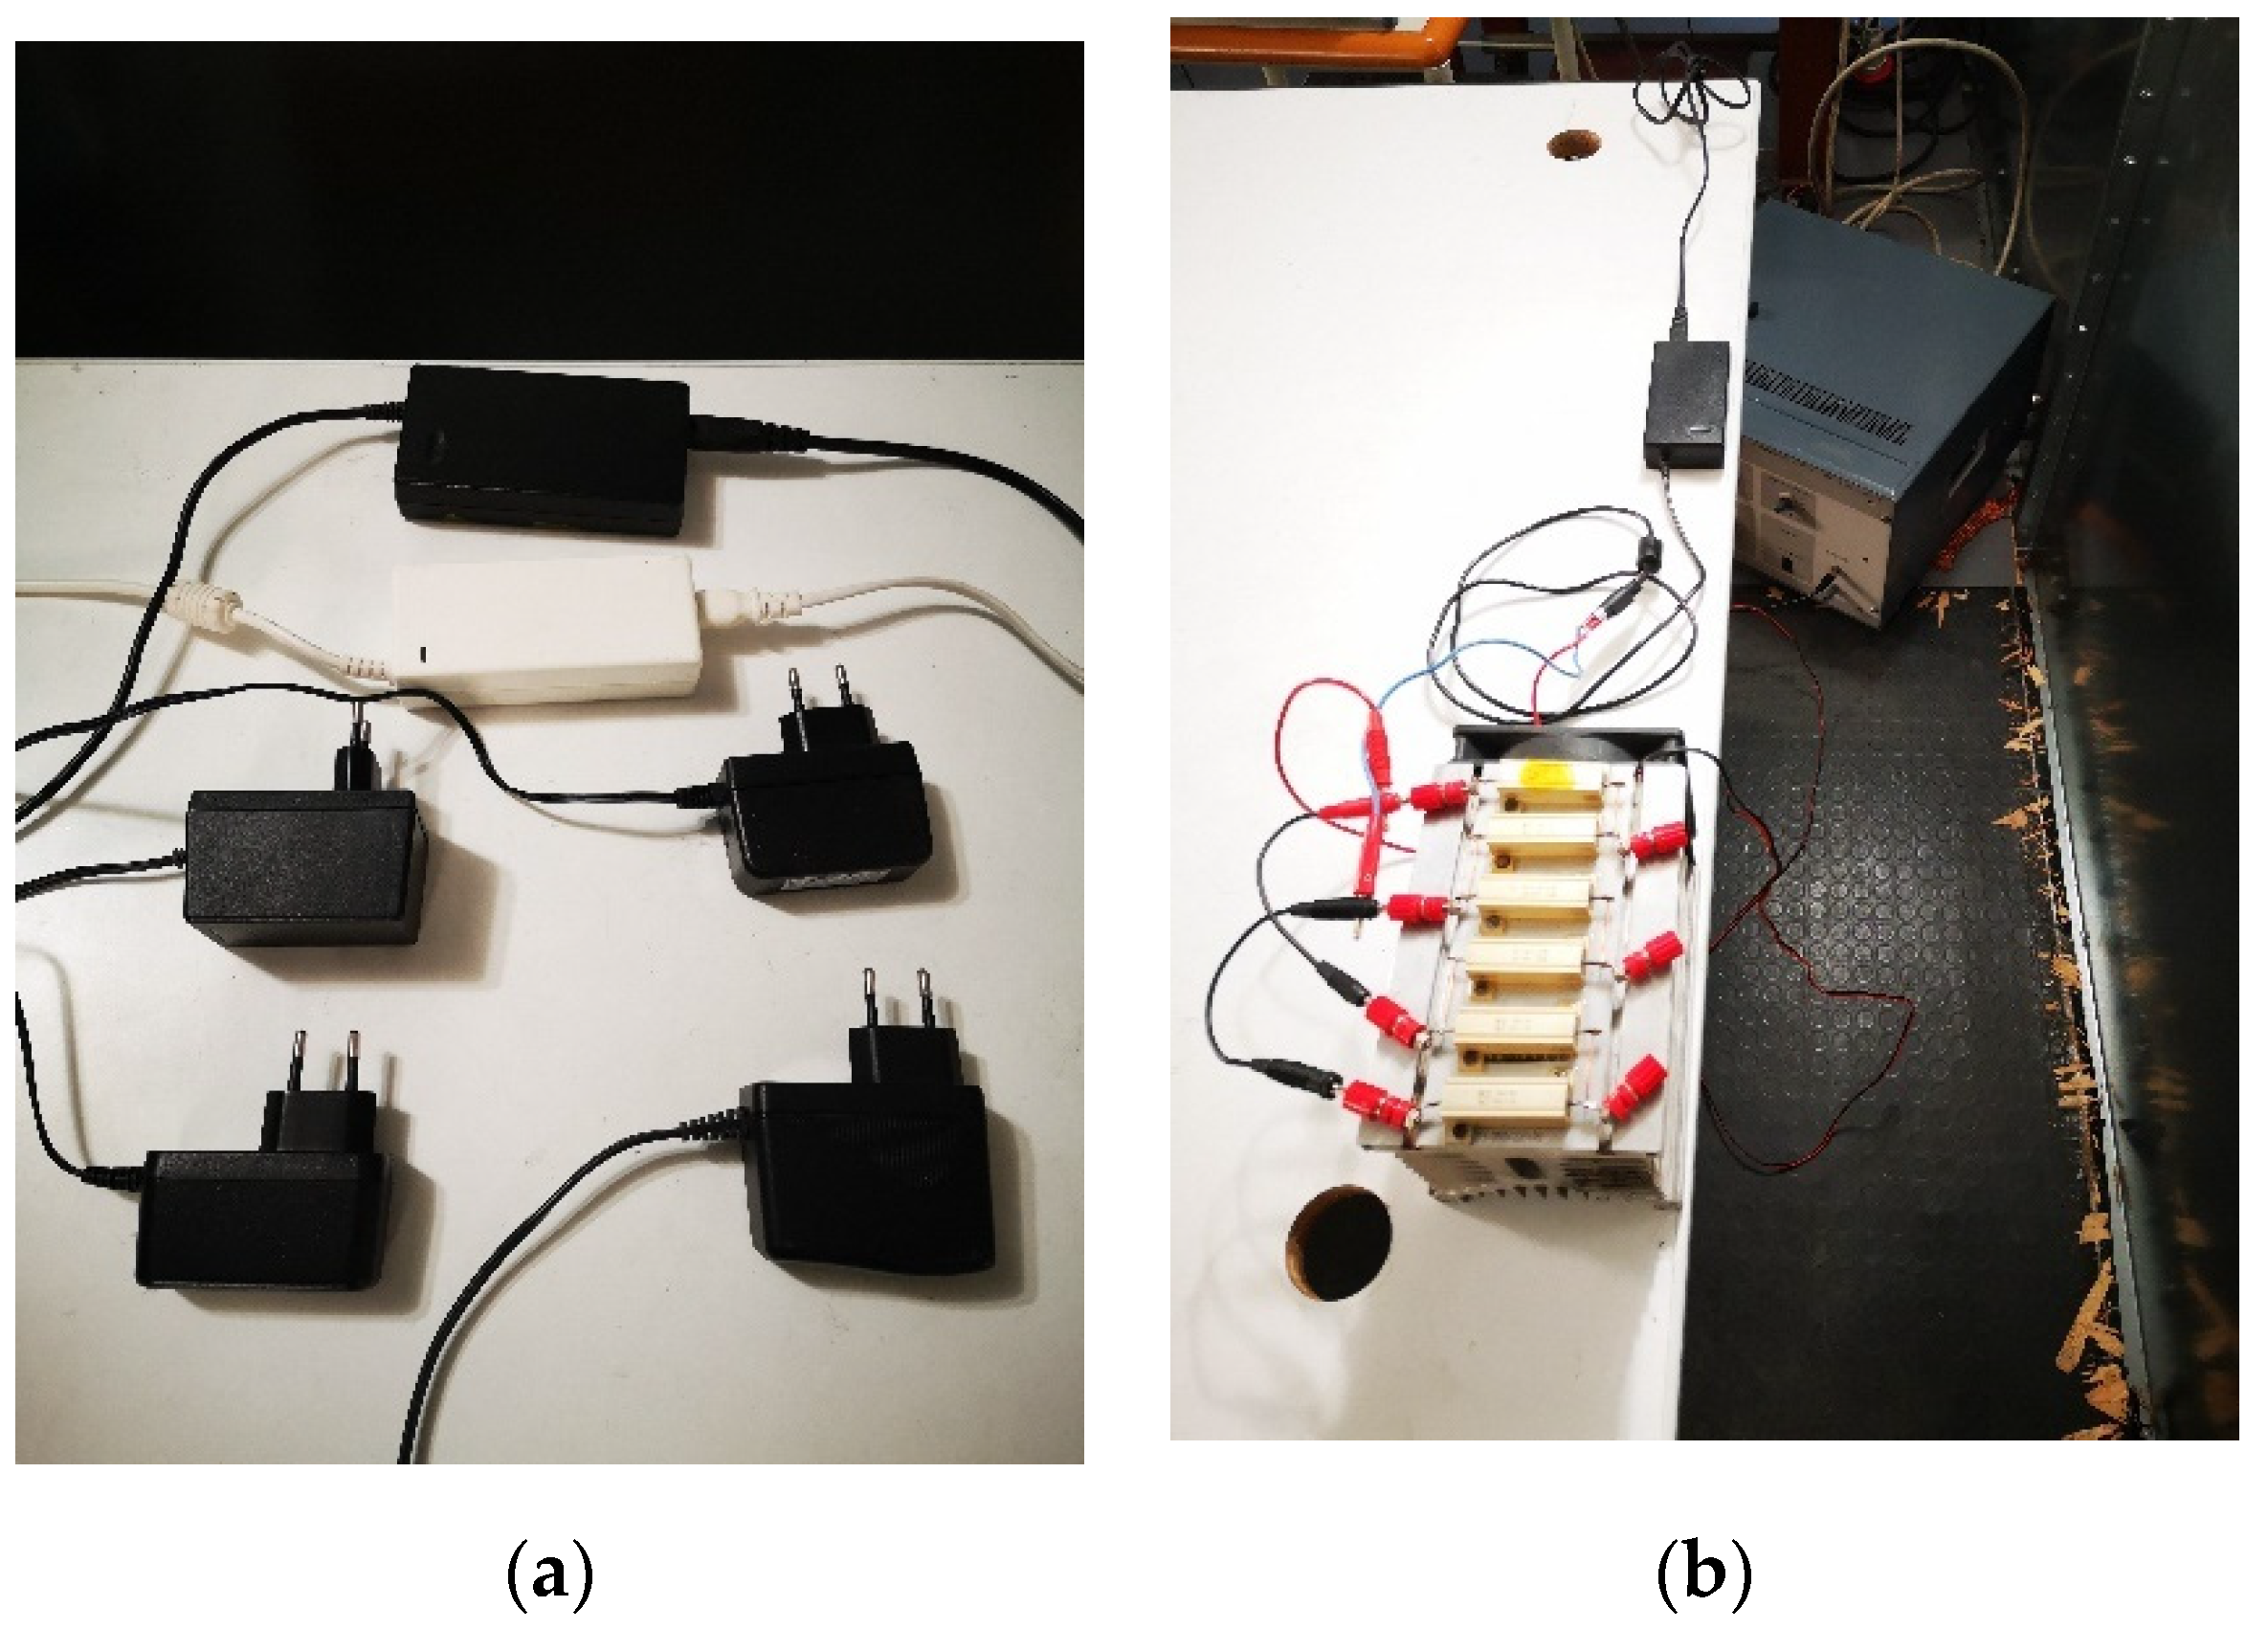
- Name of SMPS: BALANCE, BLACK, KARIO, KTEC, SHENZEN, WHITE;
- Load level: 0A (no load), P25 (25% of nominal load) and P90 (90% of nominal load).
References
- IEC 61000-3-2Electromagnetic Compatibility (EMC)—Part 3-2: Limits—Limits for Harmonic Current Emissions (Equipment Input Current ≤ 16 A Per Phase), IEC: Geneva, Switzerland, 2019.
- EN 55011Industrial, Scientific and Medical Equipment—Radio-Frequency Disturbance Characteristics—Limits and Methods of Measurement, CENELEC: Brussels, Belgium, 2021.
- EN 55032Electromagnetic Compatibility of Multimedia Equipment—Emission Requirements, CENELEC: Brussels, Belgium, 2020.
- Thomas, D. Conducted emissions in distribution systems (1 kHz–1 MHz). IEEE Electromagn. Compat. Mag. 2013, 2, 101–104. [Google Scholar] [CrossRef]
- Larsson, E.A.; Bollen, M.H.; Wahlberg, M.G.; Lundmark, C.M.; Ronnberg, S.K. Measurements of high-frequency (2–150 kHz) distortion in low-voltage networks. IEEE Trans. Power Del. 2010, 25, 1749–1757. [Google Scholar] [CrossRef]
- Frey, D.; Schanen, J.; Quintana, S.; Bollen, M.; Conrath, C. Study of high frequency harmonics propagation in industrial networks. In Proceedings of the International Symposium on Electromagnetic Compatibility—EMC EUROPE, Rome, Italy, 17–21 September 2012. [Google Scholar] [CrossRef]
- Bartak, G.F.; Abart, A. EMI in the frequency range 2kHz–150 kHz. In Proceedings of the CIRED 22nd International Conference on Electricity Distribution, Stockholm, Sweden, 10–13 June 2013. [Google Scholar]
- Klatt, M.; Meyer, J.; Schegner, P. Comparison of measurement methods for the frequency range of 2 kHz to 150 kHz. In Proceedings of the 2014 16th International Conference on Harmonics and Quality of Power (ICHQP), Bucharest, Romania, 25–28 May 2014. [Google Scholar] [CrossRef]
- Sandrolini, L.; Mariscotti, A. Techniques for the Analysis of Time-Domain Conducted Emissions of SMPS in Smart Grids. In Proceedings of the 2019 IEEE International Conference on Environment and Electrical Engineering and 2019 IEEE Industrial and Commercial Power Systems Europe (EEEIC/I&CPS Europe), Genova, Italy, 11–14 June 2019. [Google Scholar] [CrossRef]
- Ensini, L.; Sandrolini, L.; Thomas, D.W.P.; Sumner, M.; Rose, C. Conducted Emissions on DC Power Grids. In Proceedings of the 2018 International Symposium on Electromagnetic Compatibility (EMC EUROPE), Amsterdam, The Netherlands, 27–30 August 2018. [Google Scholar] [CrossRef]
- CISPR 16-1-1Specification for Radio Disturbance and Immunity Measuring Apparatus and Methods—Part 1-1: Radio Disturbance and Immunity Measuring Apparatus—Measuring Apparatus, CISPR: Geneva, Switzerland, 2019.
- EN 61000-4-19Electromagnetic Compatibility (EMC)—Part 4-19: Testing and Measurement Techniques—Test for Immunity to Conducted, Differential Mode Disturbances and Signalling in the Frequency Range 2 kHz to 150 kHz at a.c. Power Ports, CENELEC: Brussels, Belgium, 2014.
- EN 55014-1Electromagnetic Compatibility—Requirements for House- Hold Appliances, Electric Tools and Similar Apparatus—Part 1: Emission, CENELEC: Brussels, Belgium, 2017.
- EN 55015Limits and Methods of Measurement of Radio Disturbance Characteristics of Electrical Lighting and Similar Equipment, CENELEC: Brussels, Belgium, 2014.
- EN 61000-4-30Electromagnetic Compatibility—Part 4–30: Testing and Measurement Techniques—Power Quality Measurement Methods, CENELEC: Brussels, Belgium, 2015.
- EN 50065-1Signalling on Low-Voltage Electrical Installations in the Frequency Range 3 kHz to 148.5 kHz—Part 1: General Requirements, Frequency Bands and Electromagnetic Disturbances, CENELEC: Brussels, Belgium, 2012.
- Sandrolini, L.; Mariscotti, A. Impact of Short-Time Fourier Transform Parameters on the Accuracy of EMI Spectra Estimates in the 2–150 kHz Supraharmonics Interval. Electr. Power Syst. Res. 2021, 195, 107130. [Google Scholar] [CrossRef]
- Sandrolini, L.; Mariscotti, A. Signal Transformations for Analysis of Supraharmonic EMI caused by Switched-Mode Power Supplies. Electronics 2020, 9, 2088. [Google Scholar] [CrossRef]
- Mariscotti, A.; Sandrolini, L. Variability of EMI Measurement for Switched Mode Power Supplies EMI in the 2–1000 kHz Range. In Proceedings of the IEEE 11th International Workshop on Applied Measurements for Power Systems, Cagliari, Italy, 29 September–1 October 2021. [Google Scholar] [CrossRef]
- Brander, T.; Gerfer, A.; Rall, B.; Zenkner, H. Trilogy of Magnetics, 5th ed.; Swiridoff Verlag: Waldenburg, Germany, 2018. [Google Scholar]
- Pressman, A.I.; Billings, K.; Morey, T. Switching Power Supply Design, 3rd ed.; McGraw Hill: New York, NY, USA, 2009. [Google Scholar]
- Rice, J.; Gehrke, D.; Segal, M. Understanding Noise-Spreading Techniques and their Effects in Switch-Mode Power Applications, Texas Instruments. 2011. Available online: https://www.ti.com/seclit/ml/slup269/slup269.pdf (accessed on 28 December 2021).
- Iraheta, A. Further Optimizing EMI with Spread Spectrum, Texas Instruments. March 2021. Available online: https://www.ti.com/lit/pdf/slvaf18 (accessed on 28 December 2021).
- Curtis, P.; Lee, E. EMI Reduction Technique, Dual Random Spread Spectrum, Texas Instruments. June 2020. Available online: https://www.ti.com/lit/pdf/snva974 (accessed on 28 December 2021).
- Reduction of Switched Mode Power Supply Electro-Magnetic Emissions in Automotive Cockpit Applications, ON Semiconductor. April 2013. Available online: https://www.onsemi.com/pub/collateral/tnd6032-d.pdf (accessed on 28 December 2021).
- Wan, L.; Khilnani, A.; Hamid, A.; Grassi, F.; Spadacini, G.; Pignari, S.; Sumner, M.; Thomas, D. Limitations in Applying the Existing LISN Topologies for Low Frequency Conducted Emission Measurements and Possible Solution. In Proceedings of the Asia-Pacific International Symposium on Electromagnetic Compatibility (APEMC), Nusa Dua-Bali, Indonesia, 27–30 September 2021. [Google Scholar] [CrossRef]
- Streubel, T.; Kattmann, C.; Eisenmann, A.; Rudion, K. Characterization of Supraharmonic Emission from Three Different Electric Vehicle Charging Infrastructures in Time and Frequency Domain. Energies 2022, 15, 394. [Google Scholar] [CrossRef]


| Acronym | SMPS | Vno-load (V) | I25%-load (A) | I90%-load (A) |
|---|---|---|---|---|
| LW | Lacie White (24 W) | 12.94 | 0.51 | 1.83 |
| LB | Lacie Black (26.4 W) | 11.75 | 0.47 | 1.72 |
| KT | KTEC (18 W) | 12.19 | 0.37 | 1.43 |
| SH | Shenzhen Honor (18 W) | 12.45 | 0.38 | 1.45 |
| BA | Balance (10 W) | 5.212 | 0.51 | 1.94 |
| KA | Kario (10 W) | 5.144 | 0.51 | 1.91 |
| Power | Switching Topology | Galvanic Isolation |
|---|---|---|
| Low | Buck (step-down) | No |
| Low | Boost (step-up) | No |
| Low | SEPIC (single-ended primary inductance converter) | No |
| Low | Flyback | Yes |
| High | Forward | Yes |
| High | Push–pull | Yes |
Publisher’s Note: MDPI stays neutral with regard to jurisdictional claims in published maps and institutional affiliations. |
© 2022 by the authors. Licensee MDPI, Basel, Switzerland. This article is an open access article distributed under the terms and conditions of the Creative Commons Attribution (CC BY) license (https://creativecommons.org/licenses/by/4.0/).
Share and Cite
Sandrolini, L.; Mariscotti, A. Waveform and Spectral Characteristics of Supraharmonic Unsymmetrical Conducted EMI of Switched-Mode Power Supplies. Electronics 2022, 11, 591. https://doi.org/10.3390/electronics11040591
Sandrolini L, Mariscotti A. Waveform and Spectral Characteristics of Supraharmonic Unsymmetrical Conducted EMI of Switched-Mode Power Supplies. Electronics. 2022; 11(4):591. https://doi.org/10.3390/electronics11040591
Chicago/Turabian StyleSandrolini, Leonardo, and Andrea Mariscotti. 2022. "Waveform and Spectral Characteristics of Supraharmonic Unsymmetrical Conducted EMI of Switched-Mode Power Supplies" Electronics 11, no. 4: 591. https://doi.org/10.3390/electronics11040591
APA StyleSandrolini, L., & Mariscotti, A. (2022). Waveform and Spectral Characteristics of Supraharmonic Unsymmetrical Conducted EMI of Switched-Mode Power Supplies. Electronics, 11(4), 591. https://doi.org/10.3390/electronics11040591