Article

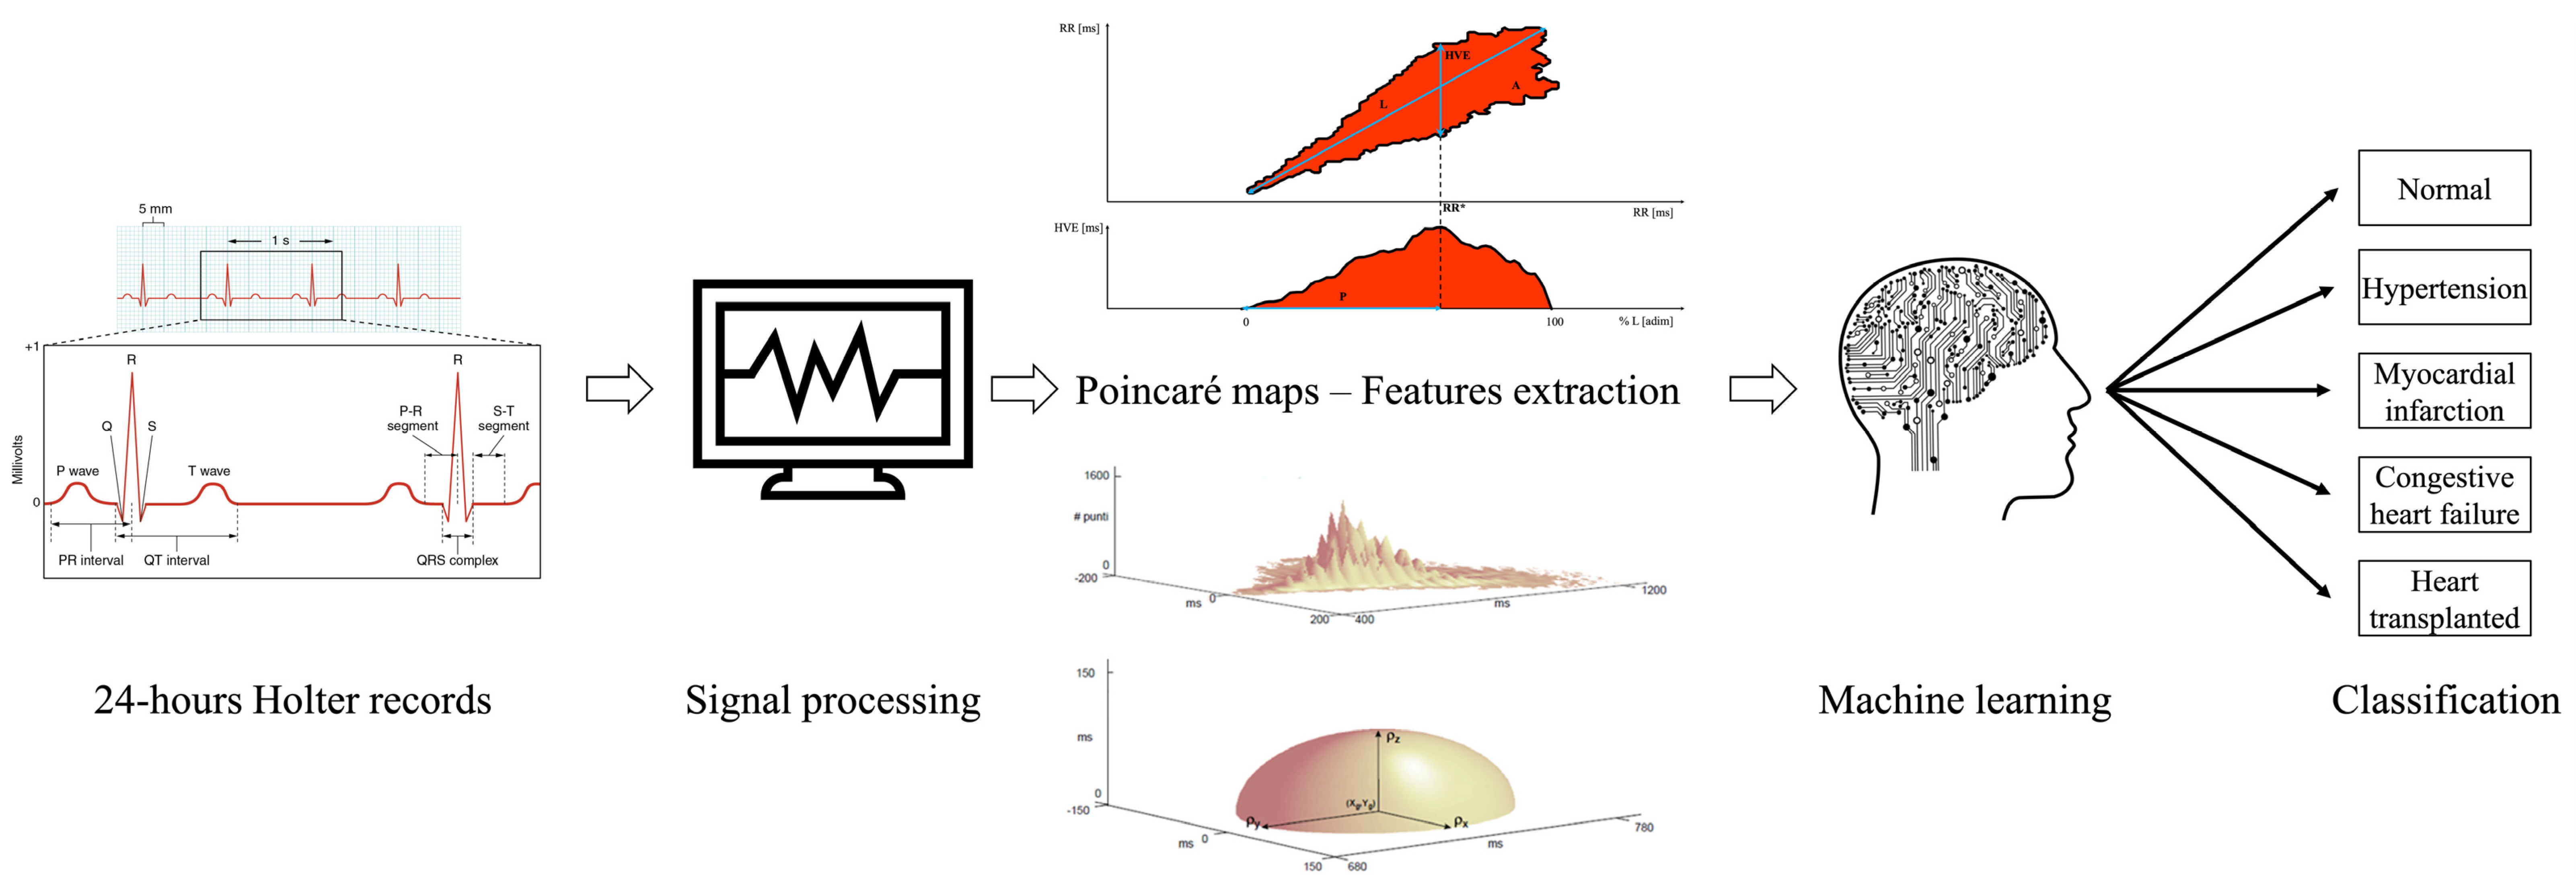
Bidimensional and Tridimensional Poincaré Maps in Cardiology: A Multiclass Machine Learning Study

1
Department of Advanced Biomedical Sciences, University of Naples “Federico II”, 80131 Naples, Italy
2
Bioengineering Unit, Institute of Care and Scientific Research Maugeri, 82037 Telese Terme, Italy
3
Department of Electrical Engineering and Information Technologies, University of Naples “Federico II”, 80125 Naples, Italy
4
Department of Chemical, Materials and Production Engineering, University of Naples “Federico II”, 80125 Naples, Italy
*
Author to whom correspondence should be addressed.
Electronics 2022, 11(3), 448; https://doi.org/10.3390/electronics11030448
Submission received: 14 December 2021 / Revised: 24 January 2022 / Accepted: 30 January 2022 / Published: 2 February 2022
(This article belongs to the Special Issue Machine Learning in Electronic and Biomedical Engineering)

Abstract

:
Heart rate is a nonstationary signal and its variation may contain indicators of current disease or warnings about impending cardiac diseases. Hence, heart rate variation analysis has become a noninvasive tool to further study the activities of the autonomic nervous system. In this scenario, the Poincaré plot analysis has proven to be a valuable tool to support cardiac diseases diagnosis. The study’s aim is a preliminary exploration of the feasibility of machine learning to classify subjects belonging to five cardiac states (healthy, hypertension, myocardial infarction, congestive heart failure and heart transplanted) using ten unconventional quantitative parameters extracted from bidimensional and three-dimensional Poincaré maps. Knime Analytic Platform was used to implement several machine learning algorithms: Gradient Boosting, Adaptive Boosting, k-Nearest Neighbor and Naïve Bayes. Accuracy, sensitivity and specificity were computed to assess the performances of the predictive models using the leave-one-out cross-validation. The Synthetic Minority Oversampling technique was previously performed for data augmentation considering the small size of the dataset and the number of features. A feature importance, ranked on the basis of the Information Gain values, was computed. Preliminarily, a univariate statistical analysis was performed through one-way Kruskal Wallis plus post-hoc for all the features. Machine learning analysis achieved interesting results in terms of evaluation metrics, such as demonstrated by Adaptive Boosting and k-Nearest Neighbor (accuracies greater than 90%). Gradient Boosting and k-Nearest Neighbor reached even 100% score in sensitivity and specificity, respectively. The most important features according to information gain are in line with the results obtained from the statistical analysis confirming their predictive power. The study shows the proposed combination of unconventional features extracted from Poincaré maps and well-known machine learning algorithms represents a valuable approach to automatically classify patients with different cardiac diseases. Future investigations on enriched datasets will further confirm the potential application of this methodology in diagnostic.

1. Introduction

This paper is an extension of the work originally presented in the 2020 11th conference of the European Study Group on Cardiovascular Oscillations [1].
Developments in the measurement and available devices have led to even more accurate observations on the heart rate and its variations; this led to defining heart rate variability (HRV) as a diagnostic tool for heart disease evaluations.
Traditionally, HRV analysis from short-term laboratory recordings is based on time and frequency domains measurements [2,3]. Other methodological approaches, mainly based on nonlinear dynamics properties of the heart rate variability signal, are applied to long-term time series, owing to the need for large amount of data to derive the desired indexes [4,5]. The Poincaré plot is a simple and robust graphical technique which can be applied both to long- and short-term HRV recordings, in order to extract relevant information on beat-to-beat signal dynamics [6].
Machine learning (ML) is a branch of artificial intelligence whose aim is to recognize hidden patterns automatically from data. Recently, it has been frequently used to deal with biomedical issues in several contexts: cardiology [7,8], fetal monitoring [9,10,11], medical imaging analysis [12,13], oncology [14,15,16] and in several other medical specialties [17,18,19]. Problems regarding regression or classification have been solved by applying state-of-art algorithms which proved to help clinicians in handling difficult tasks.
Previous studies have shown that abnormal Poincaré maps, classified by visual examination, are better predictors of cardiac mortality in heart failure patients than conventional indexes [20,21]. To overcome the limitation of subjective evaluation of the plots, our group introduced new signal-processing procedures to automatically quantify major morphological characteristics of these plots [22,23].
The question remains whether it is possible to use Poincaré maps—2D and 3D—and new unconventional quantitative features extracted from Poincaré maps to discriminate different cardiac issues since, to the best of our knowledge, there are no existing similar systems which have used these parameters to perform a 5-group classification in cardiology. Indeed, our aim was to prove the feasibility of the proposed parameters in distinguishing five types of cardiac issues. To reach this scope, we fed ML algorithms using the above-mentioned features through a dedicated software developed by the authors [23].
Our preliminary findings indicate that the proposed combination of features and algorithms represents a valuable approach to automatically discriminate several cardiac conditions. This finding confirms the potential application of this methodology as a valid tool to support the clinical decision making of patients affected by different cardiac pathologies.
Several publications have appeared in recent years showing how ML algorithms contributed to classifying cardiac pathologies. For example, Isler and co-workers [24] investigated the best features subset for a binary classification problem (namely, congestive heart failure (CHF) versus healthy controls) but setting up a multi-stage classification strategy to accomplish the highest diagnosis accuracy. The authors considered different typologies of features (even some extracted from Poincaré maps), preliminary outcomes following a one-step classification process by means of several ML algorithms and results comparisons related to these algorithms evaluating the differences of different cross-validation methods [25]. Gong and co-workers [26] presented a similar work whose last scope was to find out eventual enhancements in the testing stage runtime of the proposed ML classification strategy. The authors assessed whether a precise feature subset (in which they included 3 Poincaré maps features out of 10)–Adopted following a histogram-manual feature selection, where they were extracted from segmented 5 min ECG acquisitions–Fed neural network to provide evidence to distinguish arrhythmia and normal state ECG in few (about 200) milliseconds. Finally, Zhao and co-workers [27] analyzed, instead, the concomitant extraction of features from HRV and pulse transit time variability to assess potential improvements in CHF investigation using a ML strategy. The authors observed the features extracted from pulse transit time variability helped to increase the classification scores.
Although ML strategies proved effective in many binary classification problems, most of the previous studies do not focus on multi-group classifications and, moreover, do not investigate as potential features non–Standard ones extracted from Poincaré maps. With this goal, this work integrates the preliminary findings observed in [1] exploring improvements in the classification performance of 5 classes of patients using the quantitative features extracted from Poincaré maps (Figure 1).
The implementation of ML-based tools in physiology, e.g., in the cardiovascular field, has attracted attention and is influencing the biomedical community. The introduction of parameters (i.e., those extracted from Poincaré maps) could represent a potential support for physiologists called to make specific decisions which can save patients’ lives.

2. Materials and Methods

2.1. Dataset

The non-linear time series analysis (NOLTISALIS) database was collected by the cooperation of several university departments and rehabilitation clinics in Italy. The NOLTISALIS database includes RR series of 50 patients (extracted from 24-h Holter recordings) of subjects marked by the following health states: normal (N), hypertension (H), (after) myocardial infarction (M), CHF (C) and heart transplanted (T). The RR data were grouped accordingly in the 5 different classes, after the subsequent analyses: firstly, ECG data were recorded using different Holter devices. Later, beats were labelled using automated procedures through a proper analysis software. The detected beats were: N (normal), V (ventricular ectopic), S (supraventricular ectopic) or X (artifacts). As confirmation, experienced Holter scanning technicians manually verified the annotations. Finally, artifact detection and a correction on ectopic beats were performed as reported in [28].

2.2. Poincaré Plot Analysis

The technique is based on the analysis of the maps constructed by plotting each RR interval against the previous one. Usually bi-dimensional plots are visually classified into three typical patterns: a comet-shaped pattern, a torpedo-shaped pattern and a fan-shaped pattern [20]. This approach (based on a visual classification) is marked by an intrinsic limitation: plots evaluation results subjective.
To overcome this issue, several investigations were designed to extract features from signals [29]; a pertinent example in the Poincaré field was proposed by D’Addio and co-workers who developed a dedicated software able to automatically quantify morphological features of bi-dimensional and three-dimensional Poincaré maps; the technical details are described elsewhere [30]. The software is able to extract 10 features. About the 2D Poincaré plot, algorithms for binary image analysis were applied in order to eliminate salt and pepper noise (isolated points or points below a default degree of connection), the presence of which would have incorrectly altered the estimation of the parameters. To reach this aim, all connected components, namely objects, that have fewer than four pixels from the binary image (namely, the 2D Poincaré Plot) were removed through an operation known as area opening. Moreover, a flood fill operation on background pixels of the input binary image was executed starting from the points specified. The features extracted from bidimensional plot (Figure 1) are measures of the extension and dispersion of the ellipsoidal cloud of points around the bisecting line, namely: Length (L), Area (A), Highest Variability Extension (HVE)–Obtained by scanning the bidimensional plot with a vertical line and generating a curve which represents the measure of the scatter plot width at different RR intervals–and the percentage of the length which corresponds to the maximum plot wideness (P). Three-dimensional plots consider the RR couples repetition’s number and the times this condition has been repeated. The features extracted from three dimensional plots are measures related to the plot’s height, as shown in Figure 1: the peak number (Np) is the RR couple’s repetition number, Dp is the mean peaks distance from the bisecting line and the triplet (ρx, ρy, ρz) is the length of the three radii of inertia of the semi-ellipsoidal three-dimensional cloud of points by looking at the 3D plot (Figure 1), as composed of point masses of a discrete material system of N points [31]. The peaks shown in Figure 1 were identified by a threshold value defined in percent of the maximum. To select a threshold as independently as possible from the number of identified peaks, a threshold value equal to half the maximum was set.

2.3. Statistical Analysis

A univariate statistical analysis was performed for each parameter extracted from the Poincaré maps for each patient (File S1). Due to the low amount of data, the analysis was led with non-parametric tests. Indeed, Kruskal Wallis ones were conducted to distinguish the classes of cardiac pathologies; specifically, the test’s aim was to find at least one different group compared with all the others. Furthermore, a post-hoc test was performed when the previous ones proved significant (p-value < 0.05); specifically, the post-hoc aim was to compare each couple of features when the Kruskal-Wallis is significant. Then, a multinomial logistic regression was performed on the as-is dataset to understand the feasibility in distinguishing the classes without employing any artificial augmentation of the data. A correlation among the variables was computed and those correlated with a coefficient lower than 0.70 were kept; no outliers were removed and the goodness of fit with the confusion matrix were computed. The whole analysis is shown in the “Statistical analysis” subsection of the “Results” section.

2.4. Machine Learning Tool and Algorithms

The following four machine learning algorithms were implemented.
Gradient boosting (GB) re-defines boosting as a numerical optimization problem. GB aim is to minimize the loss function of the model by adding weak learners using gradient descent, namely a first-order iterative optimization algorithm for finding a local minimum of a differentiable function. In this work, the tool used is a combination of decision trees measure and boosting technique. This method will raise the sample weight of the previous decision tree classified wrongly, which pays them more attention in the training of the next decision tree; thus, with more trees built, less and less samples are misclassified [32]. In our paper, one hundred models were employed with a learning rate of 0.1 and a maximum tree depth of four.
AdaBoost algorithm (ADA-B), short for Adaptive Boosting, is a meta-algorithm (formulated by Yoav Freund and Robert Schapire [33]) used as an ensemble method in machine learning. It reassigns the weights to each instance with higher values to incorrectly classify the instances. ADA-B allows to reduce bias as well as the variance for the supervised learning. An ensemble of decision stump (decision tree with only one node and two leaves) were considered in the present study. In this paper, J48 was unpruned, and the Minimum description length criterion was set on while the number of iterations for the ADA-B was set to 10.
K Nearest Neighbor (kNN) is one of the oldest and simplest methods for pattern classification. Nevertheless, it often produces competitive results. The kNN rule classifies each unlabelled instance by the majority label class among its k nearest neighbors in the training set. Thus, its performance depends crucially on the distance metric used to identify the nearest neighbors. In the absence of prior knowledge, most kNN classifiers use simple Euclidean metric to measure the dissimilarities between instances represented as vector inputs [34], as in the case under study. The traditional kNN usually assumes that the training samples are equally distributed among different classes: this assumption matches with our dataset where classes are perfectly balanced. Furthermore, applying the stratification, the assumption is valid in the training set too. Finally, it is worth highlighting k is the most important parameter in a classification system based on kNN, because the classification performance is very sensitive to the choice of the parameter k [35]. In this work, k was set equal to 3 without a weight for the distance and the algorithmic search for the neighbour was linear.
Naive Bayes (NB) is a probabilistic learning algorithm, based on Bayes’ theorem. The algorithm computes the probability of each class for a specified instance and then outputs the class with the highest probability. NB requires few data for training and little storage space; this is a positive aspect for the case under study, because we analyzed a small dataset. Furthermore, it is worth highlighting the algorithm results quick in the training phase and does not require setting many parameters; nevertheless, it is based on a strong assumption, i.e., the conditional independence of the features (more precisely, all features are independent given the value of the class). Despite this basic assumption, NB shows good performances in the case of dependence between features, even if it shows decreasing performances when there is a strong correlation between two or more features [36].
Synthetic Minority Oversampling technique (SMOTE) was implemented to augment data considering the small size of our initial dataset. SMOTE selects potential examples that are close in the feature space, draws a line between the examples in the feature space and finally designates a new sample at a point along that line [37,38].
Leave-one-out cross-validation (LOOCV) was performed to validate the four predictive models. LOOCV is a special case of cross-validation where the number of folds equals the number of instances in the data set [39]. Thus, the learning algorithm is applied once for each instance, using all other instances as a training set and using the selected instance as a single-item test-set.
Furthermore, a subsequent investigation using the wrapper method was employed in order to find the best subset of features that could maximize the accuracy of the model by building iteratively a model and adding/subtracting features during each cycle of learning. Indeed, the usefulness of this method relies on the elimination of useless features and the building of a more reliable model based on a reduced set of features. A hold out cross-validation (70% for training and 30% for test) was used and the wrapper was applied on the training set while the evaluation metrics were computed on the test set [39]. Indeed, the use of the feature selection method has shown great potential in previous papers [40,41,42,43].
Knime analytics platform (v. 4.2.0) was chosen to conduct the ML analysis in light of its consideration in literature [44,45] as the best platform for advanced ML users. It allows to create workflows of ML analysis by combining nodes and without the need for programming languages. Several recent biomedical studies have been conducted by choosing this platform [46,47,48,49], even to analyse data regarding the actual pandemic scenario [50,51].

3. Results

3.1. Statistical Analysis

Table 1 reports the results obtained by applying the Kruskal Wallis test on each parameter (Par) among the 5 classes extracted through the Poincaré plot analysis, while Table 2 shows the results of the post hoc test for the variables resulting significant in Table 1.
None of the variables were able to distinguish each group from all the others although several differences were detected through the post-hoc analysis. The class with the greatest number of significances was the T (17 significances), followed by the normal one (14 significances), C and H (both 10 significances). Therefore, according to the statistical analysis, subjects who underwent a heart transplantation and healthy subjects were the most recognizable by the Poincaré maps.
Then, the multinomial logistic regression was performed; L, P, Np, Dp and V were kept after the correlation analysis. Table 3 shows the confusion matrix of such model.
The overall accuracy of the model was 76.0%, while the goodness of fit test showed a p-value = 1.000 indicating a good match between the model and the real data. T patients were the most recognizable while M patients were the least recognizable.

3.2. Machine Learning Analysis

First, the ML analysis was performed on the as-is dataset by employing a LOOCV: 10 patients for 5 groups for a total of 50 subjects. The small sample size and the low number of subjects per class did not allow us to obtain–ss expected–reliable results (data not shown). Therefore, the analysis was repeated on the dataset augmented through SMOTE to obtain more insights. In any case, it should be reminded the multinomial logistic regression already proved in advance the feasibility of our features in distinguishing the 5 classes.
SMOTE was implemented to augment the dataset with artificial data, thus increasing the number of records from 50 to 100 (each group was doubled). Then, a LOOCV step was implemented to compute the evaluation metrics for the proposed ML algorithms. Table 4 reports these using the normal class as reference for each algorithm, while Table 5 shows the confusion matrix of the best algorithm.
Excluding NB, which achieved lower performances (accuracy of 76% yet a good specificity of 93.8%) mainly due to the strong correlation between several of the considered features (correlation study data not shown), the other algorithms showed successful results. ADA-B and KNN obtained metrics greater than 90%; indeed, the former showed an accuracy of 91% with a specificity of 97.5%, while the latter an accuracy of 92% and a perfect specificity (100%). Furthermore, it was even remarkable GB sensitivity (100%).
Finally, the features importance, according to the information gain, was computed and illustrated in Figure 2 after a transformation into percentage values. The top-3 features to perform the classification resulted L, Np and ρx.
Table 6 shows the evaluation metrics of the algorithms after applying the wrapper method. The ranking of the algorithms was the same obtained with the other workflow: KNN obtained the highest accuracy (96.7%) followed by ADA-B (93.3%) and GB (90.0%). The sensitivity and the specificity were computed using the normal class as reference.

4. Discussion

In this paper, the aim was to distinguish healthy subjects from patients affected by four different cardiac pathologies by using first a univariate statistical analysis and then ML algorithms applied on features extracted from Poincaré maps.
The initial part (namely, the Kruskal Wallis test) of the statistical analysis showed promising results by highlighting the statistically significance of 8 out of 10 parameters, while the second part (post-hoc tests) enhanced which type of pathology was the most discernible according to the analyzed parameters: T was the most different class according to our features. These results were particularly surprising because, despite having only 10 subjects per group, almost all the features resulted highly statistically significant and therefore strongly showed to distinguish the presented subject classes. The performed statistical analyses are an extension of these presented in our previous work [1] and corroborate the feature importance evidence reported in Figure 2; indeed, P and V proved non-significant and of less importance.
The ML analysis aimed at creating reliable models to classify the 50 patients; the KNN algorithm achieved the highest evaluation metrics followed by ADA-B. Both overcame a 90% overall accuracy, demonstrating the average reliability of the tested algorithms was overall high. There were two reasons for preferring a ML analysis rather than a logistic regression: first, the logistic regression requires 3 assumptions–Multicollinearity, absence of outliers and a ratio 1:10 between variables and patients [52]. While there are no assumptions for a ML analysis; furthermore, it has been demonstrated empirically that a ML analysis can outperform a multinomial logistic regression [17].
In the “Introduction” and “Poincaré plot analysis” sections we described the motivations which have pushed investigations to perform objective evaluations of Poincaré maps to derive new quantitative parameters; these could support to reveal hidden patterns in various disease conditions. Moridani and co-workers also presented novel 2D features extracted from Poincaré maps (and related graphs which the authors labeled “return maps”) of 80 cardiovascular patients. The three presented features demonstrated the most appropriate (compared to traditional and conventional Poincaré ones) to predict differences in HRV signals of patients in different time windows before death, representing a potential tool to save intensive care units patients in the future [53].
Considering similar intentions, the combination of goals, analyses and the chosen Poincaré-related features offers a novel solution for the application of ML strategies in the cardiovascular field. Indeed, to our best knowledge, this is the first research study which proposes the opportunity to classify healthy subjects and patients affected by 4 different cardiac pathologies considering only a set of geometrical 2D and 3D parameters extracted from Poincaré maps. The following paragraphs will validate the previous claims presenting similar studies which investigated ML multi-group classifications but investigating also features belonging to the temporal and spatial domain of HRV.
Rezaei and co-workers assessed in a recent conference paper the potential use of kNN to distinguish 4 classes of subjects, one of normal sinus rhythm patients and others collecting subjects affected by three pathologies, namely atrial fibrillation, acute myocardial infarction and CHF, respectively. The authors extracted from Poincaré maps 16 features which were subsequently statistically evaluated and fed to a kNN algorithm. A combination of 2 conventional and 2 unconventional Poincaré based parameters proved to correctly separate (with scores higher than 90%) the cardiac signals belonging to different patients’ classes [54].
Agliari and co-workers investigated a similar multi-group classification using a multi-layer feed-forward neural network [50]. The study considered more than 2200 patients with 4 possible outcomes: healthy, atrial fibrillation, congestive decompensation and other pathologies (among which it can be highlighted the I class). The authors considered only one of the 2 Poincaré parameters (described also by Rezaei and co-workers [54]) after a correlation analysis between the 49 initial collected features [55].
Another remarkable example has been proposed by Devi and co-workers. They considered the same 2 “classical” Poincaré parameters yet mentioned (and their ratio too) as potential indicators for the prediction of sudden cardiac death. The authors analyzed several archived ECG of normal subjects and patients (which suffered/non suffered of sudden death) affected by cardiovascular diseases. Although the authors initially included the Poincaré parameters in the feature set, a subsequent feature selection step (using a hybrid approach of unsupervised and sampling-boosting ensemble learning techniques) excluded such features from the optimal subset. However, the overall approach demonstrated effective to distinguish sudden death patients from merely heart failure ones and healthy controls with a satisfactory accuracy of 83.33% using fine and weighted kNN algorithms [56].
Recently, Leite and co-workers investigated the NOLTISALIS database designing a multi-group study to classify H, C and T patients. The authors used an improved recurrent neural network fed by six “time sequences of features”. The methodology achieved promising results for both the training set (96.7%) and the test set (86.7%) [57]. When comparing these results with those in this paper, on the test set the authors accuracies result lower than ours, while we both have achieved 100% of sensitivity; nevertheless, a direct comparison is not completely fair since we considered five groups and we applied SMOTE for data augmentation.
The most recent, similar contribution was presented by D’Addio and co-workers [58] where the authors showed NB, ADA-B and KNN (listed considering increasing sensitivities) effectively classified C patients’ severity based on New York Heart Association functional classification, using the same unconventional features extracted from bi-dimensional and three-dimensional Poincaré Plots. Their accuracies and, generally, the overall evaluation metrics are lower than ours in this study but, again, a direct comparison is not completely fair since we considered a different target and we applied SMOTE for data augmentation.
However, these studies should be considered as pilot ones, because the respective authors always highlighted new investigations with larger dataset should be carried out as verifications.

5. Conclusions

In conclusion, this paper demonstrates–Again, corroborating the promising results obtained in our previous conference papers for the same [1] or a similar goal [58,59]–ML strategies could be effectively implemented to support specialists in discriminating healthy subjects from patients which are potentially affected by either H, M or C, or underwent a T previously. kNN, ADA-B and GB proved fully valid for the scope presenting high performances with score peaks in different indicators which could potentially suggest the adoption of a precise algorithm between those proposed. Additionally, we also found the multinomial logistic regression demonstrated useful to prove–without using any ML algorithm–the goodness of the Poincaré related features.
We remark the main novelty is represented by the implementation of a 5-class investigation using only unconventional geometrical Poincaré parameters; to best of the authors’ knowledge, the paper presented by Pinho and co-workers is the only example in the field of a multi-group classification considering more than 5 categories of heart diseases [60]. Nevertheless, the authors do not consider features extracted from Poincaré maps for their scope; therefore, a direct comparison is not possible.
Despite not pursuing the same aims of our research, we compared other works found in literature with ours. Rezaei and co-workers obtained evaluation metrics compatible with the result presented in this manuscript [54]. Differently, Devi and co-workers achieved an 83.3% of accuracy in detecting patients suffering from sudden death, while Agliari and co-workers exhibited an accuracy up to 85% with a multi-group classification by means of neural networks [55,56]. Finally, Leite and co-workers achieved with a similar methodology comparable result on the NOLTISALIS database (similar objective, but different features), nevertheless excluding the H and M groups [57].
Of course, even our study exhibited limitations. First, the dataset was clearly small, and this could represent a limitation for both the statistical analysis and ML analyses. For this reason, SMOTE was applied allowing us to conduct the modeling analysis through ML, although SMOTE itself could be considered a limitation, too. Nevertheless, both these could be addressed in the future by increasing the number of patients. Another part of the strategy, which could provide our methodology with more value, could be even the use of shorter ECG acquisitions (e.g., up to a minimum of 30 min) as to strengthen the predictive power of our features.

Supplementary Materials

The following are available online at https://www.mdpi.com/article/10.3390/electronics11030448/s1, File S1: dataset (which includes the Poincaré variables and the classes relating to each instance) used to support several of the findings of this study (specifically, the multinomial logistic regression and the ML results).

Author Contributions

Conceptualization, L.D., C.R. and G.C.; Data curation, A.C. and F.A.; Formal analysis, L.D. and C.R.; Investigation, G.D.; Methodology, L.D., C.R. and S.A.; Project administration, G.D.; Resources, G.D.; Software, G.D.; Supervision, G.D.; Validation, L.D., C.R. and S.A.; Visualization, G.C., A.C. and F.A.; Writing—Original draft, L.D., C.R. and G.C.; Writing—Review & editing, G.D. All authors have read and agreed to the published version of the manuscript.

Funding

This research received no external funding.

Acknowledgments

Sarah Adamo wishes to thank the Gruppo per l’Armonizzazione delle Reti della Ricerca (GARR) for her research grant.

Conflicts of Interest

The authors declare that there is no conflict of interest regarding the publication of this paper.

References

  1. Donisi, L.; Ricciardi, C.; Cesarelli, G.; Pagano, G.; Amitrano, F.; D’Addio, G. Machine Learning applied on Poincaré Analyisis to discriminate different cardiac issues. In Proceedings of the 2020 11th Conference of the European Study Group on Cardiovascular Oscillations (ESGCO), Pisa, Italy, 15 July 2020; Pernice, R., Ed.; IEEE: Piscataway, NJ, USA, 2020. [Google Scholar]
  2. La Rovere, M.T.; Pinna, G.D.; Maestri, R.; Mortara, A.; Capomolla, S.; Febo, O.; Ferrari, R.; Franchini, M.; Gnemmi, M.; Opasich, C.; et al. Short-Term Heart Rate Variability Strongly Predicts Sudden Cardiac Death in Chronic Heart Failure Patients. Circulation 2003, 107, 565–570. [Google Scholar] [CrossRef] [PubMed]
  3. Cusenza, M.; Accardo, A.; D’Addio, G.; Corbi, G. Relationship between fractal dimension and power-law exponent of heart rate variability in normal and heart failure subjects. In Proceedings of the 2010 Computing in Cardiology, Belfast, UK, 26–29 September 2010; IEEE: Piscataway, NJ, USA, 2010; pp. 935–938. [Google Scholar]
  4. Maestri, R.; Pinna, G.D.; Balocchi, R.; D’Addio, G.; Ferrario, M.; Porta, A.; Sassi, R.; Signorini, M.G.; Rovere, M.T.L. Clinical correlates of non-linear indices of heart rate variability in chronic heart failure patients. Biomed. Tech. 2006, 51, 220–223. [Google Scholar] [CrossRef] [PubMed]
  5. Ding, H.; Crozier, S.; Wilson, S. A New Heart Rate Variability Analysis Method by Means of Quantifying the Variation of Nonlinear Dynamic Patterns. IEEE Trans. Biomed. Eng. 2007, 54, 1590–1597. [Google Scholar] [CrossRef] [PubMed]
  6. Kamen, P.W.; Krum, H.; Tonkin, A.M. Poincaré Plot of Heart Rate Variability Allows Quantitative Display of Parasympathetic Nervous Activity in Humans. Clin. Sci. 1996, 91, 201–208. [Google Scholar] [CrossRef] [PubMed] [Green Version]
  7. Dudchenko, A.; Ganzinger, M.; Kopanitsa, G. Machine Learning Algorithms in Cardiology Domain: A Systematic Review. Open Bioinform. J. 2020, 13, 25–40. [Google Scholar] [CrossRef]
  8. Dey, D.; Slomka, P.J.; Leeson, P.; Comaniciu, D.; Shrestha, S.; Sengupta, P.P.; Marwick, T.H. Artificial Intelligence in Cardiovascular Imaging: JACC State-of-the-Art Review. J. Am. Coll. Cardiol. 2019, 73, 1317–1335. [Google Scholar] [CrossRef]
  9. Ricciardi, C.; Improta, G.; Amato, F.; Cesarelli, G.; Romano, M. Classifying the type of delivery from cardiotocographic signals: A machine learning approach. Comput. Methods Programs Biomed. 2020, 196, 105712. [Google Scholar] [CrossRef]
  10. Kannan, E.; Ravikumar, S.; Anitha, A.; Kumar, S.; Vijayasarathy, M. Analyzing uncertainty in cardiotocogram data for the prediction of fetal risks based on machine learning techniques using rough set. J. Ambient Intell. Humaniz. Comput. 2021, 1–13. [Google Scholar] [CrossRef]
  11. Alsaggaf, W.; Cömert, Z.; Nour, M.; Polat, K.; Brdesee, H.; Toğaçar, M. Predicting fetal hypoxia using common spatial pattern and machine learning from cardiotocography signals. Appl. Acoust. 2020, 167, 107429. [Google Scholar] [CrossRef]
  12. Recenti, M.; Ricciardi, C.; Gìslason, M.; Edmunds, K.; Carraro, U.; Gargiulo, P. Machine Learning Algorithms Predict Body Mass Index Using Nonlinear Trimodal Regression Analysis from Computed Tomography Scans. In Proceedings of the XV Mediterranean Conference on Medical and Biological Engineering and Computing—MEDICON 2019, Coimbra, Portugal, 26–28 September 2019; Henriques, J., Neves, N., de Carvalho, P., Eds.; Springer International Publishing: Cham, Switzerland, 2020; pp. 839–846. [Google Scholar]
  13. Recenti, M.; Ricciardi, C.; Edmunds, K.; Gislason, M.K.; Gargiulo, P. Machine learning predictive system based upon radiodensitometric distributions from mid-thigh CT images. Eur. J. Transl. Myol. 2020, 30, 8892. [Google Scholar] [CrossRef] [Green Version]
  14. Ricciardi, C.; Cuocolo, R.; Cesarelli, G.; Ugga, L.; Improta, G.; Solari, D.; Romeo, V.; Guadagno, E.; Cvallo, L.M.; Cesarelli, M. Distinguishing Functional from Non-functional Pituitary Macroadenomas with a Machine Learning Analysis. In Proceedings of the XV Mediterranean Conference on Medical and Biological Engineering and Computing—MEDICON 2019, Coimbra, Portugal, 26–28 September 2019; Henriques, J., Neves, N., de Carvalho, P., Eds.; Springer International Publishing: Cham, Switzerland, 2020; pp. 1822–1829. [Google Scholar]
  15. Park, J.E.; Kim, H.S.; Kim, D.; Park, S.Y.; Kim, J.Y.; Cho, S.J.; Kim, J.H. A systematic review reporting quality of radiomics research in neuro-oncology: Toward clinical utility and quality improvement using high-dimensional imaging features. BMC Cancer 2020, 20, 29. [Google Scholar] [CrossRef] [PubMed]
  16. Tseng, H.-H.; Wei, L.; Cui, S.; Luo, Y.; Ten Haken, R.K.; El Naqa, I. Machine Learning and Imaging Informatics in Oncology. Oncology 2020, 98, 344–362. [Google Scholar] [CrossRef] [PubMed]
  17. Scrutinio, D.; Ricciardi, C.; Donisi, L.; Losavio, E.; Battista, P.; Guida, P.; Cesarelli, M.; Pagano, G.; D’Addio, G. Machine learning to predict mortality after rehabilitation among patients with severe stroke. Sci. Rep. 2020, 10, 20127. [Google Scholar] [CrossRef]
  18. Le Berre, C.; Sandborn, W.J.; Aridhi, S.; Devignes, M.-D.; Fournier, L.; Smaïl-Tabbone, M.; Danese, S.; Peyrin-Biroulet, L. Application of Artificial Intelligence to Gastroenterology and Hepatology. Gastroenterology 2020, 158, 76–94. [Google Scholar] [CrossRef] [PubMed] [Green Version]
  19. Sirsat, M.S.; Fermé, E.; Câmara, J. Machine Learning for Brain Stroke: A Review. J. Stroke Cerebrovasc. Dis. 2020, 29, 105162. [Google Scholar] [CrossRef] [PubMed]
  20. Woo, M.A.; Stevenson, W.G.; Moser, D.K.; Trelease, R.B.; Harper, R.M. Patterns of beat-to-beat heart rate variability in advanced heart failure. Am. Heart J. 1992, 123, 704–710. [Google Scholar] [CrossRef]
  21. Brouwer, J.; van Veldhuisen, D.J.; Man In ’t Veld, A.J.; Haaksma, J.; Dijk, W.A.; Visser, K.R.; Boomsma, F.; Dunselman, P.H.J.M.; Lie, K.I. Prognostic value of heart rate variability during long-term follow-up in patients with mild to moderate heart failure. J. Am. Coll. Cardiol. 1996, 28, 1183–1189. [Google Scholar] [CrossRef] [Green Version]
  22. Marciano, F.; Migaux, M.L.; Acanfora, D.; Furgi, G.; Rengo, F. Quantification of Poincare’ maps for the evaluation of heart rate variability. In Proceedings of the Computers in Cardiology 1994, Bethesda, MD, USA, 25–28 September 1994; IEEE: Piscataway, NJ, USA, 1994; pp. 577–580. [Google Scholar]
  23. D’Addio, G.; Acanfora, D.; Pinna, G.; Maestri, R.; Furgi, G.; Picone, C.; Rengo, F. Reproducibility of short- and long-term Poincare plot parameters compared with frequency-domain HRV indexes in congestive heart failure. In Proceedings of the Computers in Cardiology 1998, Cleveland, OH, USA, 13–16 September 1998; IEEE: Piscataway, NJ, USA; pp. 381–384. [Google Scholar]
  24. Isler, Y.; Narin, A.; Ozer, M.; Perc, M. Multi-stage classification of congestive heart failure based on short-term heart rate variability. Chaos Solitons Fractals 2019, 118, 145–151. [Google Scholar] [CrossRef]
  25. Isler, Y.; Narin, A.; Ozer, M. Comparison of the Effects of Cross-validation Methods on Determining Performances of Classifiers Used in Diagnosing Congestive Heart Failure. Meas. Sci. Rev. 2015, 15, 196–201. [Google Scholar] [CrossRef] [Green Version]
  26. Gong, X.; Long, B.; Wang, Z.; Zhang, H.; Nandi, A.K. Faster Detection of Abnormal Electrocardiogram (ECG) Signals Using Fewer Features of Heart Rate Variability (HRV). J. Comput. Sci. Syst. Biol. 2018, 12, 19–27. [Google Scholar] [CrossRef]
  27. Zhao, L.; Liu, C.; Wei, S.; Liu, C.; Li, J. Enhancing Detection Accuracy for Clinical Heart Failure Utilizing Pulse Transit Time Variability and Machine Learning. IEEE Access 2019, 7, 17716–17724. [Google Scholar] [CrossRef]
  28. Sassi, R. Analysis of Heart Rate Variability Complexity through Fractal and Multivariate Approaches. Ph.D. Dissertation, Politecnico di Milano, Milan, Italy, 31 October 2000. [Google Scholar]
  29. Romano, M.; Bifulco, P.; Ruffo, M.; Improta, G.; Clemente, F.; Cesarelli, M. Software for computerised analysis of cardiotocographic traces. Comput. Methods Programs Biomed. 2016, 124, 121–137. [Google Scholar] [CrossRef] [PubMed]
  30. D’Addio, G.; Pinna, G.D.; La Rovere, M.T.; Maestri, R.; Furgi, G.; Rengo, F. Prognostic value of Poincare/spl acute/plot indexes in chronic heart failure patients. In Proceedings of the Computers in Cardiology 2001, Rotterdam, The Netherlands, 23–26 September 2001; IEEE: Piscataway, NJ, USA; pp. 57–60. [Google Scholar]
  31. D’Addio, G.; Pinna, G.D.; Maestri, R.; Corbi, G.; Ferrara, N.; Rengo, F. Quantitative Poincare plots analysis contains relevant information related to heart rate variability dynamics of normal and pathological subjects. In Proceedings of the Computers in Cardiology 2004, Chicago, IL, USA, 19–22 September 2004; IEEE: Piscataway, NJ, USA; pp. 457–460. [Google Scholar]
  32. Sheng, P.; Chen, L.; Tian, J. Learning-based road crack detection using gradient boost decision tree. In Proceedings of the 2018 13th IEEE Conference on Industrial Electronics and Applications (ICIEA), Wuhan, China, 31 May–2 June 2018; IEEE: Piscataway, NJ, USA; pp. 1228–1232. [Google Scholar]
  33. Freund, Y.; Schapire, R.E. A Decision-Theoretic Generalization of On-Line Learning and an Application to Boosting. J. Comput. Syst. Sci. 1997, 55, 119–139. [Google Scholar] [CrossRef] [Green Version]
  34. Weinberger, K.Q.; Saul, L.K. Distance Metric Learning for Large Margin Nearest Neighbor Classification. J. Mach. Learn. Res. 2009, 10, 207–244. [Google Scholar]
  35. Sun, S.; Huang, R. An adaptive k-nearest neighbor algorithm. In Proceedings of the 2010 Seventh International Conference on Fuzzy Systems and Knowledge Discovery, Yantai, China, 10–12 August 2010; IEEE: Piscataway, NJ, USA; pp. 91–94. [Google Scholar]
  36. Al-Aidaroos, K.M.; Bakar, A.A.; Othman, Z. Naïve bayes variants in classification learning. In Proceedings of the 2010 International Conference on Information Retrieval Knowledge Management (CAMP), Shah Alam, Malaysia, 17–18 March 2010; IEEE: Piscataway, NJ, USA; pp. 276–281. [Google Scholar]
  37. Chawla, N.V.; Bowyer, K.W.; Hall, L.O.; Kegelmeyer, W.P. SMOTE: Synthetic Minority Over-sampling Technique. J. Artif. Intell. Res. 2002, 16, 321–357. [Google Scholar] [CrossRef]
  38. Ishaq, A.; Sadiq, S.; Umer, M.; Ullah, S.; Mirjalili, S.; Rupapara, V.; Nappi, M. Improving the Prediction of Heart Failure Patients’ Survival Using SMOTE and Effective Data Mining Techniques. IEEE Access 2021, 9, 39707–39716. [Google Scholar] [CrossRef]
  39. Kohavi, R. A Study of Cross-Validation and Bootstrap for Accuracy Estimation and Model Selection. In Proceedings of the Fourteenth International Joint Conference on Artificial Intelligence, Montreal, QC, Canada, 20–25 August 1995; Morgan Kaufmann Publishers: San Francisco, CA, USA; pp. 1137–1143. [Google Scholar]
  40. Zinati, Z.; Zamansani, F.; KayvanJoo, A.H.; Ebrahimi, M.; Ebrahimi, M.; Ebrahimie, E.; Dehcheshmeh, M.M. New layers in understanding and predicting α-linolenic acid content in plants using amino acid characteristics of omega-3 fatty acid desaturase. Comput. Biol. Med. 2014, 54, 14–23. [Google Scholar] [CrossRef]
  41. Ebrahimie, E.; Ebrahimi, F.; Ebrahimi, M.; Tomlinson, S.; Petrovski, K.R. Hierarchical pattern recognition in milking parameters predicts mastitis prevalence. Comput. Electron. Agric. 2018, 147, 6–11. [Google Scholar] [CrossRef]
  42. Ebrahimie, E.; Ebrahimi, F.; Ebrahimi, M.; Tomlinson, S.; Petrovski, K.R. A large-scale study of indicators of sub-clinical mastitis in dairy cattle by attribute weighting analysis of milk composition features: Highlighting the predictive power of lactose and electrical conductivity. J. Dairy Res. 2018, 85, 193–200. [Google Scholar] [CrossRef]
  43. Ebrahimi, M.; Mohammadi-Dehcheshmeh, M.; Ebrahimie, E.; Petrovski, K.R. Comprehensive analysis of machine learning models for prediction of sub-clinical mastitis: Deep Learning and Gradient-Boosted Trees outperform other models. Comput. Biol. Med. 2019, 114, 103456. [Google Scholar] [CrossRef]
  44. Tougui, I.; Jilbab, A.; El Mhamdi, J. Heart disease classification using data mining tools and machine learning techniques. Health Technol. 2020, 10, 1137–1144. [Google Scholar] [CrossRef]
  45. Berthold, M.R.; Cebron, N.; Dill, F.; Gabriel, T.R.; Kötter, T.; Meinl, T.; Ohl, P.; Thiel, K.; Wiswedel, B. KNIME—The Konstanz information miner: Version 2.0 and beyond. SIGKDD Explor. Newsl. 2009, 11, 26–31. [Google Scholar] [CrossRef] [Green Version]
  46. Donisi, L.; Coccia, A.; Amitrano, F.; Mercogliano, L.; Cesarelli, G.; D’Addio, G. Backpack Influence on Kinematic Parameters related to Timed Up and Go (TUG) Test in School Children. In Proceedings of the 2020 IEEE International Symposium on Medical Measurements and Applications (MeMeA), Bari, Italy, 15 June 2020; IEEE: Piscataway, NJ, USA; pp. 1–5. [Google Scholar]
  47. Preetha, S.; Chandan, N.; Darshan, N.K.; Gowrav, P.B. Diabetes Disease Prediction Using Machine Learning. Int. J. Mod. Trends Eng. Res. 2020, 6, 37–43. [Google Scholar] [CrossRef]
  48. Goh, K.H.; Wang, L.; Yeow, A.Y.K.; Poh, H.; Li, K.; Yeow, J.J.L.; Tan, G.Y.H. Artificial intelligence in sepsis early prediction and diagnosis using unstructured data in healthcare. Nat. Commun. 2021, 12, 711. [Google Scholar] [CrossRef]
  49. Guleria, P.; Sood, M. Intelligent Learning. In Machine Learning with Health Care Perspective: Machine Learning and Healthcare, 1st ed.; Jain, V., Chatterjee, J.M., Eds.; Springer International Publishing: Cham, Switzerland, 2020; pp. 39–55. ISBN 978-3-030-40850-3. [Google Scholar]
  50. An, J.Y.; Seo, H.; Kim, Y.-G.; Lee, K.E.; Kim, S.; Kong, H.-J. Codeless Deep Learning of COVID-19 Chest X-Ray Image Dataset with KNIME Analytics Platform. Healthc. Inform. Res. 2021, 27, 82–91. [Google Scholar] [CrossRef] [PubMed]
  51. Tuerkova, A.; Zdrazil, B. A ligand-based computational drug repurposing pipeline using KNIME and Programmatic Data Access: Case studies for rare diseases and COVID-19. J. Cheminform. 2020, 12, 71. [Google Scholar] [CrossRef] [PubMed]
  52. van Smeden, M.; Moons, K.G.; de Groot, J.A.; Collins, G.S.; Altman, D.G.; Eijkemans, M.J.; Reitsma, J.B. Sample size for binary logistic prediction models: Beyond events per variable criteria. Stat. Methods Med. Res. 2019, 28, 2455–2474. [Google Scholar] [CrossRef] [Green Version]
  53. Karimi Moridani, M.; Setarehdan, S.K.; Motie Nasrabadi, A.; Hajinasrollah, E. Non-linear feature extraction from HRV signal for mortality prediction of ICU cardiovascular patient. J. Med. Eng. Technol. 2016, 40, 87–98. [Google Scholar] [CrossRef]
  54. Rezaei, S.; Moharreri, S.; Abdollahpur, M.; Parvaneh, S. Heart Arrhythmia Classification Using Extracted Features in Poincare Plot of RR Intervals. In Proceedings of the Computers in Cardiology 2017, Rennes, France, 24–27 September 2017; IEEE: Piscataway, NJ, USA. [Google Scholar]
  55. Agliari, E.; Barra, A.; Barra, O.A.; Fachechi, A.; Vento, L.F.; Moretti, L. Detecting cardiac pathologies via machine learning on heart-rate variability time series and related markers. Sci. Rep. 2020, 10, 8845. [Google Scholar] [CrossRef]
  56. Devi, R.; Tyagi, H.K.; Kumar, D. A novel multi-class approach for early-stage prediction of sudden cardiac death. Biocybern. Biomed. Eng. 2019, 39, 586–598. [Google Scholar] [CrossRef]
  57. Leite, A.; Silva, M.E.; Rocha, A.P. Classification of HRV using Long Short-Term Memory Networks. In Proceedings of the 2020 11th Conference of the European Study Group on Cardiovascular Oscillations (ESGCO), Pisa, Italy, 15 July 2020; Pernice, R., Ed.; IEEE: Piscataway, NJ, USA, 2020. [Google Scholar]
  58. D’Addio, G.; Donisi, L.; Cesarelli, G.; Amitrano, F.; Coccia, A.; La Rovere, M.T.; Ricciardi, C. Extracting Features from Poincaré Plots to Distinguish Congestive Heart Failure Patients According to NYHA Classes. Bioengineering 2021, 8, 138. [Google Scholar] [CrossRef] [PubMed]
  59. Ricciardi, C.; Donisi, L.; Cesarelli, G.; Pagano, G.; Coccia, A.; D’Addio, G. Feasibility of Machine Learning applied to Poincaré Plot Analysis on Patients with CHF. In Proceedings of the 2020 11th Conference of the European Study Group on Cardiovascular Oscillations (ESGCO), Pisa, Italy, 15 July 2020; Pernice, R., Ed.; IEEE: Piscataway, NJ, USA, 2020. [Google Scholar]
  60. da Silva Pinho, N.; de Azevedo Gomes, D.; dos Santos, A.D.F. Classifying cardiac rhythms by means of digital signal processing and machine learning. J. Commun. Inf. Syst. 2020, 35, 25–33. [Google Scholar] [CrossRef]
Figure 1. Study workflow. ECG recordings are processed to achieve Poincaré maps from which specific features are extracted. Finally, ML strategies are fed (using these features) to demonstrate that the selected algorithms are capable to suitably classify the group to which each Holter record belongs to. Attributions: 2022 electrocardiogram from Wikimedia and ecg machine by ProSymbols from the Noun Project.
Electronics 11 00448 g001
Figure 2. Bar plot representing feature importance. Abbreviations. A: area. Dp: mean peaks distance from the bisecting line. L: length. Np: peaks number. P: percentage of the length which corresponds to the maximum plot wideness. (ρx, ρy, ρz): length of the three radii of inertia of the semi-ellipsoidal three-dimensional cloud of points; V: volume. W: plot wideness.
Electronics 11 00448 g002
Table 1. Univariate statistical analysis performed through one-way Kruskal Wallis plus post-hoc for all the variables.
ParCHMNTp-Value
L540.0 ± 113.2801.0 ± 138.2640.0 ± 111.6803.0 ± 107.7360.0 ± 95.8***
HVE143.6 ± 66.2232.6 ± 70.2176.4 ± 42.2227.9 ± 73.8118.4 ± 39.7***
P55.3 ± 12.060.3 ± 13.361.9 ± 14.761.5 ± 5.750.1 ± 16.80.296
A #8.0 ± 4.417.4 ± 6.410.5 ± 2.916.9 ± 6.44.4 ± 1.5***
Np15.7 ± 11.724.9 ± 7.636.8 ± 18.544.3 ± 20.66.1 ± 3.9***
Dp3.1 ± 2.01.1 ± 1.15.2 ± 2.65.1 ± 1.50.6 ± 1.3***
V ##1.1 ± 0.21.1 ± 0.11.0 ± 0.21.0 ± 0.11.2 ± 0.10.118
ρx49.9 ± 9.041.1 ± 3.441.7 ± 10.639.1 ± 4.675.5 ± 22.6***
ρy100.4 ± 13.5139.9 ± 36.7110.0 ± 12.5136.8 ± 19.8106.7 ± 17.8***
ρz88.1 ± 19.2136.6 ± 38.6103.4 ± 17.8134.6 ± 20.871.2 ± 27.2***
Legend: #: Values must be multiplied to 103; ##: values must be multiplied to 106; *** = significance at “<0.001”.
Table 2. Post-hoc for all the significant variables resulting from the Kruskal Wallis test.
ParClassesp-Value
LT-M0.034
T-H<0.001
T-N<0.001
C-H0.031
C-N0.018
HVET-N0.009
T-H0.002
C-H0.039
AT-N<0.001
T-H<0.001
C-N0.034
C-H0.022
NpT-M<0.001
T-N<0.001
C-N0.020
DpT-M0.001
T-N<0.001
I-M0.012
H-N0.006
ρxT-M<0.001
T-N<0.001
T-H0.001
ρyT-N0.021
C-H0.010
C-N0.001
ρzT-H0.002
T-N<0.001
C-H0.021
C-N0.002
Excluding P and V, the other 8 variables demonstrated statistically significant in distinguishing the 5 categories.
Table 3. Confusion matrix of the multinomial logistic regression model computed on the as-is dataset.
ObservedPredictedCorrectness Percentage
CHMNT
C7020170,0%
H010000100.0%
M3052050.0%
N1018080.0%
T2000880.0%
Table 4. Evaluation metrics per each algorithm.
AlgorithmsAccuracy [%]Sensitivity [%]Specificity [%]
GB85.0100.097.5
ADA-B91.090.097.5
kNN92.095.0100.0
NB76.065.093.8
Table 5. Confusion matrix for the algorithm with the highest accuracy, kNN.
Real/PredictedNHMCT
N190010
H019100
M011621
C001181
T000020
Table 6. Evaluation metrics, using the normal class as reference, per each algorithm after performing a feature selection method.
AlgorithmsAccuracy [%]Sensitivity [%]Specificity [%]
GB90.0100.0100.0
ADA-B93.3100.095.8
kNN96.7100.0100.0
NB86.7100.091.7
Publisher’s Note: MDPI stays neutral with regard to jurisdictional claims in published maps and institutional affiliations.

