Article

Diagnosis and Fault Detection of Rotor Bars in Squirrel Cage Induction Motors Using Combined Park’s Vector and Extended Park’s Vector Approaches

by
Mustapha Messaoudi
1,
Aymen Flah
1,
Abdullah Alhumaidi Alotaibi
2,
Ahmed Althobaiti
3,*,
Lassaad Sbita
1 and
Claude Ziad El-Bayeh
4
1
Processes, Energy, Environment and Electrical Systems, National Engineering School of Gabes, University of Gabes, Gabes 6072, Tunisia
2
Department of Science and Technology, College of Ranyah, Taif University, P.O. Box 11099, Taif 21944, Saudi Arabia
3
Department of Electrical Engineering, Taif University, P.O. Box 11099, Taif 21944, Saudi Arabia
4
Department of Electrical Engineering, Bayeh Institute, 55 Kfar Saleh-Hay El Arbe Street, Amchit, Mount Lebanon, Lebanon
*
Author to whom correspondence should be addressed.
Electronics 2022, 11(3), 380; https://doi.org/10.3390/electronics11030380
Submission received: 18 December 2021 / Revised: 17 January 2022 / Accepted: 25 January 2022 / Published: 27 January 2022

Abstract

:
The induction motor (IM) is considered to be one of the most important types of motors used in industries. A sudden failure in this machine can lead to unwanted downtime, with consequences in costs, product quality, and safety. Over the last decade, several methods and techniques have been proposed to diagnose and detect faults in induction machines. In this paper, we present the development of a new algorithm based on the combination of both the Park’s vector approach (PVA) and the extended Park’s vector approach (EPVA) for broken rotor bars (BRBs) fault detection and identification. This fault can be detected using the PVA by monitoring the thickness and orientation of the park’s vector pattern and using EPVA by identifying specific spectral components related to the fault. For ability evaluation of our suggested algorithm, simulations and experiments are conducted and presented. The obtained results demonstrate that the proposed algorithm is accurate and effective and can be extensively used in IM fault detections and identifications.

1. Introduction

1.1. Motivation and Incitement

Squirrel cage induction motors (SCIM) are types of electrical machines that are widely considered in modern industries [1,2,3,4,5], with power ranges from a few kilo-watts to numerous mega-watts. This is due to its reliability, hardiness, low cost, quasi-absence of maintenance, ease of starting, high efficiency, etc. [6,7,8,9,10]. During operation, these motors are subjected to many undesirable stresses and pressures [11,12,13,14], including electrical and mechanical [15,16,17,18,19], thermal, and environmental stresses, which may speed-up motor failure and reduce its lifetime sooner than expected [20,21,22,23]. The faults that can affect these machines are numerous. The most common are shortening or opening of one or more phase windings of the stator, breakage of end rings or rotor bars, dynamic or static eccentricities, and bearing defects [4,10,13]. An unexpected failure can lead to unwanted downtime and heavy financial losses to the industries regarding maintenance cost and profits [1].

1.2. Literature Review

Regular inspections and fault detections of electrical machines at early stages are considered essential in order to keep away from partial or total breakdown [24,25,26,27,28]. In the last 20 years, fault diagnosis and condition monitoring of electrical machines has gained substantial consideration. In the literature, several fault detection and localization approaches have been suggested. In [8,12], Messaoudi et al. applied the classical motor current signature analysis (MCSA) method to multiple fault diagnoses of IM. They improved the efficiency of the MCSA even if the motor operates under abnormal conditions [8,12]. In [7], the authors applied the fast Fourier transform (FFT) method to analyze the phase of the stator current in order to detect one BRB fault in IM operating under a low load. The efficiency of this method is degraded for the detection of partial breakage of the rotor bar. To enhance the diagnosis, the authors employed the Hilbert transform (HT). Pezzani et al. used the active and reactive current Park’s vector instead of the conventional Park’s vector to detect BRBs, even when there was a load oscillation with a frequency close to twice the slip frequency [11]. Casimir et al. utilized the pattern recognition methods to identify the induction motors’ faults. Then, they selected the most relevant features by applying the sequential backward algorithm [6]. In [5], an analytic signal concept method was used with the FFT to estimate the instantaneous angular speed (IAS). They demonstrated that the estimated IAS outperforms conventional vibration in the detection of rotor bar defects and shaft misalignment. Serrano et al. used and compared two artificial neural network methods for stator faults detection in IM, the support vector machine and back-propagation algorithm. By using the MCSA and the spectral Park’s vector, training patterns were obtained [9]. Pires et al. used the spectral analysis of the IM square current for BRB and rotor eccentricity faults diagnosis. They deduced from the result obtained that this method gives more information about the rotor faults than the classical MCSA approach [15]. In [24], the authors used both methods, the FFT and the Grey relational analyses, to enhance diagnosis results. They proved that this combination provides a quick and easy method for the detection of BRBs in IMs. Abd-el-Malek et al. [19] used the HT to extract the BRB fault signature from the stator current envelope. Then, they developed a formula based on the statistical analysis to determine the exact location of the fault in the IM rotor. In [22], the authors employed the discrete wavelet transform (DWT) method to analyze different electrical and mechanical control quantities. They deduced that the calculation of the stored energy in each decomposition level gives information about the BRBs’ fault, particularly for the active power energy. In [26], two monitoring systems were compared, which are type-1 and type-2 fuzzy monitoring systems, in which the robustness and performance were improved for the type-2 fuzzy monitoring system compared to type-1. In [27], the authors sensed vibration data from multiple MEMS accelerometers and utilized the Q method based on the neural network model forbearing and BRB fault detection in IM. Using the collected data, they developed an efficient method for multiple fault detection. Quiroz et al. utilized the random forests method for the rotor bars fault detection in LS-PMSM [23]. In their study, during the startup phase of the healthy and faulty motor, the transient current signal was collected, in which high correction rates of diagnosis were reached. In [17], after the application of elliptic and notch filters on the Park’s vector components, the higher harmonic index was monitored. The technique’s efficiency was proven independently from the induction motor rotor slot number. Glowacz used an acoustic-based fault diagnosis technique of the IM. Then, the nearest neighbor classifier, back-propagation neural network, and the modified classifier based on words coding were used for recognition [20]. In [21], the authors employed multiple signal classification techniques for IMs fault diagnosis. They deduced that the current signal square produces additional fault frequency components in the broken rotor bar and easily helps in diagnosing the half BRB fault at normal load conditions. Xie et al. developed a technique based on magnitudes of vibration signal spectrums for BRB detection in SCIM. The results have shown that broken-bar fault has a more direct impact on the electromagnetic force [25]. In [14], the authors analyzed two fault signatures: the Hilbert modulus current space vector (HMCSV) and the Hilbert phase current space vector (HPCSV) using the FFT. For all the studied faults, they concluded that the HPCSV spectrum is richer in harmonics than the HMCSV spectrum. Arredondo and his co-workers analyzed two types of signals: acoustic sound signals and vibration signals, to detect BRBs in IMs. They used the complete ensemble empirical mode decomposition to separate the signal into several intrinsic mode functions (IMF). After, they selected the most relevant IMFs to facilitate the BRBs’ fault detection [18]. In [28], the authors used the DWT and local binary pattern methods together to detect rotor and bearing faults of three-phase IMs. The support vector machine and the k-nearest neighbor algorithms are used to classify sounds. Both methods reached high classification accuracy. However, to the best of the authors’ knowledge, the combination of the Park’s vector approach (PVA) and extended Park’s vector approach (CPEPVA) have not been considered in any paper. Therefore, further studies should be carried out in order to show their advantages over other methods, which is the subject of this paper.

1.3. Contribution

This paper is focused on a new technique based on the combination of two methods: The Park’s vector approach and the extended Park’s vector approach (CPEPVA) for BRB fault detection and identification. These faults can be detected using the PVA by monitoring the orientation and the thickness of the Park’s vector pattern and using the EPVA, by the identification of specific spectral components related to the fault. This technique utilizes the advantages of both methods to spot and identify an existing or incipient rotor failure of the motor. It is proved that (CPEPVA) technique can be considered to be one of the most reliable monitoring systems for the IM. Unlike the majority of techniques, CPEPVA can provide information about rotor health without requiring access to the motor.

1.4. Organization of the Paper

The rest of the article is structured as follows: Section 2 enumerates the factors leading to rotor faults. Section 3 introduces the theoretical study and the principles of the Park’s vector and the extended Park’s approaches. The application of the CPEPVA for BRBs’ fault detection and the performance evaluation of the proposed method, including the obtained results, are introduced in Section 4. Section 5 discusses the obtained results. Finally, the conclusion and future works are presented in Section 6.

2. Reasons for BRB and End-Ring Breakage

Many factors can lead to the breakage of rotor bars or the cracking of end rings. The combination of these factors can accelerate the rotor damage. These factors are classified as shown in Table 1 [4]:

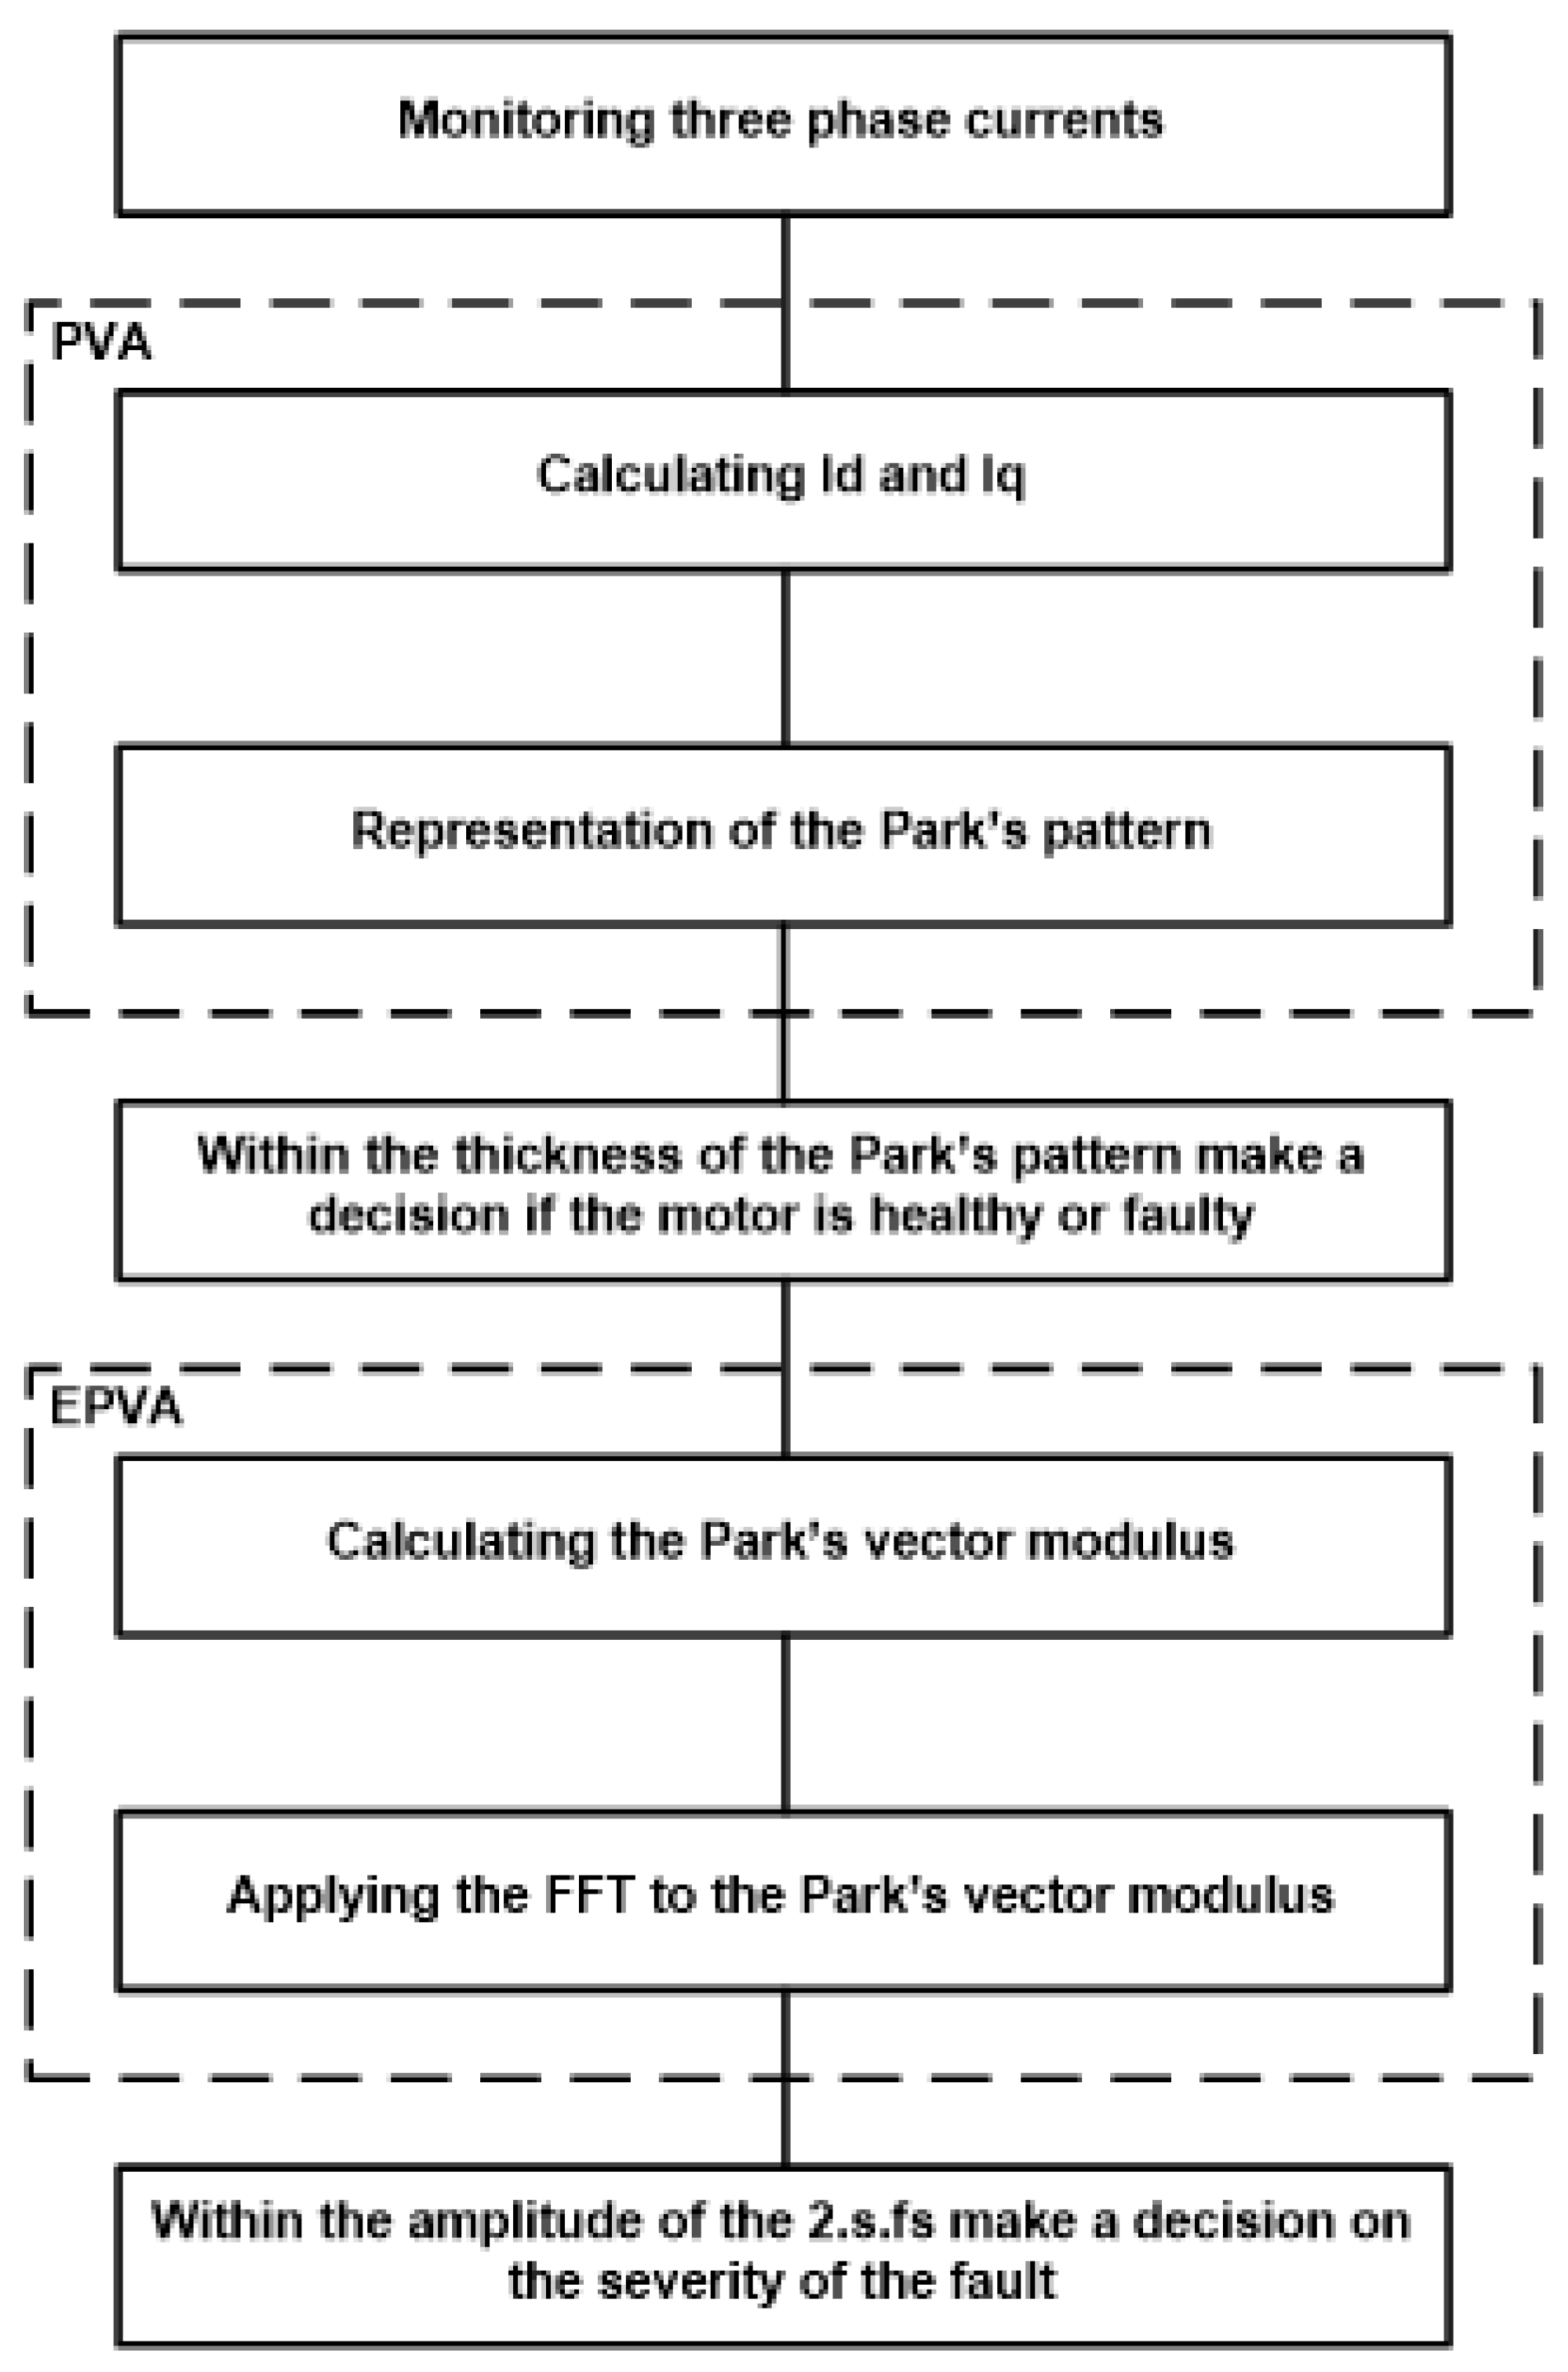
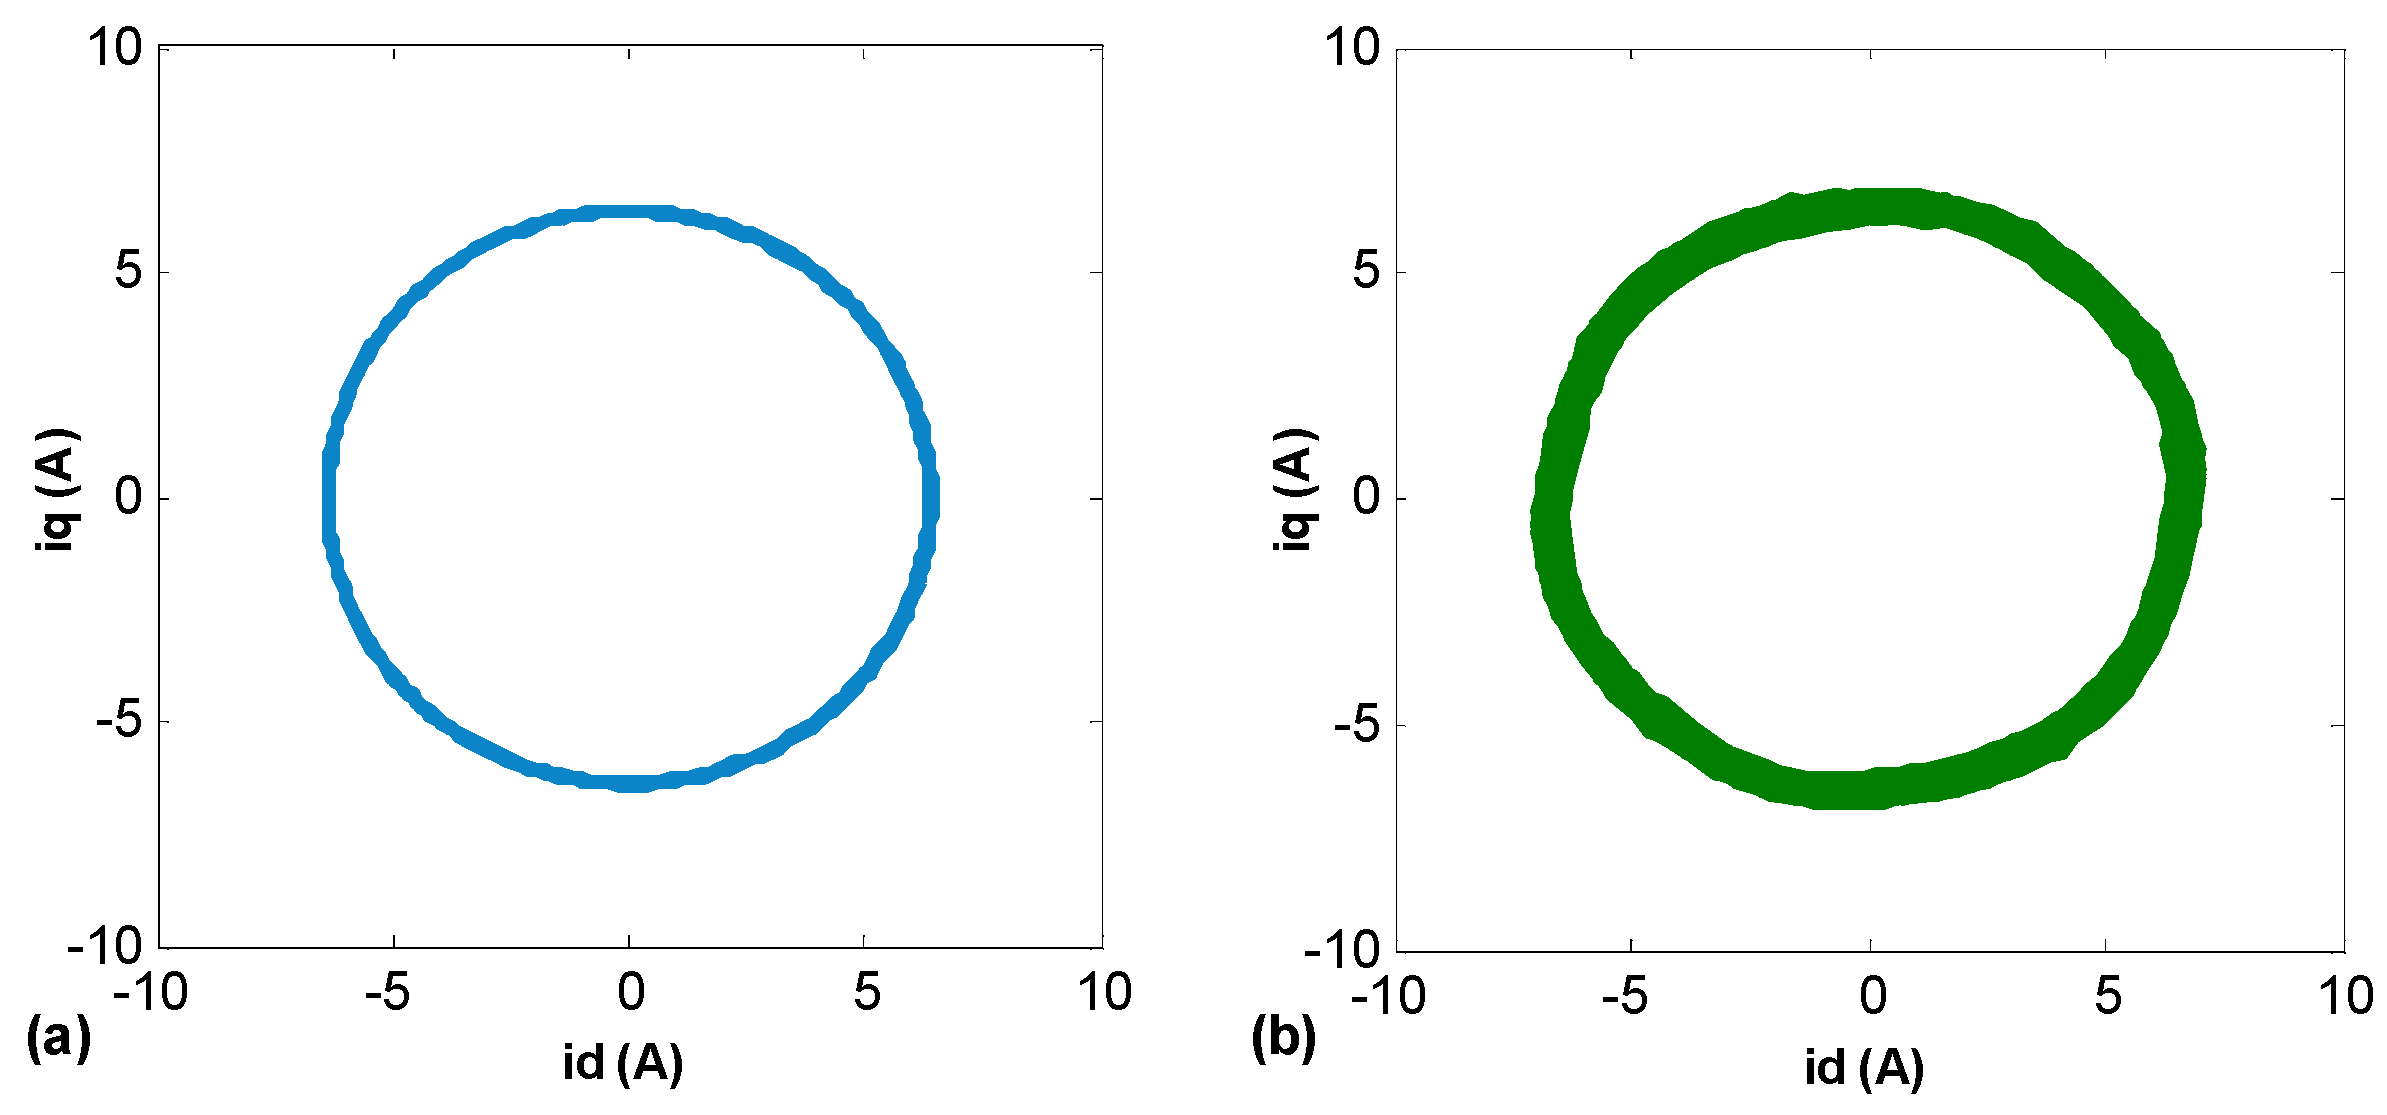
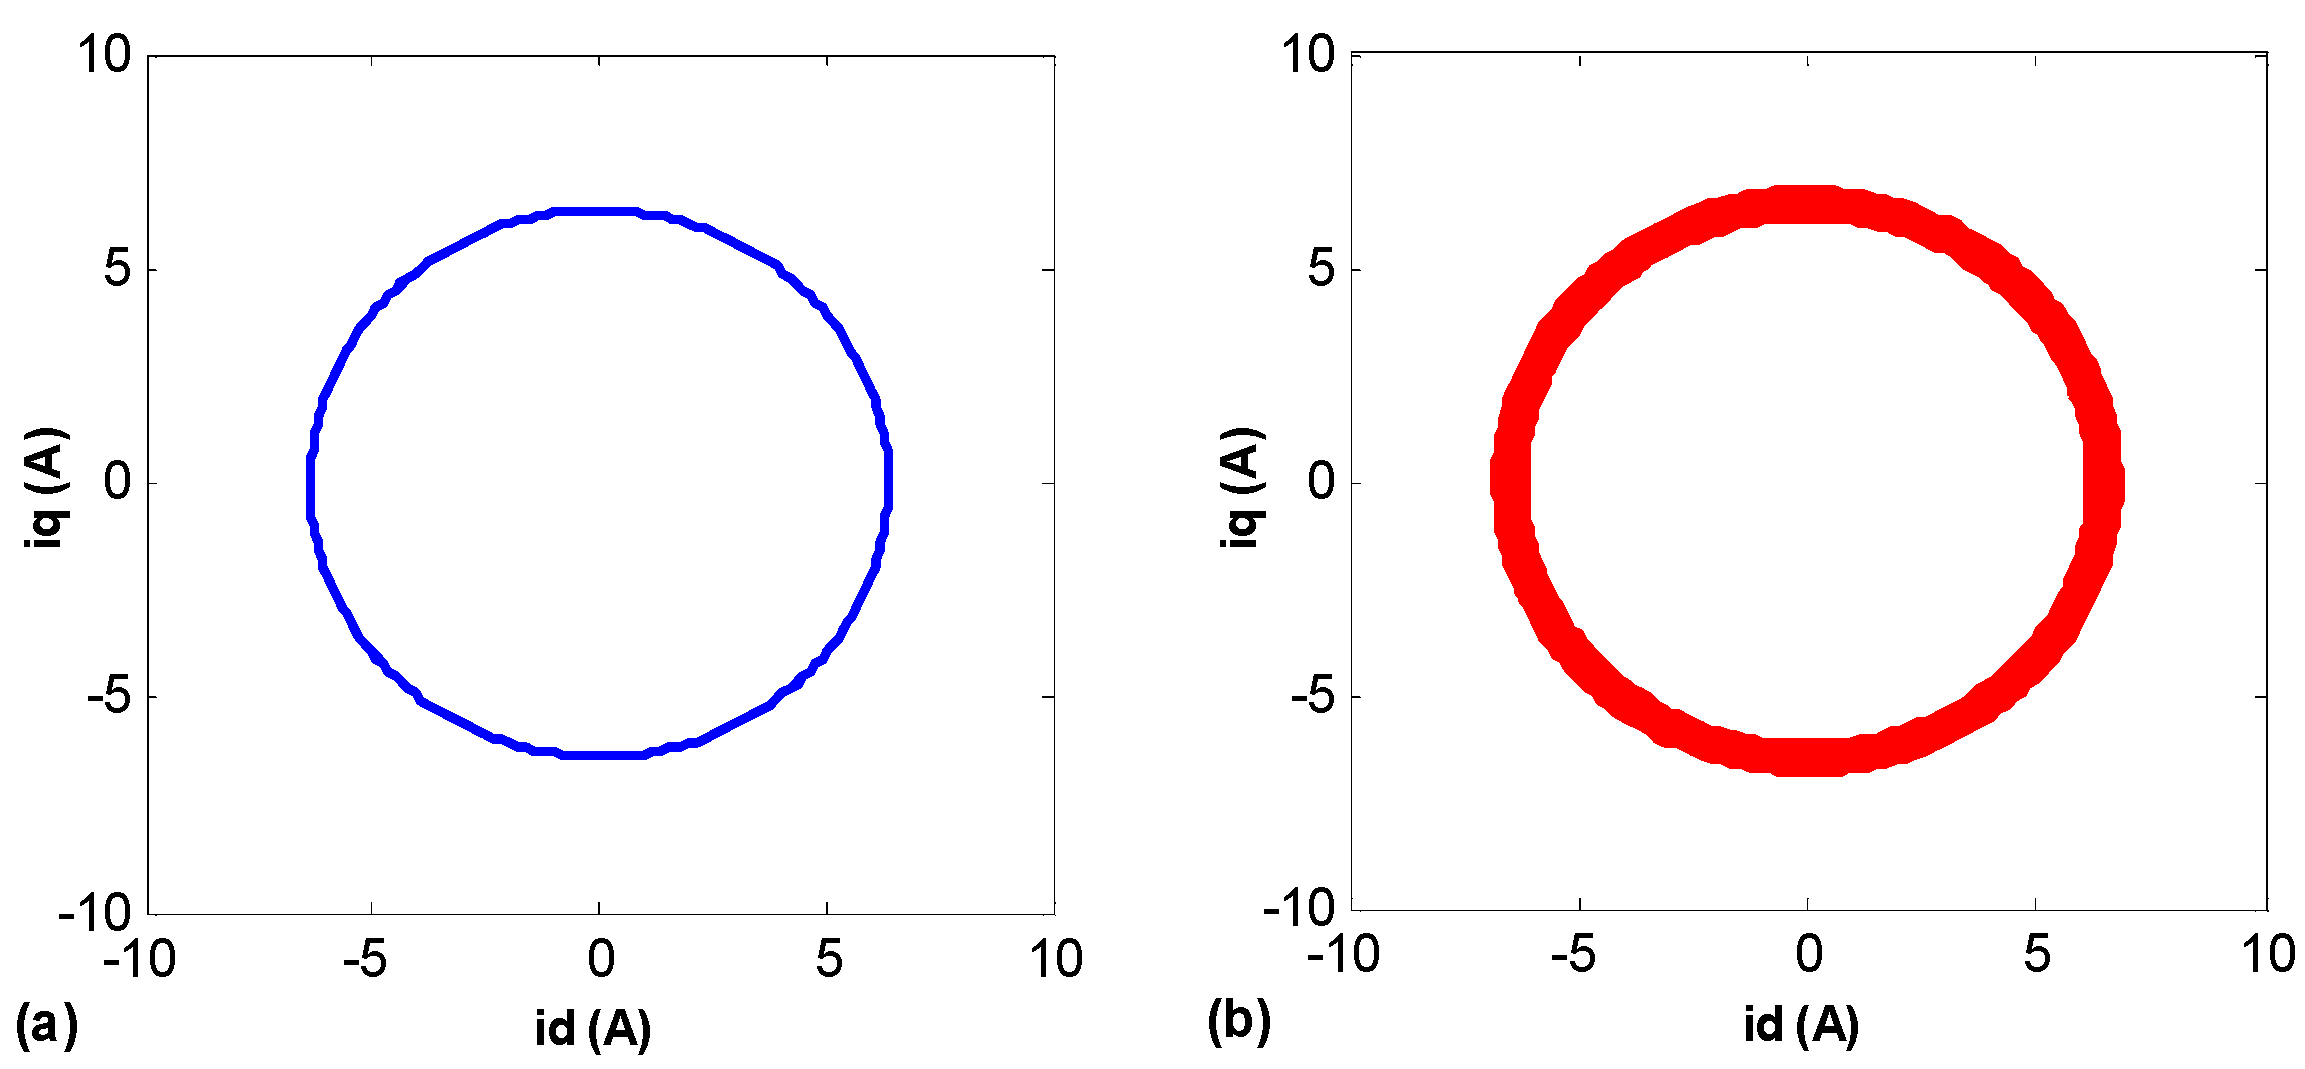
3. Principles of Park’s and Extended Park’s Vector Approaches

The sum of the stator currents in a balanced three-phase induction motor is zero. Therefore, the main current does not contain a homopolar component; only two currents are sufficient for processing, while the third can be obtained from the other two phases. To describe the three-phase induction motor phenomena using mathematical equations, a presentation in two-dimensions can be constructed considering the current Park’s vector [1,2,3]. The current Park’s vector components (ids, iqs) can be described as a function of the main phase variables (ias, ibs, ics) as follows:
i d s i q s = 2 3 1 6 1 6 0 1 2 1 2 i a s i b s i c s
The three phases of currents under normal and balanced conditions produce Park’s vectors, with the following components [13,14]:
i d s i q s = 6 / 2 cos ω s t sin ω s t I max
Under ideal conditions for a healthy motor, the Lissajous curve iqs = f (ids) has a circular shape centered at the origin and having a constant radius [1,16], as it is shown in Figure 1. This is a simple method that allows the detection of abnormal conditions by monitoring the deviations and the thickness of acquired patterns.
The BRBs fault will produce additional sideband components at frequencies of (1 − 2·s) fs and (1 + 2·s) fs in the motor supply current spectrum, where fs and s are the fundamental supply frequency and the rotor slip, respectively. Then, Equation (2) becomes invalid [3]. Equation (3) is as follows:
i a s t i b s t i c s t = cos ω s t θ f cos 1 2 · s ω s t θ l cos 1 + 2 · s ω s t θ u cos ω s t θ f 2 π 3 cos 1 2 · s ω s t θ l 2 π 3 cos 1 + 2 · s ω s t θ u 2 π 3 cos ω s t θ f + 2 π 3 cos 1 2 · s ω s t θ l + 2 π 3 cos 1 + 2 · s ω s t θ u + 2 π 3 i f t i l t i u t
The additional components at frequencies of (1 − 2·s) fs and (1 + 2·s) fs in the motor supply current will also be present in the two-motor current Park’s Vector components (ids, iqs), as shown in Equation (4):
i d s i q s = 3 2 cos ω s t θ f cos 1 2 · s ω s t θ l cos 1 2 · s ω s t θ l sin ω s t θ f sin 1 2 · s ω s t θ l sin 1 + 2 · s ω s t θ u i f i l i u
Using Equation (4), the square of the current Park’s vector modulus will be given by Equation (5).
i d s + j · i q s 2 = 3 2 i f 2 + i l 2 + i u 2 + 3 · i f · i l · cos 2 · s · ω s · t θ f + θ l + 3 · i f · i u · cos 2 · s · ω s · t + θ f θ u + 3 · i l · i u · cos 4 · s · ω s · t + θ l θ u
It can be clearly seen that the spectrum of the current Park’s vector modulus contains a DC level, produced essentially by the fundamental component of the motor supply current, plus two additional terms, at frequencies of 2·s·fs and 4·s·fs caused by the rotor fault. The extended Park’s vector approach is a variation of the Park’s vector approach. In this method, the spectrum of the Park’s currents’ modulus is used and analyzed to detect and localize a motor fault instead of using the Lissajous curve. Each fault creates spectral components at specific frequencies. In BRB fault, the sideband created by this fault is located at 2·s·fs frequency.

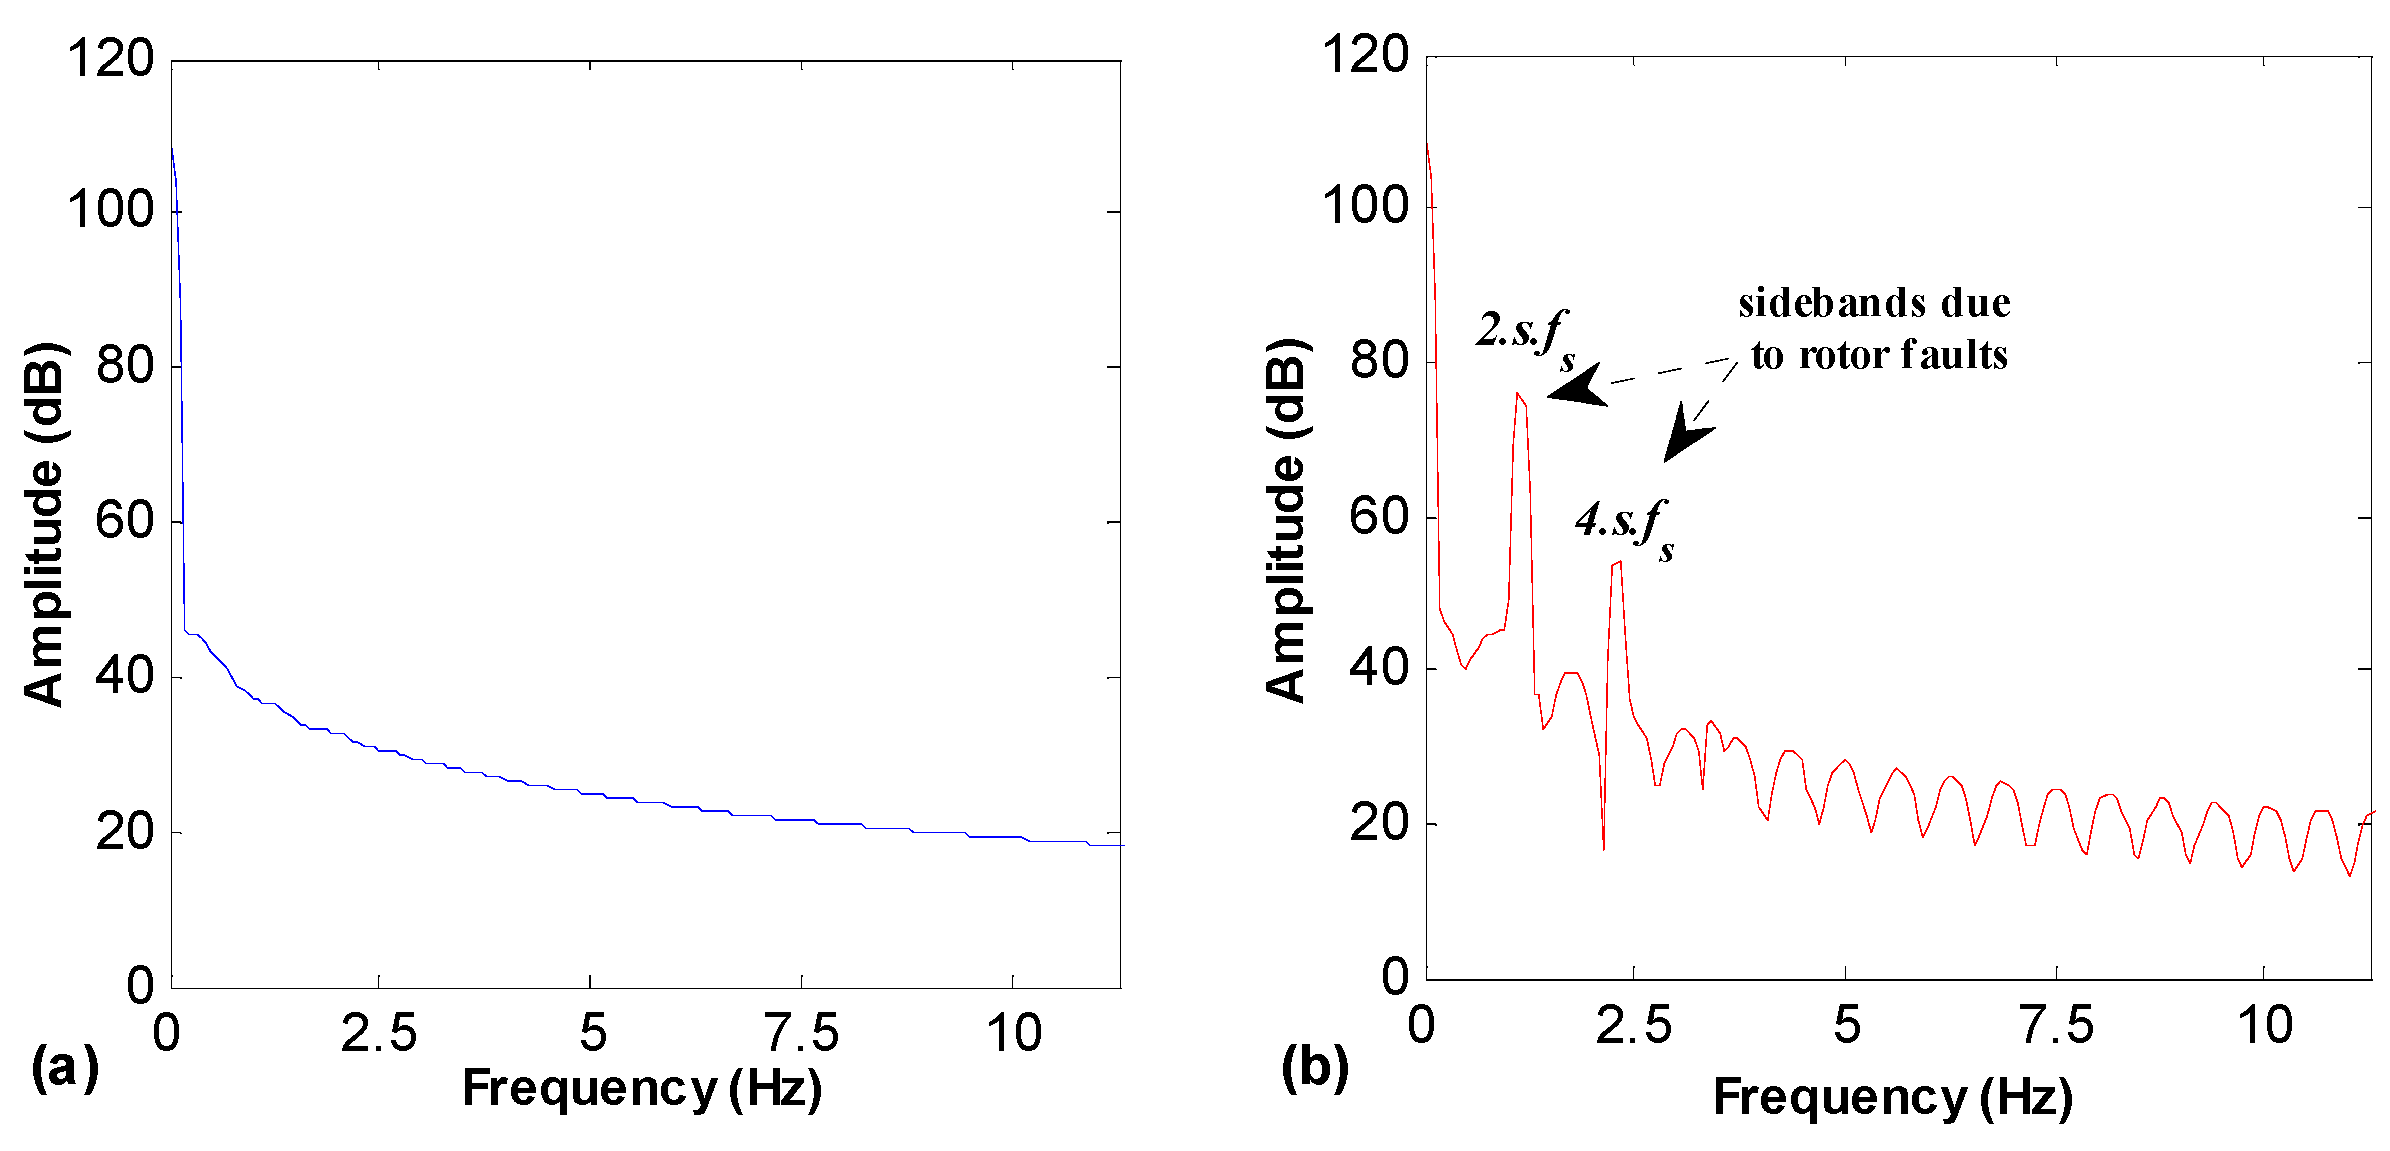
4. Application of the Combined Park’s and the Extended Park’s Vector Approaches for Fault Diagnosis

The purpose of this work is to develop a low-cost procedure to decide whether there is a rotor fault. Figure 2 shows the steps describing our method, starting by measuring the three-phase currents. This can be conducted in an easy and non-intrusive manner. Next, the Park’s vector components are computed. After, within the thickness of the Lissajous curve, the decision whether the motor is healthy or faulty can be made. This can be considered as a first sign or preliminary indication of the existence of the fault from the operator’s viewpoint. Lastly, the modulus of the Park’s vector is calculated, and its spectrum is analyzed after the application of the fast Fourier transformer (FFT) to determine the fault’s gravity by monitoring the amplitude of the 2·s·fs spectral component. This is useful mainly for applying this technology in real industrial applications as well as for simplifying the automation of the monitoring process, which is important for its realization in portable fault detection devices.

4.1. Simulation Results

It is recognized that the apparition of a rotor fault will create spectral components in the left and the right sides of the fundamental frequency of the line currents spectrum located at (1 ± 2·sfs. The appearance of these sidebands in the current spectra will produce, as a consequence, an increase in the Lissajous curve thickness as shown in the simulation results in Figure 3 and those obtained in the experiment in Figure 4. The comparison between Figure 3a with Figure 3b, and Figure 4a with Figure 4b, shows obviously that the rotor failure is facilely detected by monitoring the Park’s vector pattern and the surveillance of the increment of its thickness. As seen from Figure 3 and Figure 4, some variations in the thickness of the Park’s vector pattern can be remarked, and there is no change of shape.
Moreover, as known in the case of BRB, the spectrum of the current absorbed by the induction motor contains lateral components whose frequencies are given by the relation (1 − 2·k·s) fs. These components will therefore be present in the Park’s currents’ id and iq. Under these conditions, it is easy to show that the spectrum of the modulus of the Park’s current contains only a DC component generated by the fundamental component of the stator current in the case of a healthy motor, as shown in Figure 5a and Figure 6a. In the case of BRB, other sideband components at frequencies 2·k·s·f appear as shown in Figure 5b and Figure 6b. We note the similarity between the results obtained by simulation and those obtained by experimentation. Ideally, in a healthy machine, the modulus of these vectors should only include a DC component, whereas under abnormal conditions, components related to the fault should appear.

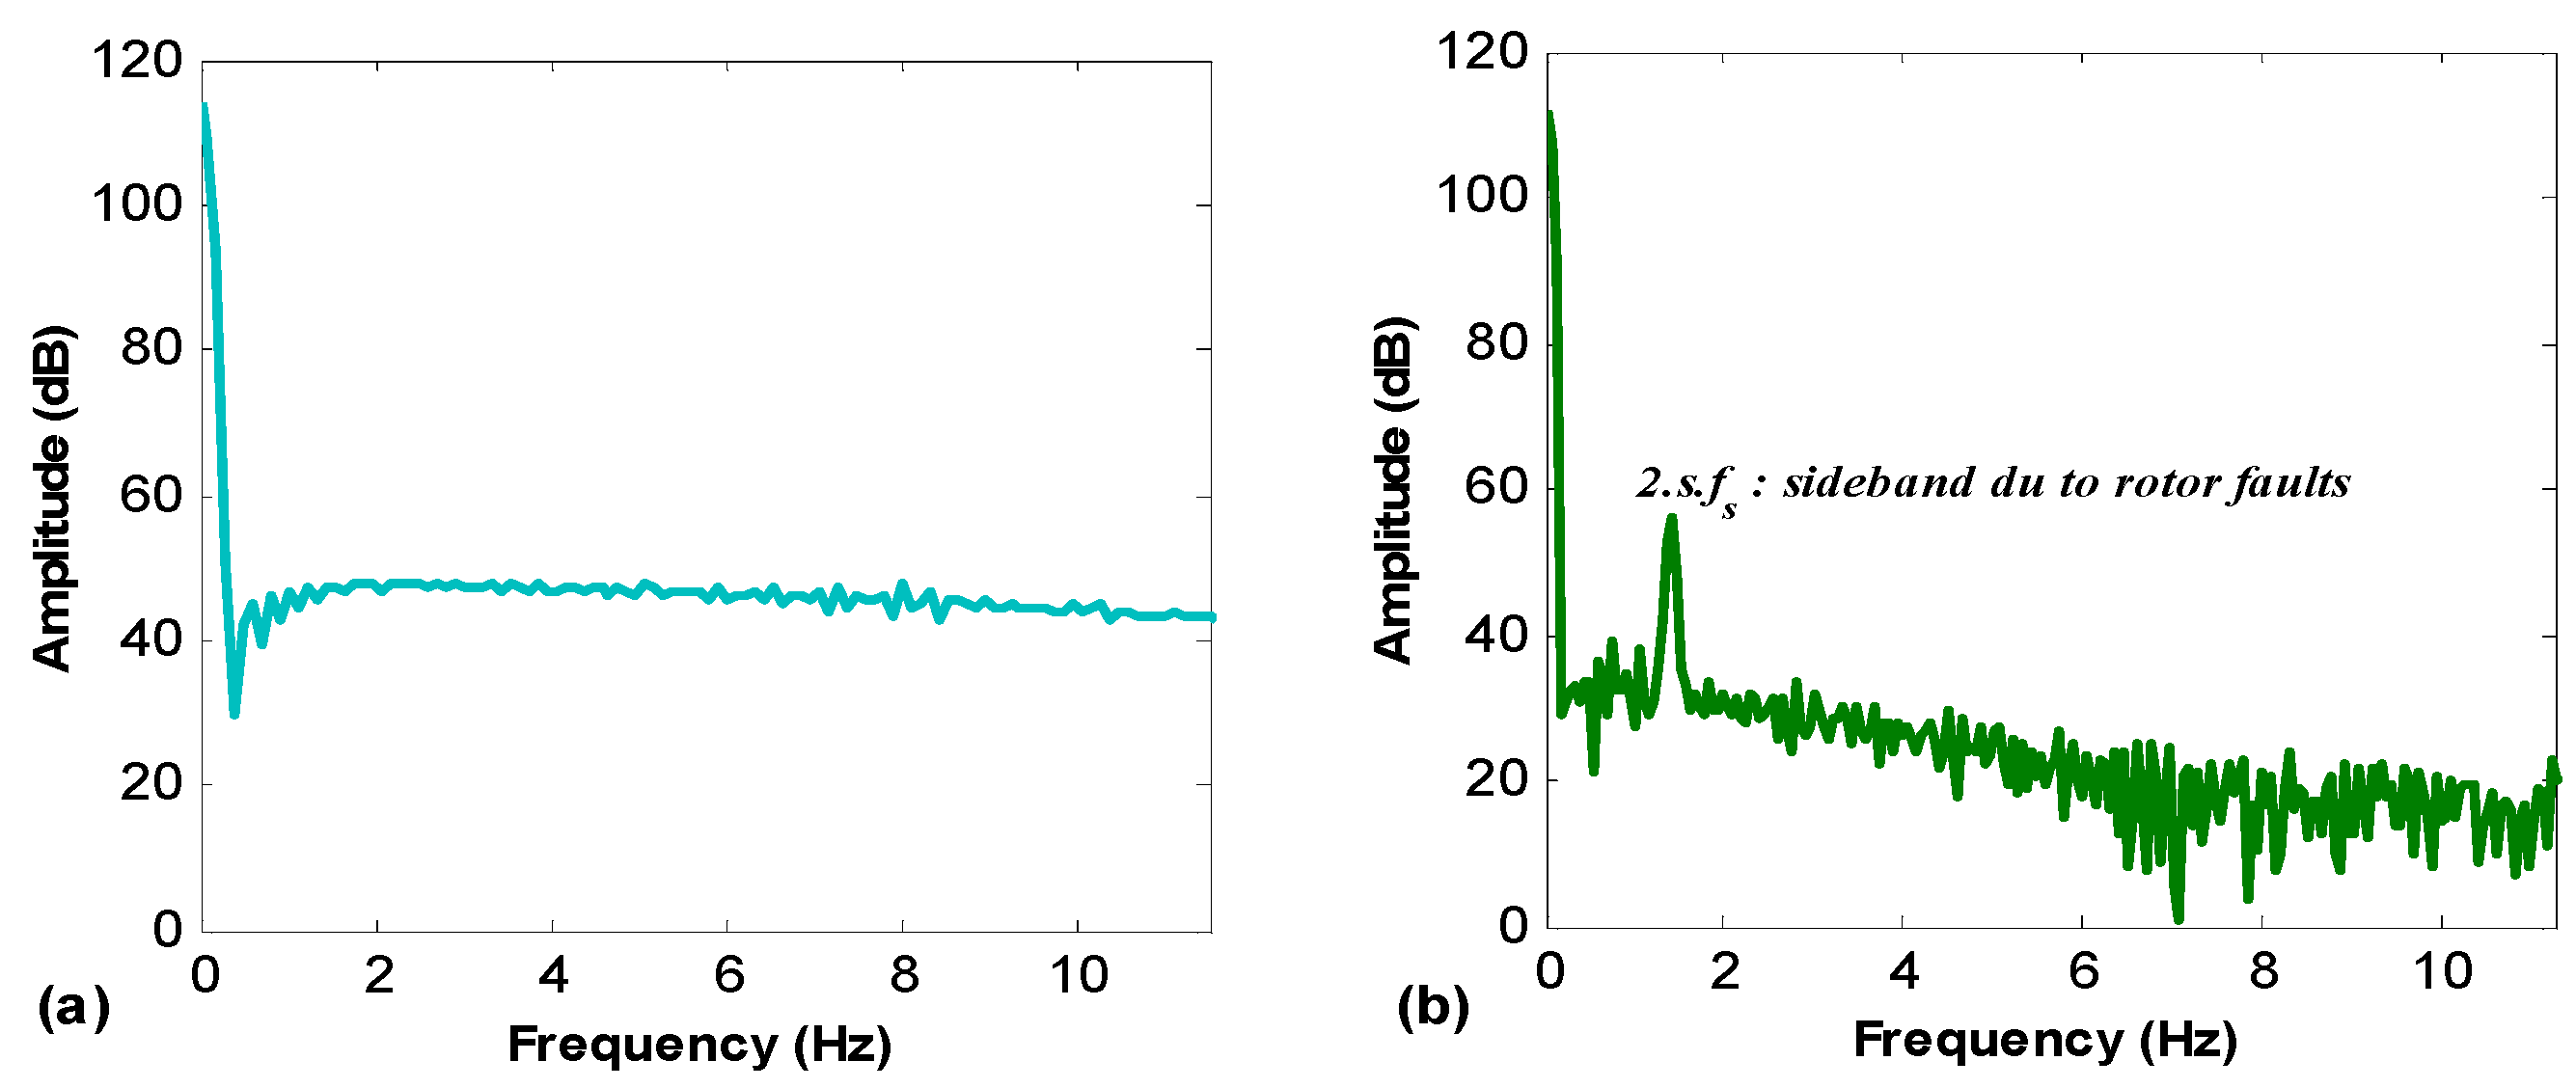
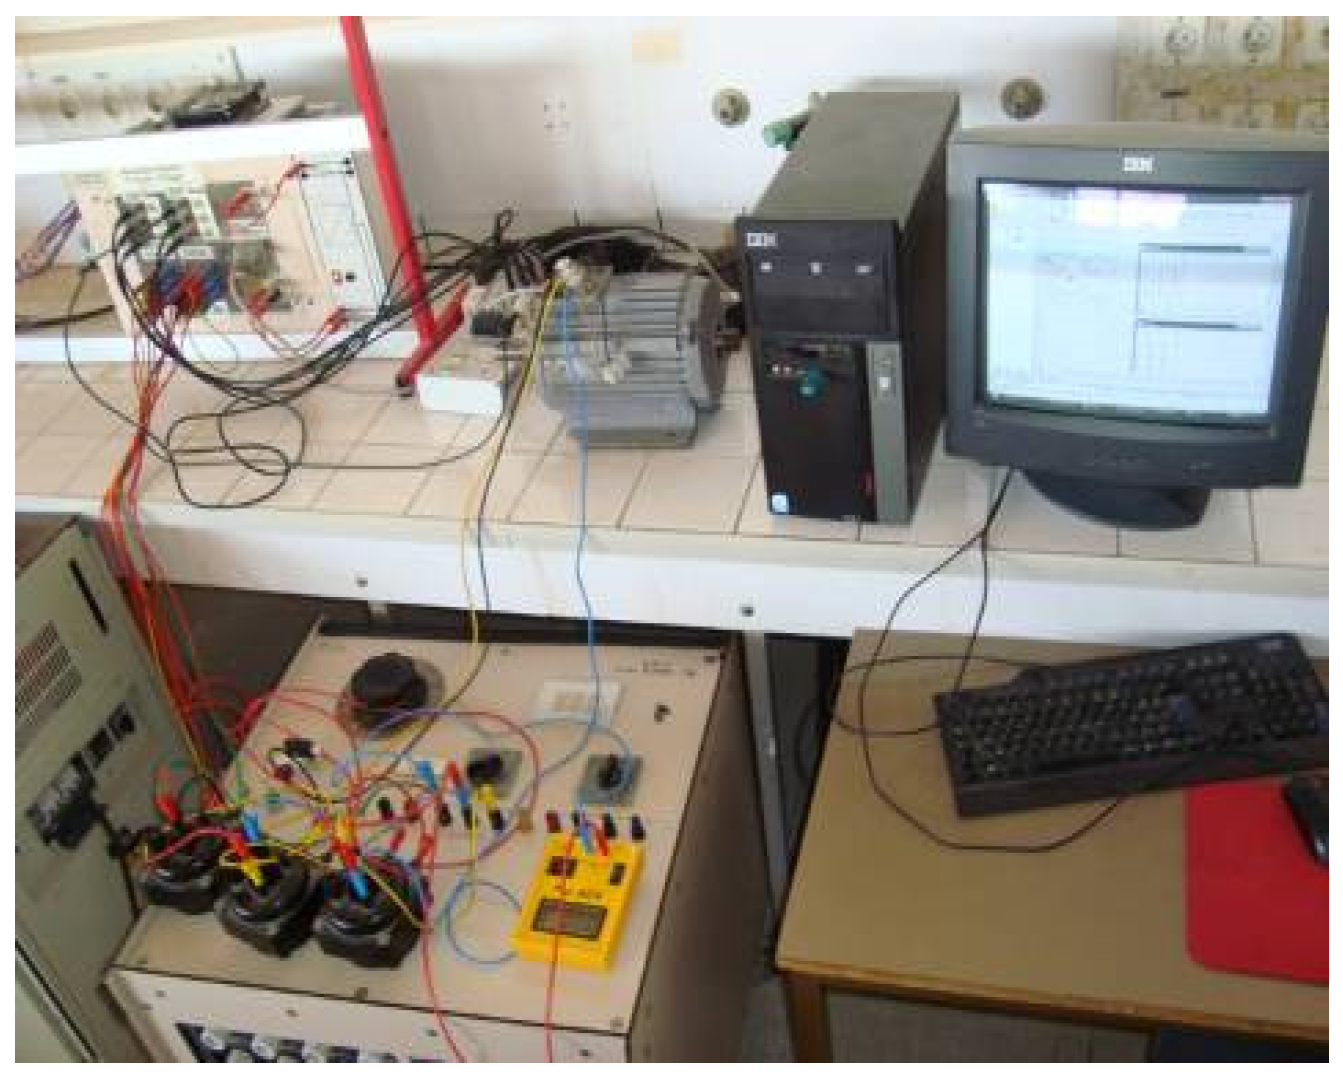
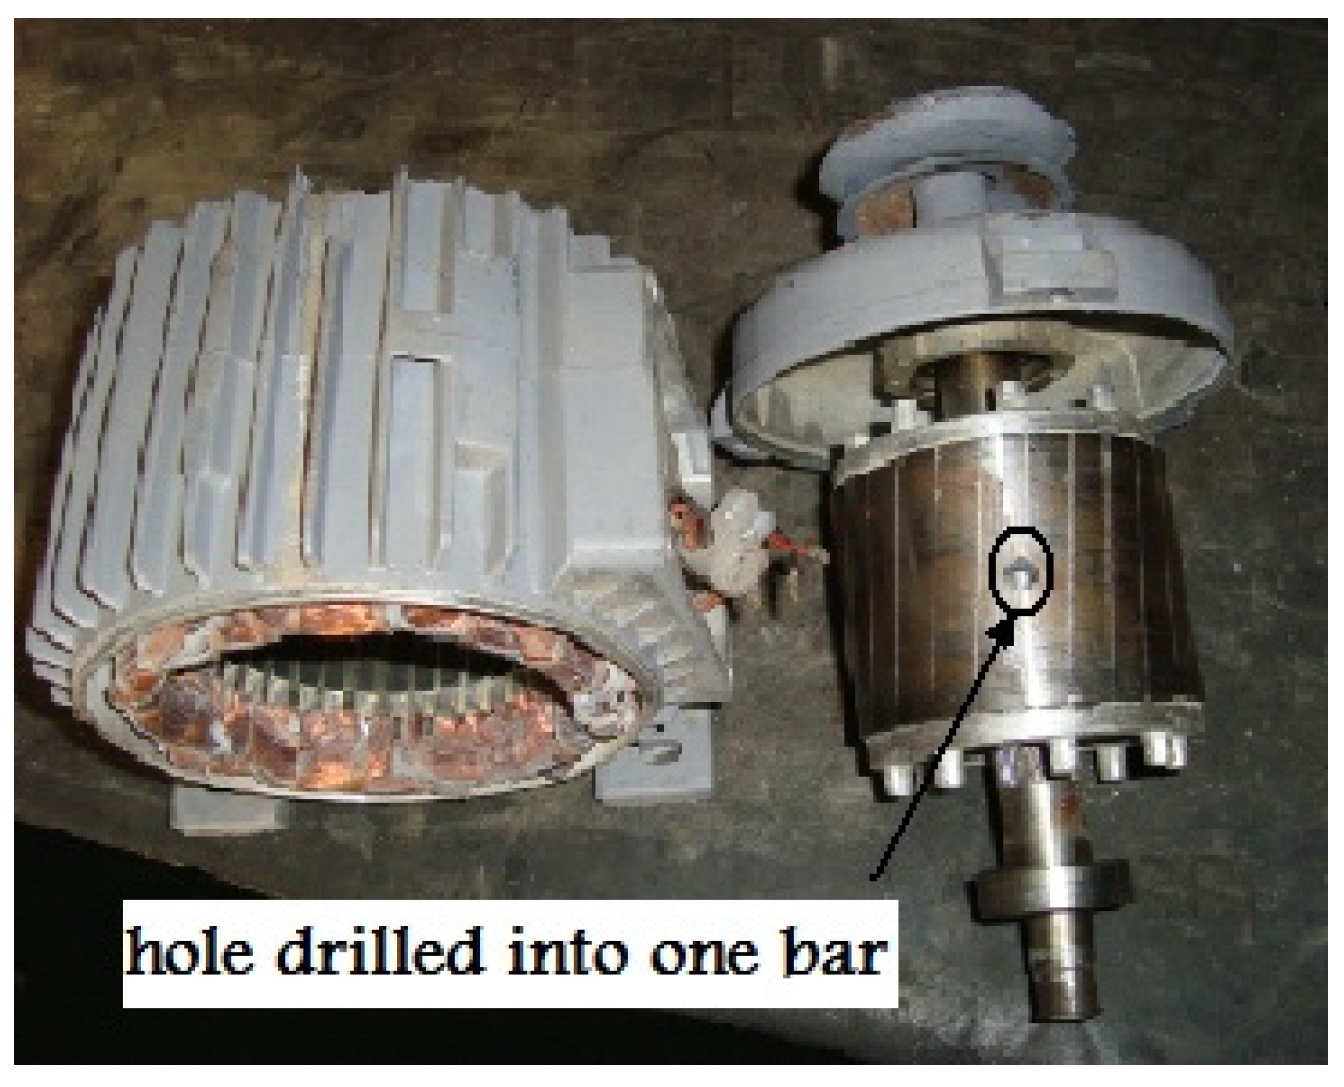
4.2. Experimental Results

The experimental laboratory setup consists of a 1.5 kW three-phase squirrel-cage motor, a three-phase autotransformer, a variable resistor, a DC motor used as a separate DC generator feeding a variable resistor, and a dSPACE 1104 data acquisition board, as in Figure 7. The load torque changes by varying the DC excitation current and the load resistor. The acquired current is sampled at a 10 kHz sampling rate. At first, the motor is tested with its intact cage in order to obtain the Park’s vector trajectory of the motor with no-fault. This shape is utilized as a reference for the other faulty cases. The three-phase currents are measured using three current transformers. The BRB faults are created manually by drilling holes in the bars of the rotor cage. The acquired current is analyzed and treated using the MATLAB/Simulink software. Figure 8 shows the hole drilled in one bar of the motor cage, and the experimental setup in case of unloaded motor is presented in Figure 7.

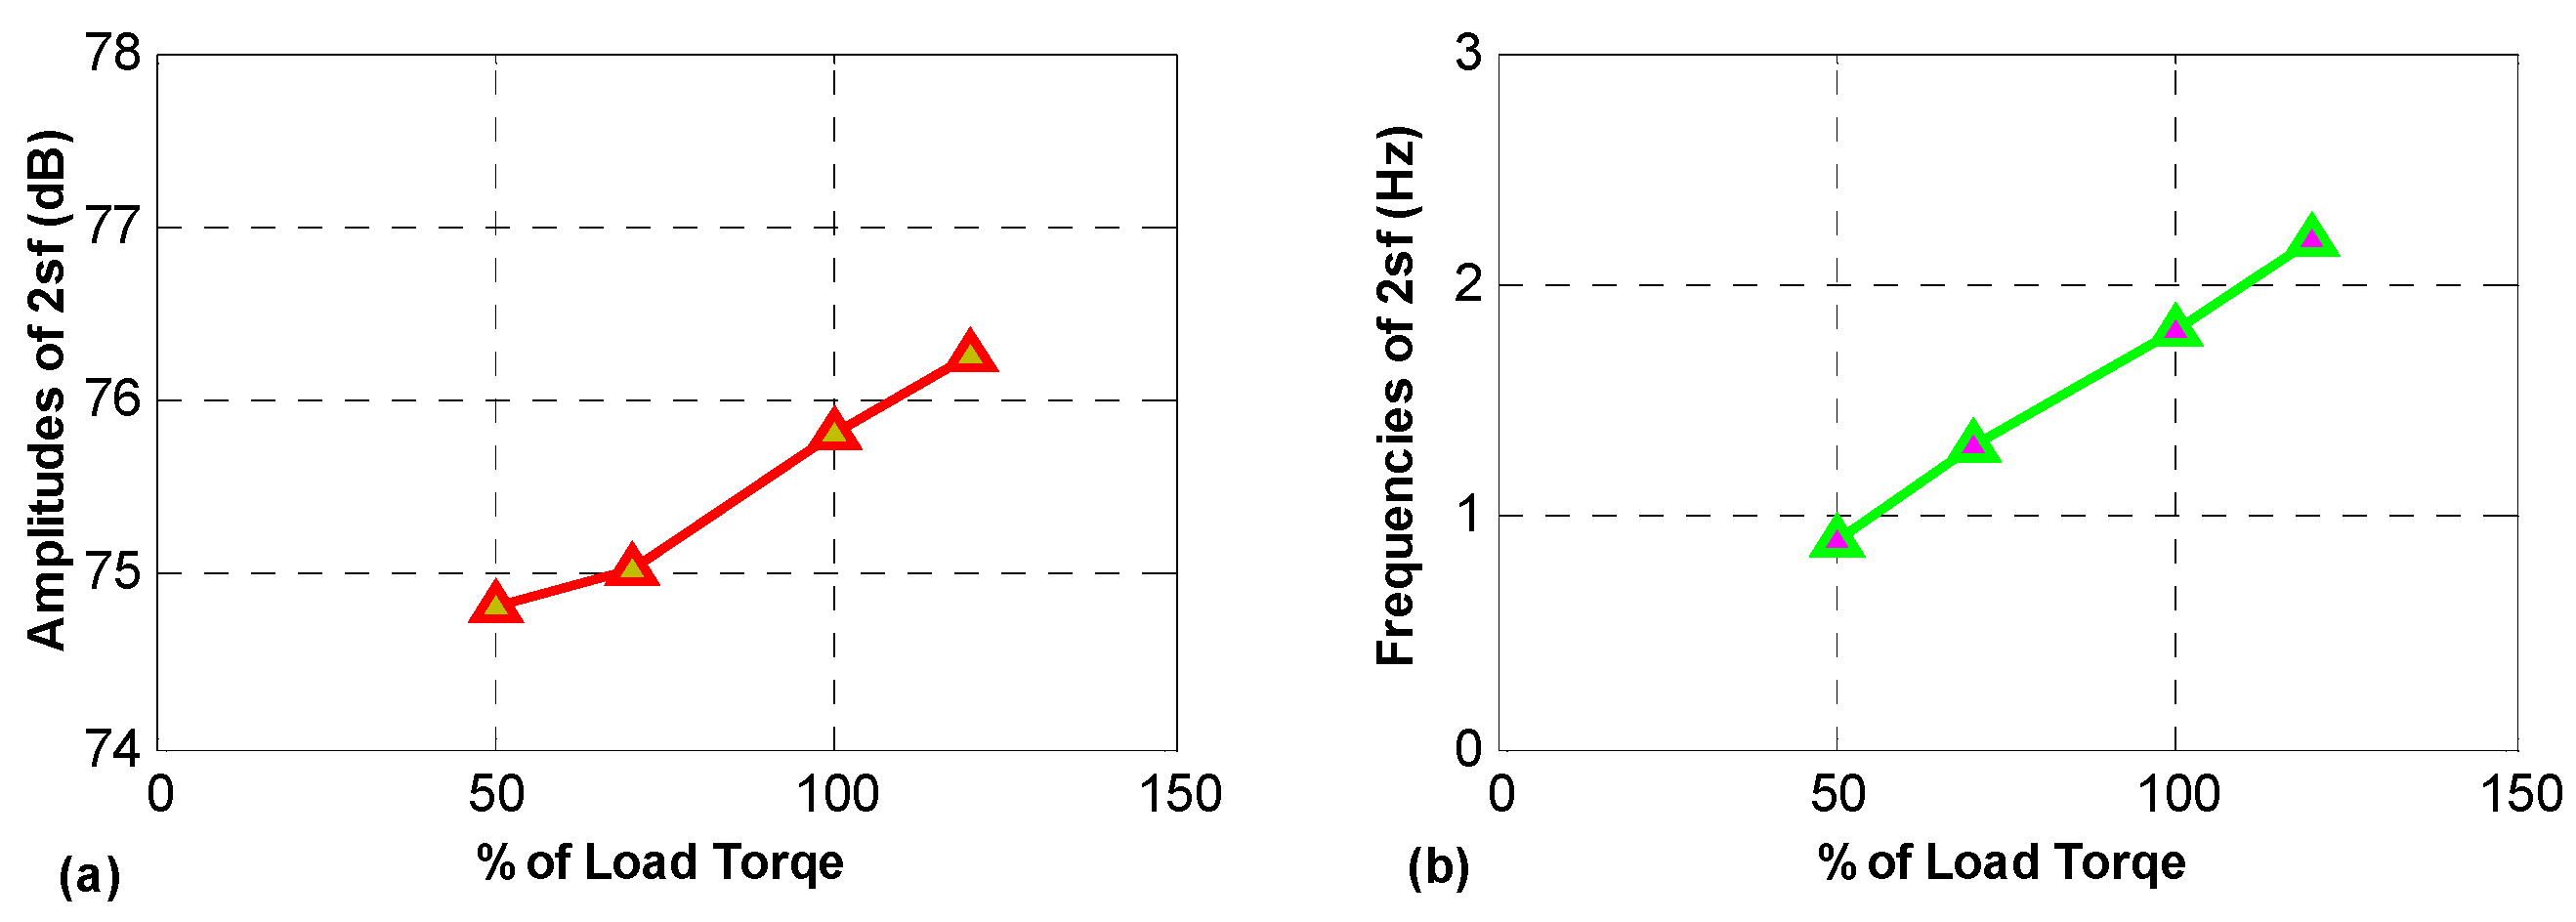
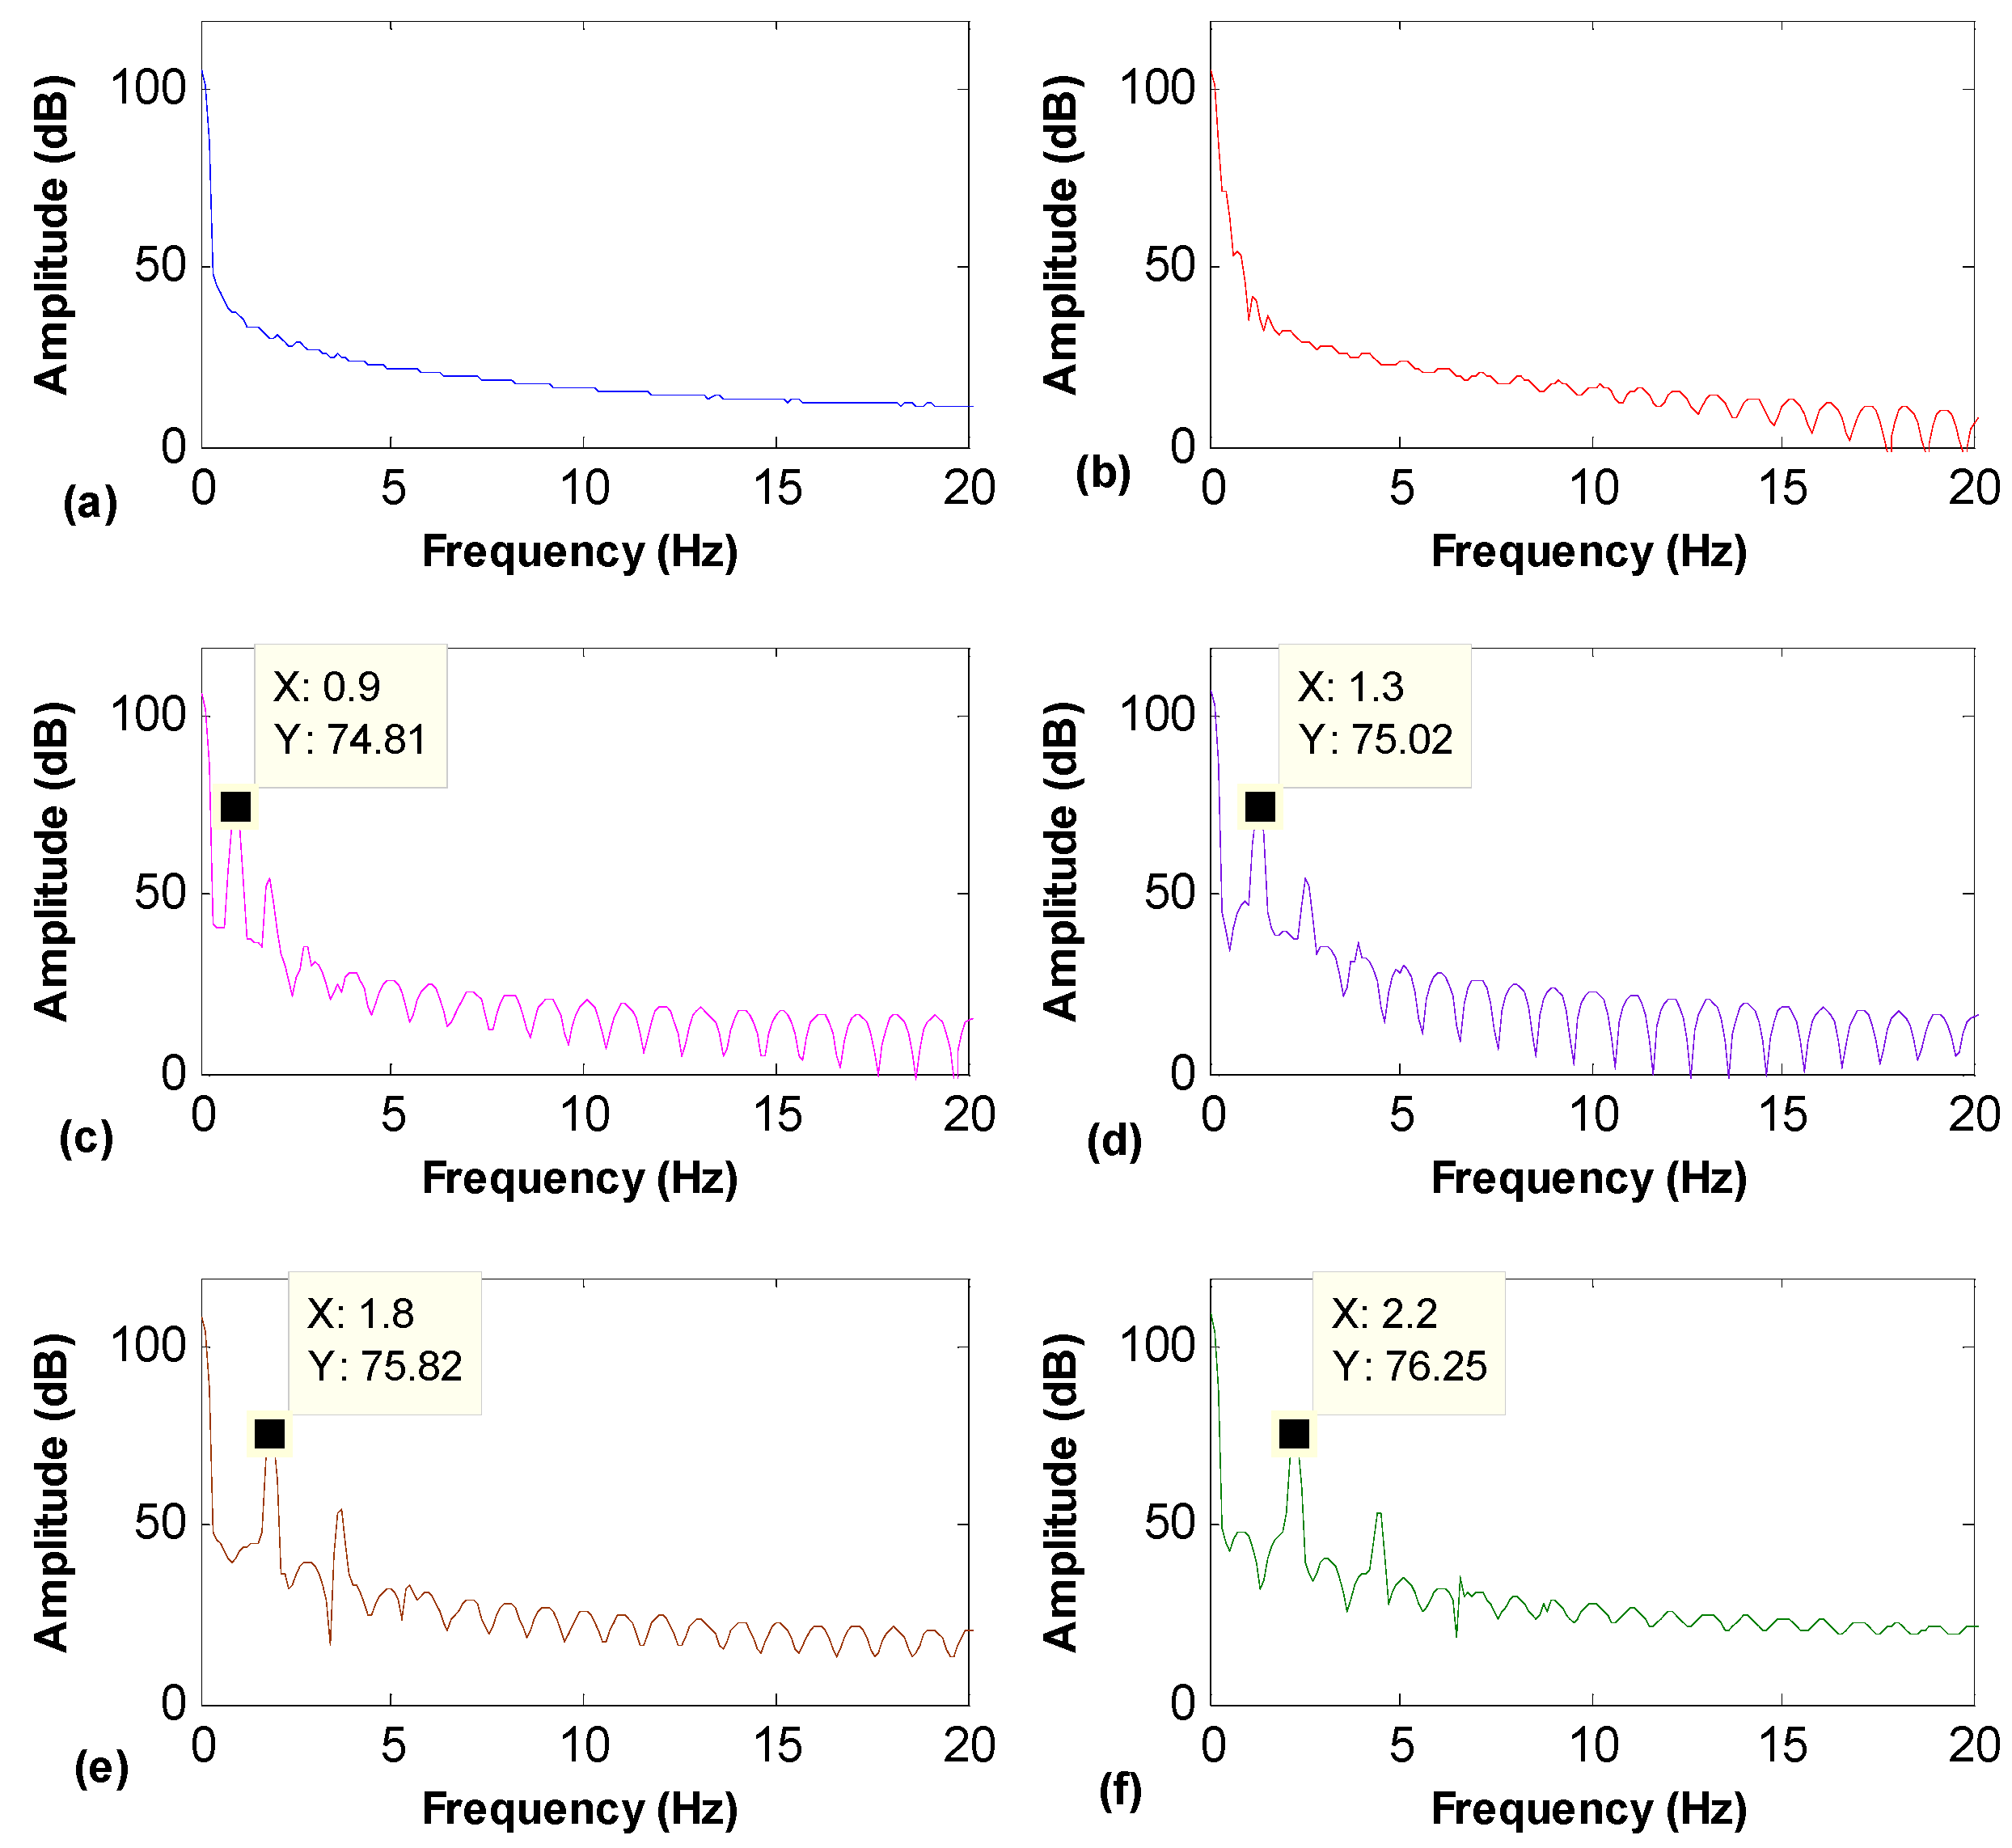
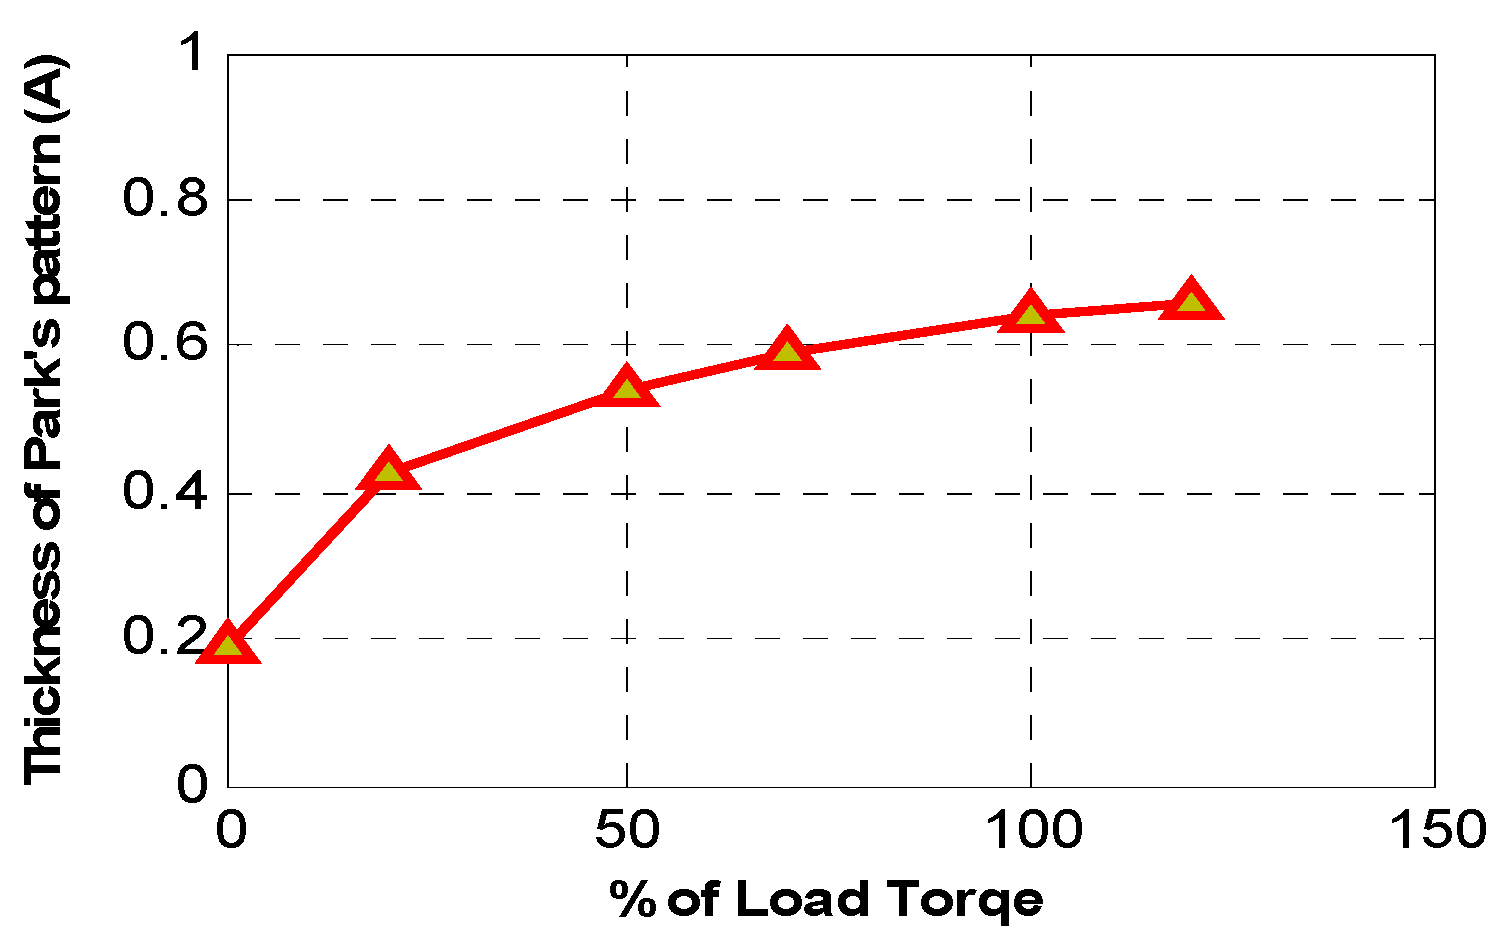
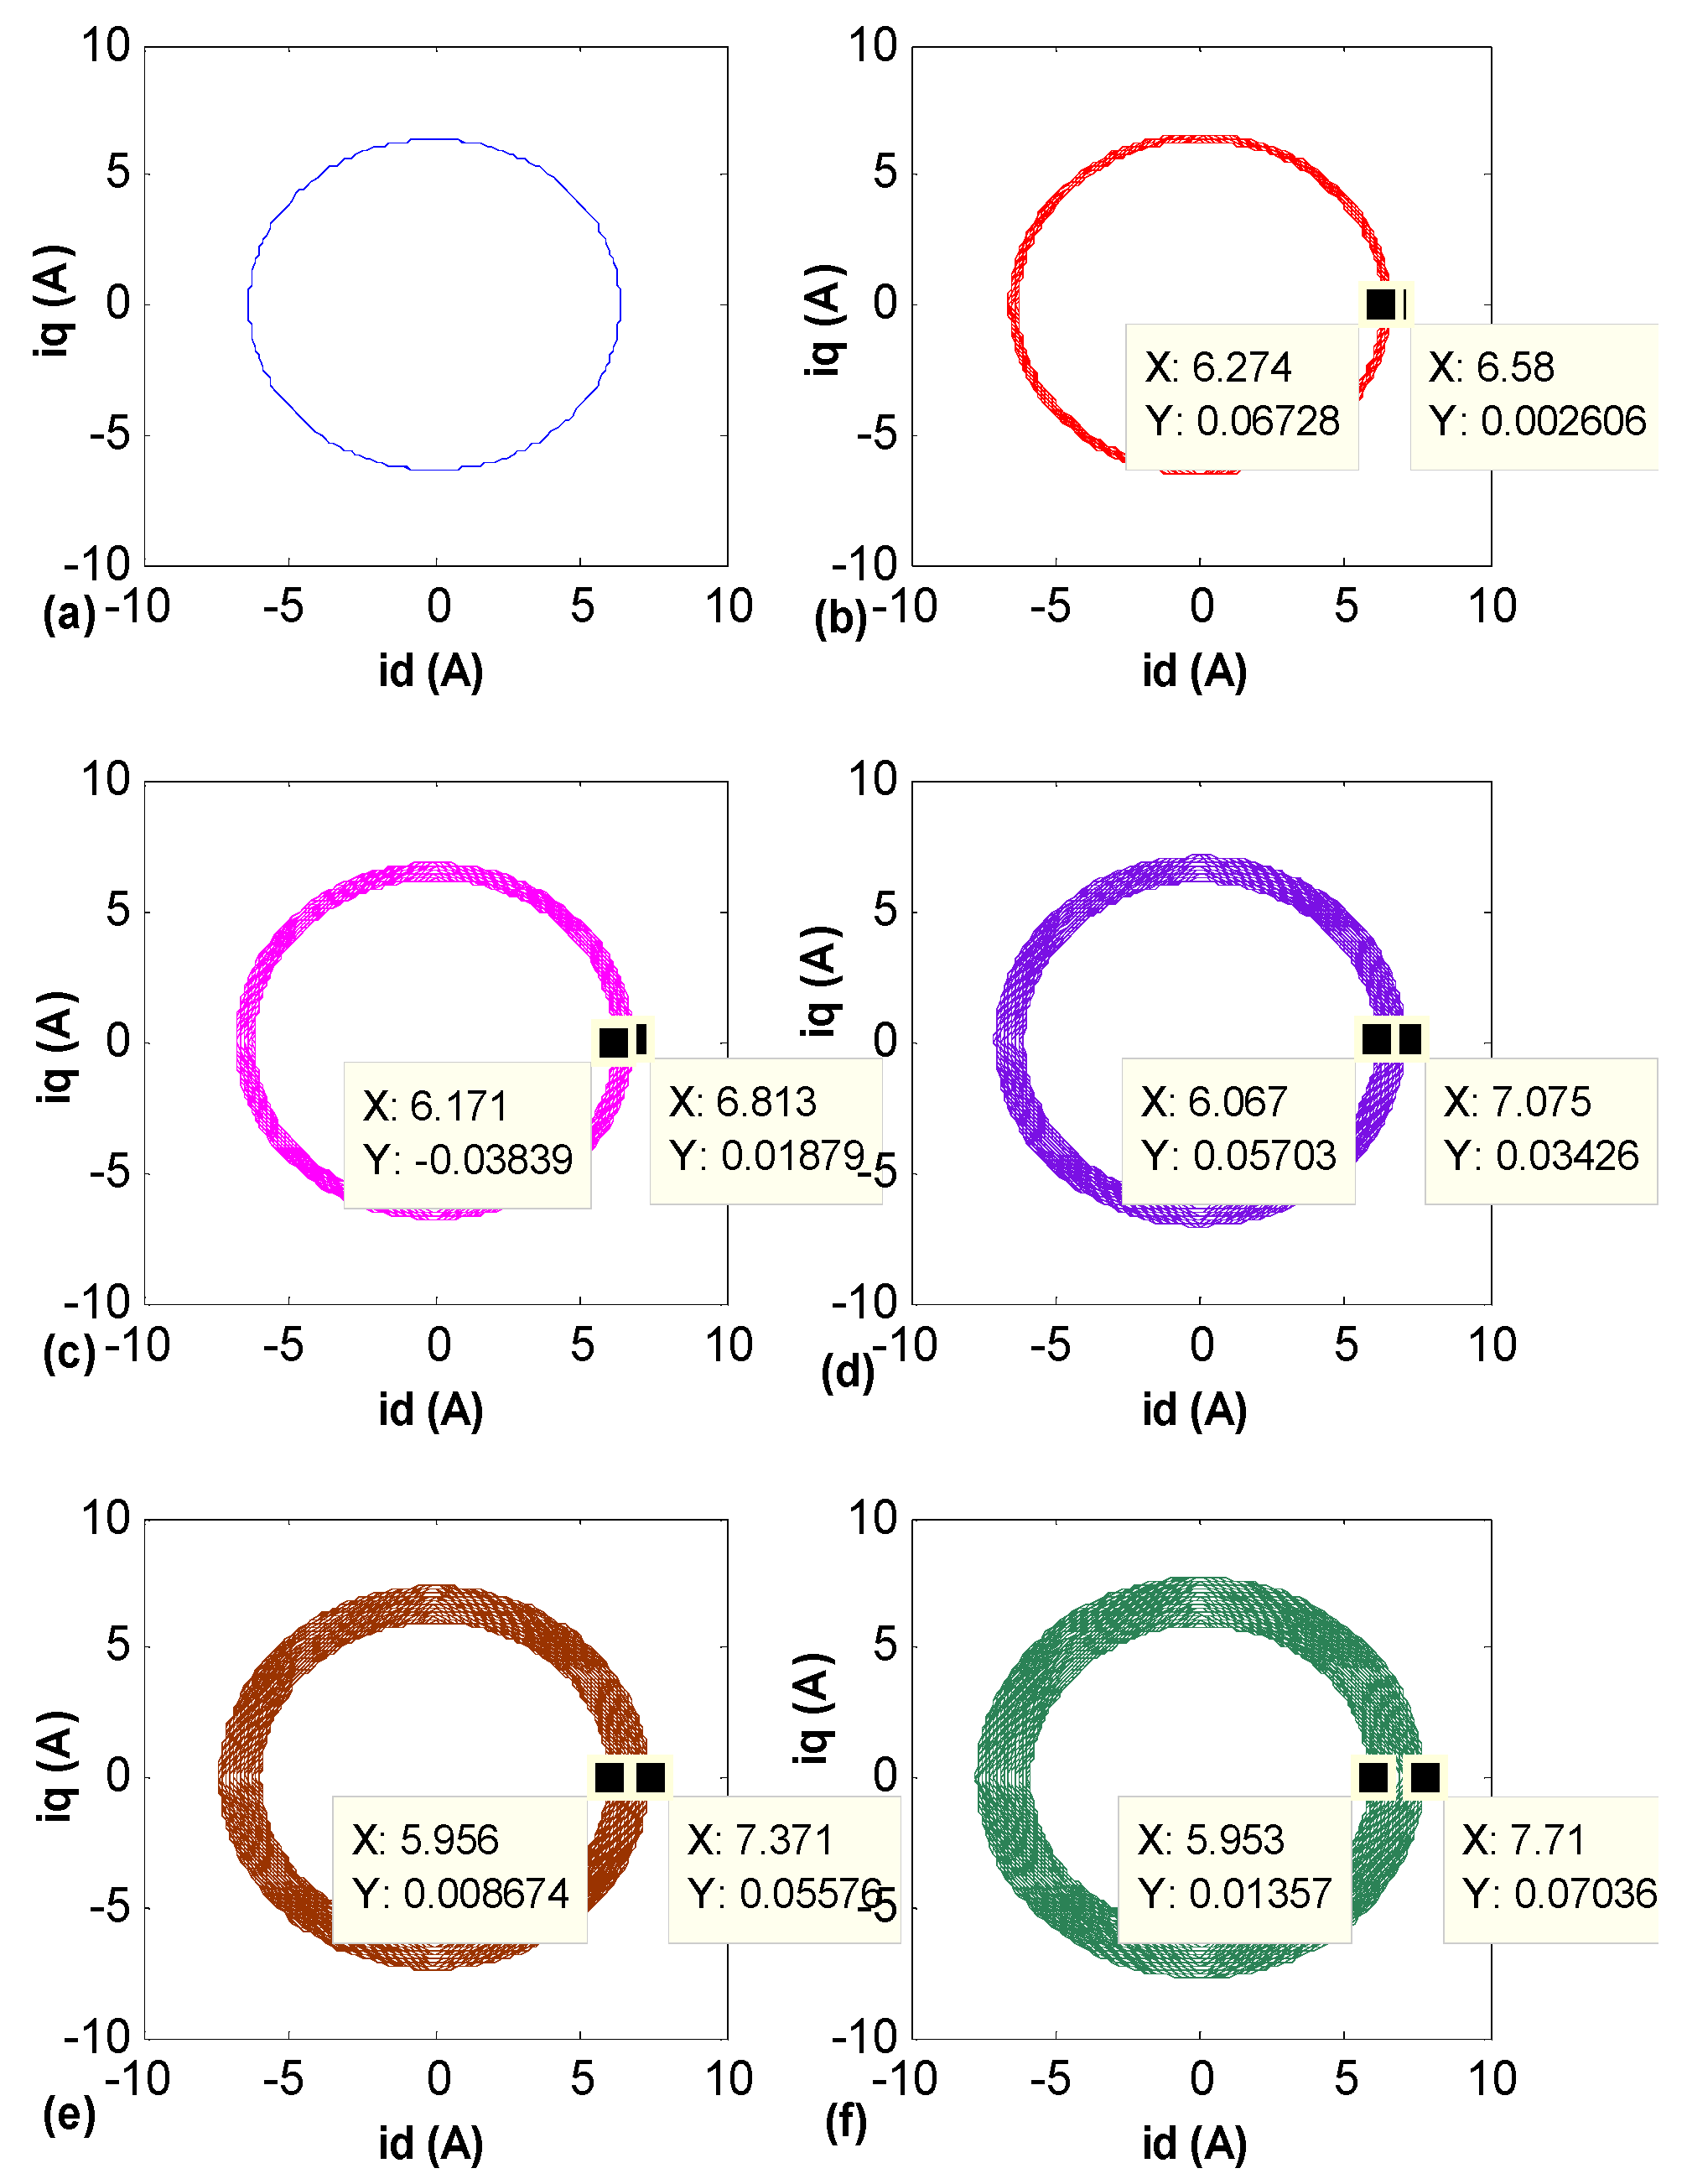
4.3. Influence of the Load Torque Variation on the Rotor Bar Fault Signature

The load level is one of the most vital factors that can have important influences on the rotor fault detection of an IM using the condition monitoring system. For this reason, many simulated and experimental tests were performed at different load level conditions. Figure 9 illustrates Park’s vector spectra of a motor with BRB and under different load conditions: (a) unloaded motor, (b) under 20% of nominal load, (c) under 50% of nominal load, (d) under 70% of nominal load, (e) under 100% of nominal load, and (f) under 120% of nominal load. Figure 10a,b illustrate the amplitudes and the frequencies of the 2·s·fs spectral component under different load conditions, respectively. It is evident that as the motor load is increased, the amplitude of the 2·s·fs sideband increases and becomes more visible. The advantage of this strategy relies on the fact that in the spectrum of the Park’s vector modulus, only the components related to the fault appear in the low-frequency range. Table 2 shows the amplitudes and frequencies of 2·s·fs spectral components under different load conditions. It is clear that in the case of an unloaded or low-loaded motor, the 2·s·fs spectral component due to rotor fault does not appear in the Park’s current spectrum, as shown in Figure 9a,b.
Figure 11 illustrates the Park’s vector patterns for a motor with constant rotor fault’s degree and under different load torque conditions. It is interesting that the IM presents a distinct increase in the Park’s vector pattern thickness as the load torque increases as presented in Table 3. When the motor functions under its full load, the stator current is raised, and as a consequence, the Lissajous curve took the form of a large circle in comparison with the unloaded motor case.
Figure 12 shows the influence of the load torque on the thickness of the Park’s vector pattern of a motor with a BRB. As expected, it is clear that Park’s vector pattern thickness increases as the load torque increases.

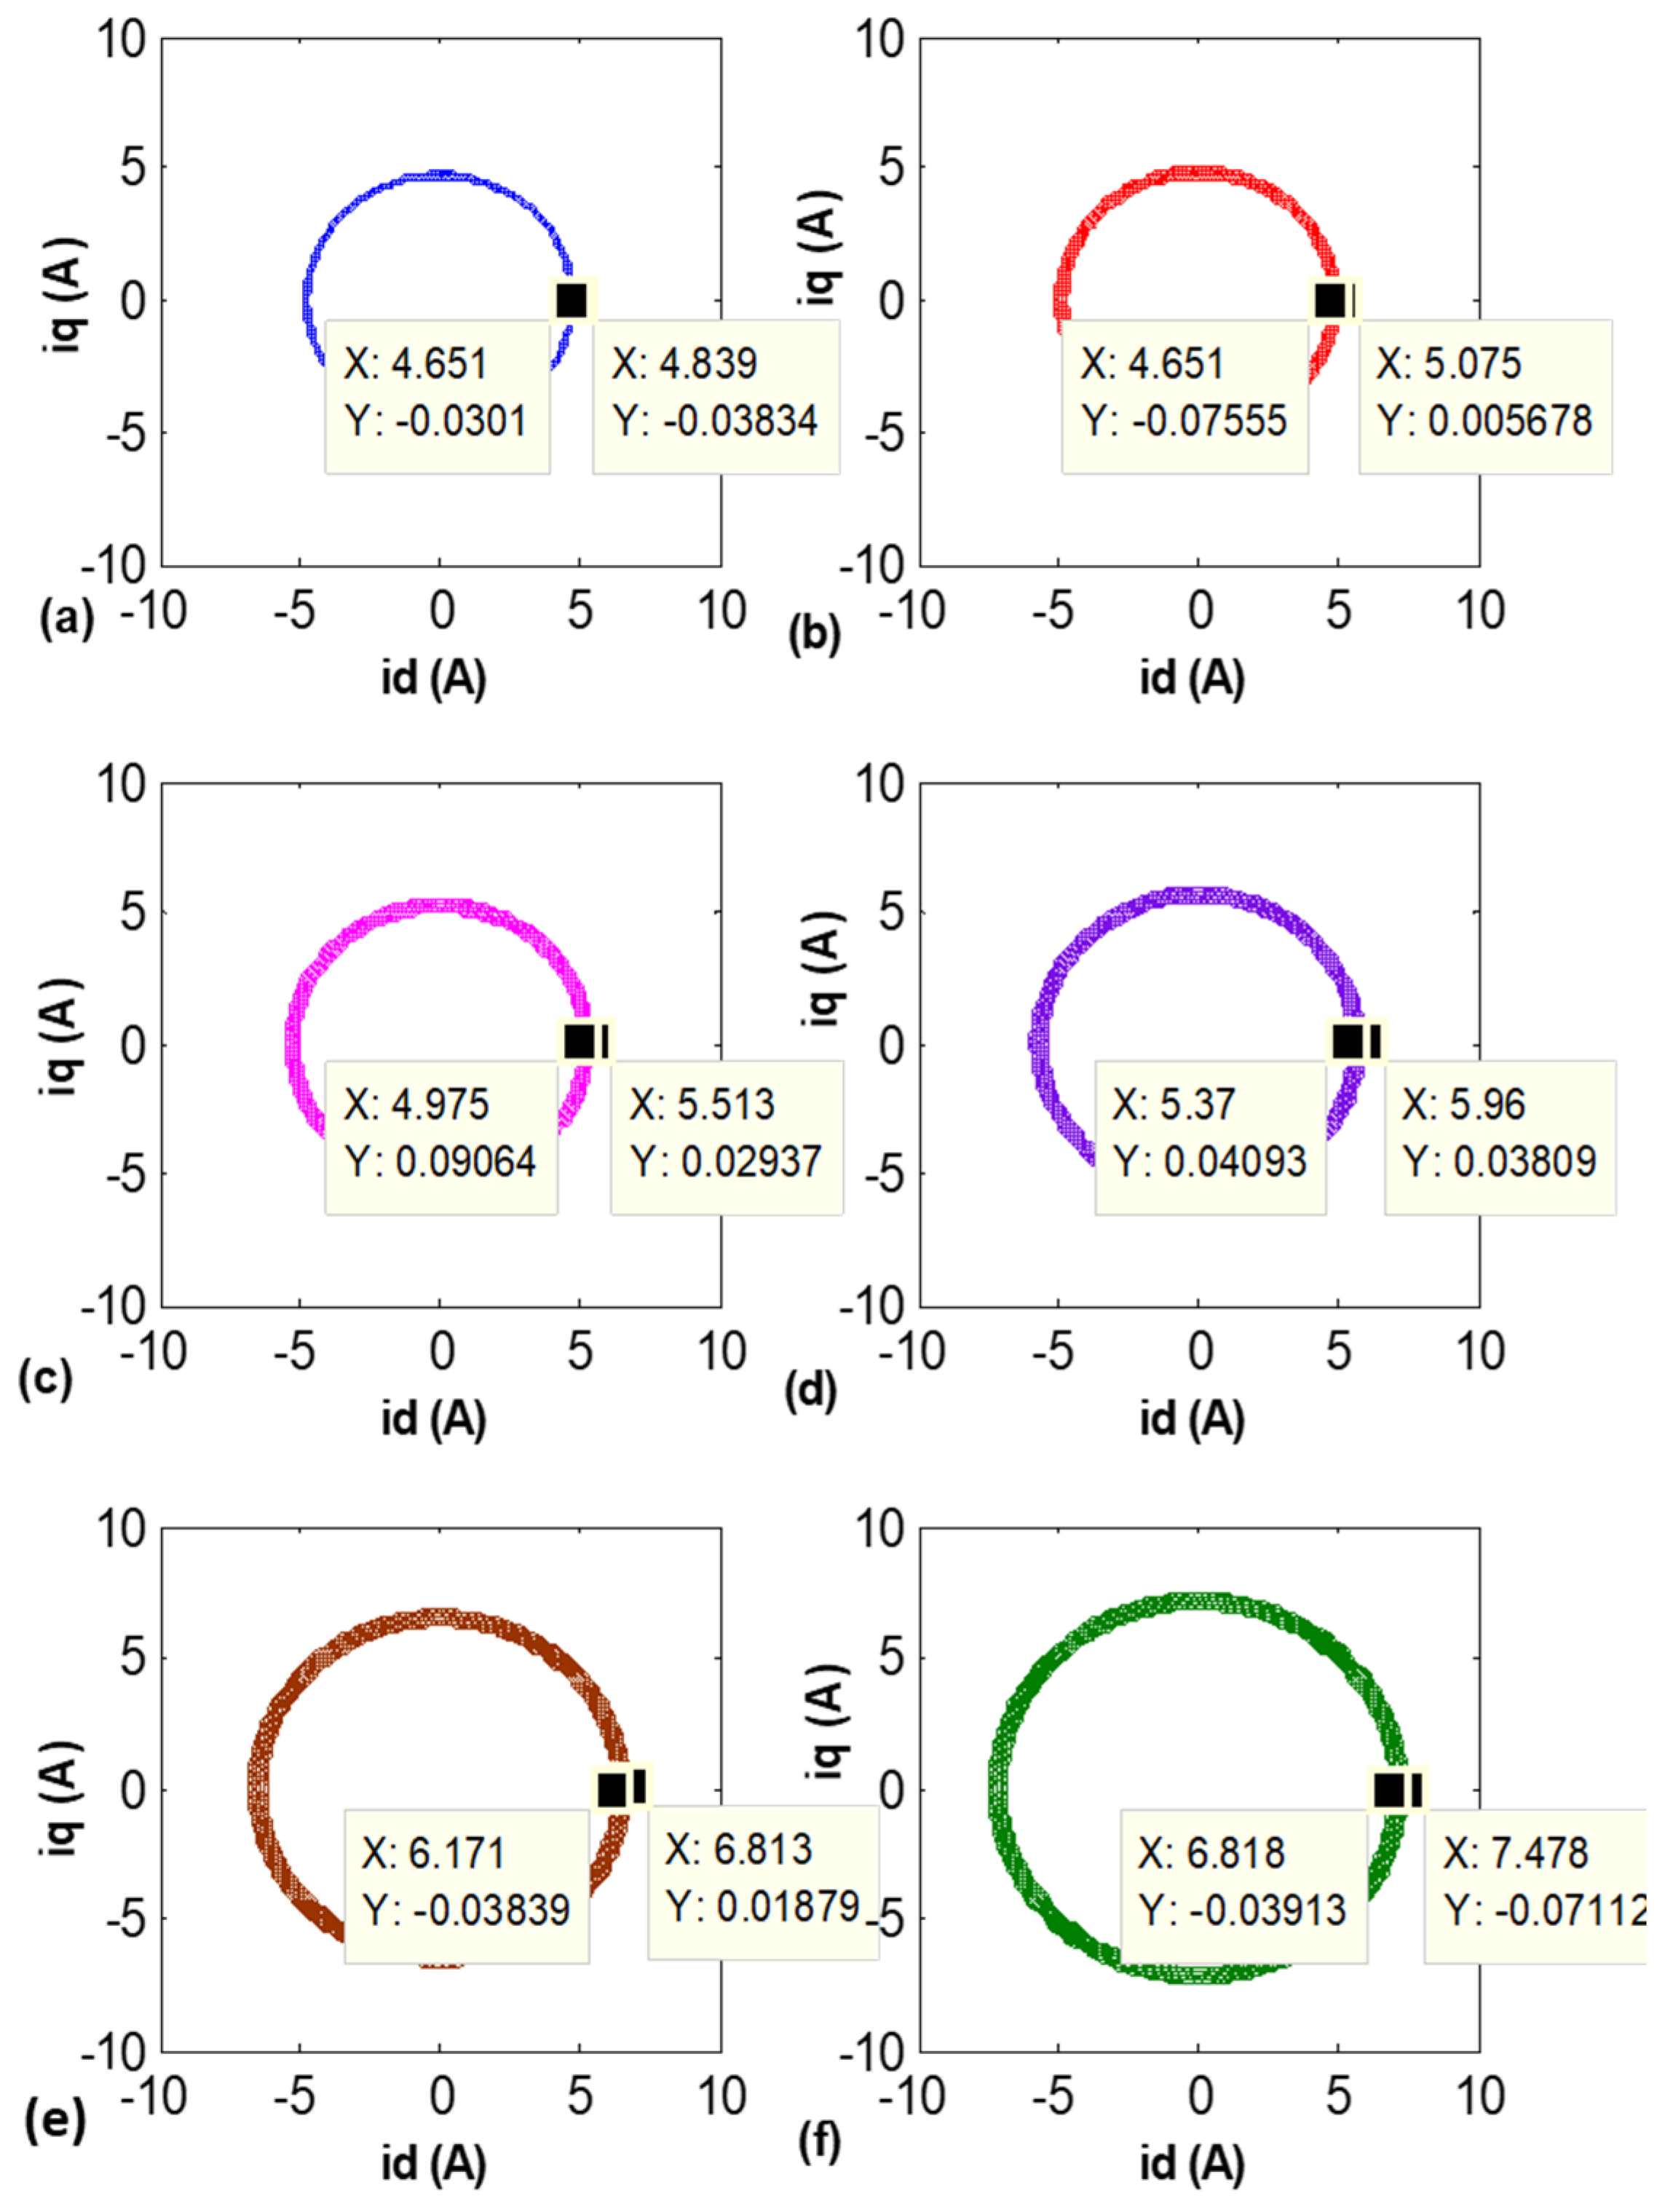
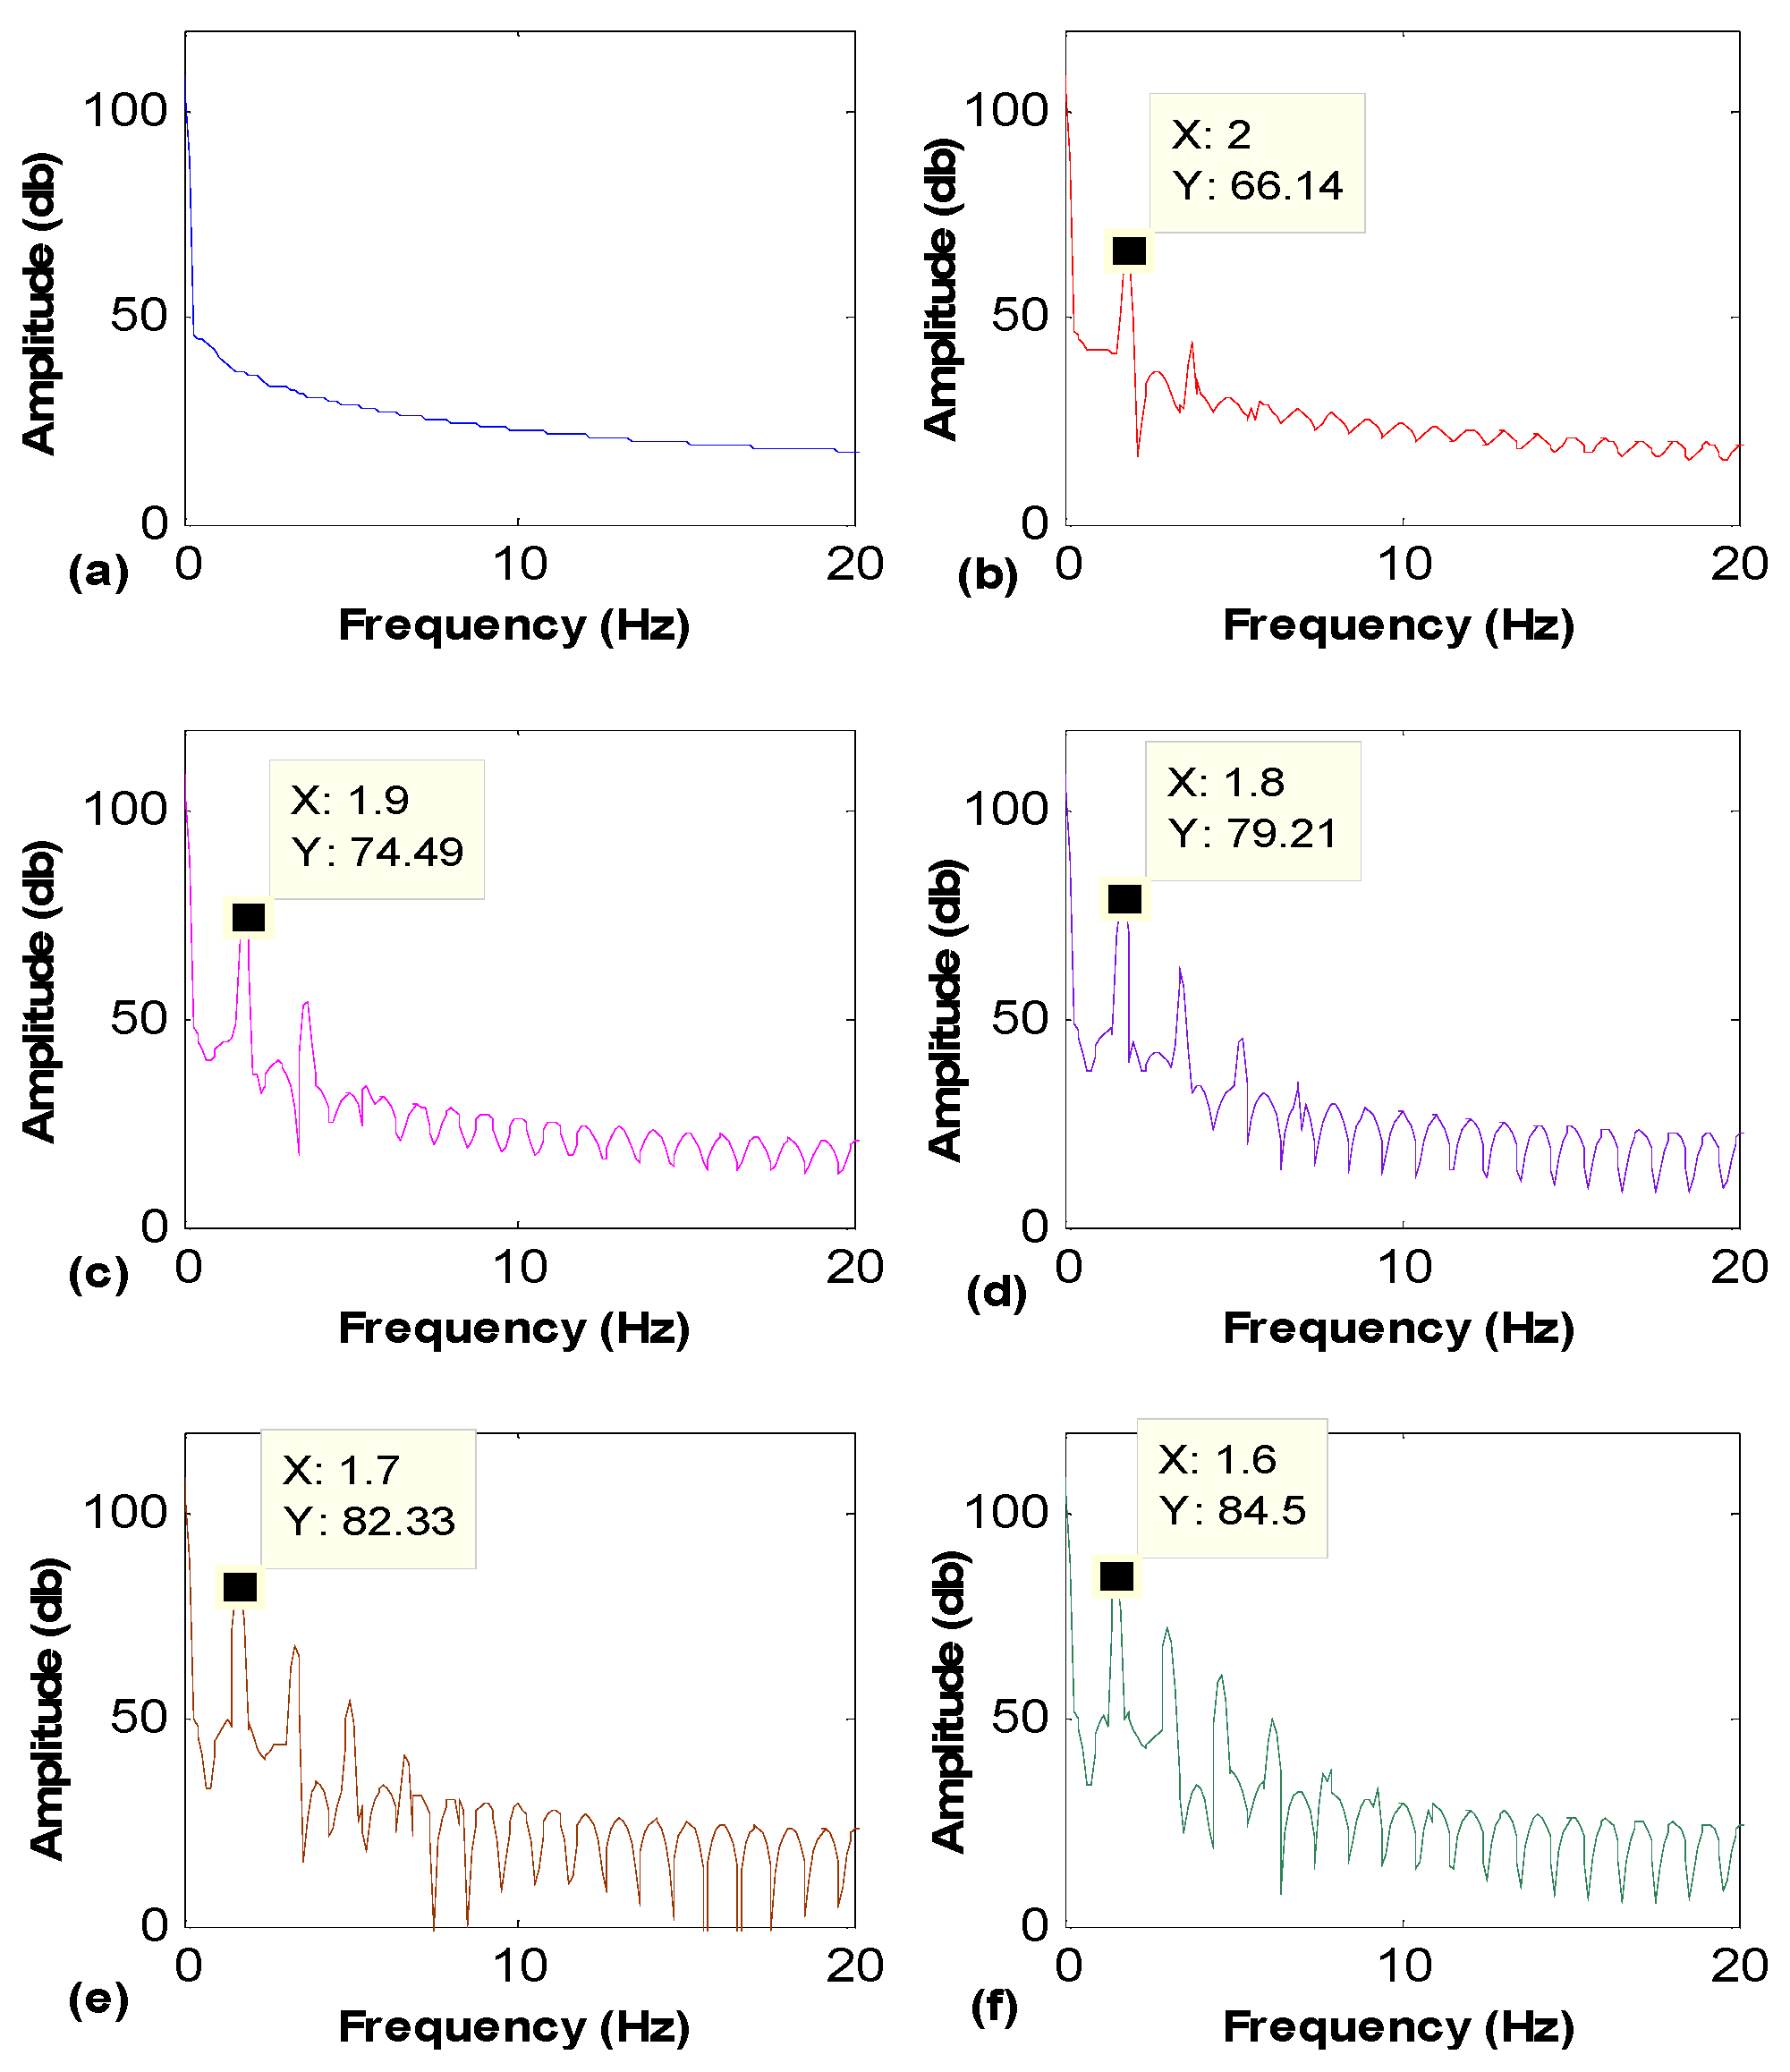
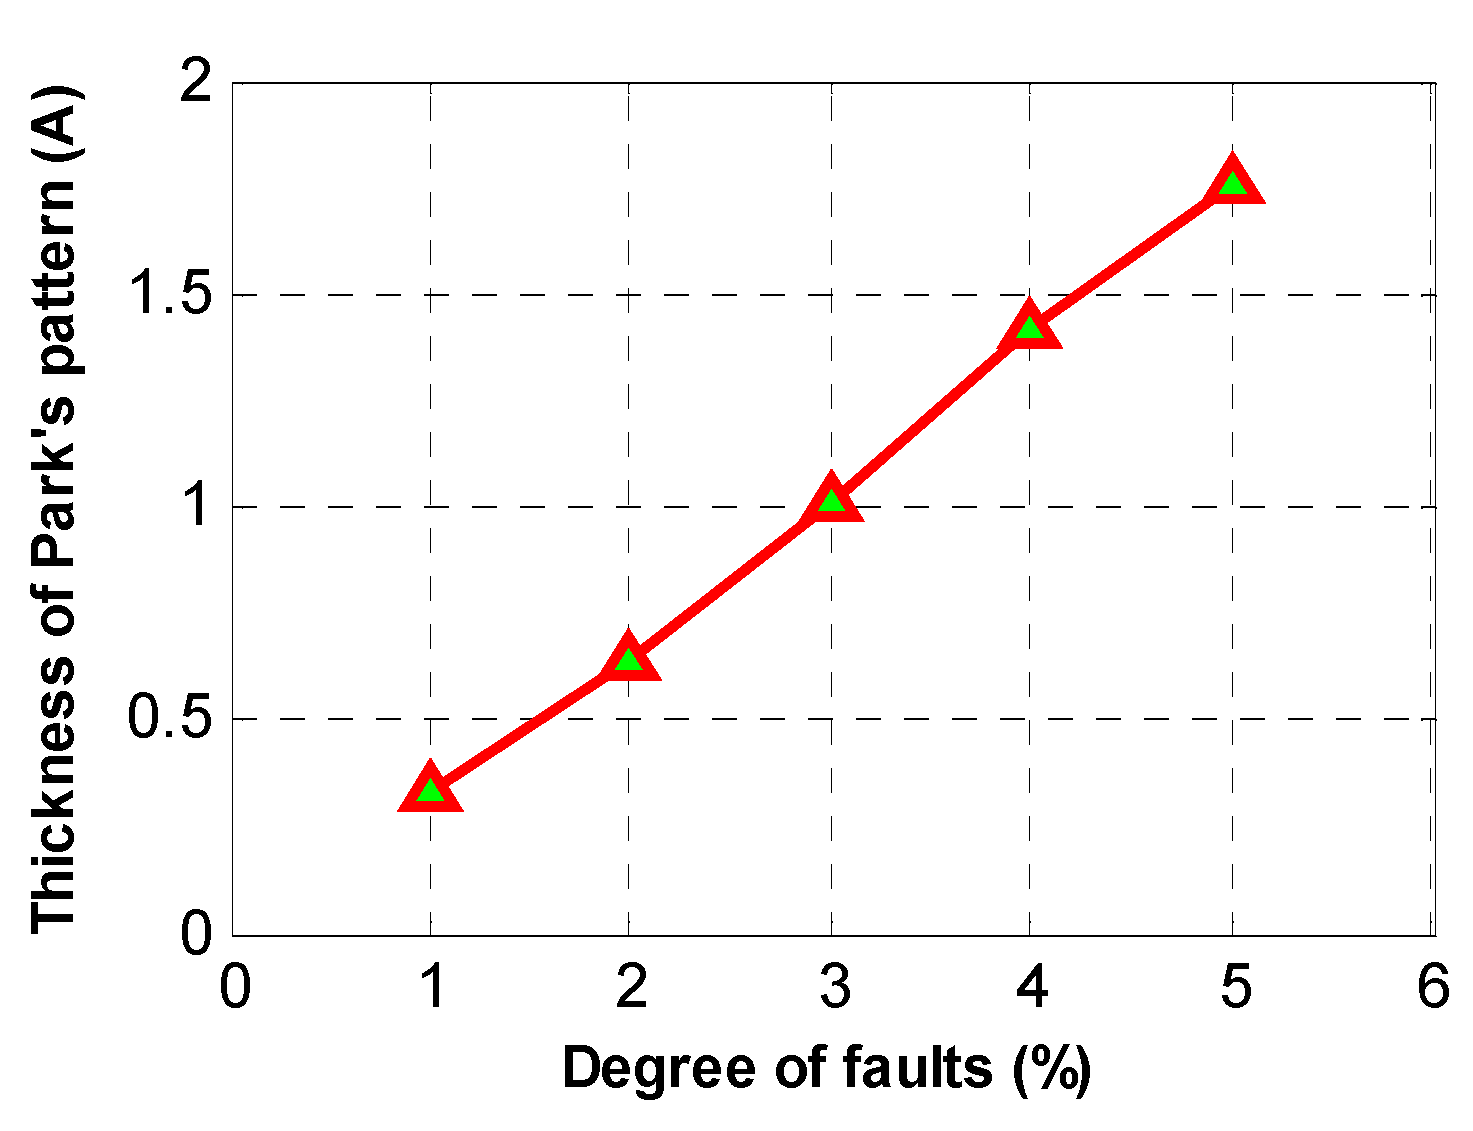
4.4. Influence of Fault’s Degree under Constant Load Condition on the Rotor Bar Fault Signature

Figure 13 shows the spectrum of the PV modulus in the case of the motor with no-fault and motor with different fault conditions. The evolution of the magnitudes and frequencies of the 2·s·fs sidebands components with the rotor faults severity are given in Table 4 for all studied cases. A closer inspection of the spectrum of the EPV modulus shows the clear augmentation of the amplitude of the expected BRB fault signature with the increment in the fault severity. It is evident that these signatures amplitudes can be considered as a reliable indicator of BRB fault severity. In Figure 13, the degree of fault (%) is equal to the number of broken bars * 100/number of total bars.
A closer look at Figure 14 reveals that the trajectory of the amplitude of the 2·s·fs components increases as the degree of fault increases, and inversely, the frequencies of the 2·s·fs components decreases as the degree of fault increases and approaches to the DC component.
Figure 15 illustrates the Park’s vector patterns for the motor with different degrees of rotor fault and under constant load torque (nominal). It is interesting that the IM presents a distinct increase in the Park’s vector pattern thickness with the increase in the fault severity as expected. The magnitude of the thickness of Park’s vector patterns for different fault levels is shown in Table 5. It is remarkable that the thickness of the Lissajous curve gradually rises as the severity of the rotor fault rises. The rotor defects can be facilely detected by monitoring the relative thickness of Park’s vector patterns. In a real industrial application, the visual examination of the Lissajous curve by a non-expert operator can be considered as the first reliable fault existence indicator.
It is remarkable that the thickness of Park’s vector pattern is an ascending function that gradually rises with the increase in the rotor fault severity, as shown in Figure 16.

5. Discussion

Using the PVA, the visual examination of the Lissajous curve thickness by a non-expert person can be considered as the first reliable fault existence indicator. However, this method cannot provide precise information about the fault severity. In a healthy machine, the modulus of the extended Park’s vector (EPVA) only includes a DC component, whereas under abnormal conditions, spectral components related to the fault would appear. The exact frequencies of the appeared sidebands due to faults should be known in advance. This results in the approach requiring an expert to be interpreted. The monitoring of the amplitude of the 2·s·fs frequency component can provide accurate information about the fault severity. Compared to the classical MCSA, this method overcomes the overlap problem of the frequencies. The CPEPVA gathered the advantages of both methods to spot and identify an incipient or already existing failure in the motor. Unlike the majority of techniques, CPEPVA can provide accurate information about rotor health without requiring access to the motor. The main disadvantage of this method is the lack of information on the severity of the fault when the IM is unloaded or lightly loaded even though the fault is detected.

6. Conclusions

The analysis of the Park’s vector patterns allows for obtaining a simple graphical view of the presence of abnormal operating conditions. This is an efficient method to detect an incipient rotor bar fault easily and early on without the need of the user expertise to interpret the obtained diagnosis results. This is crucial to facilitate the automation of the diagnosis process in real industrial systems. However, the pattern does not give an accurate quantitative idea as to the magnitude of the problem. For this reason, the analysis of the Park’s vector modulus is used to extract accurate information about the 70 BRB faults in the IM by monitoring the amplitude of the 2·s·fs signature in the PV modulus frequency spectrum. The obtained simulation and experimental results affirm the efficiency and the potential for extension to other faults of the presented methodology. The main limitation of the extended Park’s vector approach is that it fails to detect a BRB when the motor is unloaded or has a low load. Therefore, further studies should be carried out in order to improve the detection of the BRB, even with no load or a low load.

Author Contributions

Simulation, M.M.; writing—original draft preparation, M.M., A.F. and C.Z.E.-B.; writing—review and editing A.F., A.A.A., A.A., C.Z.E.-B. and A.F.; paper conception, A.F. and C.Z.E.-B.; project administration, L.S.; supervision, L.S. All authors have read and agreed to the published version of the manuscript.

Funding

This research received no external funding.

Acknowledgments

The authors would like to thank the Taif University for funding this work through Taif University Research Supporting, Project number. (TURSP-2020/277), Taif University, Taif, Saudi Arabia.

Conflicts of Interest

The authors declare no conflict of interest.

Nomenclatures

Abbreviations
BRBBroken Rotor Bar
CPEPVACombined Park’s and Extended Park’s Vector Approach
DWTDiscrete Wavelet Transform
EPVAExtended Park’s Vector Approach
FFTFast Fourier Transform
HMCSVHilbert Modulus Current Space Vector
HPCSVHilbert Phase Current Space Vector
IMInduction Motor
IMFIntrinsic Mode Function
LS-PMSMLine Start-Permanent Magnet Synchronous Motor
MCSAMotor Current Signature Analysis
MEMSMicro Electro Mechanical System
PVAPark’s Vector Approach
SCIMSquirrel Cage Induction Motor
Parameters and Variables
ias, ibs, icsThree-phase stator currents, [A]
ids, iqsQuadratic and direct stator currents components, respectively, [A]
ImaxMaximum value of the supply phase current, [A]
fsAngular supply frequency, [rad/s]
ωsOrdinary supply frequency, [s−1]
tTime variable, [s]
sMotor slip
ifMaximum value of the fundamental supply current, [A]
ilMaximum value of the current’s lower sideband component, [A]
iuMaximum value of the current’s upper sideband component, [A]
θfInitial phase angle for the fundamental supply current, [rad]
θlInitial phase angle for the current’s lower sideband component, [rad]
θuInitial phase angle for the current’s upper sideband component, respectively, [rad]

References

  1. Cardoso, A.J.M.; Cruz, S.M.A.; Fonseca, D.S.B. Inter-Turn Stator Winding Fault Diagnosis in Three-phase Induction Motors, by Park’s Vector Approach. IEEE Trans. Energy Conv. 1999, 14, 595–598. [Google Scholar] [CrossRef]
  2. Benbouzid, M. A review of induction motors signature analysis as a medium for faults detection. IEEE Trans. Indust. Electron. 2000, 47, 984–993. [Google Scholar] [CrossRef] [Green Version]
  3. Cruz, S.M.A.; Cardoso, A.J.M. Rotor Cage Fault Diagnosis in Three-Phase Induction Motors by Extended Park’s Vector Approach. Electric Mach. Power Syst. 2000, 28, 289–299. [Google Scholar]
  4. Nandi, S.; Toliyat, H.A.; Li, X. Condition Monitoring and Fault Diagnosis of Electrical Motors-A Review. IEEE Trans. Energy Conv. 2005, 20, 719–729. [Google Scholar] [CrossRef]
  5. Gu, F.; Yesilyurt, I.; Li, Y.; Harris, G.; Ball, A. An investigation of the effects of measurement noise in the use of instantaneous angular speed for machine diagnosis. Mech. Syst. Signal Proc. 2006, 20, 1444–1460. [Google Scholar] [CrossRef]
  6. Casimir, R.; Boutleux, E.; Clerc, G.; Yahoui, A. The use of features selection and nearest neighbours rule for faults diagnostic in induction motors. Eng. Appl. Artif. Intell. 2006, 19, 169–177. [Google Scholar] [CrossRef]
  7. Didier, G.; Ternisien, E.; Caspary, O.; Razik, H. A new approach to detect broken rotor bars in induction machines by current spectrum analysis. Mech. Syst. Signal Proc. 2007, 21, 1127–1142. [Google Scholar] [CrossRef] [Green Version]
  8. Messaoudi, M.; Sbita, L.; Abdelkrim, M.N. Faults Detection in Induction Motor via Stator Current Spectrum Analysis. In Proceedings of the ICEEDT’07 International Conference on Electrical Engineering Design & Technologies, Hammamet, Tunisia, 4–6 November 2007. [Google Scholar]
  9. Serrano, P.; Zamarrón, A.; Hernandez, A.; Ochoa, A. Artificial Neural Networks for Diagnosing Stator Induction Motor Faults. Res. Comput. Sci. 2008, 39, 251–262. [Google Scholar]
  10. Verucchi, C.J.; Acosta, G.G.; Benger, F.A. A Review on fault diagnosis of induction machines. Lat. Am. Appl. Res. 2008, 38, 113–121. [Google Scholar]
  11. Pezzani, C.M.; Donolo, P.D.; Castellino, A.M.; Bossio, G.R.; De Angelo, C.H. A new approach to the Park’s vector for broken bars and load oscillation diagnosis on IM. In Proceedings of the 2010 IEEE International Conference on Industrial Technology, Via del Mar, Chile, 14–17 March 2010; pp. 1221–1226. [Google Scholar]
  12. Messaoudi, M.; Sbita, L. Multiple faults diagnosis in induction motor using the MCSA method. Int. J. Signal Image Proc. 2010, 1, 190–195. [Google Scholar]
  13. Spyropoulos, D.V.; Mitronikas, E.D. Induction motor stator fault diagnosis technique using Park vector approach and complex wavelets. In Proceedings of the 2012 XXth International Conference on Electrical Machines, Marseille, France, 2–5 September 2012; pp. 1730–1734. [Google Scholar]
  14. Bacha, K.; Salem, S.B.; Chaari, A. An improved combination of Hilbert and Park transforms for fault detection and identification in three-phase induction motors. Int. J. Electr. Power Energy Syst. 2012, 43, 1006–1016. [Google Scholar] [CrossRef]
  15. Pires, V.F.; Kadivonga, M.; Martins, J.F.; Pires, A.J. Motor square current signature analysis for induction motor rotor diagnosis. Measurement 2013, 46, 942–948. [Google Scholar] [CrossRef]
  16. Sonje, D.M.; Chowdhury, A.; Kundu, P. Fault diagnosis of induction motor using parks vector approach. In Proceedings of the 2014 International Conference on Advances in Electrical Engineering (ICAEE), Vellore, India, 9–11 January 2014; pp. 1–4. [Google Scholar] [CrossRef]
  17. Gyftakis, K.N.; Cardoso, A.J.M.; Daviu, J.A.A. Introducing the Filtered Park’s and Filtered Extended Park’s Vector Approach to detect broken rotor bars in IM. Mech. Syst. Signal Proc. 2017, 93, 30–50. [Google Scholar] [CrossRef]
  18. Delgado-Arredondo, P.A.; Morinigo-Sotelo, D.; Osornio-Rios, R.A.; Avina-Cervantes, J.G.; Rostro-Gonzalez, H.; de Jesus Romero-Troncoso, R. Methodology for fault detection in induction motors via sound and vibration signals. Mech. Syst. Signal Proc. 2017, 83, 568–589. [Google Scholar] [CrossRef]
  19. Abd-el-Malek, M.B.; Abdelsalam, A.K.; Hassan, O.E. Novel approach using Hilbert Transform for multiple broken rotor bars fault location detection for three phase induction motor. ISA Trans. 2018, 80, 439–457. [Google Scholar] [CrossRef]
  20. Glowacz, A. Acoustic based fault diagnosis of three-phase induction motor. Appl. Acoust. 2018, 137, 82–89. [Google Scholar] [CrossRef]
  21. Singh, G.; Naikan, V.N.A. Detection of half broken rotor bar fault in VFD driven induction motor drive using motor square current MUSIC analysis. Mech. Syst. Signal Proc. 2018, 110, 333–348. [Google Scholar] [CrossRef]
  22. Ameid, T.; Menacer, A.; Talhaoui, H.; Azzoug, Y. Discrete wavelet transform and energy eigen value for rotor bars fault detection in variable speed field-oriented control of induction motor drive. ISA Trans. 2018, 79, 217–231. [Google Scholar] [CrossRef]
  23. Quiroz, J.C.; Mariun, N.; Mehrjou, M.R.; Izadi, M.; Misron, N.; Radzi, M. Fault detection of broken rotor bar in LS-PMSM using random forests. Measurement 2018, 116, 273–280. [Google Scholar] [CrossRef]
  24. Guven, Y.; Atis, S. Implementation of an embedded system for real-time detection of rotor bar failures in induction motors. ISA Trans. 2018, 81, 210–221. [Google Scholar] [CrossRef]
  25. Xie, Y.; Chen, P.; Li, F.; Liu, H. Electromagnetic forces signature and vibration characteristic for diagnosis broken bars in squirrel cage induction motors. Mech. Syst. Signal Proc. 2019, 123, 554–572. [Google Scholar] [CrossRef]
  26. Rocha, E.M.; Junior, W.; Lucas, K.E.; da Costa Júnior, C.T.; de Carvalho Júnior, J.G.; de Medeiros, P.; Nogueira, F.G. A fuzzy type-2 fault detection methodology to minimize false alarm rate in induction motor monitoring applications. Appl. Soft Comput. 2020, 93, 106373. [Google Scholar] [CrossRef]
  27. Kumar, P.; Hati, A.S. Deep convolutional neural network based on adaptive gradient optimizer for fault detection in SCIM. ISA Trans. 2021, 111, 350–359. [Google Scholar] [CrossRef] [PubMed]
  28. Yaman, O. An automated faults classification method based on binary pattern and neighborhood component analysis using induction motor. Measurement 2021, 168, 108323. [Google Scholar] [CrossRef]
Figure 1. Representation of the motor current Park’s vector and motor current Park’s vector modulus.
Electronics 11 00380 g001
Figure 2. Proposed flow chart of the CPEPVA.
Electronics 11 00380 g002
Figure 3. Park’s vector trajectories: (a) healthy motor and (b) motor with simulated BRB.
Electronics 11 00380 g003
Figure 4. Park’s vector trajectories: (a) healthy motor and (b) motor with one BRB (experimental result).
Electronics 11 00380 g004
Figure 5. Park’s vector spectrum: (a) healthy motor and (b) motor with simulated BRB.
Electronics 11 00380 g005
Figure 6. Park’s vector spectrum: (a) healthy motor and (b) motor with one BRB (experimental result).
Electronics 11 00380 g006
Figure 7. Experimental setup.
Electronics 11 00380 g007
Figure 8. Seeded BRB fault.
Electronics 11 00380 g008
Figure 9. Park’s vector spectra of a motor with BRB and under different load conditions: (a) unloaded motor, (b) under 20% of nominal load, (c) under 50% of nominal load, (d) under 70% of nominal load, (e) under 100% of nominal load, and (f) under 120% of nominal load.
Electronics 11 00380 g009
Figure 10. Influence of the load torque on the (a) amplitude and the (b) frequency of the 2·s·fs spectral components.
Electronics 11 00380 g010
Figure 11. Park’s vector trajectories of a motor with BRB and under different load conditions: (a) unloaded motor, (b) under 20% of nominal load, (c) under 50% of nominal load, (d) under 70% of nominal load, (e) under 100% of nominal load, and (f) under 120% of nominal load.
Electronics 11 00380 g011
Figure 12. Influence of the load torque on the thickness of the Park’s vector pattern of a motor with a BRB.
Electronics 11 00380 g012
Figure 13. Park’s vector spectra of stator current at nominal load and under different degrees of fault conditions: (a) healthy motor, (b) under 1% degree of fault, (c) under 2% degree of fault, (d) under 3% degree of fault, (e) under 4% degree of fault, and (f) under 5% degree of fault.
Electronics 11 00380 g013
Figure 14. Influence of the degree of faults on the (a) amplitude and the (b) frequency of the 2·s·fs spectral components.
Electronics 11 00380 g014
Figure 15. Park’s vector trajectories of a motor at nominal load and under different fault degree conditions: (a) healthy motor, (b) under 1% degree of fault, (c) under 2% degree of fault, (d) under 3% degree of fault, (e) under 4% degree of fault, and (f) under 5% degree of fault.
Electronics 11 00380 g015
Figure 16. Influence of the degree of the rotor fault on the Park’s vector pattern thickness. Based on results from Table 5.
Electronics 11 00380 g016
Table 1. The factors that can lead to rotor bar and end-ring breakage.
Main FactorsExamples of the Factors
Thermal factors:
  • hot spot
  • thermal aging and thermal overloading
Environmental factors:
  • moisture
  • contamination
  • oxidation
Magnetic factors:
  • asymmetry of electromagnetic forces
  • electromagnetic noises
Mechanical factors:
  • bearings defect
  • component fatigue
Dynamic factors:
  • centrifugal forces
  • axial oscillating torques
Residual factors:
  • fabrication problems
  • poor brazing of rotor bars with the end rings
Operating factors:
  • pulsating load
  • frequent switching operations
Table 2. Amplitudes and frequencies of the 2·s·fs spectral components under different load conditions.
Load Torque (%)0%20%50%70%100%120%
Amplitudes of 2·s·fs Sideband (dB)--74.8175.0275.8276.25
Frequencies of 2·s·fs Sideband (Hz)--0.91.31.82.2
Table 3. The thickness of the Park’s vector pattern of a motor with BRB and under different load conditions.
Load Torque (%)0%20%50%70%100%120%
Thickness of Park’s Vector Pattern (A)0.1880.4240.5380.590.6420.66
Table 4. Amplitudes and frequencies of the 2·s·fs spectral components at nominal load and under different degrees of rotor fault conditions.
Degree of Rotor Faults (%)0%1%2%3%4%5%
Amplitudes of 2·s·fs Sidebands (dB)-66.1474.4979.2182.3384.5
frequencies of 2·s·fs Sidebands (Hz)-21.91.81.71.6
Table 5. The thickness of the Park’s vector pattern of a motor at nominal load and under different degrees of rotor fault conditions.
Degree of Rotor Faults (%)0%1%2%3%4%5%
Thickness of Park’s Vector Pattern (A)00.3330.6421.0081.4151.757
Publisher’s Note: MDPI stays neutral with regard to jurisdictional claims in published maps and institutional affiliations.

