Article

Indoor Positioning System Based on Bluetooth Low Energy Technology and a Nature-Inspired Optimization Algorithm

1
Faculty of Logistics, University of Maribor, 3000 Celje, Slovenia
2
Faculty of Electrical Engineering and Computer Science, University of Maribor, 2000 Maribor, Slovenia
3
Faculty of Mechanical Engineering, University of Maribor, 2000 Maribor, Slovenia
*
Author to whom correspondence should be addressed.
Electronics 2022, 11(3), 308; https://doi.org/10.3390/electronics11030308
Submission received: 30 November 2021 / Revised: 6 January 2022 / Accepted: 14 January 2022 / Published: 19 January 2022
(This article belongs to the Special Issue Indoor Positioning Techniques)

Abstract

:
Warehousing is one of the most important activities in the supply chain, enabling competitive advantage. Effective management of warehousing processes is, therefore, crucial for achieving minimal costs, maximum efficiency, and overall customer satisfaction. Warehouse Management Systems (WMS) are the first steps towards organizing these processes; however, due to the human factor involved, information on products, vehicles and workers may be missing, corrupt, or misleading. In this paper, a cost-effective Indoor Positioning System (IPS) based on Bluetooth Low Energy (BLE) technology is presented for use in Intralogistics that works automatically, and therefore minimizes the possibility of acquiring incorrect data. The proposed IPS solution is intended to be used for supervising order-picker movements, movement of packages between workstations, and tracking other mobile devices in a manually operated warehouse. Only data that are accurate, reliable and represent the actual state of the system, are useful for detailed material flow analysis and optimization in Intralogistics. Using the developed solution, IPS technology is leveraged to enhance the manually operated warehouse operational efficiency in Intralogistics. Due to the hardware independence, the developed software solution can be used with virtually any BLE supported beacons and receivers. The results of IPS testing in laboratory/office settings show that up to 98% of passings are detected successfully with time delays between approach and detection of less than 0.5 s.

1. Introduction

Logistics is becoming an increasingly important activity globally, with an estimated annual industry value of EUR 5.73 trillion in 2020. The value has dropped since the beginning of the COVID-19 pandemic in 2020, but it is expected to rise to EUR 6.88 trillion by the year 2024 [1]. Intralogistics (internal logistics), including the warehousing processes, is one of the largest activities in Logistics, accounting for around 20.5% of the total Logistics market in 2018, indicating the strong importance of Intralogistics in the economy [2].
Intralogistics covers all technical systems, services and operations concerning the material and information flow inside production processes. Processes inside the Intralogistics domain are crucial to managing material and information flow along the whole supply chain, as they ensure reliable and predictable material and information flow [3]. Warehouses are important in the economy due to: (1) the uncoordinated in- and out-flow of goods, (2) the unpredictable dynamics in production and consumption, (3) the reduction of transport costs, and (4) to increase the level of satisfaction of end-users. The warehouse is the place where the processes of receiving, storing, ordering and dispatching goods are carried out [4].
Faber et al. [5] note that warehousing is a critical activity in the supply chain that can create a competitive advantage in terms of customer service, reduction of order-to-fill times, and cost. Today, most warehouses use WMS to ensure product traceability, which is the first step in organizing and optimizing warehouse operations.
A WMS is an IT solution that provides, stores, and reports the information necessary to manage the flow of material efficiently within a warehouse from the moment a request is issued to the execution of the delivery. The benefits of using a WMS include increased productivity, reduced inventory, better space use, error reduction, and better customer support, due to the traceability of products [5].
While WMS are sufficient in terms of controlling and organizing the warehouse itself and have a positive impact on the quality of the warehouse’s operation and performance, they often do not reflect the actual condition of the warehouse. The accuracy of the WMS data still relies on the human factor, as the data are processed manually (scanning the correct bar/Radio Frequency Identification (RFID) code associated with product and location, etc.) [6]. Products may have been deposited in the wrong place, or may have been booked incorrectly. The WMS status information itself is often incomplete, incorrect, or even misleading. A system that does not know the actual status can lead to incorrect commands, e.g., sending several workers with forklifts to the same place, where a collision or congestion can occur [7].
Therefore, those systems should be upgraded with advanced technologies that provide reliable and accurate information, mostly independent of the human factor. Halawa et al. [7] note that the latter is possible using Real-Time Location System (RTLS) technology, a subset of IPS. A large study has been examined, showing that the combined use of WMS and RTLS can improve the quality of the data obtained, improve the management of the warehouse, and overall improve warehouse safety and operational efficiency significantly. The authors also point out that several unique analyses could be performed based on the gathered data [7].
IPS work indoors, where satellite positioning systems (GPS, Galileo, Glonass) fail to provide (accurate) location of the subject in question. Furthermore, IPS technology can also be used for outdoor positioning, although the same technology used inside and outside may give different results [8]. IPS are used to determine the current location of (1) an object (e.g., a forklift truck), (2) an industry item (a tote or a pallet), or (3) a person (order-picker) in warehouse environments [9]. An IPS consists of transmitters located on the observed subject and a wireless signal reader that detects and reads the received signals. The location of transmitters and receivers can be swapped, which depends on the type of application. Various wireless technologies are used to communicate between transmitters and readers. The most popular are Ultra-Wideband (UWB), Wireless Fidelity (Wi-Fi), Bluetooth, light, and active/passive RFID systems [10]. Visible Light Communication (VLC) is gaining increasing attention, since its high data rate, security, no interference with Radio Frequency (RF) spectrum and high resolution [11] make it an appropriate choice for localization application.
By placing the reader in fixed positions within an environment (e.g., a warehouse), the location of mobile transponders can be determined by analyzing changes in signal properties (delay, attenuation, phase changes) and data exchange between the reader and the transponder [10]. Sophisticated mathematical and heuristic methods should be used to process highly unstable and noisy signals coming from the transmitters [12].
IPS that provide the information of location in real-time are called Real-Time Location Systems (RTLS). They are also being used increasingly in medical environments (tracking patients and seniors [13], expensive equipment [14]), large shopping malls [15], sports [16], etc. However, highly accurate RTLS, with localization error less than 20 cm, covering large areas, such as warehouses, are usually expensive and economically unfeasible for manually operated warehousing systems. Usually, such systems intended for high precision localization are based on UWB technology [10]. Piccinni et al. [17] demonstrated that accuracy of under 2 cm can be achieved using the Time Difference Of Arrival (TDOA) positioning technique coupled with Orthogonal Frequency Division Modulation (OFDM). A few-centimeter accuracy can also be achieved with VLC technology [18,19] on account of the more expensive hardware and computational setups. However, as a drawback of VLC technology, constant line-of-sight (LOS) is necessary for correct operation, coupled with the demand that light sources must stay on all the time [20].
A more cost-effective solution that still provides enough information about subject location can be realized with technologies like Wi-Fi and Bluetooth. However, Wi-Fi and Bluetooth technologies are less appropriate for accurate localization, due to heavy influences from electromagnetic (EM) sources, causing interference to signal properties [21,22,23].
Several attempts have been made to reduce the localization error of the Bluetooth RTLS, yet none of them reduced the localization error to less than 1.5 m in the warehouse environment [9].
This paper proposes a prototype of IPS, based on BLE technology. The proposed solution does not provide accurate real-time location of the observed subject at any time, but instead records passings, or arrival signals, at the BLE transmitter area in real time. It eliminates the need for the expensive hardware needed for accurate localization associated with UWB technology and the complex setup related to Wi-Fi technology. In addition, direct LOS is not necessary, contrary to VLC technology. Compared to RFID technology, it uses far less energy and is easier to operate, due to the absence of large external antennas associated with passive RFID systems. In addition, the Bluetooth transmitter(s) and the reader(s) can be battery powered.
The proposed IPS is capable of accurate event detection used for providing near real-time data of subject movement in manually operated warehouses (e.g., smaller retail businesses). Using the developed solution and additional analysis of the acquired data, more efficient order-picker routes, material flow analysis, order-picker congestion, and overall efficiency can be achieved. Accurate event detection is achieved using a Nature-Inspired Optimization Algorithm (NIA) for setting a near-optimal threshold for a measured data filter, which eliminates all measurements below the set threshold. The system is designed to be as automatic as possible, with very few parameter settings. The user is guided through the process of calibration using a straight-forward graphical interface. All the developed code is available upon user request, as the proposed IPS is merely a framework that can be adapted freely to meet specific user requirements.
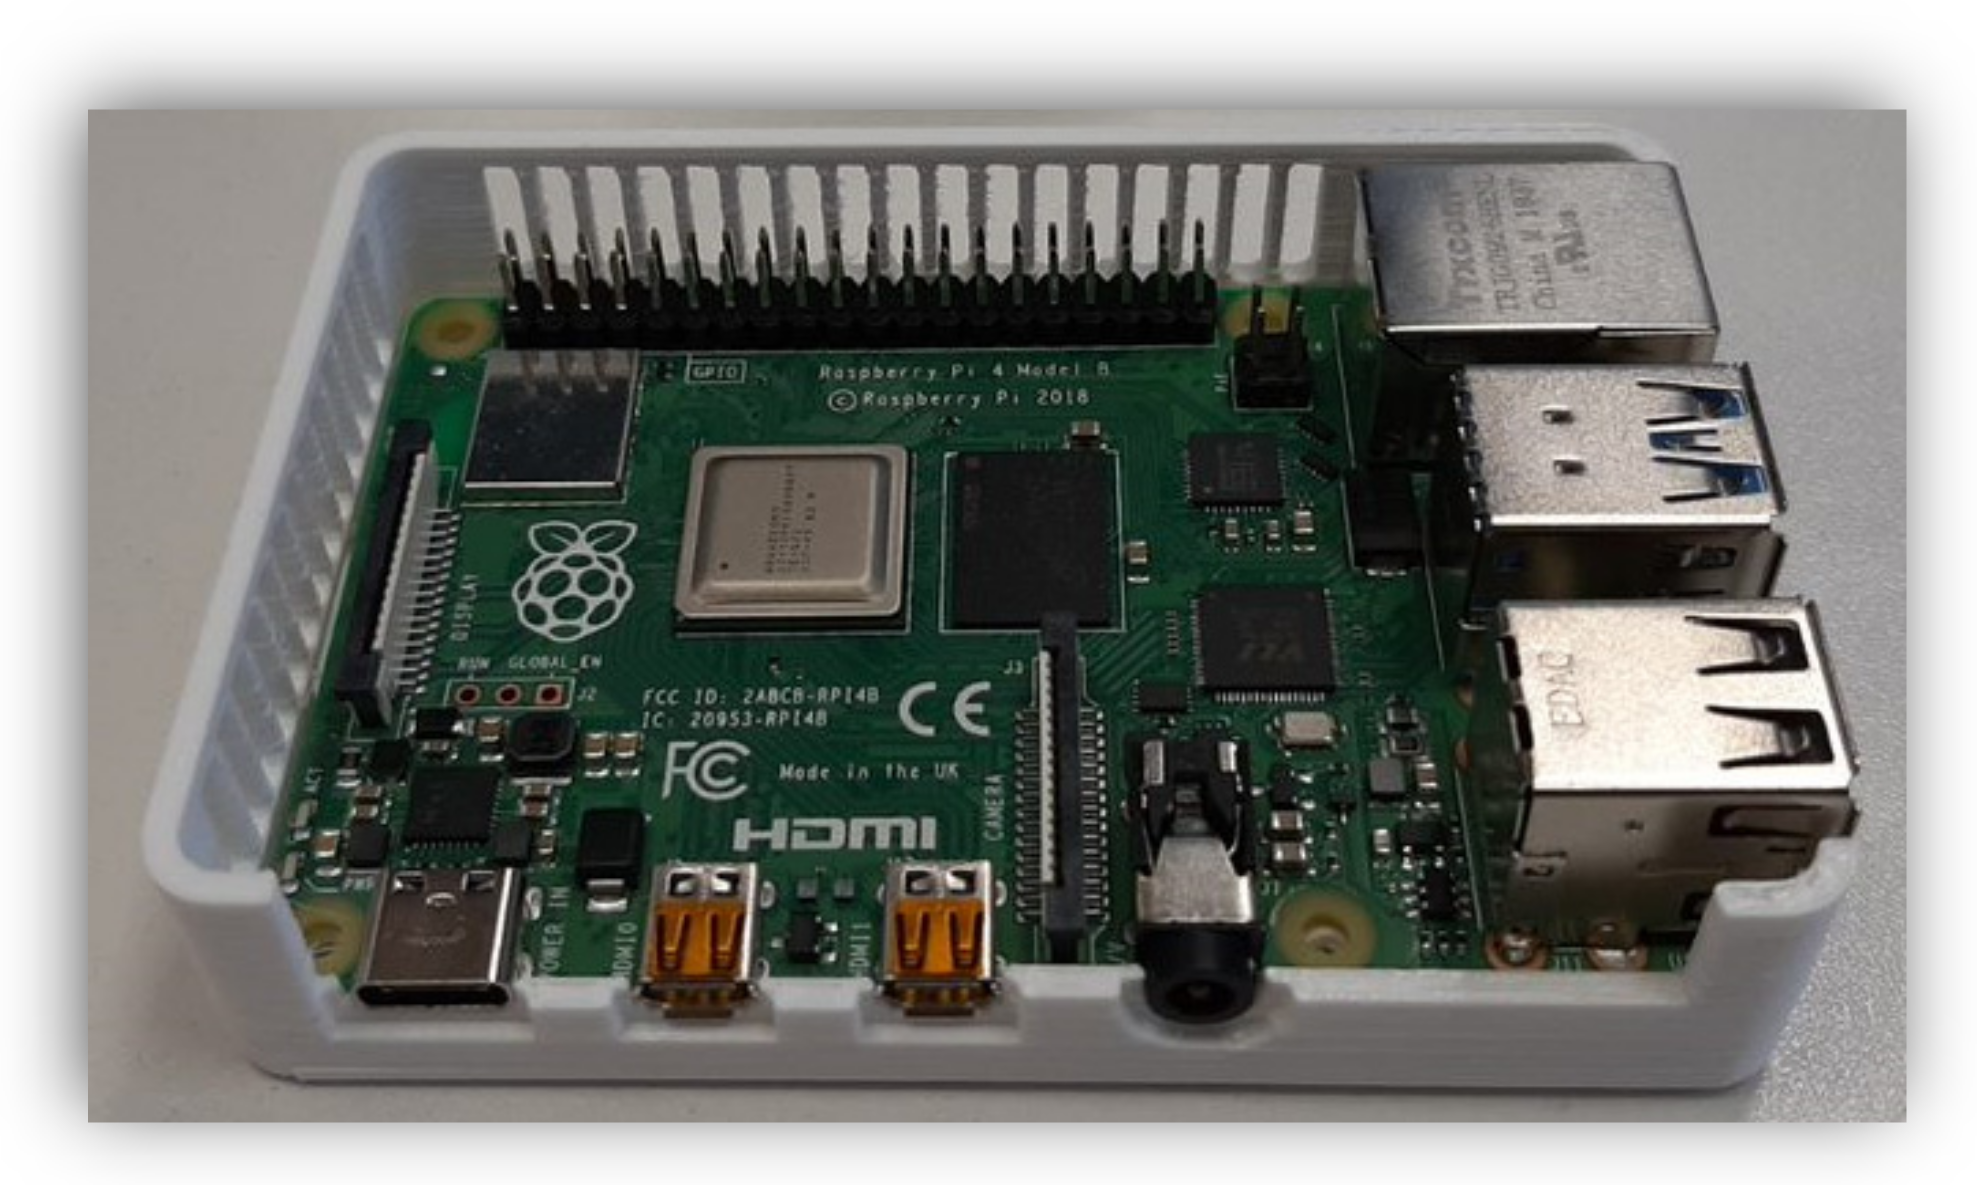
The authors expose four major contributions to the field of Bluetooth-based IPS: (1) an automatic calibration system that requires only a small intervention due to the automatic peak finding procedure using the Particle Swarm Optimization (PSO) algorithm, (2) accurate event detection with a very low false detection rate, (3) simple implementation of the peak detection procedure, capable of running on low-power hardware (such as Raspberry Pi), and (4) decentralized architecture, which allows data to be processed locally, and, consequently, there are no server costs. Only a final location and timestamp are posted into the database.
The paper is organized as follows. A general overview of BLE-based IPS and state-of-the art of related solutions is provided in Section 2. Emphasis is placed on BLE-based IPS used especially in warehouse environments. In addition, a short overview will be provided of NIAs used in improving IPS technology. The software and hardware setup of the proposed system is presented in Section 3. The PSO algorithm for determining optimal threshold value for the measured data filter, programmed in MATLAB, will be discussed, along with the used evaluation protocols and layout of the testing area. The results of the proposed IPS in three-fold tests are presented in Section 4: (1) processing time evaluation, (2) beacon calibration tool evaluation, and (3) IPS real-time localization accuracy. In conclusion, pointers are provided to future work.

2. Literature Review

2.1. BLE Indoor Localization Systems

Bluetooth-based IPS became widespread with the introduction of the Bluetooth 4.0 BLE Standard in 2009 [24]. Since then, the specifications of the Standard have allowed more advanced use of the technology for localization purposes by introducing a new type of devices called “Bluetooth beacons”. Unlike the devices that used the previous Standards, the new ones have the option of transmitting at set intervals, which contributes significantly to the energy efficiency of the system, while also improving the hardware and the immunity to interference.
Generally, Bluetooth-based IPS are-based upon manipulation of Received Signal Strength Indicator (RSSI) information. Those systems fall into three categories by the technique that is used for localization: (1) distance-based, (2) fingerprinting-based and (3) probability estimation techniques [25]. Determining distance from the well-known log-normal propagation model is challenging due to the noise, reflection, and multi-path effect of the RF signal. Theoretically, up to 10 cm accuracy can be achieved at distances between beacons and anchors less than 1 m in low noise environments, with both components being in the same horizontal plane [26]. However, as the distance between the components rises, the RF signal gets distorted, and the accuracy drops significantly. Those influences can be reduced successfully by implementing various filters, most commonly used are variations of the Kalman Filter [27] and Particle Filters [25]. Fingerprinting usually requires a calibration pre-operation, which can take tremendous time and effort; however, if done properly, it can achieve a positioning error of less than 1 m, especially if fused with other sensor data [28]. Frequently, this process requires to be repeated after some time, due to the changes in environment. Probability estimation techniques require proper parameter settings to work as expected [29].
Our work does not fall directly in any of the above categories, since only events linked to location in space are detected. However, since the log-normal model is used passively, distance-based techniques are the closest related.
Localization techniques based on RSSI usually face great positioning errors or difficult parameter settings, which can be reduced successfully by combining them [30]. Since many new smartphones already have built-in Bluetooth capabilities, several authors are experimenting with those devices [31], which reduces the need for additional hardware. Inertial Measurement Units (IMUs), such as accelerometers and gyroscopes, are usually also present, and are combined successfully with the Bluetooth capabilities [32].
Xu et al. [28] presented an IPS which combines the fingerprinting-based RSSI techniques with pedestrian dead reckoning (PDR). The fingerprinting method was improved by using robust filter, and the PDR was improved by using a Mahony complementary filter, which reduced the drift error. Their experiments, which were performed using a smartphone and several BLE beacons, showed mean positional accuracy of around 0.8 m. Dinh et al. [33] proposed a novel IPS based on BLE beacons with a low RSSI rate and smartphone sensors. They employed the distance-based technique, which fuses least-squares-estimation-based positioning together with PDR using a Kalman Filter. Their work also includes a study of how velocity affects the accuracy of the system. The accuracy of the system is around 1.1 m for a walking target, compared to 1.6 m for a running target. Bai et al. [34] presented an IPS that can be used for tracking elderly people. They proposed a trilateration and fingerprinting method and compared the results. They used the grid-based and location-of-interest-based fingerprinting classification method with five different classifiers. Using the above method, they achieved over 90% accuracy in determining the location of interest successfully, even with low-cost sensors. Ho et al. [35] proposed a decentralized positioning method that does not require a manual training stage before deployment, but instead takes place on the fly. The anchor nodes broadcast and receive signals from other anchors simultaneously, for which the anchor operation must be modified. An average error of 1.5 m was achieved in the best-case scenario. Shen et al. [25] presented a Particle Filter-based IPS that has been tested on commercial off-the-shelf devices (smartphones). Experiments have been conducted in a 5.4 m × 4.95 m area with four anchors, and compared with conventional trilateration and two approaches proposed by them in previous papers. They achieved a median accuracy of 1.16 m. Serhan et al. [36] proposed an adaptive Sequential Monte Carlo filter (SMC), which is applied to the fingerprinting technique in a 17 m × 20 m open office area. Twelve BLE receivers, based upon Raspberry Pi, are used for receiving the advertisement data. A single smartphone transmitter moves around the office area, whereas their IPS models the motion of tracked objects, having no prior information about their movement. The positioning error rate in the worst-case scenario was around 3.15 m. Lie et al. [37] proposed a coarse-to-fine fingerprint-based algorithm for location detection. Weighted sum and k-nearest neighbors with three different weight calculations are used in the coarse location estimation. In the fine-tuning step, the delta rule is used for the single-layer neural network to update the coordinates of reference points. Experiments were conducted in two rooms, a classroom of 4 m × 6 m and a lecture room of 19 m × 12 m. The proposed fine-tuning algorithm improved positioning accuracy by up to 15.8%, with a mean positioning error in first room of 0.87 m to 1.54 m in the second, respectively. Yang et al. [38] proposed a heading estimation solution that is based on fusing a smartphone built-in motion sensor, magnetometers, building map knowledge and fingerprinting coarse position from Wi-Fi or Bluetooth using an Extended Kalman filter. The system was tested in a building complex (mainly corridors), which showed that the sensor fusion reduced positioning errors from 3.57 m to 0.9 m. Assayag et al. [39] proposed a dynamic model estimation IPS solution that uses dynamic parameters estimated based on the location of the sent signal. For each anchor, a different propagation model (path loss exponent) is used as the basis for distance and position calculation. They also used a novel best anchor selection procedure. The IPS requires a kind of training phase, which is supposedly shorter than by fingerprinting techniques. The experiment was done in a 43 m × 15 m area with 15 anchor nodes. The positioning error decreased by around 17% to 3 m, compared to the fixed model-based IPS.
Specifically in warehousing, two major contributions have recently been made in the field of BLE-based IPS. Zhao et al. [40] developed an IPS that tracks assembled forklifts in the warehouse. The authors used Bluetooth transmitters, which were placed in a bag attached to each forklift truck. They automated the data acquisition process, so they placed receivers (Raspberry Pi) on the ceiling above the forklifts, reporting whether a forklift is stored in that sector. The case study was conducted in a real warehouse, but since the forklifts only move around the warehouse sectors and the receivers are stationary, the problem is relatively straightforward. Li et al. [9] developed an IPS solution based on BLE technology to be used in warehousing environments. Its architecture can be divided into two parts: The Internet of Things (IoT) framework and the localization module. Localization is performed based on trilateration, but a novel LSTM distance estimator is used, due to the heavy inaccuracies which come from using the log-normal propagation model. Several self-adaptive mechanisms have also been used to increase localization accuracy–elastic radius intersecting, multiple weighted centroid localization, and a variant of the Kalman filter. The system has been tested in an ideal lab environment and Alibaba’s large-scale warehouse. In the first scenario, around 0.9 m localization accuracy was achieved and 1.5 m in the second, respectively.

2.2. Nature-Inspired Algorithms in Indoor Positioning Systems

NIAs are a type of optimization algorithms inspired by natural phenomena [41]. Their basis is the maintenance of a population of solutions, which, through different variation operators, change the values of individual elements to improve the quality of the current individuals. In each generation, the population of current individuals (parents) competes with a new generation (offspring), and, by eliminating the worst individuals, we get the best possible population of survivors, which enter the next evolutionary cycle [42]. A measure of how well our individuals have adapted to a specific problem is the evaluation function.
Algorithms, according to their principle of operation in nature, are divided into three major groups [41]: Evolutionary Algorithms (EAs), Swarm Intelligence (SI)-based algorithms, and others. The first group is based on Darwinian natural selection [43], while the second group is based on the behavior of living things living in swarms (e.g., flocks of birds, bees, bats). Other algorithms mimic processes that we find in Chemistry, Physics, and even social sciences such as Sociology. EAs date back to the 1970s, and, because of their longer history, are also slightly more developed. Each of the different types of EAs consists of the following components [43]: initialization, parental choice, recombination, mutations, evaluation functions and, lastly, choice of survivor(s).
Several popular NIAs are used today: Evolution Strategies (ES) [44,45], Differential Evolution (DE) [46] and its self-adaptive variant jDE [47], Particle Swarm Optimization (PSO) [48], Bat Algorithm (BA) [49], and others.
Several IPS technology applications have been enhanced using various NIAs. However, PSO has been used extensively, due to its simple formulation and fast execution [50]. Li et al. [51] presented an improved algorithm method for localization based on RSSI. Based on the collected samples of the RSSI, a Neural Network (NN) has been learned to approximate the relationship between the received power and the distance to the node. The PSO algorithm is used to prevent the NN from being trapped in the local optimum. Tomažič et al. [52] developed a sophisticated IPS which combines visual-inertial tracking and Bluetooth technology. PSO is used to find the position of the smartphone (particle) in a 2D space, for which a corresponding vector of signal strengths, obtained by a constructed path loss model, is the most like the vector of current measurement according to their objective function. Several other authors have also used PSO algorithms to improve localization accuracy and reliability [53,54].
Compared to the related works, our system is superior in terms of its shorter pre-operation training phase compared to systems which use fingerprinting-based localization techniques. The system scales easily with greater areas, as the localization accuracy is directly dependent on the number of anchors and not the area itself. In addition, no specific measurements at exact locations are needed, such as the determination of the path loss exponent, necessary for distance-based localization techniques, instead only passing by a beacon. Furthermore, the calibration process is almost entirely automated. Since we are limited to the points of interest, training only takes place in areas near the beacon instead of the whole area. As most of the related works are interested in providing an accurate location of the whole area, we cannot compare our system’s accuracy directly to theirs. The closest work to ours is that of Bai et al. [34], which discusses obtaining a presence for the location of interest (e.g., kitchen, bathroom, bedroom) in elderly homes, which shows >90% accuracy. Furthermore, no modifications of beacons or receivers are necessary. For larger-scale operations, only the software, containing a localization engine, must be distributed to a specific number of subjects to be monitored and beacons placed to the point of interest (POI).

3. Sensor System for the Application of IPS in Intralogistics

The proposed prototype IPS is composed of multiple hardware and software solutions, which are explained in detail in the following sections. The prototype hardware consists of multiple BLE transmitters, called beacons, and a Raspberry Pi microcomputer, acting as a receiver. A single beacon must be used for every POI. The software part consists of several developed software solutions written in the programming language Python and MATLAB.

3.1. Experimental Setup—Hardware

3.1.1. Bluetooth Low Energy Beacons

BLE beacons are small electronic devices that transmit messages periodically [55] in the form of RF waves in the ISM band at a carrier frequency of 2.4 GHz [56]. To detect nearby devices and receive data, it is necessary to use a communication module that supports BLE technology with a Bluetooth version equal to or higher than the one used on the transmitting side. Unlike Wi-Fi transmitters, which also transmit in the ISM band, BLE devices use only three advertising channels (37, 38, 39) and 37 data channels (0–36) spaced 2 MHz apart to prevent interference [57]. This also reduces power consumption, as only three channels need to be checked, so they are typically powered by cell batteries and have a lifetime of up to several years. Frequency hopping technology is used to transmit data so that BLE advertising moves randomly between the channels and sends short packets of data [58]. As noted by Huang et al. [59], BLE beacons usually broadcast on three different channels, which means that the RSSI information is channel dependent. The authors in [59] showed that the positioning error could be reduced by around 33% using a single channel advertising approach for the distance-based technique. The single-channeled operation is preferred, as Assayag et al. [39] noted, since up to 50% of packets got lost due to the multi-channel operation in their experiment. However, not all beacons (also the ones used in the experiment) have that capability.
The advertised data are configured using the associated software provided by the beacon manufacturer before they are put into operation. Some transmitters can transmit multiple different data packets sequentially from the same devices, which is known as packet interleaving [60]. Data packets have a simple structure consisting of an address, a data frame, and a Cyclic Redundancy Check (CRC). The data frame can be customized, since the Bluetooth SIG has not specified it. In practice, three main protocol implementations are used, iBeacon (Apple), Eddystone (Google) and AltBeacon (Radius Networks) [61]. For our localization purposes, the selected beacon advertisement protocol is arbitrary. Only the transmitter’s Universally Unique Identifier (UUID) or Media Access Control (MAC) address is required for unique identification, along with the RSSI. In addition, some beacons measure battery status and room temperature, which is included in the data frame as an additional feature.
In our experiments, six BLE beacons Smart Beacon SB16-2 were used, shown in Figure 1. The original batteries were replaced with a single cell CR2477 battery, and the PCB was placed in a smaller 3D-printed case to reduce size further. The Smart Beacon SB16-2 specification is presented in Table 1.

3.1.2. Raspberry Pi Microcomputer

The main algorithm runs on a credit-card-sized Raspberry Pi 4 (8 GB) microcomputer (Figure 2). Featuring a quad core 64-bit processor, it is possible to run quite complex algorithms that would be exceedingly difficult to run on a standard microcontroller. The onboard Bluetooth and Wi-Fi connectivity mean that no additional hardware is required to perform localization algorithms and upload the acquired data to the online database. However, we found that using an external Bluetooth receiver improved localization accuracy significantly. Therefore, two different Bluetooth USB adapters were used for localization purposes: (1) Trust Manga Bluetooth 4.0 USB; and (2) LM Technologies LM1010 with external antenna. The specifications for both adapters are presented in Table 2.
Raspberry Pi also features GPIO pins, which can be used to connect additional sensors, actuators, or other devices. Due to its relatively low current consumption, Raspberry Pi can be powered using a 5 V USB Power Bank. Coupled with the Raspberry Pi’s portable size, it is suitable to be carried around by a subject or placed on the subject to be tracked. The Raspberry Pi 4 (8 GB) technical specifications are presented in Table 3.
The main task of the Raspberry Pi microcomputer is to receive and process messages (advertisement data), which are transmitted by BLE beacons. There are only two essential pieces of information from the received message: (1) the BLE beacon’s MAC address; and (2) RSSI. The latter is a measure of the portion of the received power sent from the BLE beacon. Based on the RSSI metrics, a rough estimation of the distance between transmitter and receiver can be determined from the log-normal propagation model. The model is defined with Equation (1) [67]:
p r ( d ) dB = p ¯ r ( d 0 ) dB 10 · n · log ( d d o ) + χ ,   d   >   d 0 ,
where p r ( d ) dB is the received power at distance d from the transmitter (also RSSI), p ¯ r ( d 0 ) dB is the average of all possible transmitted powers at reference distance d 0 , n if the power loss coefficient, χ is Gauss’s random variable with mean 0 and variance δ χ 2 describing random shading effects. p ¯ r ( d 0 ) dB is calculated based on Equation (2):
p ¯ r ( d 0 ) dB = p t   p d 0 ,
where p t is transmitter power and p d 0 is the power loss at reference distance (1 m). p d 0 is obtained via measurement, or calculated from power loss in the free space formula in Equation (3) [68].
p d 0 = 20 log 4 π d 0 λ ,
where λ represents the wavelength of the transmitted EM waves, c is the speed of light and f the signal carrier frequency.
The propagation model considers a shading whose random variable has a Gaussian (normal) distribution, hence the name log-normal. Our application; however, does not use any of the above Equation directly, but simply observes the rising and falling of the RSSI values during a person’s movement.

3.2. Experimental Setup—Software

Software for indoor localization is divided into three parts, each running on its own platform. MATLAB runs on a Windows PC and is used for non-real-time CPU-intensive algorithms. Raspberry Pi runs a Raspbian operating system for localization algorithms, which are developed in Python. It involves BLE detection, signal processing and evaluation algorithms, which run on multiple threads in soft-real-time. BLE detection is based on the “bluepy” Python library, developed by Ian Harvey [69]. Google Spreadsheets API [70] is used as a database for detected user passing by the BLE beacons. Python user code, used for visualization, runs cross-platform and parses data from the Google Spreadsheets. Each of the mentioned pieces of software will be discussed in detail according to the phases of use: (1) the calibration phase, (2) the real-time detection phase and (3) the post-processing phase, as shown in Figure 3. The real-time detection phase and post-processing phase are intertwined and co-dependent–namely, data from the real-time detection phase are needed to perform the post-processing (visualization) phase.

3.2.1. Calibration Phase

The calibration phase is necessary to optimize the value of the measured data filter threshold used in the localization phase to ensure accurate detection of passing by the BLE beacons. The EM signals emitted from the beacons are susceptible to noise, therefore, raw RSSI measurement data must be filtered and processed properly for accurate peak detection and to suppress false detections. Only raw, unfiltered data are saved and fed into the objective function, which must determine the correct threshold value to achieve the best signal-to-noise ratio (SNR) to enhance real-time detection capabilities. Therefore, a person carrying the receiver of the IPS must determine the time correctly and exactly when they pass a BLE beacon. The acquired measurements (RSSI values and timestamps) are imported into MATLAB, which performs the calibration procedure (Figure 4).
During the calibration phase, six to eight separate measurements of BLE beacons (six to eight RSSI samples) are captured under specific conditions, as described in “Measurement protocol”. Whenever a person carrying a Raspberry Pi walks perpendicularly by the beacon at the fixed distance, the mouse button must be pressed. Captured data are zipped and saved to the web service for post analysis, where MATLAB reads it. The data are interpreted using MATLAB and the task of finding the optimal threshold value is performed, to ensure that peaks are not filtered out and no additional false positives are included. To find the best threshold value of the measured data filter, the objective function is expressed as:
f = n peak     n det · f 1   + n miss ( 1 f 1 )
where n peak is the number of actual peaks, n miss the number of miss-detected peaks, n det number of detected peaks and f 1 a measure of sensitivity.
The PSO algorithm is used to minimize the objective function. As in one of the previous studies [50], the main author found that the PSO is easy to implement, has rather simple parameter settings, and uses computing resources efficiently. In addition, the PSO proved to be superior in terms of convergence speed, meaning less evaluations needed and faster execution speed for the optimization process.
The PSO algorithm was developed by Ebenhard and Kennedy in 1995 [48]. It is based on the behavior of certain species of animals or insects that live in groups (e.g., flocks of birds or fish). An individual within a population is called a ‘particle’ and represents a potential solution to a problem. The particles travel virtually through the search space. Each particle has two parameters, i.e., position and speed. The better the solution, the better the value of its evaluation function. Particles pass through space and move the solution to follow the best particle at the moment. The PSO also uses memory, as it stores the global best particle in addition to the local best particle. In our paper, we used the so-called canonical PSO, which is a simplification of the original PSO. Best local particle (local best) is the best position a particle can reach within a given number of iterations.
The global best represents the best solution found by the algorithm up to a certain optimization stage.
To find the best local and global values for a particle, its velocity must be calculated, followed by the new particle position according to the following equations [71]:
v ( k ) i = C 0 · v ( k 1 ) i + C 1 · rand ( 0 , 1 ) · ( g ( k ) x ( k ) i + C 2 · rand ( 0 , 1 ) · ( p ( k ) i   x ( k ) i ) ,
x k + 1 i = x ( k ) i   + v ( k ) i
The rand (0,1) function calculates a random value between [0, 1]. The constant C 0 represents the weighting factor of the particle velocity value from the previous iteration and represents the inertia of the particle motion. Usually, the value of C 0 is between 0 and 1 (the best values are just below 1). Constants C 1 and C 2 are learning constants and usually take the value 2. The constant C 1 represents the amount of knowledge or the experience acquired by the particle itself, and C 2 the knowledge acquired by the swarm [72]. The pseudocode of the optimization procedure, containing PSO optimization, is expressed in Algorithm 1.
Algorithm 1 FindOptimalThreshold
1:
 Initialize best_global_fitness.
2:
 Initialize population consisting of i particles with random position between [min, max].
3:
 Initialize generation consisting of j populations.
4:
 for each particle in population do
5:
  Calculate number of actual and miss-detected peaks with particle_position.
6:
  Calculate fitness function best_local_fitness.
7:
  best_local_solution = particle_position (i)
8:
   if best_local_fitness (i) < best_global_fitness then
9:
     best_global_fitness = best_local_fitness (i)
10:
   best_global_solution = best_local_solution (i)
11:
  end if
12:
 end for
13:
 for each population in generation do
14:
  for each particle in population do
15:
   Calculate new particle velocity new_particle_velocity.
16:
   Calculate new particle position new_particle_position with new_particle_velocity.
17:
  Calculate number of actual and miss-detected peaks with new_particle_position.
18:
  Calculate fitness function local_fitness.
19:
   if local_fitness < best_local_fitness (i) then
20:
     best_local_solution (i) = new_particle_position (i)
21:
     best_local_fitness (i) = local_fitness
22:
   end if
23:
   if local_fitness < best_global_fitness then
24:
     best_global_solution = new_particle_position (i)
25:
    best_global_fitness = local_fitness
26:
   end if
27:
  end for
28:
 end for
29:
 optimal_threshold = best_global_solution
30:
 return optimal_threshold
Due to the number of PSO evaluations used in the process of optimization for each beacon ( n fes = 500 ), the optimal threshold value is calculated on the PC instead of Raspberry Pi. Namely, for each separate beacon, a calibration must be performed to ensure optimal detection and false positives’ rejection. The calibration process takes place in a MATLAB App Designer-developed app, which guides the user visually through the entire calibration process (Figure 5). The app graphical user interface (GUI) is user friendly, intuitive, and the calibration process is almost entirely automatic. However, due to the fluctuations of measurements, sometimes the thresholds should be finely adjusted manually by the user. Of course, before the system is used in a final application, the thresholds must be validated accordingly.
The sensitivity measure (Figure 5) adjusts the weighting factor f1 of the fitness function f; values closer to 1 favor thresholds that may have multiple false detections, but also discover higher numbers of peaks, contrarily, values closer to 0 favor thresholds which eliminate false detections but can also filter out actual detected peaks. The number of samples adjusts the interval of where the peaks are supposed to be. Lower values tighten the interval, which prevents multiple detections, but can also suppress actual peaks. The number of generations (nGEN) adjusts the number of generations (and, consequently, evaluations) for the PSO algorithm–higher numbers usually improve solutions to some extent, although they take longer to complete.
The optimization process is presented graphically in Figure 6. First, a PSO test population (swarm) is initialized. In the initial population, particles are initialized randomly, with values between [min, max]. Next, all measurements of the specific beacon are processed using a measured data filter, with the value of the test individual contained in the population. If the average of the last three measurements of a single beacon is higher than or equal to, the set measured data filter threshold, it is ready for the next phase of filtering. In the second phase, raw values are first processed using the measured data filter, followed by a simple moving average (SMA) filter with five samples (Equation (7)).
SMA k = 1 k i = n     k + 1 n p i ,
where k represents the number of data points (filter window) and n the number of samples.
Lastly, two Exponential Moving Average (EMA) filters are used on the SMA processed values (Equation (8)) [73], first with a window size of w1 = 3, and second with a window size of w2 = 4. EMA smoothing with two different window sizes is used for approximate peak detection. This is done by subtracting the calculated EMA filter value with window size w1 = 3 from the value with window size w2 = 4.
S t = α y t 1 + 1     α S t     1 ; 0   <   α     1 , t     3 ,
where S i is a smoothing observation, y an original observation, and α a smoothing constant.
The results of the two EMA values are then subtracted. For a peak to be detected in processed measurements three conditions must be met:
(1)
The difference between the two EMA values falls between the fixed value (typically <1.0 and >−1.0),
(2)
The first EMA value is equal to or higher than the threshold value carried by the current individual,
(3)
The second EMA value is lower than the fixed value.
If the peak is detected it is written to a vector containing peaks. Detected peaks are compared twofold to the measured (set) peaks during the calibration phase. First, the algorithm searches for exact matches, and second, it searches in the search interval of the set click, provided by the user. The calculated peaks are expected to be delayed compared to the measured (set) due to multiple filtering of the measurements beforehand. Then, the fitness function is calculated, according to Equation (4). Particles (threshold values) which find the most actual peaks and least peaks that should not be present, are ‘awarded’ with the lowest value of the fitness function. The best value for a measured data filter carried by an individual continues into stage two of the PSO optimization, where initial particles are modified, and the entire process described above is repeated from the beginning until a set number of evaluations is reached. The best individual with the lowest fitness function value is recognized as the best solution to the problem, and is saved for the real-time detection phase.

3.2.2. Real-Time Detection Phase

The real-time detection phase is implemented on Raspberry Pi to use available computing resources efficiently, namely, all the processing takes place locally except writes into the database.
The algorithm running on Raspberry Pi is divided into three categories: (1) detection, (2) signal processing, and (3) data evaluation and posting. As can be noted from Figure 7, several steps in the calibration/PSO optimization process are identical, so that the calibration and real-time detection phases should return the same results.
The system’s main component, Raspberry Pi, attached to the person, scans the nearby surroundings for any present beacon with a predefined MAC address. After the scan cycle has been completed, the system first filters out measurements which returned the value ‘None’ and replaces them with a fixed negative number (−100). All beacons which are not recognized by the system are eliminated automatically and have no effect on measurements. Next, the measurements of each beacon are processed using the measured data filter with their corresponding threshold, set in the calibration phase. If the average of the last three measurements of a processed beacon is higher or equal to the set measured data filter threshold, we assume that the person carrying the receiver is in the vicinity of a beacon and is ready for the next phase of filtering. In the second phase, thresholded values are processed with a simple moving average (SMA) filter (Equation (7)) with five samples, followed by an EMA filter calculation (Equation (8)). Values first processed with SMA are processed further with the EMA filter with a window size of w1 = 3, and secondly with a window size of w2 = 4, but not sequentially. Similarly to the calibration process, for a peak to be detected in the processed measurements, three conditions must be met:
(1)
The difference between the two EMA values falls between the fixed value (typically <1.0 and >−1.0),
(2)
The first EMA value is equal to or higher than the threshold value carried by the current measurement,
(3)
The second EMA value is lower than the fixed value.
Only the selected number of beacons (six in our example) are processed simultaneously in the second phase, to prevent overly long processing times. Additionally, we work under the assumption that the person carrying the IPS receiver cannot be in the near vicinity of more than six beacons at a time, and that the beacons are spaced apart appropriately.
Once a passing-by event is detected, a routine is triggered for writing the event into the Google Spreadsheets database. The beacon ID, along with a timestamp, is posted to the database, which is retrieved in the visualization and analysis phase. If a new event from the same beacon is triggered in less than 2.0 s after the first event, it is considered that multiple detections occurred, and only the first event is written into the database.
The localization engine on Raspberry Pi runs on multiple threads to distribute the processing load evenly. The first core takes care of BLE beacon scanning with identification and rejection. The data from the first thread are fed into the second thread, where filter calculations and peak detection take place. Finally, the third thread waits for the information on possible new peaks, and writes the received data into the web database. The process of real-time detection and database writes run in separate threads, therefore ensuring that the writing to the database does not interfere with the real-time detection procedure.

3.2.3. Visualization and Analysis Phase

The last phase of the IPS procedure is visualization and analysis of the captured data. The data are parsed from the Google Spreadsheets document into the Python-based graphical user interface (GUI), shown in Figure 8. The GUI shows a map of the observed test area and plots points with a timestamp. Prior to on-line localization, the operator must enter the physical locations of the set-up beacons. The newest location data are displayed in green, whereas the oldest known locations in red. Visualization takes place in soft-real time, and the graphics are updated as soon as a new event takes place. Lines are drawn between the nodes, which represent movement between known locations. The accuracy of localization inside the area of question depends on the number of beacons positioned in the localization area.

3.3. Testing Area

To evaluate the operation of the proposed IPS, an office/laboratory setting was selected to simulate the tracking of a manually operated warehouse scenario.
The results of the experimental work for the office/laboratory setting were acquired in the Laboratory for Cognitive Systems in Logistics at the Faculty of Logistics. Three scenarios were chosen featuring six beacons. The beacons were put in front of the selected stations to be monitored, as shown in Figure 9: (1) computer workstation, (2) 3D printer, (3) roller conveyor transporter, (4) robot cell worktable, (5) guided assembly worktable, (6) office desk.
In the first scenario, the person walks between those beacons in a clockwise direction. In the second, travelling takes place in a counterclockwise direction, and in the third, randomly between the stations. Table 4 shows the beacon number, ID, coordinates and height, and Figure 10 the layout of the Laboratory.

3.4. Protocols for IPS Evaluation

The following protocols were used to obtain results as accurate as possible. The localization accuracy and reliability depend mainly on the successful completion of the calibration phase. Each calibration takes approximately 1–2 min for a single beacon to complete, resulting in a threshold value for the filter, described in Real-Time Detection phase. Calibration can be performed for several beacons simultaneously, although it is recommended that only one beacon is calibrated at a time.

3.4.1. Calibration Phase

The advertising interval of BLE beacons was set to a fixed value of Ts = 20 ms and transmitting power to T xPower = 16   dBm , respectively. Those values were selected experimentally, yielding the best results at the lowest energy consumption for the longest battery life. Additionally, the transmitting power should be set as low as possible to prevent mutual interference if the IPS is installed in a smaller room. Raspberry Pi performs scans of nearby beacons at time intervals of approximately Tscan = 100 ms. The calibration phase parameters are shown in Table 5. Movement speed indicates the normal walking speed of the subject who carries the IPS. The Raspberry Pi is attached to the belt of the person with a 3D printed holder, as shown in Figure 11.
The orientation and location of the receiver should not be altered during the calibration phase; however, smaller variations are permitted to account for the person walking. The battery (USB Power Bank) powering the receiver is placed in the nearest pocket of a person performing calibration. Calibration should be performed under such conditions as are expected from the system to operate during the real-time detection phase. It is important that the person performs the calibration sequence at around 0.5 m distance from the beacon. It is recommended that the person performs the walk-by of the beacons in both directions, three to four times, collecting six to eight samples. More samples provide a more accurate and easier calibration procedure. If the beacon is placed in a corner, meaning that the person cannot walk by in both directions, they should come near to the beacon, and return in same direction as quickly as possible, repeating the steps until enough samples have been collected.

3.4.2. Real-Time Detection Phase

IPS protocols in the real-time detection phase were established trying to mimic order-picker on-duty behavior. The scenario parameter settings were set to the same values as in the calibration phase. Obviously, the location and height of the beacons used were also set the same as in the calibration phase. The complete parameter settings for both scenarios are provided in Table 6. The measurements for each of the scenarios started at the neutral location (“Start”), as shown in the Section 3.3. The person was instructed not to stop at any of the locations/stations, only passing them. When the beacon was approached at the minimal distance (~25 cm), the button was pressed, which was recorded by the Raspberry Pi. The quality metrics of successful IPS operation is the number of detected passings-by, false detections and time difference between detection and near beacon presence. Ideally, the difference would be equal to zero, meaning that the detection and approach happen at the same time. Additionally, the human factor must be considered, as it takes up to a few hundred milliseconds for a person to press a mouse button.

4. Results

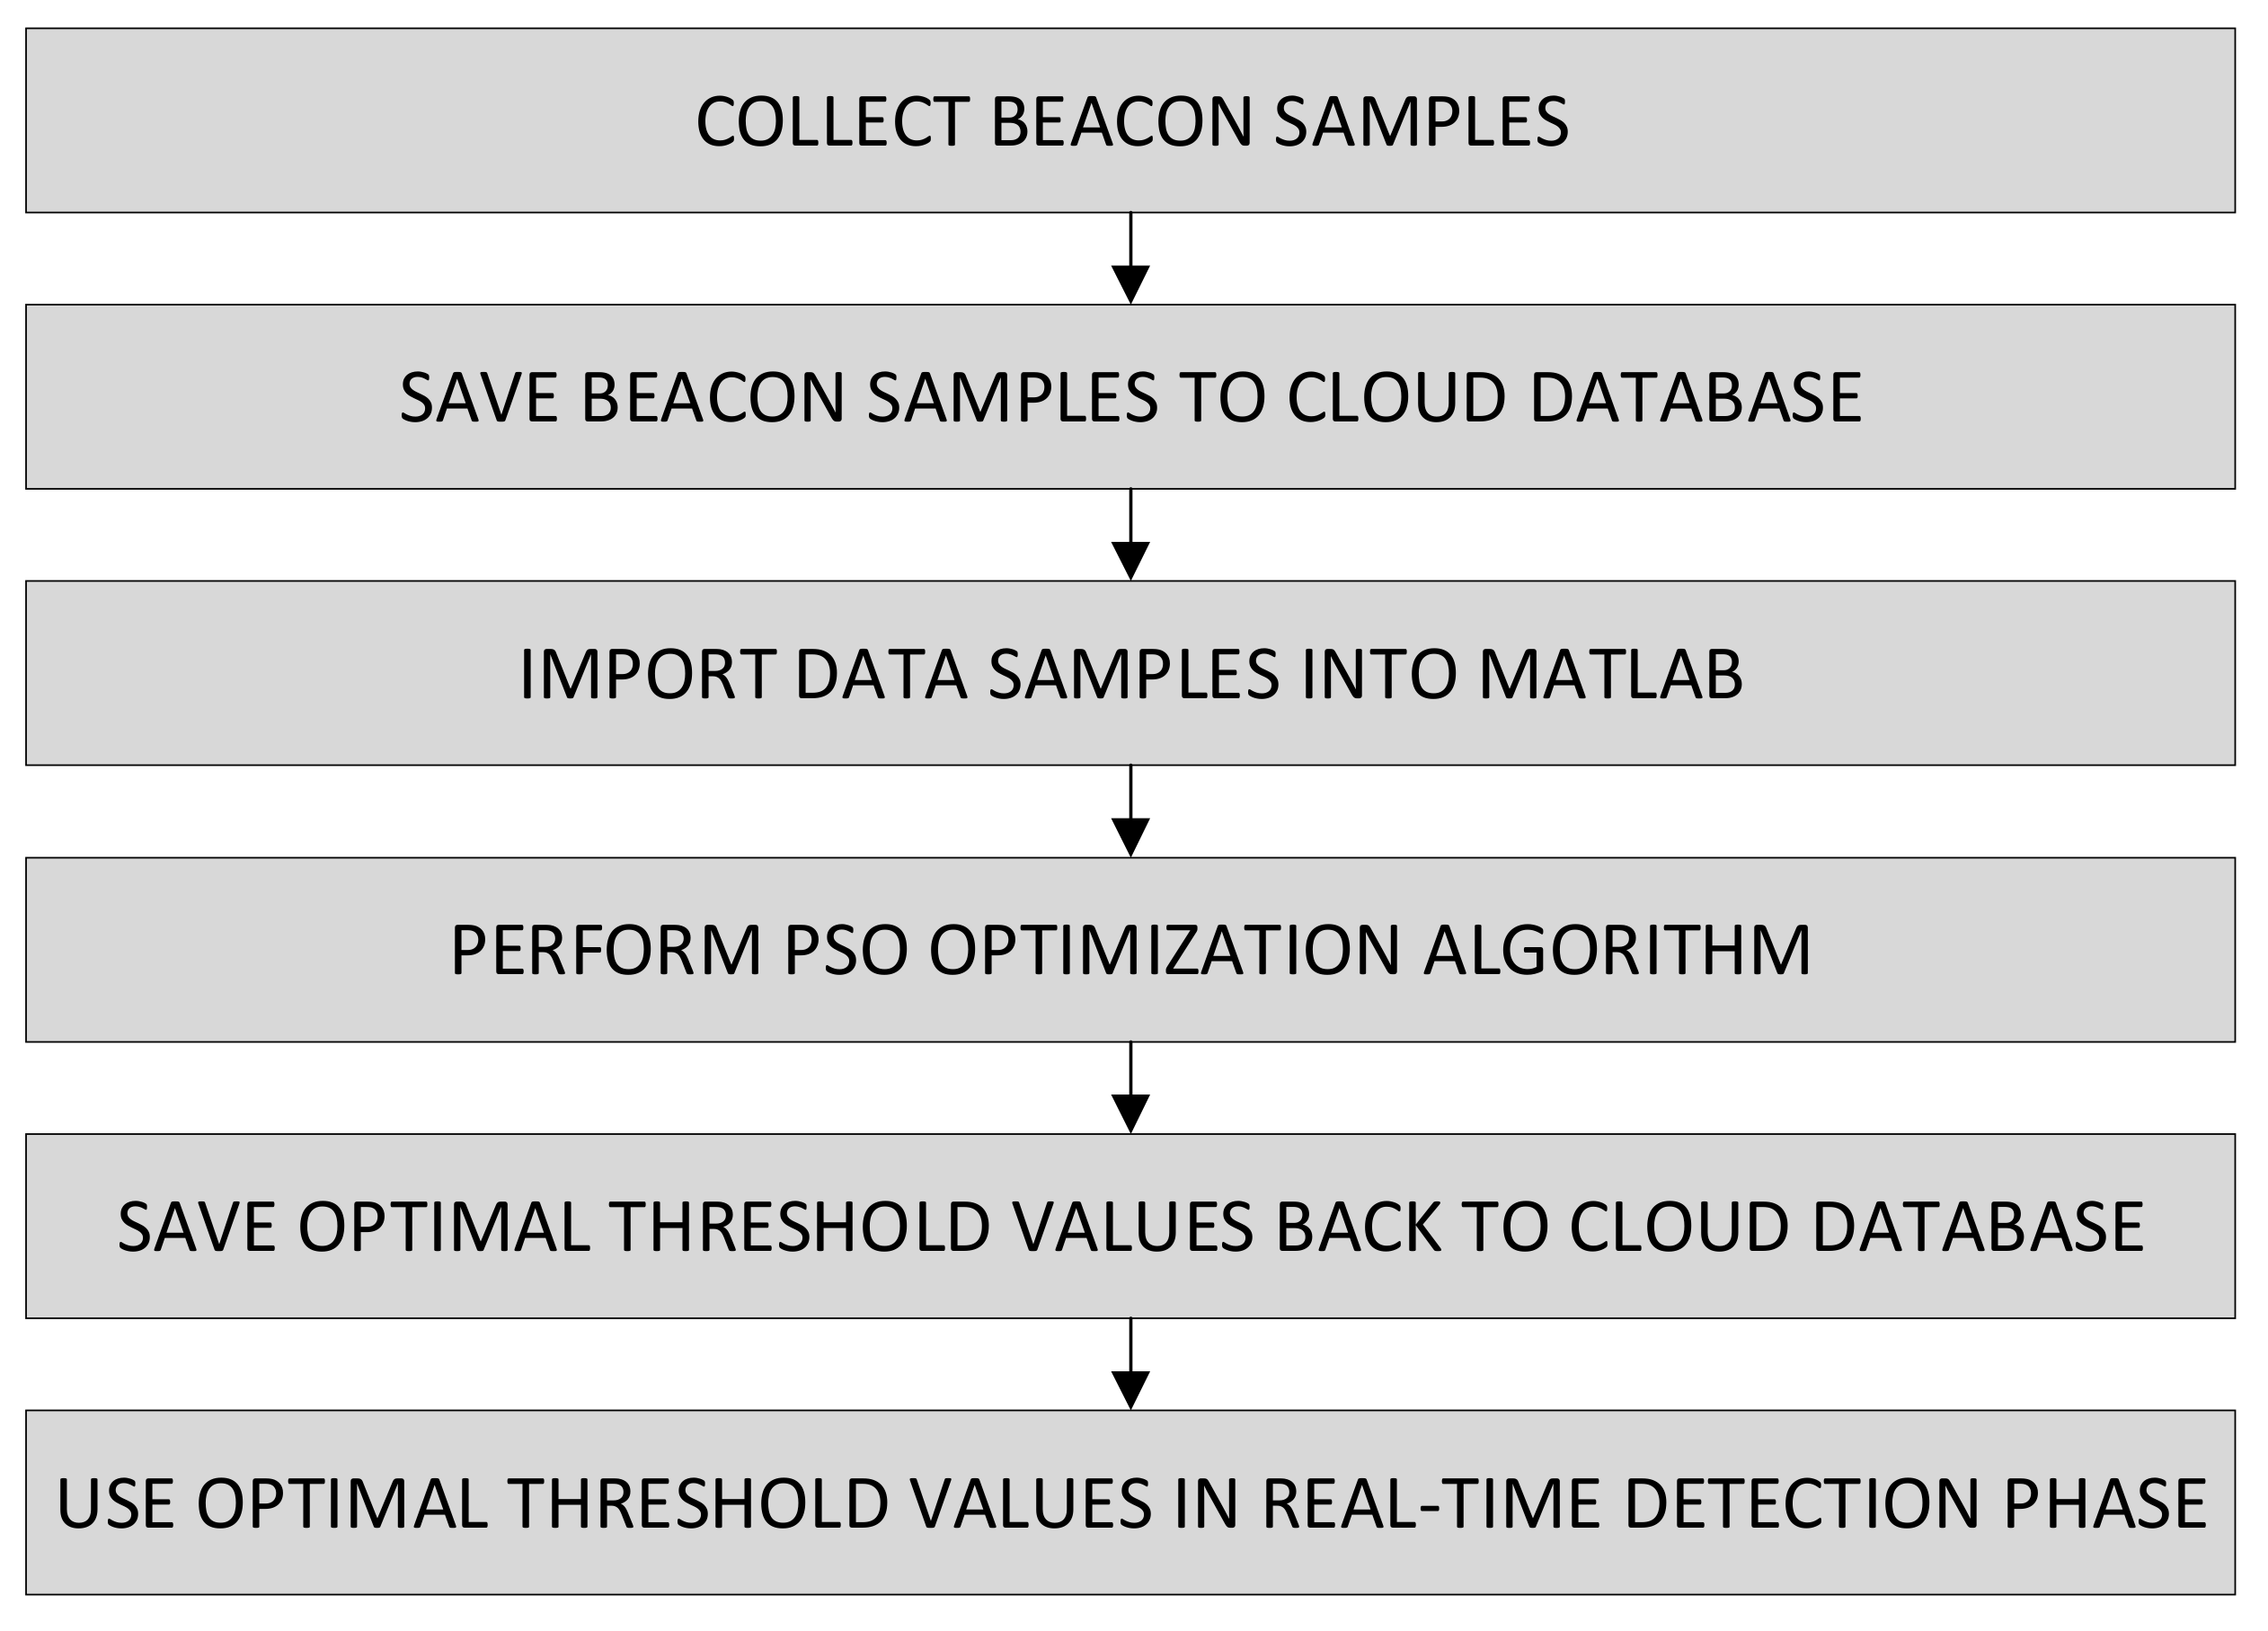
The results from the proposed IPS evaluation are presented in the following section. The processing times for the on-line localization on Raspberry Pi are evaluated first. Second, based on the samples collected during the calibration phase, a calibration was performed for the selected beacons. This was achieved using the custom developed Beacon Calibration Tool in MATLAB, separately for each beacon orientation. Finally, real-time localization accuracy was elaborated to validate the correct operation of the IPS.

4.1. Processing Time Evaluation

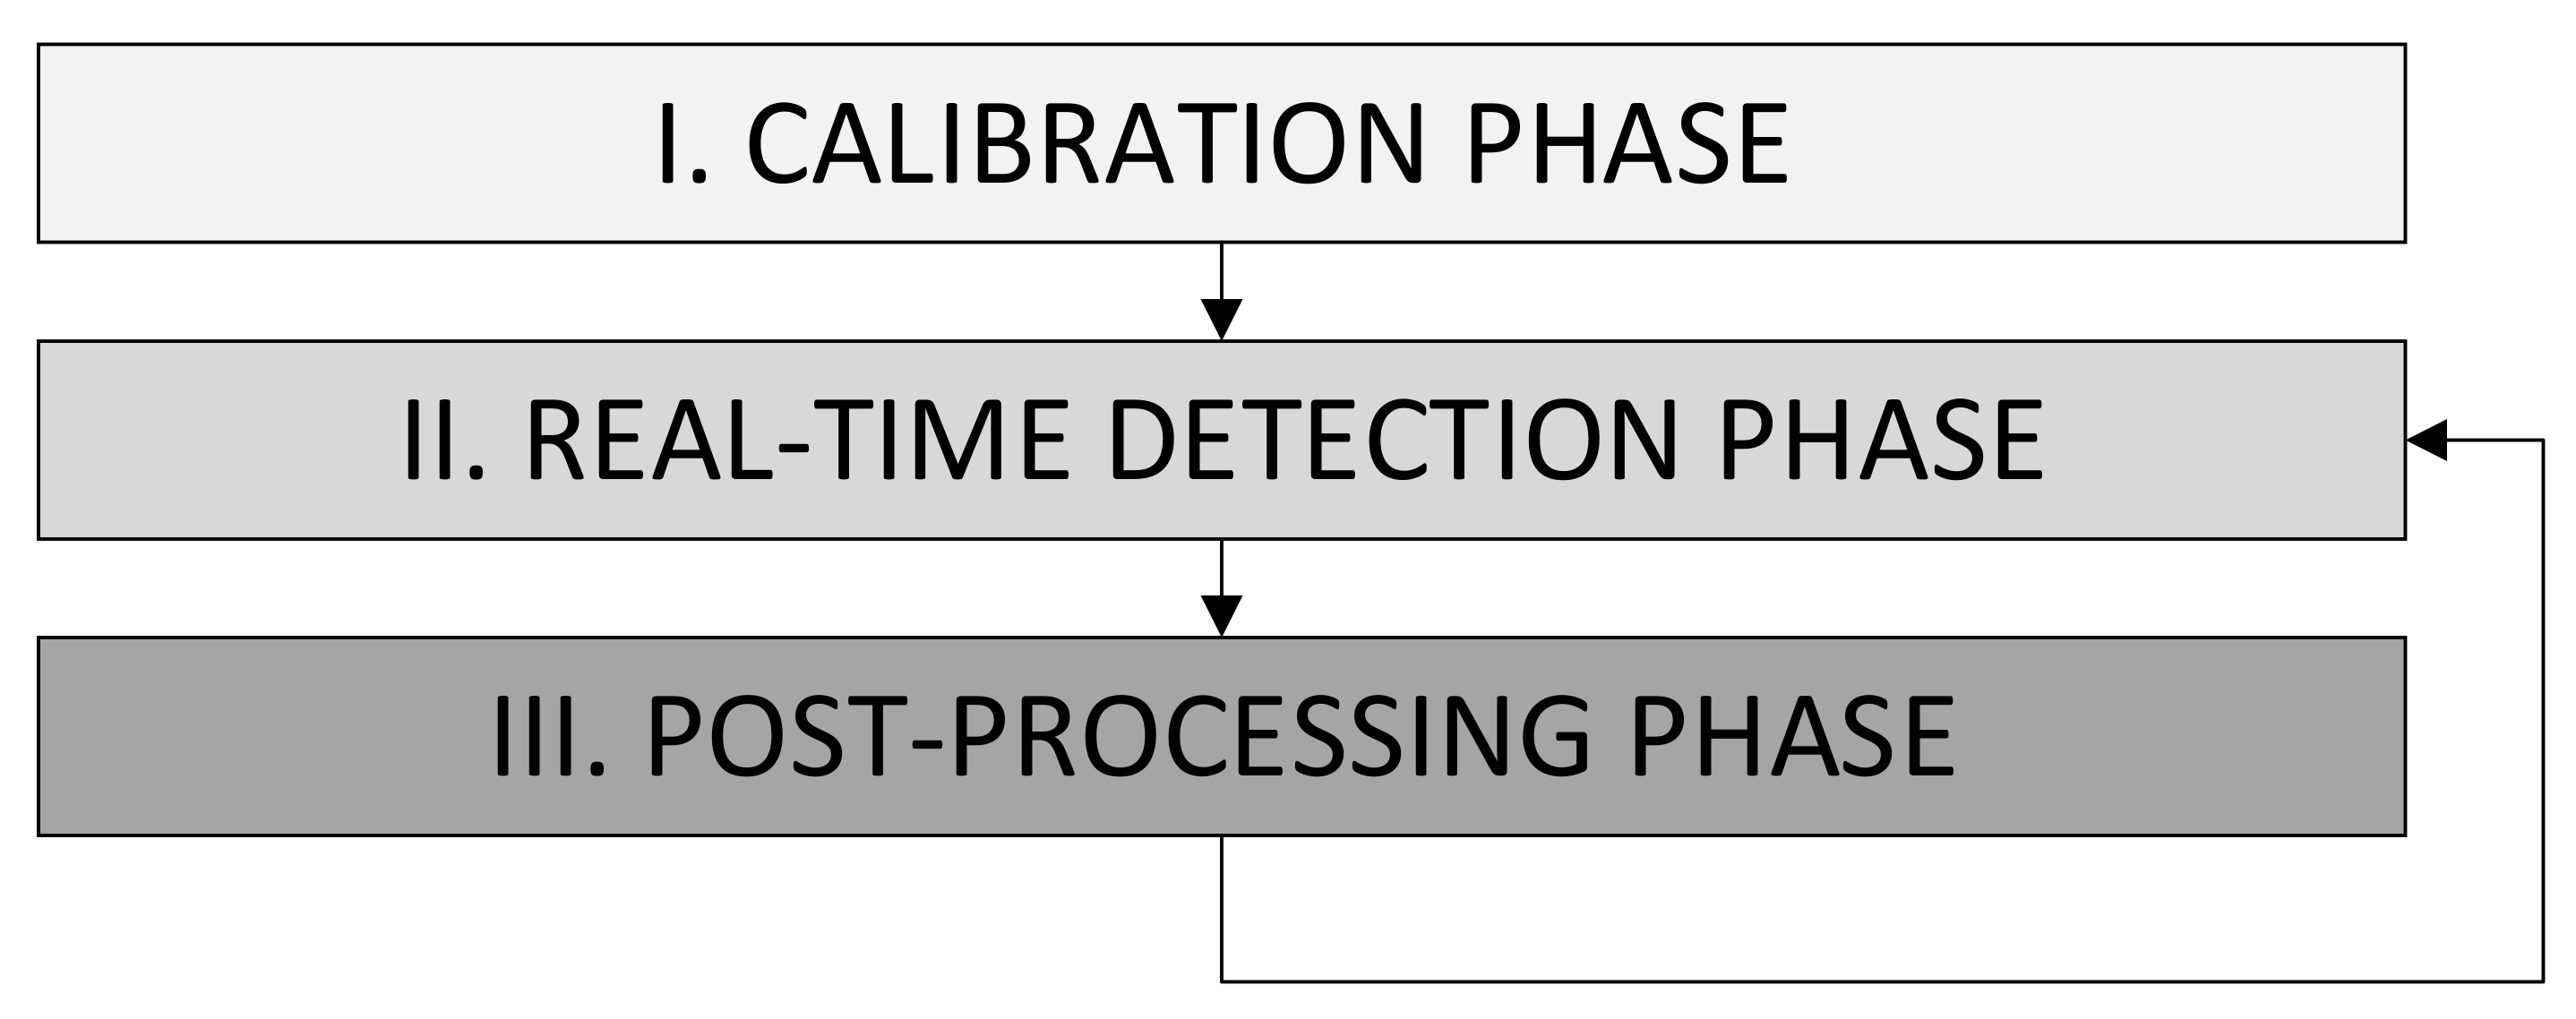
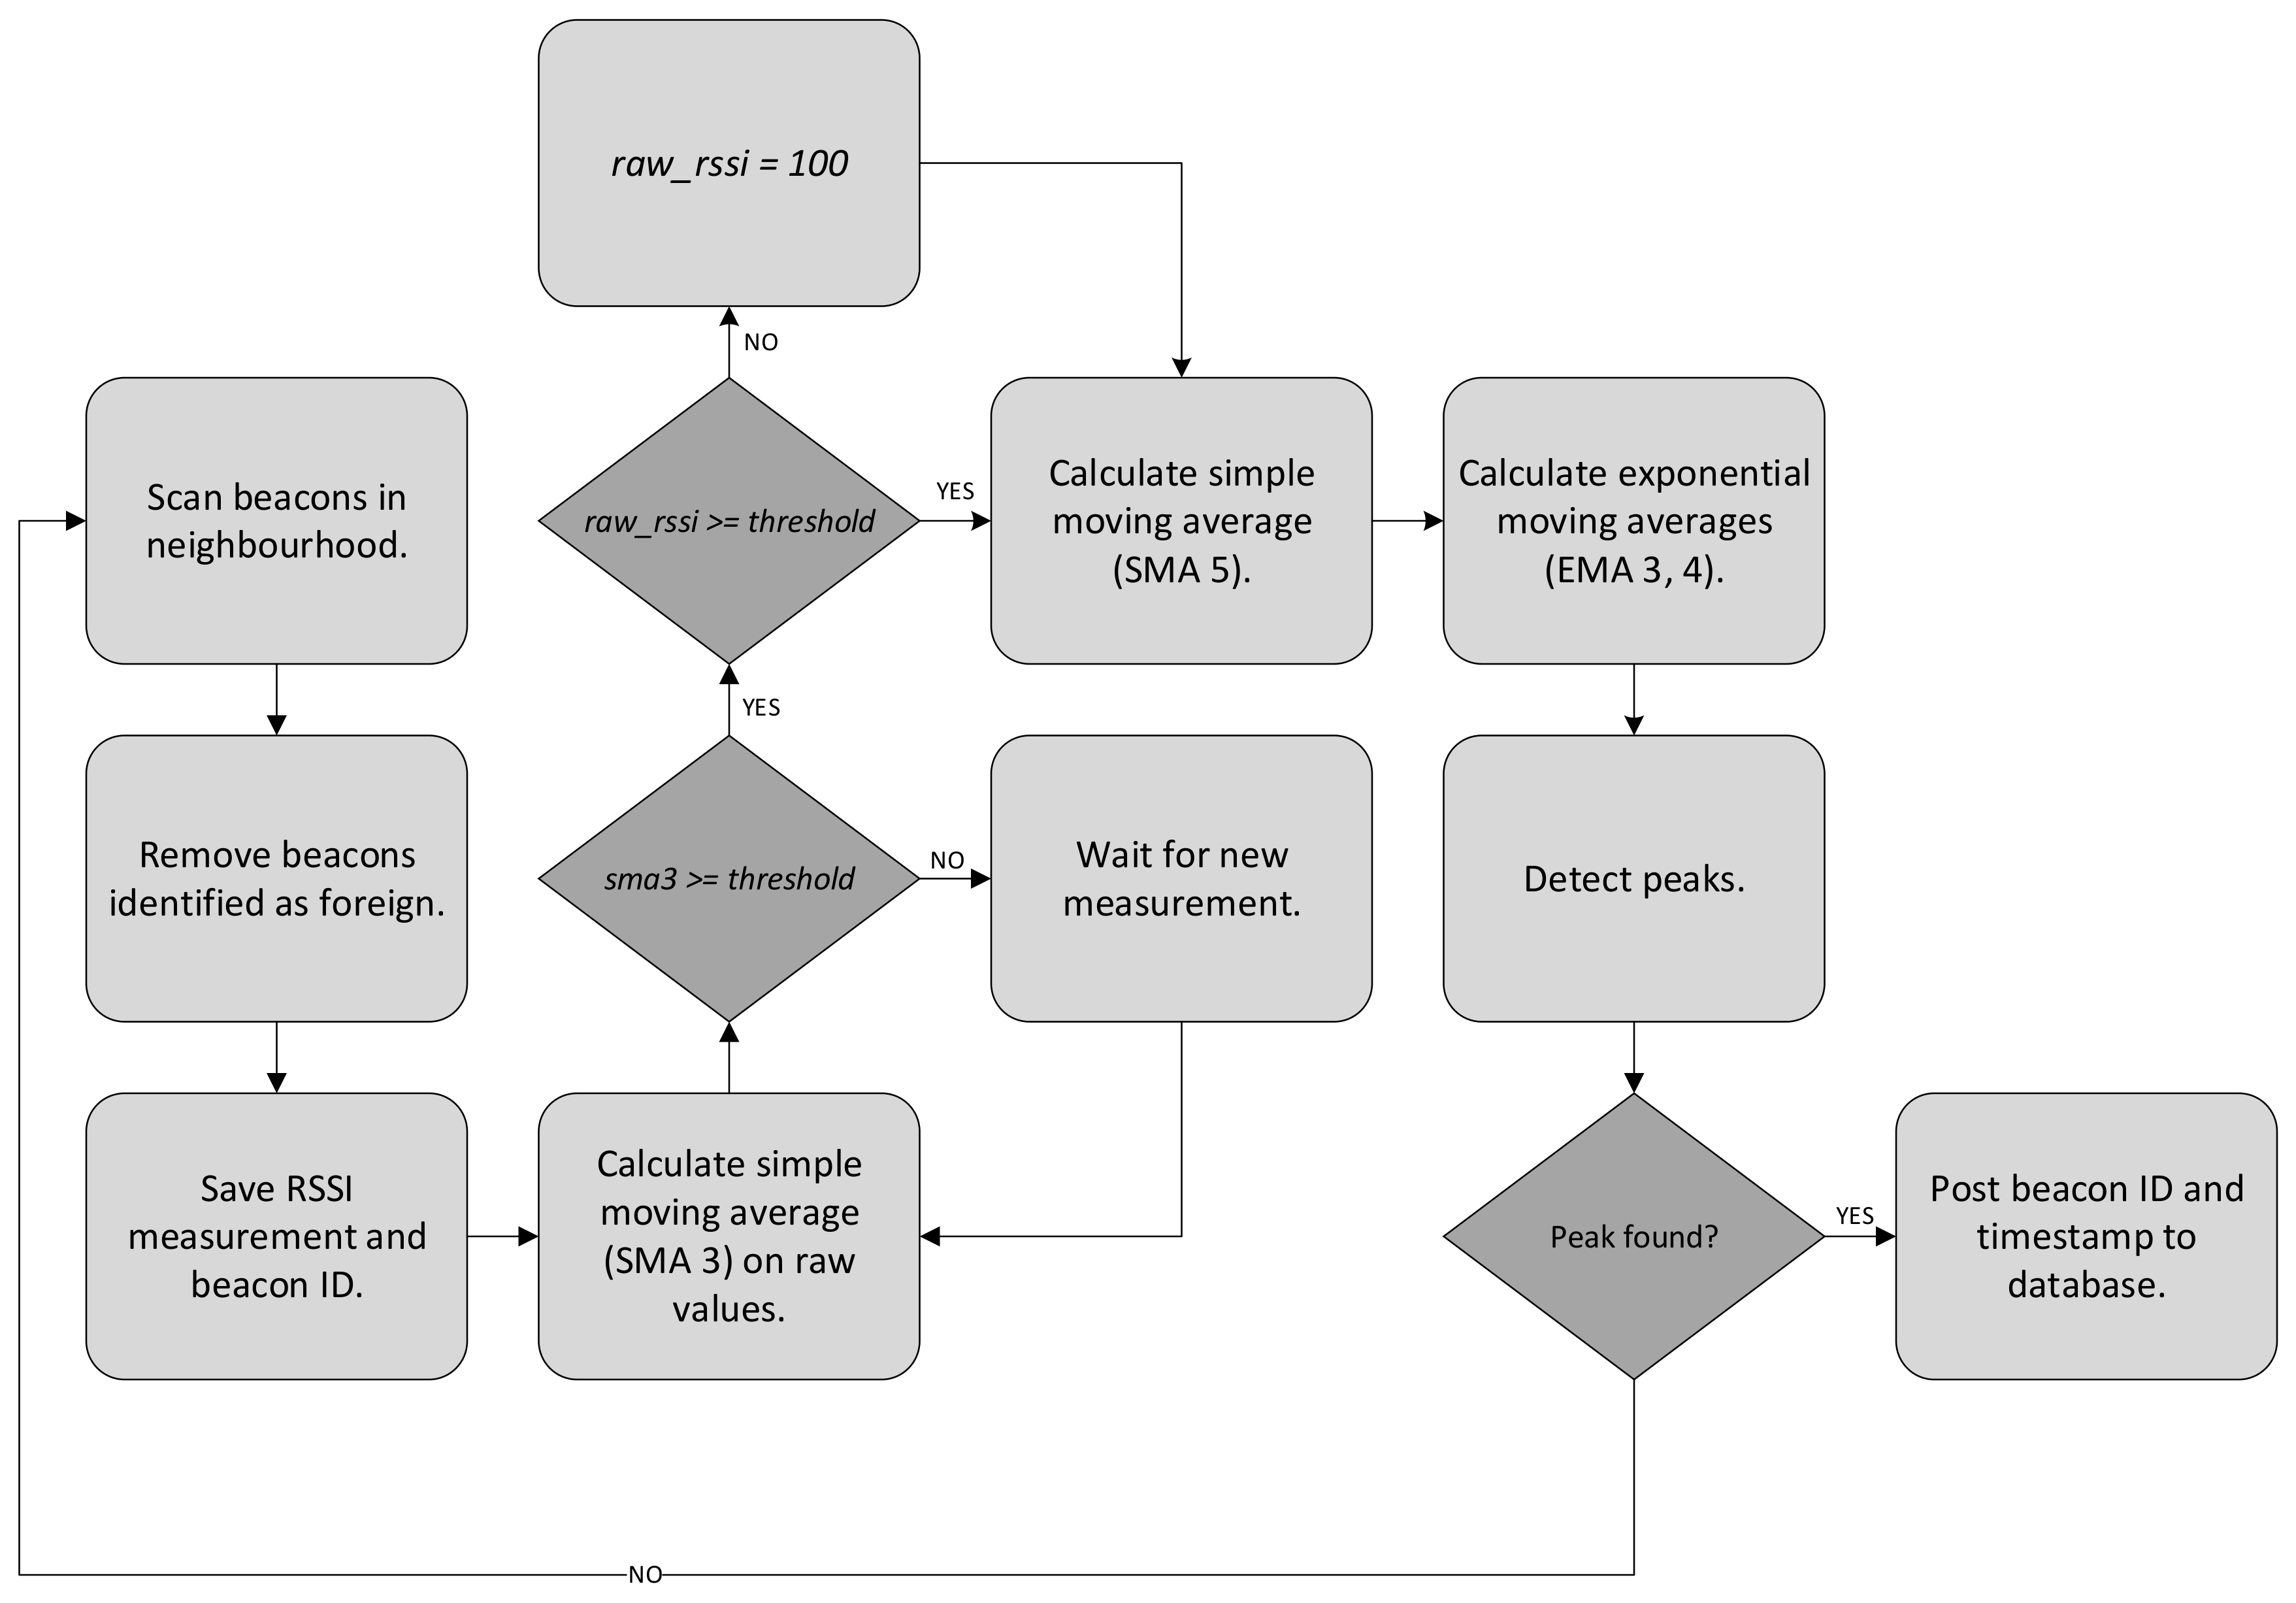
The scan interval of Raspberry Pi was set to 100 ms. This means that, during this time, the Bluetooth receiver listens to all beacons which are in the near vicinity and saves the incoming data for processing. After the scanning procedure, the data are processed according to the phases presented in 
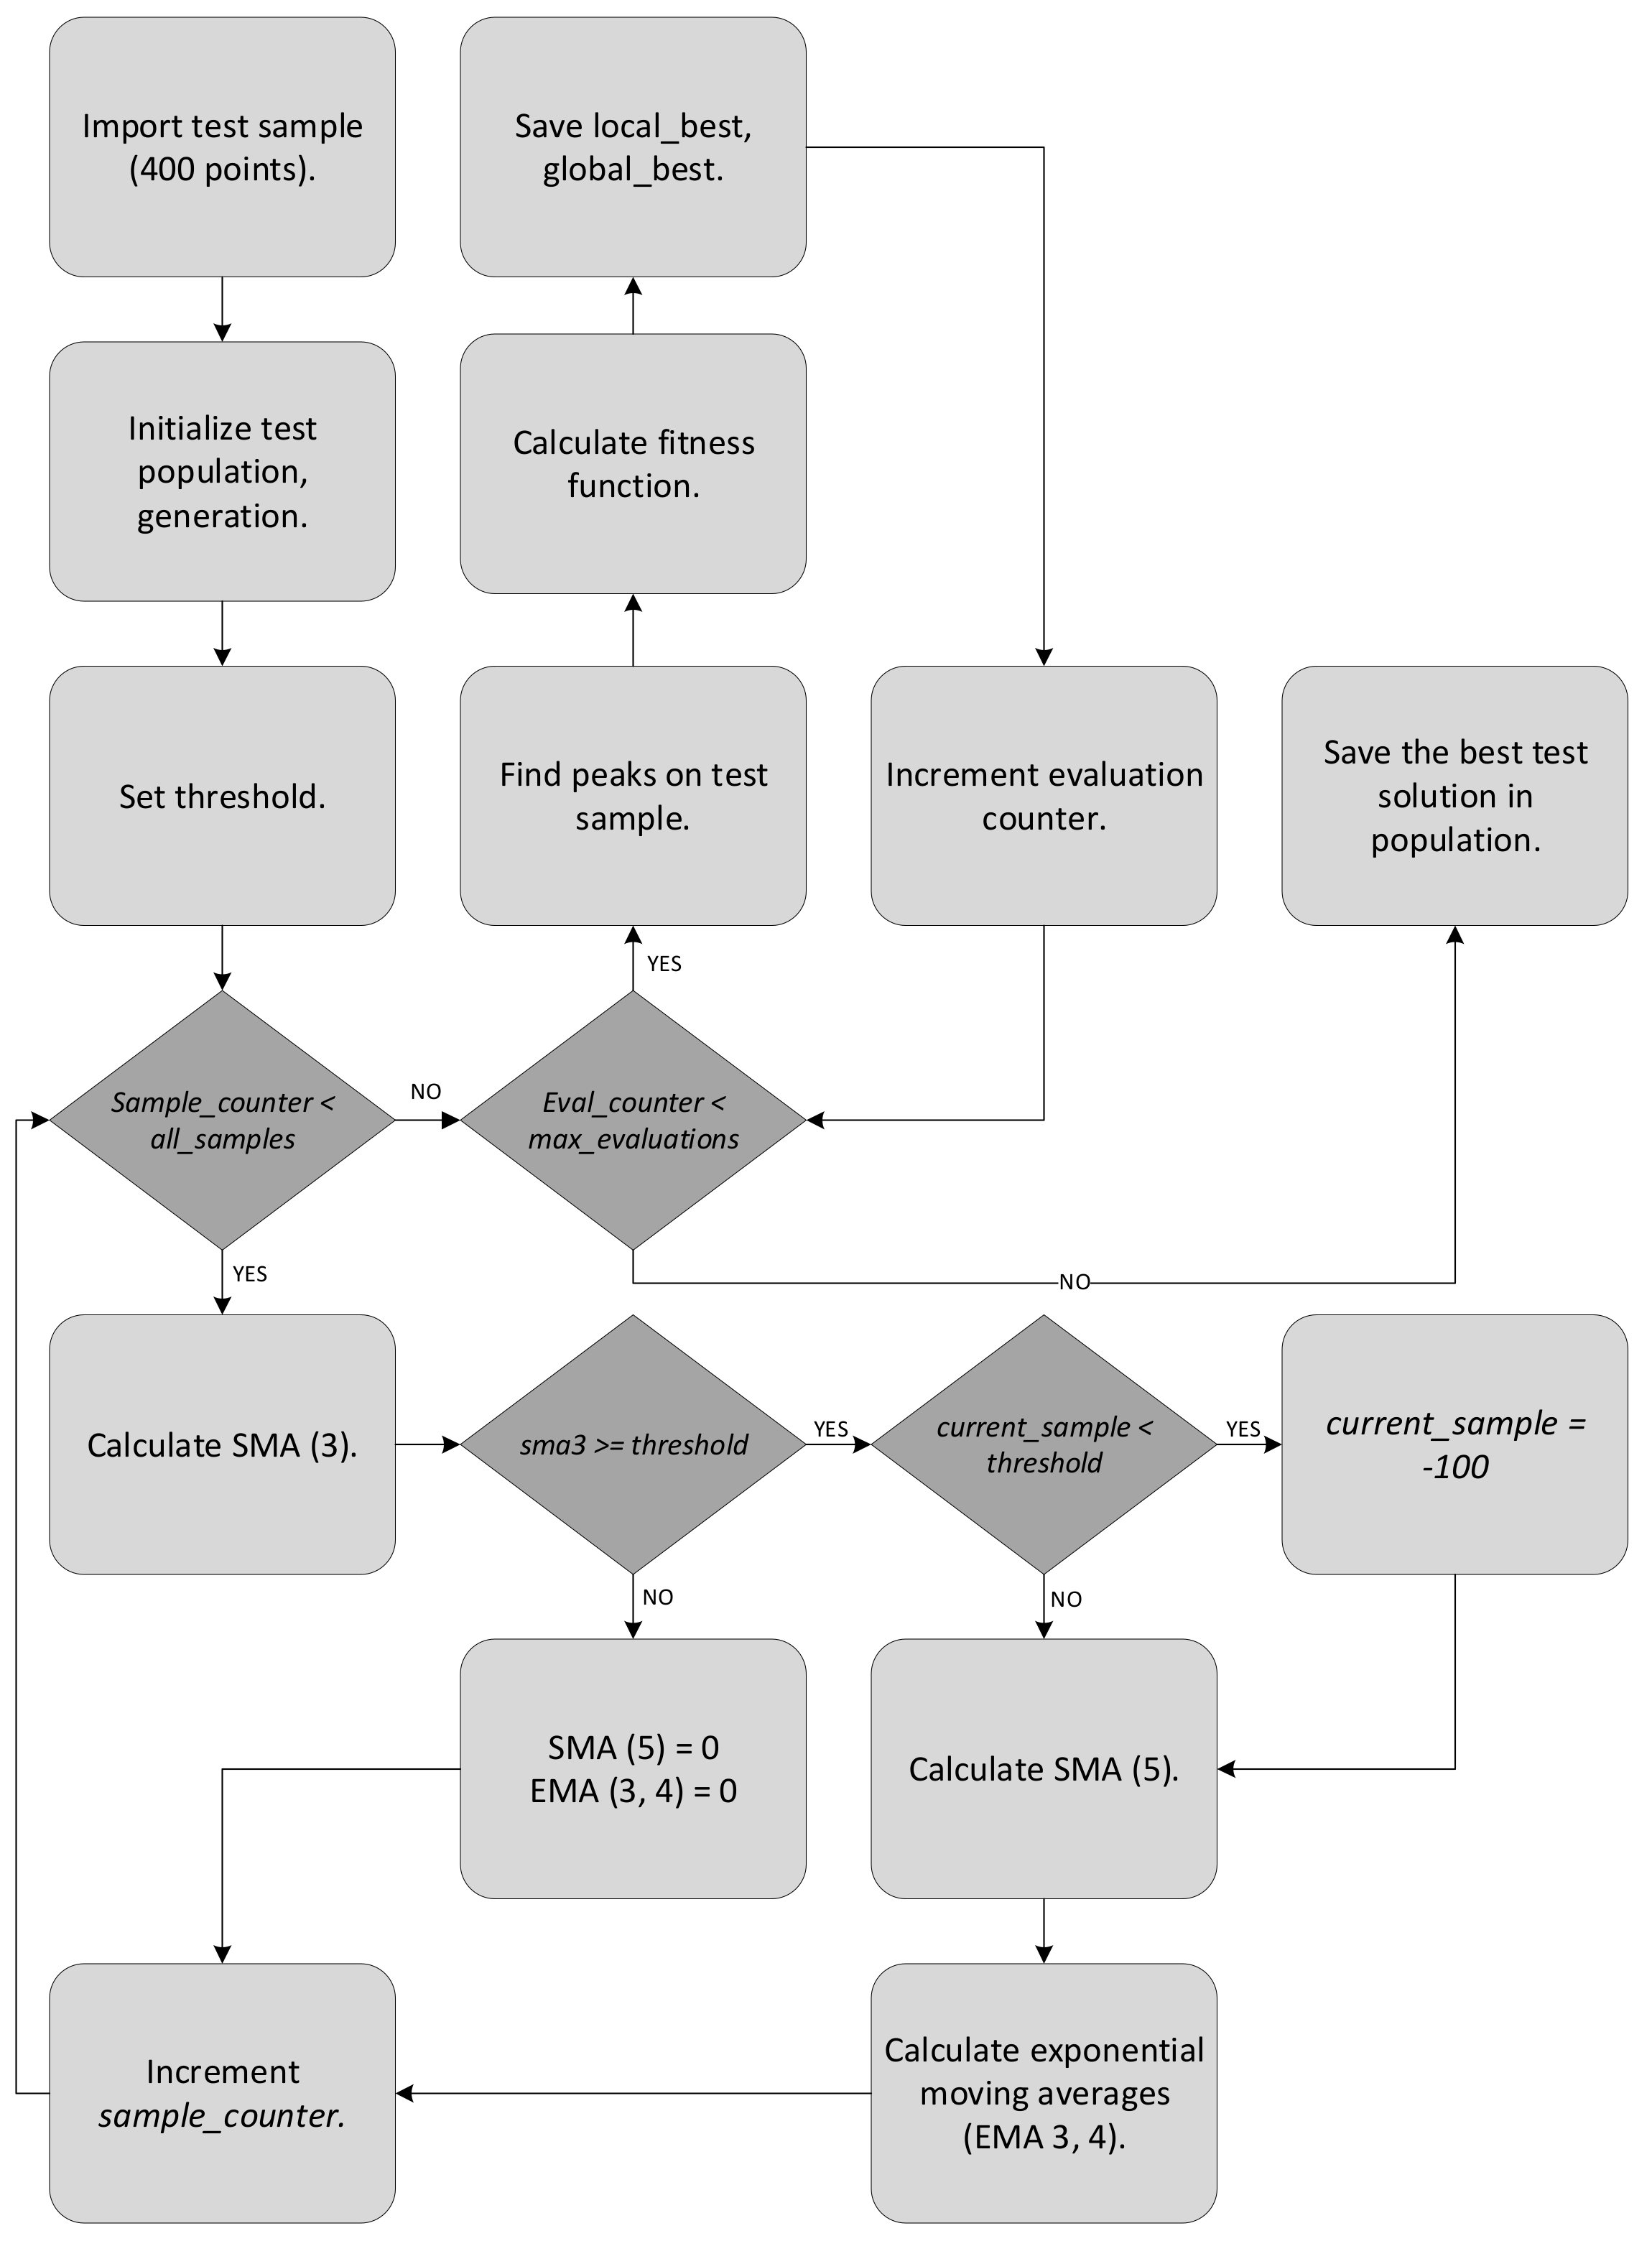
Section 3. The results of processing time evaluation showed that the localization procedure (calculation of different filters and peak detection) for the six beacons used in the experiment takes approximately 3 ms. Adding more beacons means that the scan interval increases, which may lead to lower real-time detection accuracy. The total processing time with a scan rate of Ts = 100 ms takes Tp = 160–175 ms before a new scan is initialized. The larger portion of the processing time (57–72 ms) is accounted for tasks instated by the BLE library.

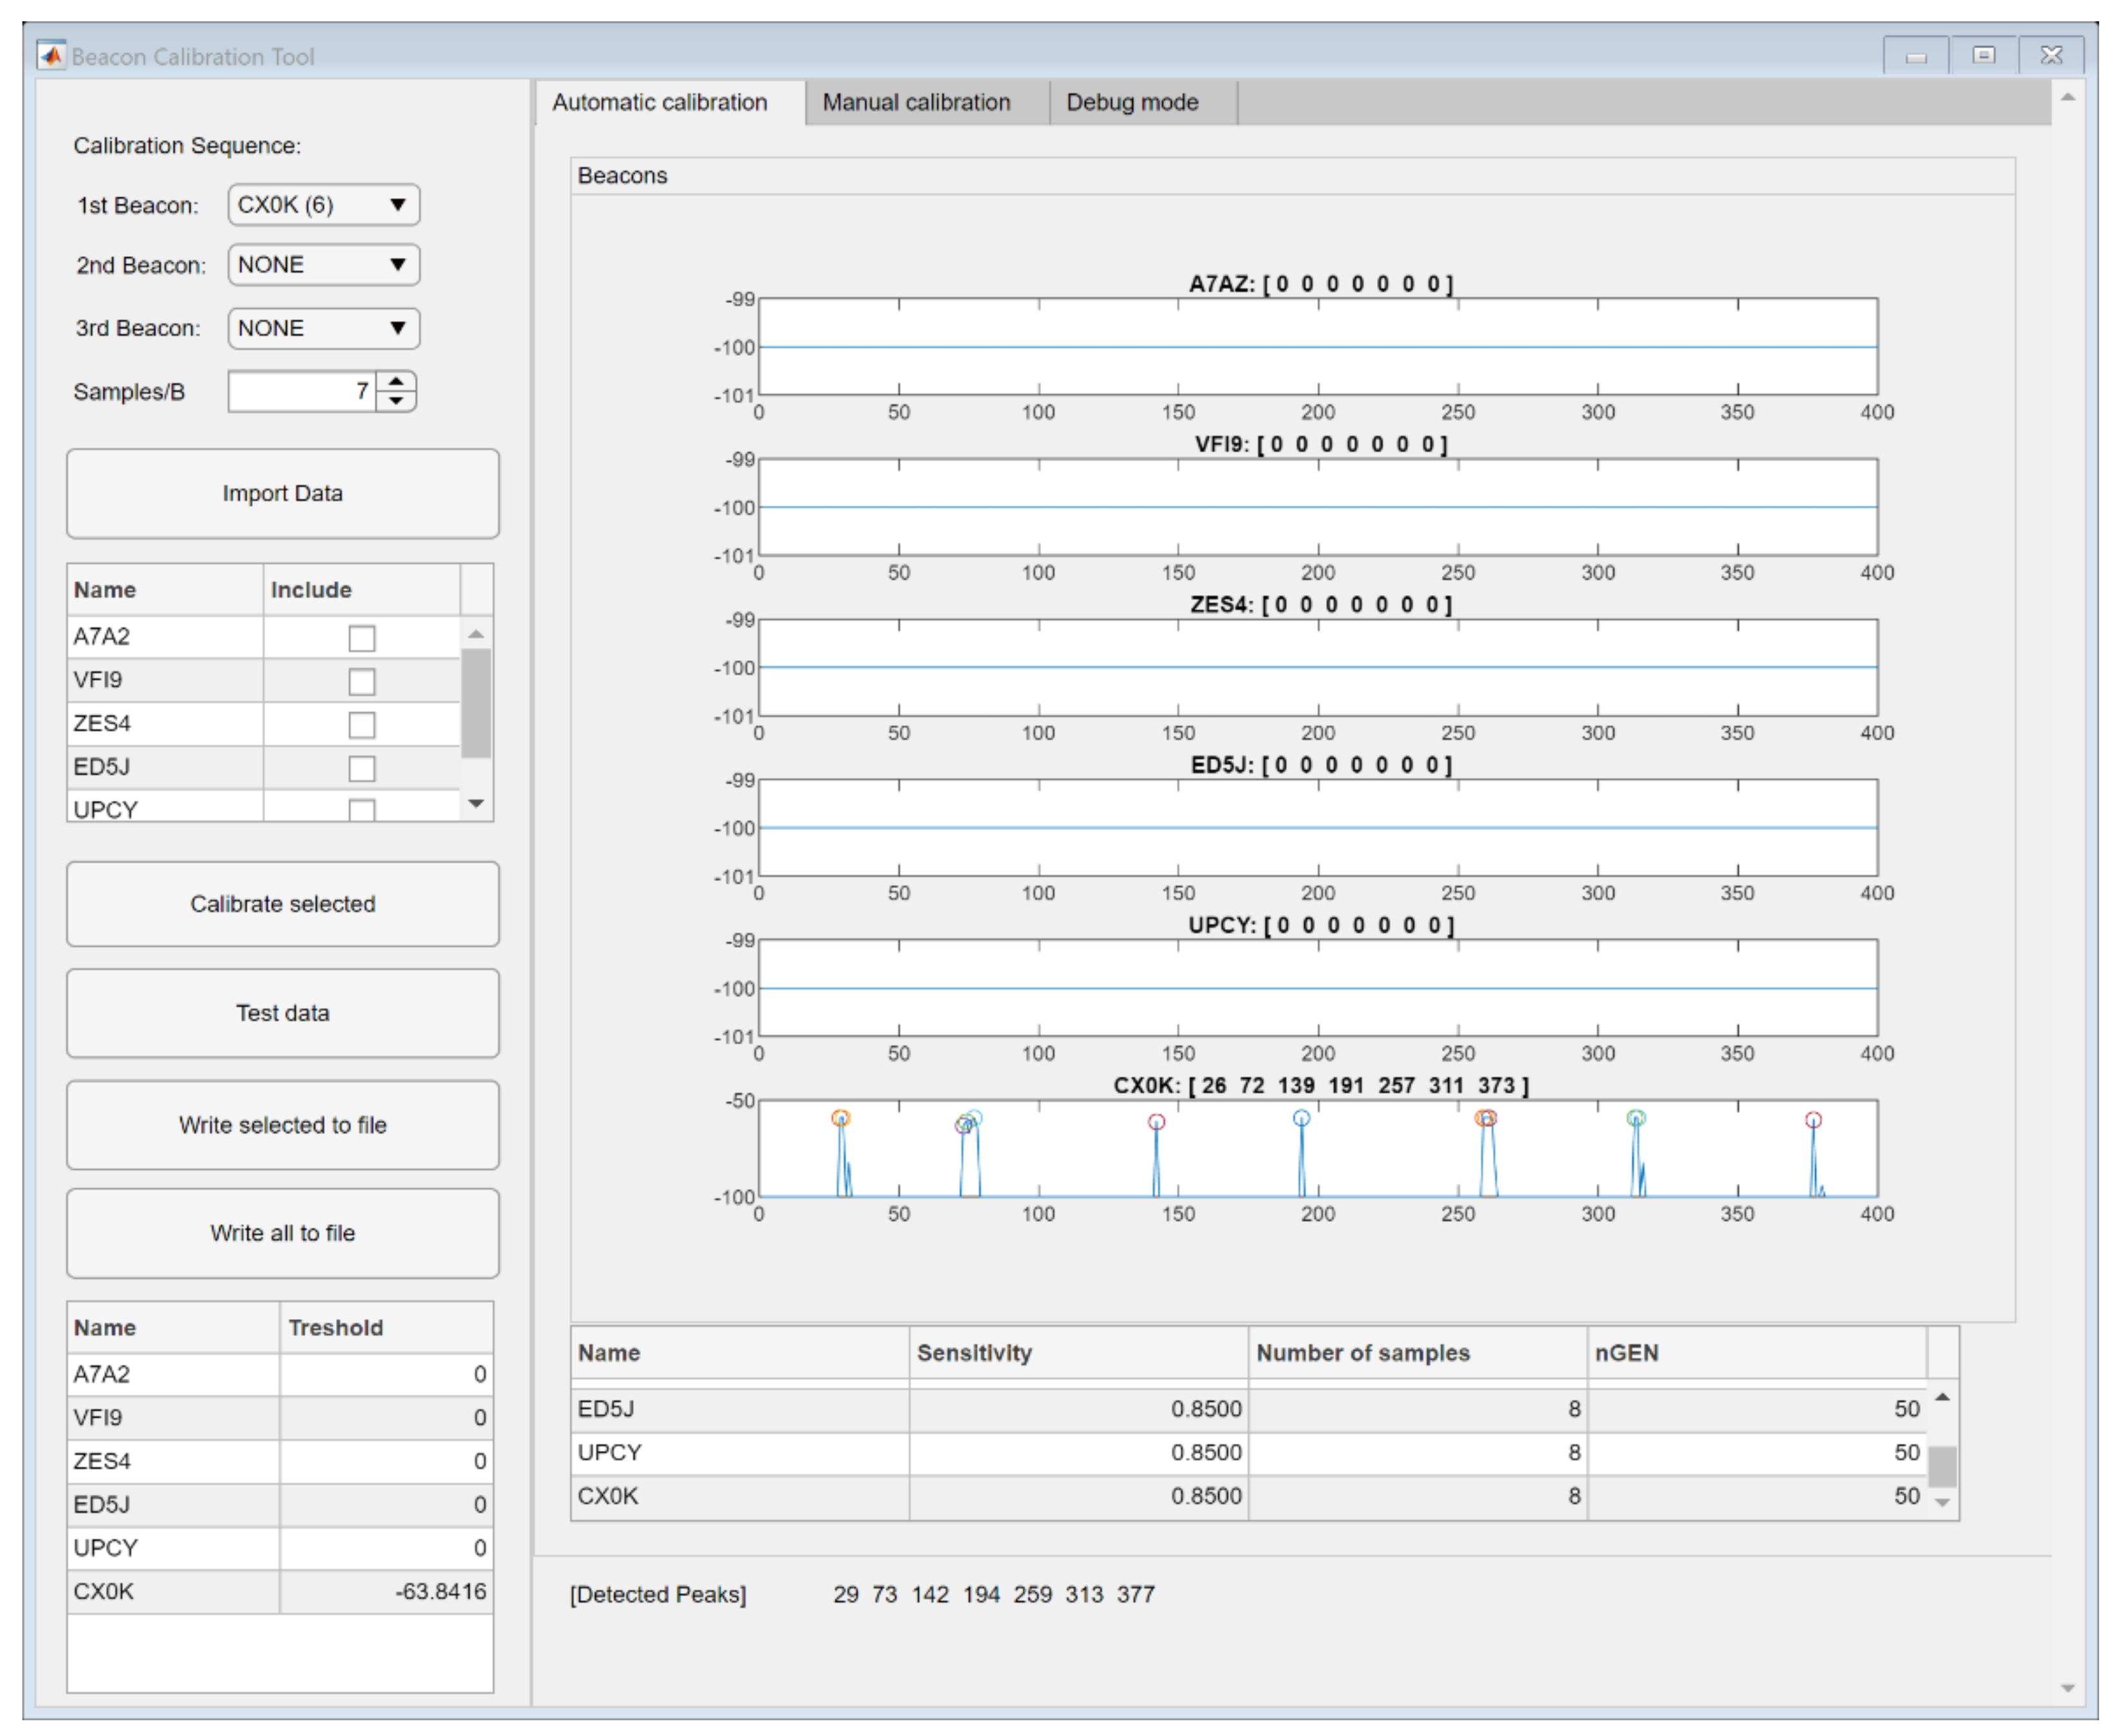
4.2. Beacon Calibration Tool Evaluation

The calibration took place using the above Calibration protocol, which ensures simple and accurate calibration of the used beacons. For each of the used beacons, seven to nine samples were collected for the threshold optimization process. Their thresholds were determined automatically using the Beacon Calibration Tool. To verify the correct operation of the Beacon Calibration Tool, a single beacon was selected with four various orientations: (1) the beacon was put vertically, with the antenna facing away from the front of the desk, (2) with the antenna facing towards the front of the desk, (3) the beacon was put horizontally with the antenna facing up, and (4) with the antenna facing the table. The calibration was performed for each stated orientation. A single cycle of measurements for real-time localization for the selected beacon was performed based on the automatically determined thresholds. The calibration parameters are shown in Table 7.
The results of the calibration procedures and corresponding real-time measurements are shown in Table 8. Please note that the verification was only done using the LM Technologies adapter.
The success rate (SR) was determined based on the following Equation (9):
SR = n     f p   f n n · 100   [ % ] ,
where n is the complete number of passings-by, fp the number of false positives and fn the number of false negatives. Since other beacons were powered-off during this initial test, the number of false positives indicates that multiple detections occurred. Obviously, false negatives represent the missing detections when an actual passing by occurred. The time delay is the time difference between a timestamp when the IPS registered the event of passing by and the timestamp mouse button was pressed by the person performing the experiments, as noted in Equation (10):
t d = t reg     t p   [ s ] ,
The average time delay was calculated only on successful triggers (ns) in the following Equation (11):
t d ¯ = i = 1 n s t d i n s   [ s ] ,
where t d i is the i-th sample of time delay.
Similarly, the Standard Deviation of time delay was calculated in the following Equation (12):
σ t d = i = 1 n s ( t d i   t ¯ d ) n s   1 [ s ]
As can be noted from the results of 
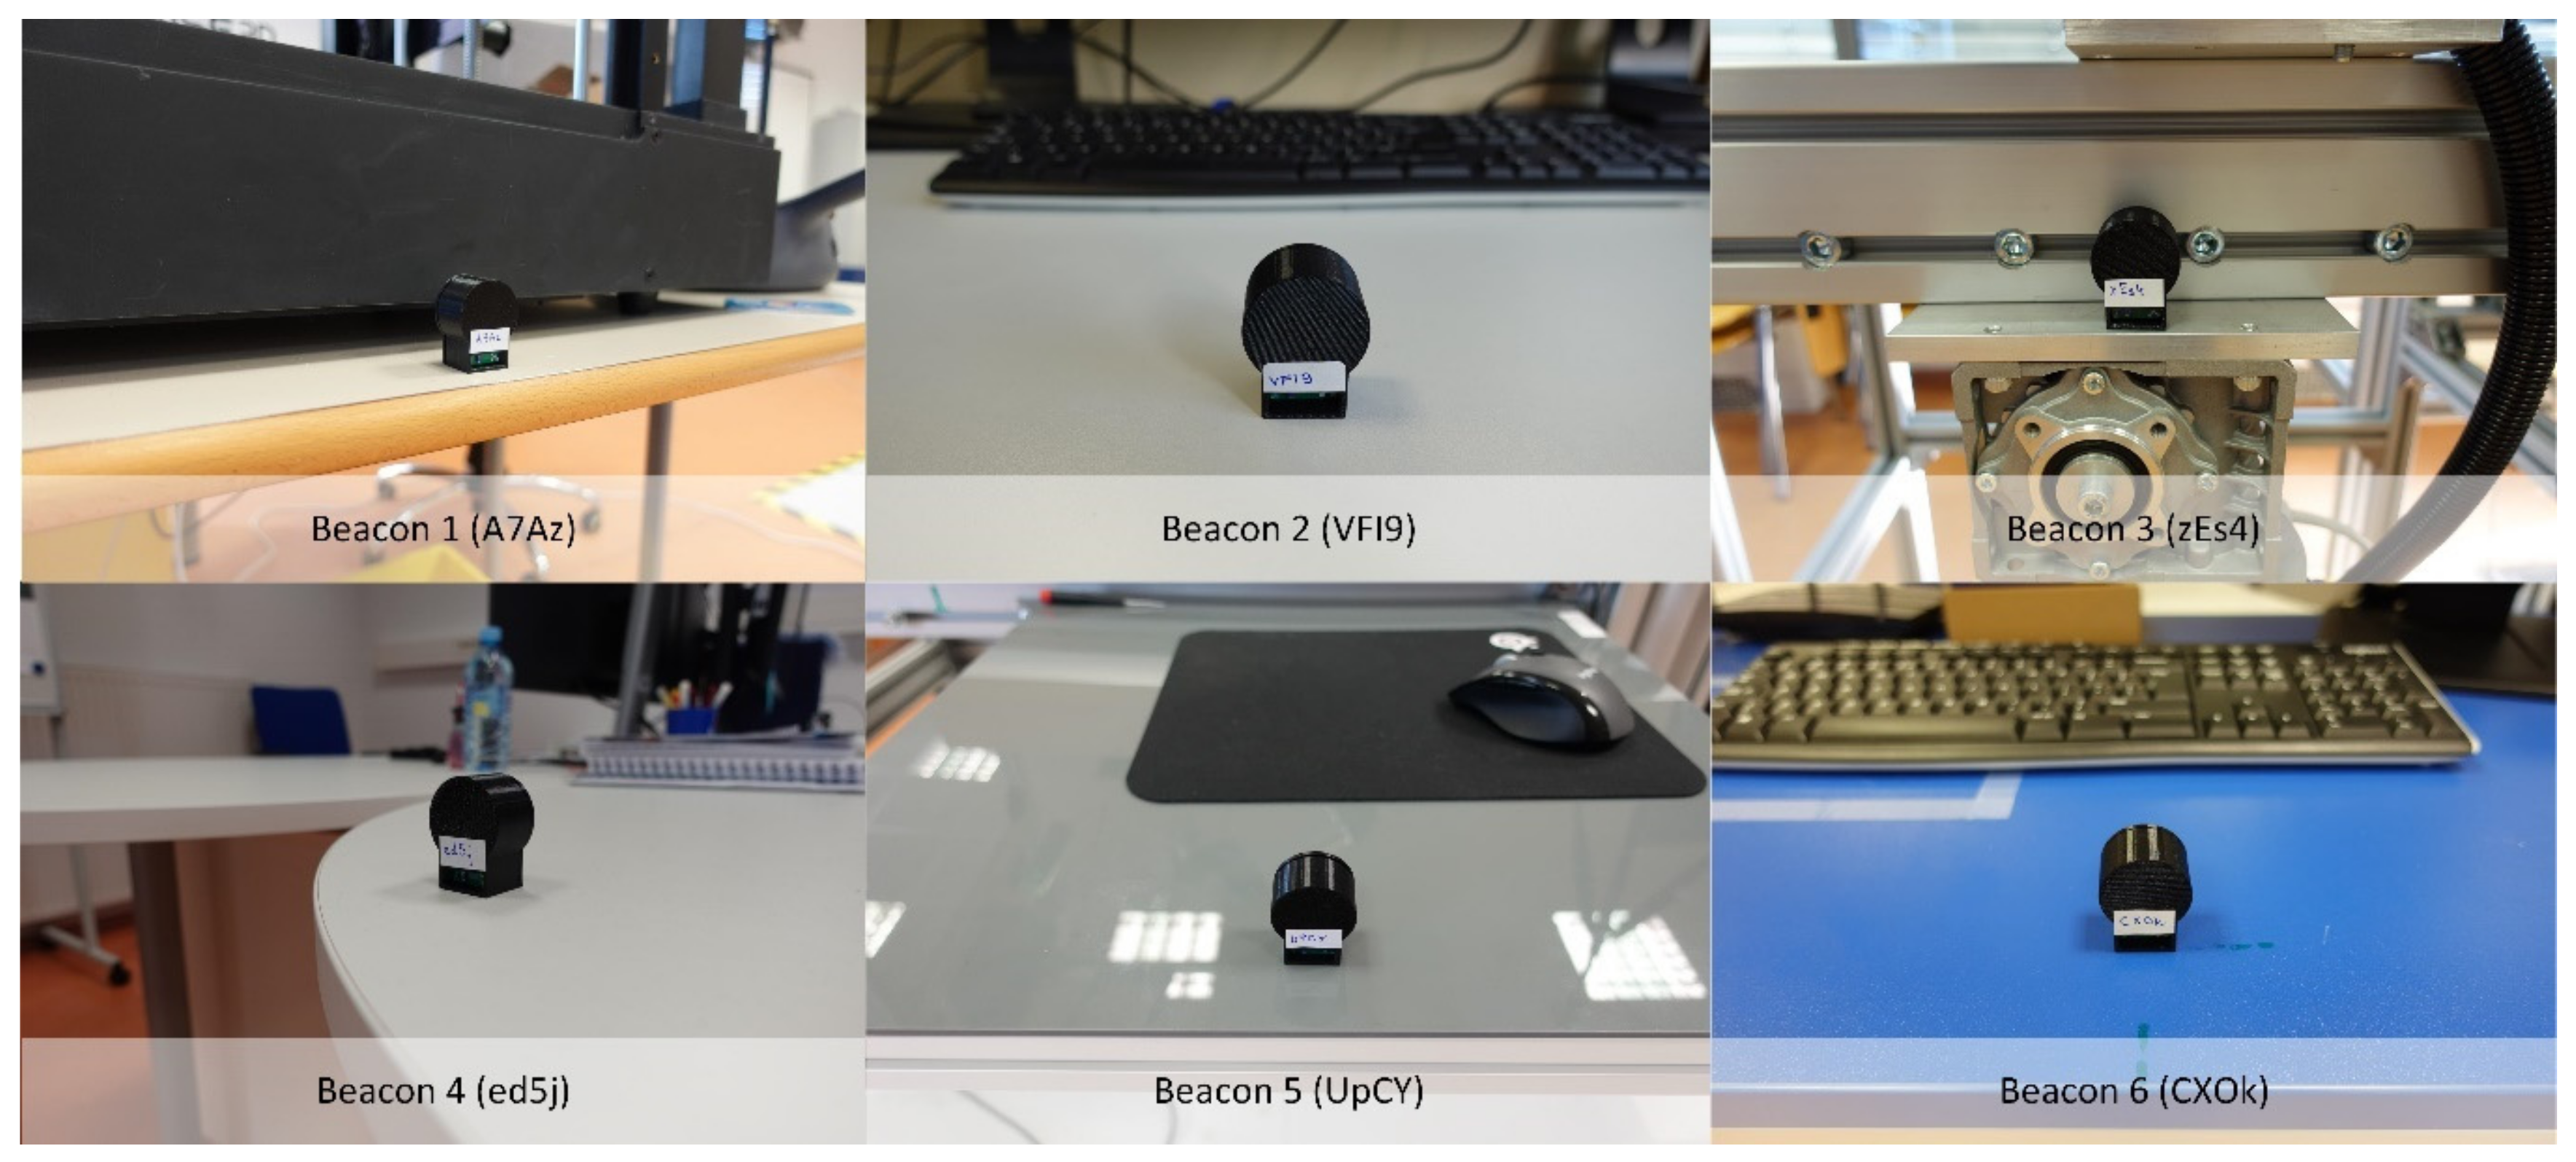
Table 8, the threshold values from the calibration differ from orientation to orientation. Based on the results, it is recommended that the beacon is set vertically with the antenna facing towards the front of the desk; therefore, all further tests were performed based on that orientation, as shown in Figure 9. The high percentage (over 92%) of correctly determined passings-by indicate that the calibration procedure and the Beacon Calibration Tool worked as intended. As can be seen from 
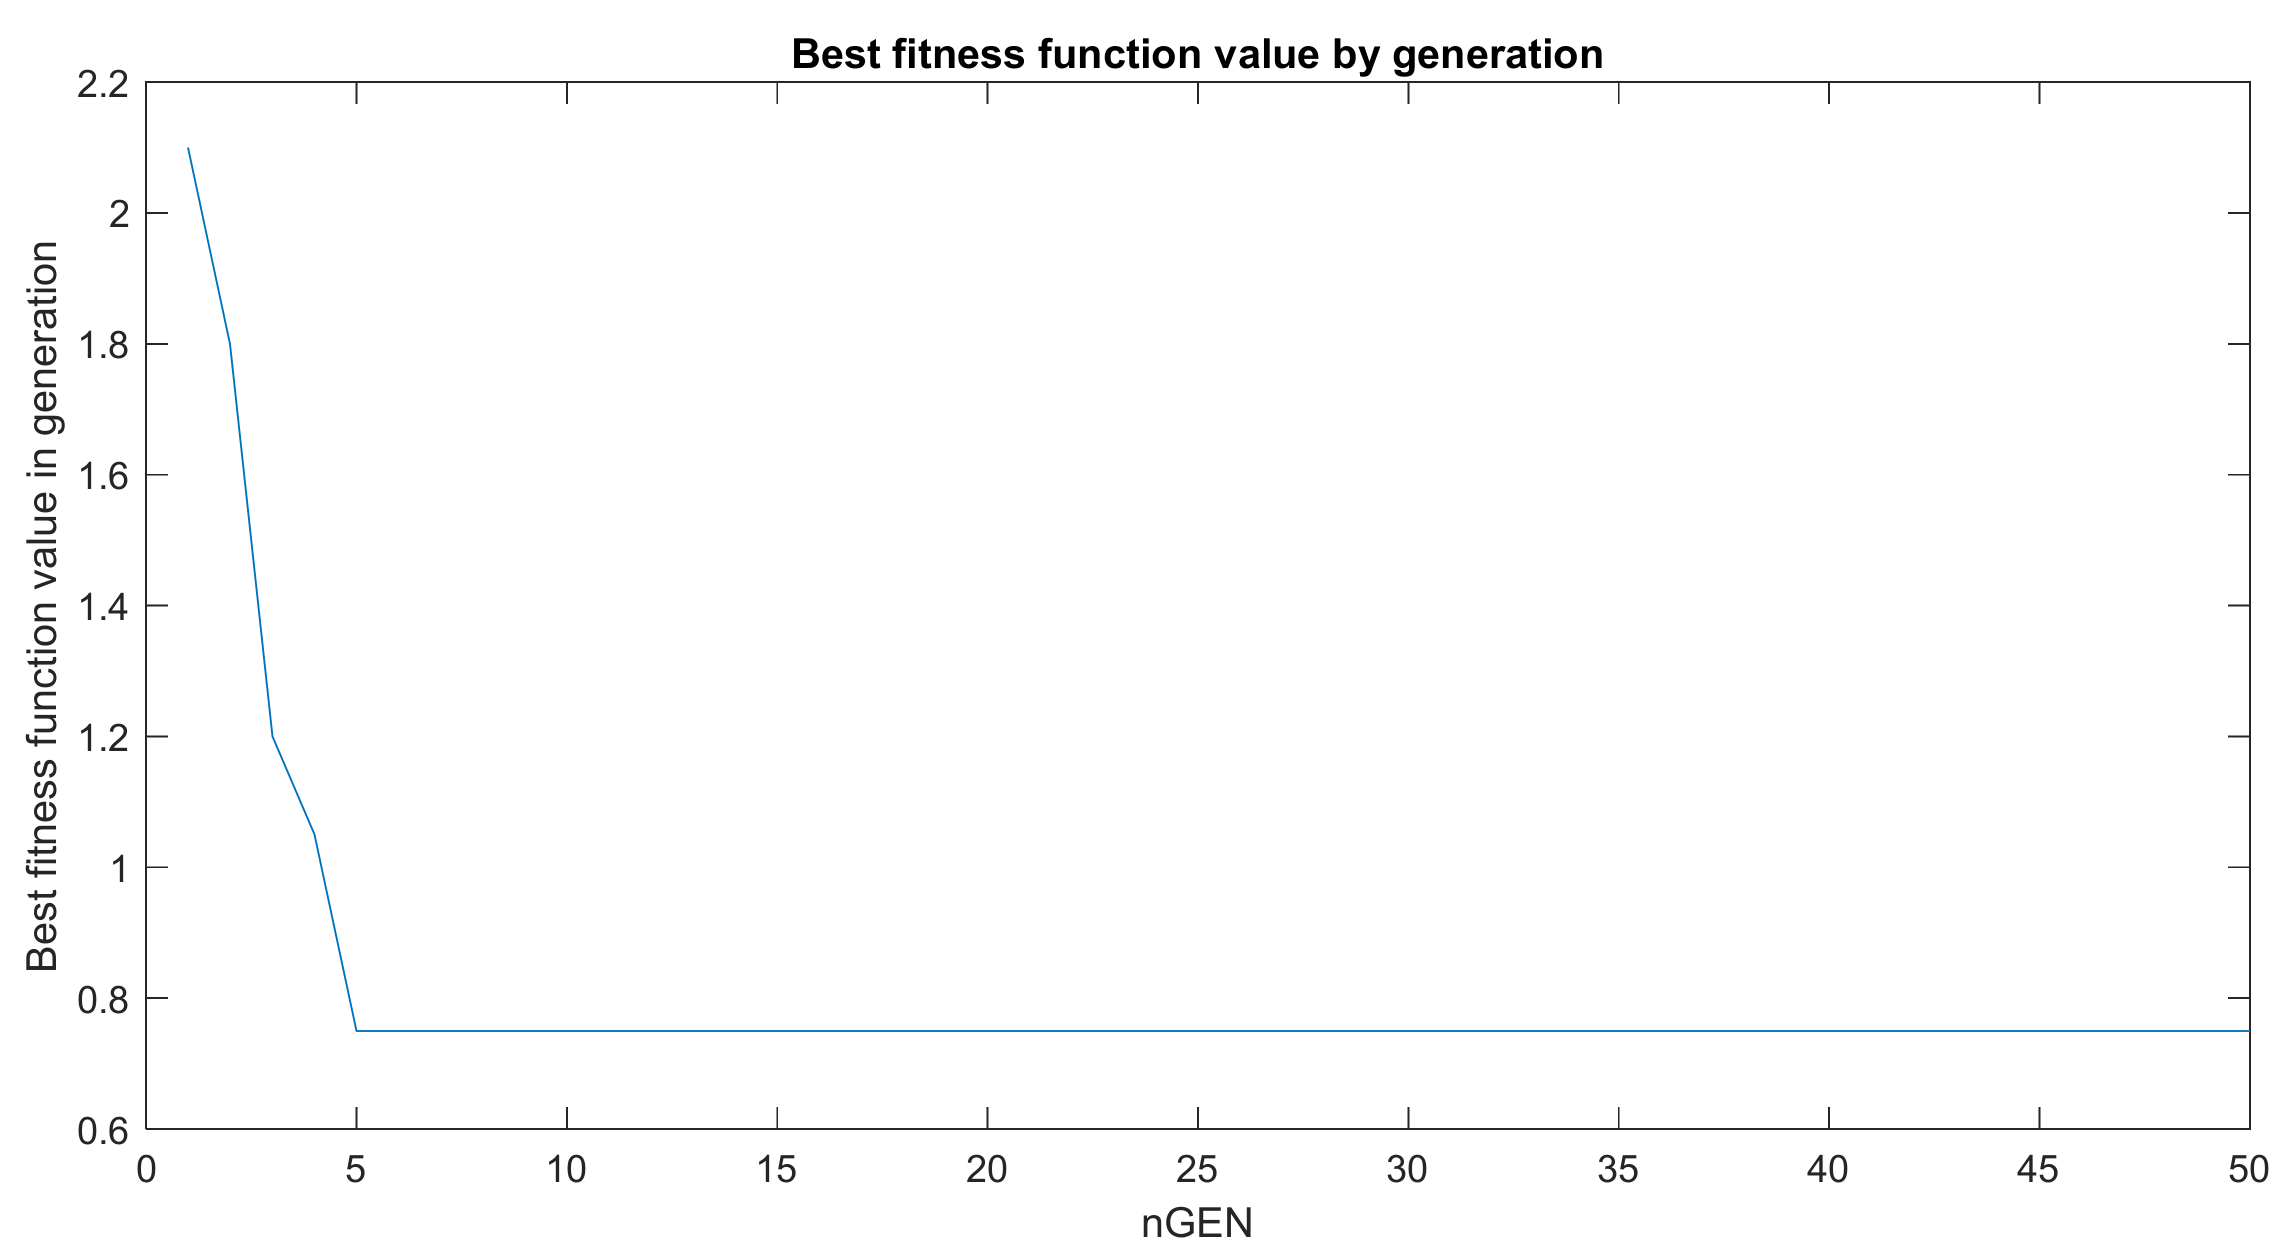
Figure 12, the fitness function value decreased with each new generation, showing that the PSO optimization algorithm improved the initial solution as expected.
As can be seen from Figure 12, the best fitness function value of the generation improved up to the fifth generation (50 evaluations) and remained the same until the end of the optimization process. The PSO optimization algorithm in the Beacon Calibration Tool guided the process of discovering all seven peaks that were acquired in the calibration procedure. Based on the above results, the calibration was performed for all the used beacons for two Bluetooth USB adapters. The same calibration parameters were used for both configurations, as shown in Table 5. The results of the complete calibration are shown in Table 9.
Furthermore, the initial real-time localization tests show that the localization was successful in over 93.5% in the best-case scenario. In the following extensive tests, the IPS was analyzed in detail in the real-world scenario operation.

4.3. Real-Time Localization Accuracy

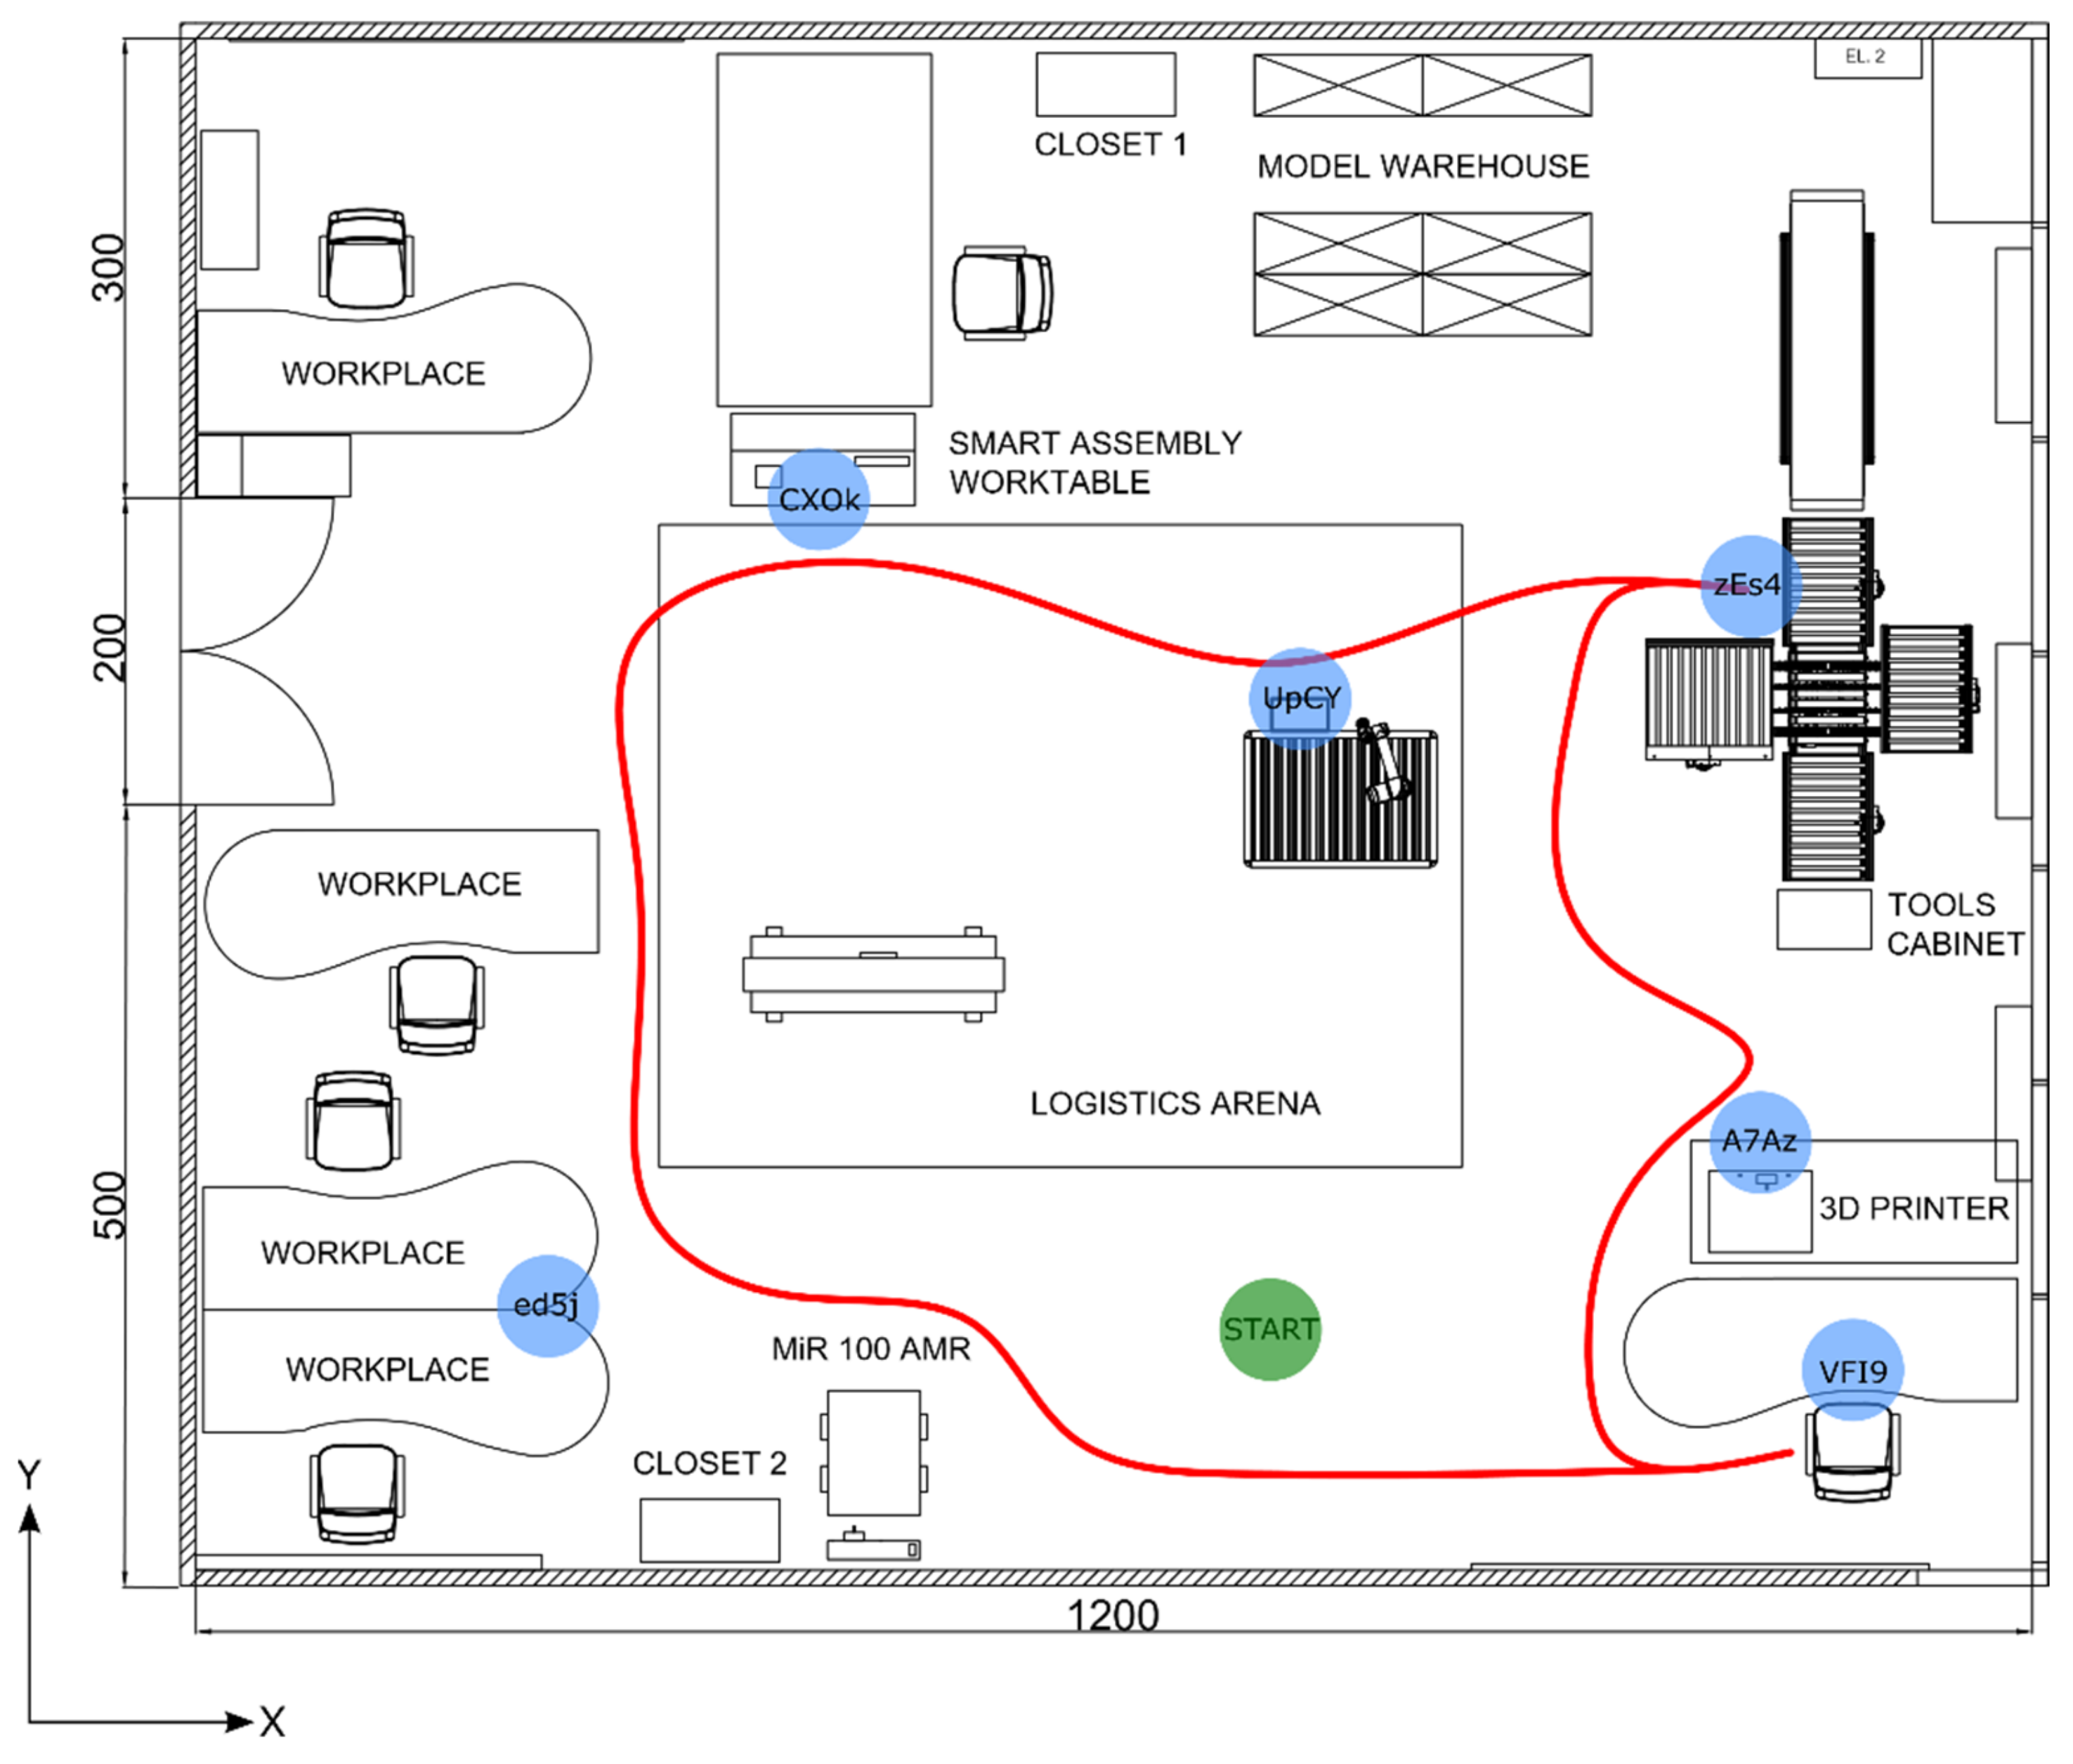
The most important metric of IPS evaluation is the rate of successful triggers with the occurrence of actual passings-by of the beacon. Additionally, the system must be resistant to false detections, which might occur if the beacons are not spaced apart appropriately. Therefore, three different scenarios were prepared to evaluate real-world performance. The real-time localization accuracy test was executed with the parameters specified in Table 6, with Scenario 1 being the reference scenario. Altogether, more than 400 events for a single Bluetooth USB adapter were recorded, with an overall detection success rate of 95.7% for the Trust Manga Bluetooth 4.0 USB adapter and 95.9% for the LM Technologies LM1010 adapter, respectively. The results are presented in Table 10.
Here, false positives were obtained by examining the log file of the measurements. As the person walking around moved between the beacons, the beacons’ IDs were known in advance in the predefined sequence (except in Scenario 3). In Scenario 3, the person had to note the walking path between the beacons. If a beacon appeared before the one that should, this was considered a false positive. For example, if the beacons were to be very close together and calibrated improperly, the system might detect a beacon that the person was not close to, which is referred to as a false positive. Similarly, false negatives were obtained in the same way, only this time, we looked for the ones that were absent from the measurement log file.
The results from the three different scenarios for the first USB Bluetooth adapters indicate that the proposed IPS works stably. In the first scenario, the success rate was 96.53%, with five false negatives, which was expected, according to the Beacon Calibration Tool analysis. In the second scenario, where the order-picker walked counterclockwise, the results improved marginally. The last scenario introduced a few false-positive detections into the measurements, therefore the overall success rate dropped a few percent. The average time delays between detection and the near proximity of the person to the beacons are approximately the same, which is also true for the Standard Deviation of the time delay. This means that the repeatability of the measurements is high. The negative sign indicates that the IPS detection of the beacon took place shortly before the person approached the beacon at a few centimeters.
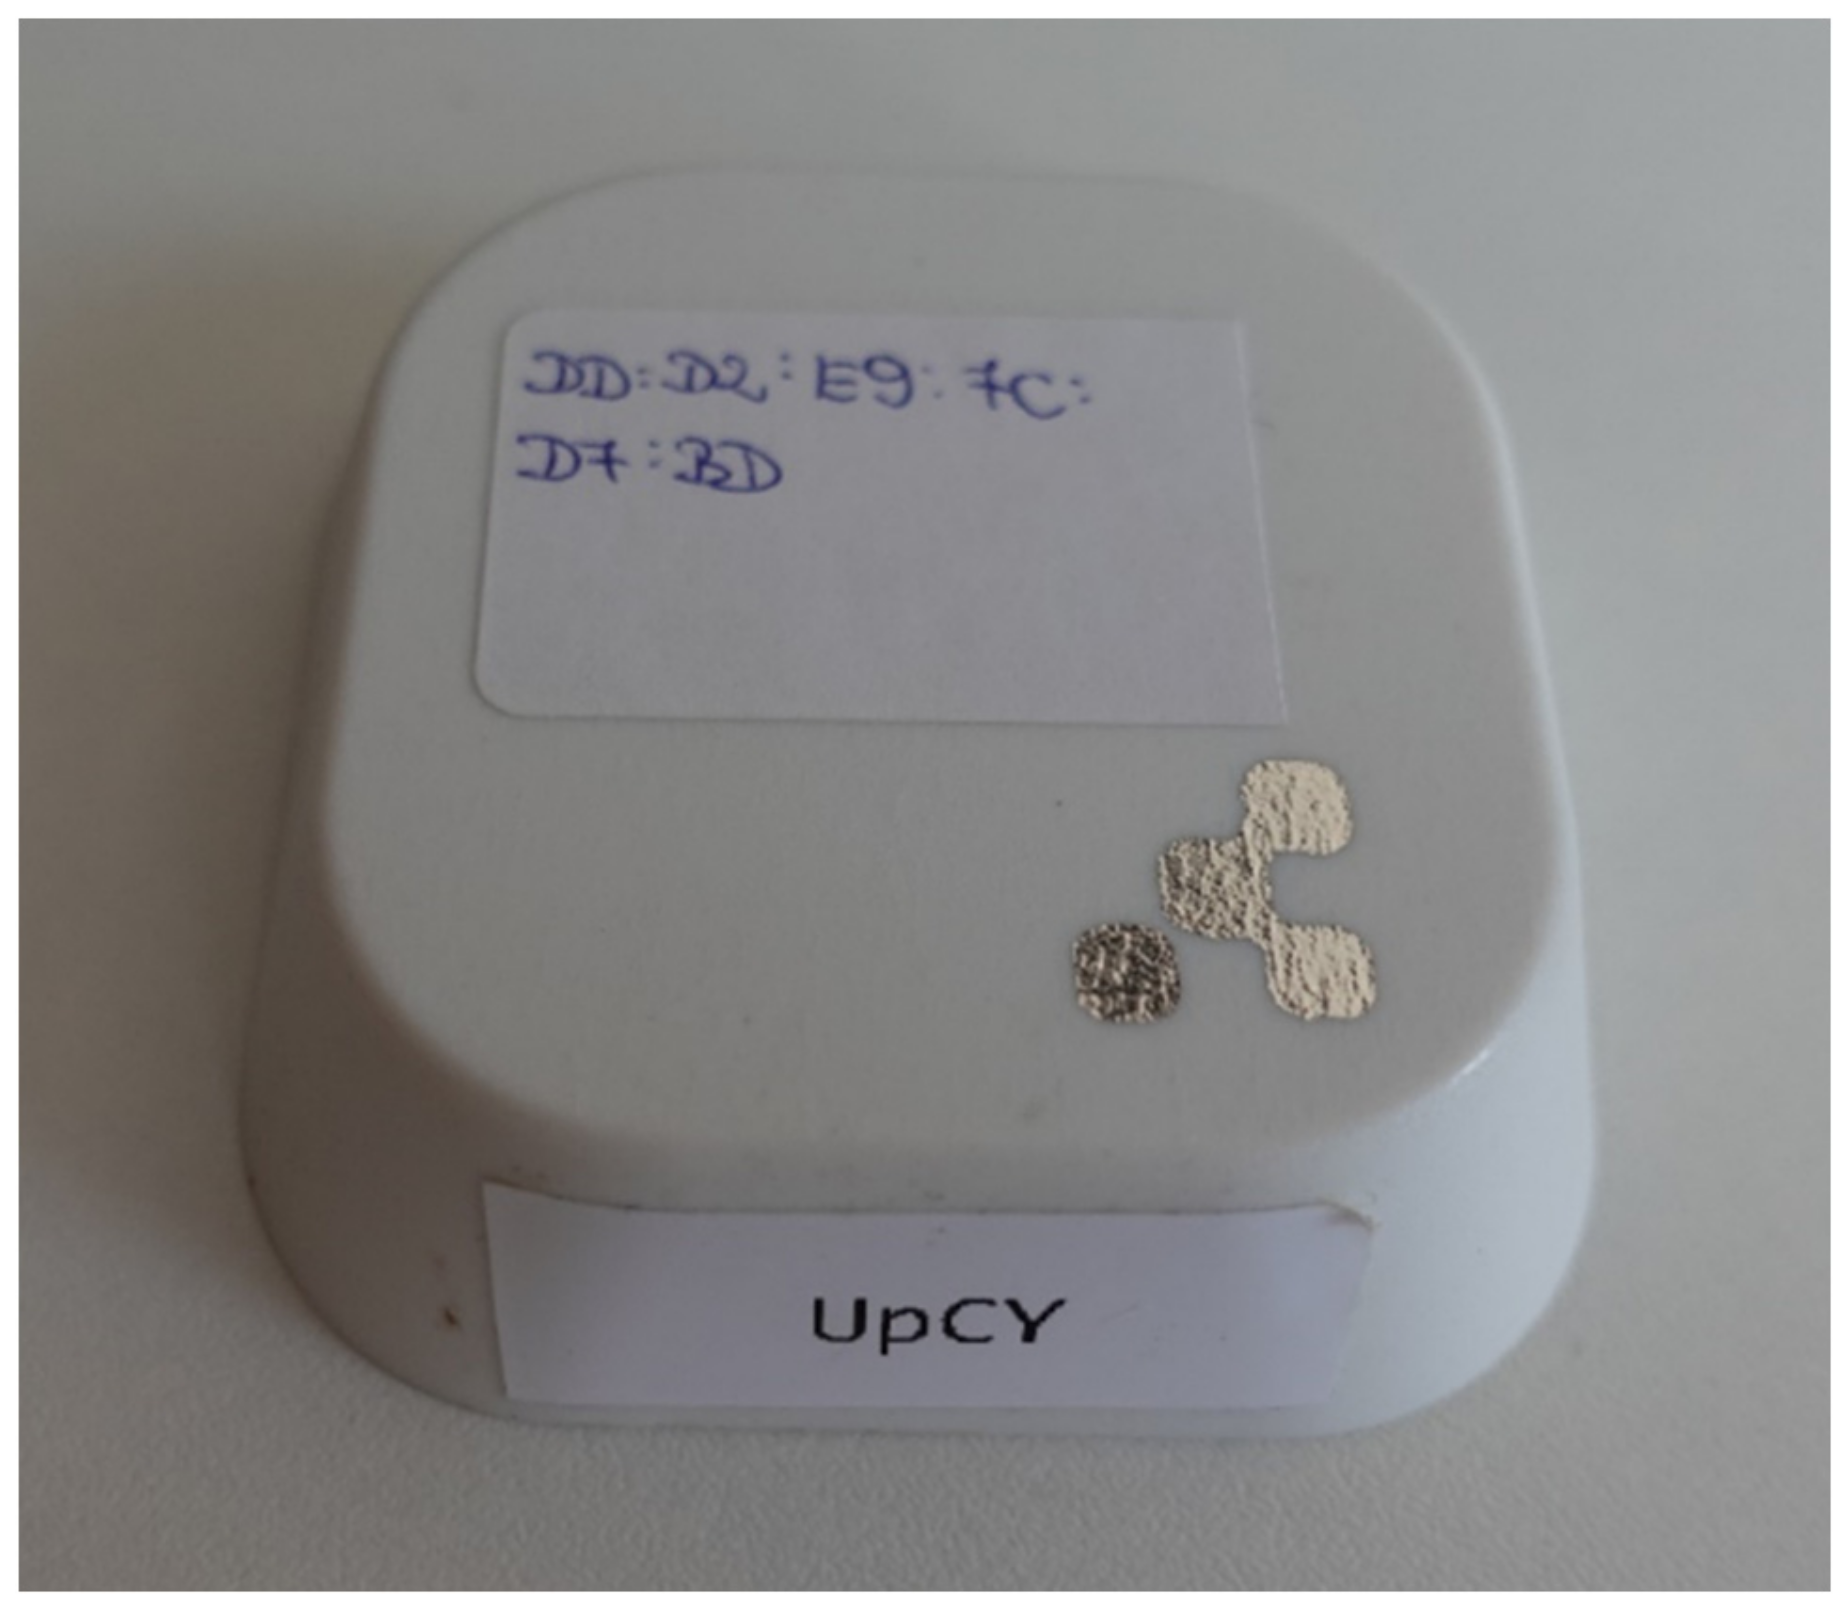
For the second used USB Bluetooth adapter, the results are also quite like the ones acquired by the first USB Bluetooth adapter. However, some differences arose in the average time delay and Standard Deviation of the time delay. The external antenna on the adapter provided more stable RSSI readings, but, in the case of Beacon 5 (UpCY), the beacon was detected much earlier than it should be, which contributed to the positive time delay. That is because there was no obstruction of the signal between beacon and receiver, and in the event of walking toward the receiver, the detection requirement was fulfilled quickly. This can be serviced by experimenting with beacon positioning and orientation, or using other Bluetooth USB adapters. Similarly, for the experiments conducted for both Bluetooth USB adapters, the Raspberry Pi onboard Bluetooth receiver was tested, but the results obtained in these experiments proved much worse than the ones with the external Bluetooth USB adapters.
Due to the similarities between the success rate of the first and second adapters, we tested how well the Trust Manga Bluetooth 4.0 USB adapter performed with the calibration values obtained with the LM Technologies LM1010 adapter. The results are presented in Table 11.
The above results indicate that the calibration procedure is necessary when using a different type of Bluetooth USB adapters, even if the same settings are used of the beacons transmitting power and interval. The results in the second scenario may be somewhat surprising, given that Scenario 1 and Scenario 3 achieved about 8–14% worse results. These results were, however, the consequence of having set thresholds for several beacons sub-optimally–the system may detect them in some cases, but not always, because the system filtered out more than it should.

5. Discussion

The results from the study of the proposed IPS indicate that the system worked stably and reliably in the office/laboratory setting with few false detections. The success rate of up to 98% in the office/laboratory setting was achieved in the best-case scenario and 93% in the worst-case scenario, respectively. The average time delay took −0.77 s in the worst-case, and −0.19 s in the best-case scenario, which means that the detection took place a bit later after the person approached a beacon, but the calibration values and beacon orientation could still be modified to achieve better results. The Standard Deviation of the time delay was approximately equal for all scenarios obtained using the Trust Manga Bluetooth 4.0 USB adapter, and was a bit higher for the results obtained by the LM Technologies LM1010 adapter. The false positive detection rate reached up to 5% and 1.5% passings-by not being detected in the worst-case scenario, respectively. The two external Bluetooth USB adapters used worked pretty similarly in terms of success rate, but achieved different results in terms of average time delay and Standard Deviation, which speaks in favor of the Trust Manga Bluetooth 4.0 USB. Due to the high-gain antenna used on the LM Technologies LM1010 adapter, the signal was very strong, and sometimes the beacon was detected too soon before the person approached the beacon. This is especially true if the line of sight between the beacon and the receiver is clear, and the calibration values are set incorrectly. We did not detect similar problems with the Trust Manga Bluetooth 4.0 USB, which is also more appropriate from the standpoint of dimensions.
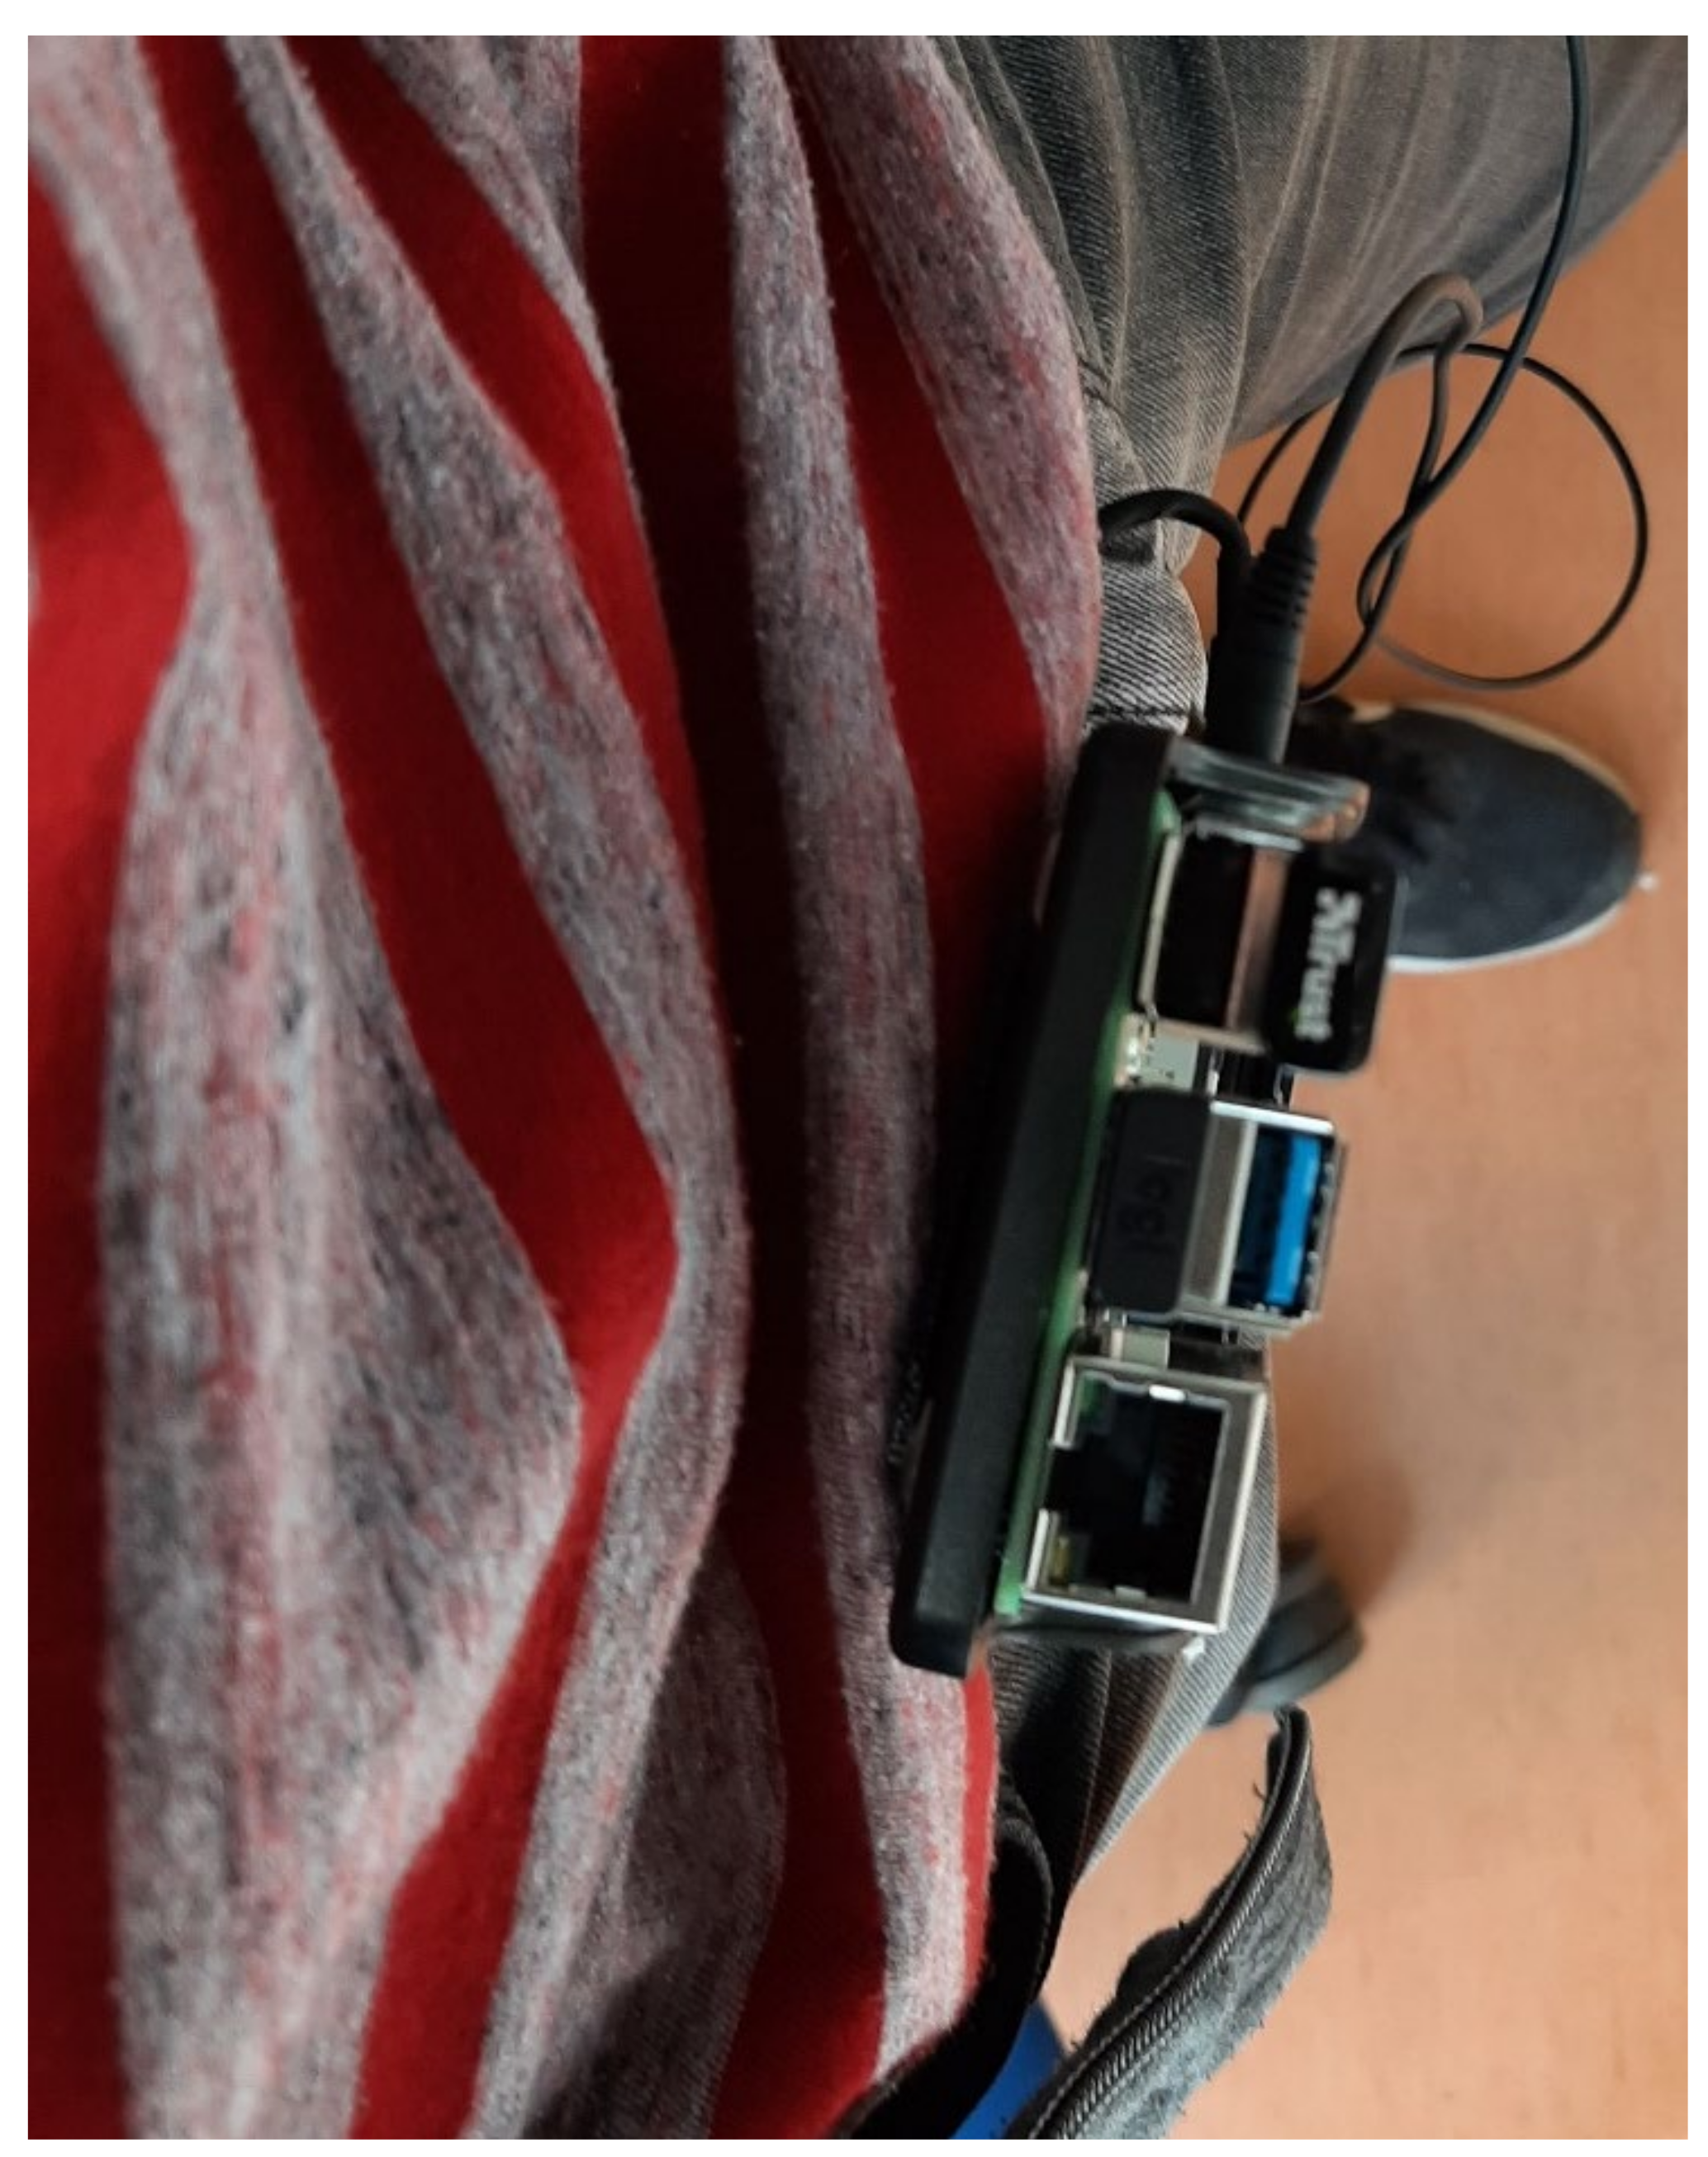
The interface of the proposed IPS is simple and adaptable in terms of using multiple beacons to cover larger areas or multiple rooms, because BLE beacons are relatively cheap devices. Their only running costs are batteries, which must be replaced periodically, but otherwise they do not require any servicing after the initial configuration. Multiple beacons can be configured in bulk over the air (OTA); hence, no physical connections are required between transmitters and receivers. The main drawback of the proposed IPS are the limitations on transmitter and receiver positions—we found that the system works best if the receiver is attached at the front, to the belt of the person carrying the receiver. It is preferred that the receiver is positioned as colinearly as possible to the main axis of the person carrying the system. The signals obtained from the transmitters are most stable if they are positioned at the receiver level, but higher and lower placements at around 20 cm are also tolerated well. Even though the calibration phase is almost fully automated, it can still take a considerable amount of time to perform the calibration for the first time, especially for larger areas or several rooms. Nevertheless, this can still be performed considerably faster than calibration using the fingerprinting method. The main advantage of the BLE technology is that the transmitters are not mutually dependent, if one of the beacons must be re-calibrated, it does not require recalibration of the whole system, as in UWB-based RTLS. Additionally, battery-powered devices that are very small can be placed almost anywhere.
The proposed IPS is not vendor dependent—it can be used with any BLE-capable beacons and receivers; however, results may vary greatly, as it was found that external Bluetooth receivers proved to be superior to the one integrated on Raspberry Pi. Additionally, multiple Bluetooth receivers can be used for several subjects; however, the running costs increase considerably, accounting for the multiple needed batteries and external Bluetooth receivers. Smartphones could also be used for the localization, but, again, the external Bluetooth receivers work significantly better in our experience, while the software had to be rewritten for the Android operating system. Since the required processing power for localization is low, systems requiring fewer beacons could probably run satisfactorily on other low-powered devices, such as Raspberry Pi Zero or older versions of Raspberry Pi, which consume less energy. Older Raspberry Pi versions would also present noticeable financial savings. Since the system runs on an open real-time localization engine, it could easily be modified to suit specific needs, not only those investigated in the experiment. The data gained by the IPS could be used in various applications: (1) to monitor the number of workers in the vicinity of a specific area, (2) to prevent worker congestion, (3) to track elderly patients in nursing homes, (4) to guide tourists in museums and entertainment centers, etc. The proposed IPS is presented as a framework to build upon, not a final solution. The authors can also provide raw data from the acquired measurements upon request.

6. Conclusions

The authors presented a cost-effective BLE-based IPS that can detect passings-by with very high accuracy (up to 98%) in office/laboratory environments with few false detections in real time. The calibration process is time-efficient and straightforward, and scales easily with greater area, compared to fingerprinting-based methods. The IPS is meant to be used in various fields, especially in small to mid-sized manually operated warehouses. We conclude that the localization accuracy depends mainly on the type of hardware used, the position of the transmitter and receiver, and the success of the calibration phase. In the above experiments, a single person was conducting the experiments, but the system can be scaled easily between multiple users. For the users to be distinguished uniquely, the localization engine must only post additional user data to the database. The localization algorithms are, namely, executed locally and are mutually independent.
Several new studies should be performed to find the best combinations of BLE beacons and receivers, which are smaller, more energy-efficient and especially economical for large IPS instalments, although the system is intended primarily for smaller to medium-sized manually operated warehouses. Additionally, the effect of different placements should be inspected, along with the influence of walking speed. In this setting, the current configuration can become quite expensive for larger areas or multiple rooms, making such a project financially unfeasible for larger warehouses. We also propose that researchers explore the option of beacons and Raspberry Pi stations being reversed—the beacons should be carried around and the Raspberry Pis should be placed on fixed positions. That way battery power requirements could be reduced further, as the Raspberry Pis could be powered via electrical outlets. If possible, BLE beacons that only use single channel for data transmission should be used, to reduce the RSSI information variation and packet loss further.

Author Contributions

P.B. prepared the conceptualization of the proposed IPS, methodology for the experiments, and the software and hardware parts of the proposed IPS. He also performed the experiments, and performed the necessary analysis of the data. D.H. and T.L. assisted with the preparation of the draft, writing, reviewing, and editing of the paper. They helped with the visualization and verification of the results, and gave many useful comments about the proposed methodology and performing the experiments. D.H. and T.L. additionally provided major contributions to the acquisition of project funding and project supervision. All authors have read and agreed to the published version of the manuscript.

Funding

This research work was supported by the Slovenian Research Agency (ARRS) on ARRS Young Researcher Program (Research activity agreement 2018/2019). D.H. and T.L. were supported by the ARRS Applied Research Project (Research activity agreement 2020/21) entitled: “Warehousing 4.0—Integration model of robotics and warehouse order picking systems”; grant number: L5-2626.

Institutional Review Board Statement

Ethical review and approval were waived for this study due to non-medical research.

Informed Consent Statement

Informed consent was obtained from all subjects involved in the study.

Data Availability Statement

All data obtained in this study are available upon request by contacting the corresponding author.

Acknowledgments

The authors would like to thank the entire team of the Laboratory for Cognitive Systems in Logistics at the Faculty of Logistics, for their support, useful comments, and suggestions. All individuals included in this section have consented to the acknowledgments.

Conflicts of Interest

The authors declare no conflict of interest.

References

  1. Statista. Logistics Industry—Market Size 2018–2024. Available online: https://www.statista.com/statistics/943517/logistics-industry-global-cagr/ (accessed on 20 November 2021).
  2. Statista. Total Global Logistics Market Size by Segment. 2018. Available online: https://www.statista.com/statistics/1069853/total-global-logistics-market-size-segment/ (accessed on 20 November 2021).
  3. Nagel, L.; Roidl, M.; Follert, G. The Internet of Things: On standardisation in the domain of intralogistics. In Proceedings of the First International Conference on the Internet of Things 2008, Zurich, Switzerland, 26–28 March 2008; pp. 16–21. [Google Scholar]
  4. Bartholdi, J.J.; Hackman, S.T. Warehouse & Distribution Science: Release 0.98.1; Supply Chain and Logistics Institute: Atlanta, GA, USA, 2016. [Google Scholar]
  5. Faber, N.; de Koster, R.B.M.; van de Velde, S.L. Linking warehouse complexity to warehouse planning and control structure. Int. J. Phys. Distrib. Logist. Manag. 2002, 32, 381–395. [Google Scholar] [CrossRef]
  6. Cimini, C.; Lagorio, A.; Pirola, F.; Pinto, R. Exploring human factors in Logistics 4.0: Empirical evidence from a case study. In Proceedings of the 9th IFAC Conference on Manufacturing Modelling, Management and Control MIM 2019, Berlin, Germany, 28–30 August 2019; pp. 2183–2188. [Google Scholar]
  7. Halawa, F.; Dauod, H.; Lee, I.G.; Li, Y.; Yoon, S.W.; Chung, S.H. Introduction of a real time location system to enhance the warehouse safety and operational efficiency. Int. J. Prod. Econ. 2020, 224, 107541. [Google Scholar] [CrossRef]
  8. Fadzilla, M.A.; Harun, A.; Shahriman, A.B. Localization Assessment for Asset Tracking Deployment by Comparing an Indoor Localization System with a Possible Outdoor Localization System. In Proceedings of the 2018 International Conference on Computational Approach in Smart Systems Design and Applications (ICASSDA), Kuching, Malaysia, 15–17 August 2018; pp. 1–6. [Google Scholar]
  9. Li, Z.; Cao, J.; Liu, X.; Zhang, J.; Hu, H.; Yao, D. A Self-Adaptive Bluetooth Indoor Localization System Using LSTM-Based Distance Estimator. In Proceedings of the International Conference on Computer Communications and Networks, ICCCN, Honolulu, HI, USA, 3–6 August 2020. [Google Scholar]
  10. Mendoza-Silva, G.M.; Torres-Sospedra, J.; Huerta, J. A Meta-Review of Indoor Positioning Systems. Sensors 2019, 19, 4507. [Google Scholar] [CrossRef] [Green Version]
  11. Khan, L.U. Visible light communication: Applications, architecture, standardization and research challenges. Digit. Commun. Netw. 2017, 3, 78–88. [Google Scholar] [CrossRef] [Green Version]
  12. Lovon-Melgarejo, J.; Castillo-Cara, M.; Huarcaya-Canal, O.; Orozco-Barbosa, L.; Garcia-Varea, I. Comparative Study of Supervised Learning and Metaheuristic Algorithms for the Development of Bluetooth-Based Indoor Localization Mechanisms. IEEE Access 2019, 7, 26123–26135. [Google Scholar] [CrossRef]
  13. Hung, L.-P.; Chao, Y.-H.; Chen, C.-L. A Hybrid Key Item Locating Method to Assist Elderly Daily Life Using Internet of Things. Mob. Netw. Appl. 2018, 24, 786–795. [Google Scholar] [CrossRef]
  14. Krishnan, S.; Mendoza Santos, R.X. Real-Time Asset Tracking for Smart Manufacturing. Intell. Syst. Ref. Libr. 2021, 202, 25–53. [Google Scholar] [CrossRef]
  15. Vandermeeren, S.; Steendam, H. PDR/UWB Based Positioning of a Shopping Cart. IEEE Sens. J. 2021, 21, 10864–10878. [Google Scholar] [CrossRef]
  16. Ridolfi, M.; Vandermeeren, S.; Defraye, J.; Steendam, H.; Gerlo, J.; De Clercq, D.; Hoebeke, J.; De Poorter, E. Experimental Evaluation of UWB Indoor Positioning for Sport Postures. Sensors 2018, 18, 168. [Google Scholar] [CrossRef] [Green Version]
  17. Piccinni, G.; Avitabile, G.; Coviello, G.; Talarico, C. Real-Time Distance Evaluation System for Wireless Localization. IEEE Trans. Circuits Syst. I Regul. Pap. 2020, 67, 3320–3330. [Google Scholar] [CrossRef]
  18. Sheikh, S.M.; Asif, H.M.; Raahemifar, K.; Al-Turjman, F. Time Difference of Arrival Based Indoor Positioning System Using Visible Light Communication. IEEE Access 2021, 9, 52113–52124. [Google Scholar] [CrossRef]
  19. Zhang, H.; Cui, J.; Feng, L.; Yang, A.; Lv, H.; Lin, B.; Huang, H. High-Precision Indoor Visible Light Positioning Using Deep Neural Network Based on the Bayesian Regularization with Sparse Training Point. IEEE Photonics J. 2019, 11, 1–10. [Google Scholar] [CrossRef]
  20. Torres, J.C.; Montes, A.; Mendoza, S.L.; Fernandez, P.R.; Betancourt, J.S.; Escandell, L.; Del Valle, C.I.; Sanchez-Pena, J.M. A Low-Cost Visible Light Positioning System for Indoor Positioning. Sensors 2020, 20, 5145. [Google Scholar] [CrossRef] [PubMed]
  21. Yang, C.; Shao, H.-R. WiFi-based indoor positioning. IEEE Commun. Mag. 2015, 53, 150–157. [Google Scholar] [CrossRef]
  22. Bai, Y.B.; Wu, S.; Retscher, G.; Kealy, A.; Holden, L.; Tomko, M.; Borriak, A.; Hu, B.; Wu, H.R.; Zhang, K. A new method for improving Wi-Fi-based indoor positioning accuracy. J. Locat. Based Serv. 2014, 8, 135–147. [Google Scholar] [CrossRef]
  23. Ezhumalai, B.; Song, M.; Park, K. An Efficient Indoor Positioning Method Based on Wi-Fi RSS Fingerprint and Classification Algorithm. Sensors 2021, 21, 3418. [Google Scholar] [CrossRef]
  24. Our History. Bluetooth Technology Website. Available online: https://www.bluetooth.com/about-us/our-history/ (accessed on 26 November 2021).
  25. Shen, Y.; Hwang, B.; Jeong, J.P. Particle Filtering-Based Indoor Positioning System for Beacon Tag Tracking. IEEE Access 2020, 8, 226445–226460. [Google Scholar] [CrossRef]
  26. Ramirez, R.; Huang, C.Y.; Liao, C.A.; Lin, P.T.; Lin, H.W.; Liang, S.H. A Practice of BLE RSSI Measurement for Indoor Positioning. Sensors 2021, 21, 5181. [Google Scholar] [CrossRef]
  27. Alsmadi, L.; Kong, X.; Sandrasegaran, K.; Fang, G. An Improved Indoor Positioning Accuracy Using Filtered RSSI and Beacon Weight. IEEE Sens. J. 2021, 21, 18205–18213. [Google Scholar] [CrossRef]
  28. Xu, S.; Wang, Y.; Sun, M.; Si, M.; Cao, H. A Real-Time BLE/PDR Integrated System by Using an Improved Robust Filter for Indoor Position. Appl. Sci. 2021, 11, 8170. [Google Scholar] [CrossRef]
  29. Pinto, B.; Barreto, R.; Souto, E.; Oliveira, H. Robust RSSI-Based Indoor Positioning System Using K-Means Clustering and Bayesian Estimation. IEEE Sens. J. 2021, 21, 24462–24470. [Google Scholar] [CrossRef]
  30. Jamil, H.; Qayyum, F.; Jamil, F.; Kim, D.H. Enhanced PDR-BLE Compensation Mechanism Based on HMM and AWCLA for Improving Indoor Localization. Sensors 2021, 21, 6972. [Google Scholar] [CrossRef] [PubMed]
  31. Jiang, J.R.; Subakti, H.; Liang, H.S. Fingerprint Feature Extraction for Indoor Localization. Sensors 2021, 21, 5434. [Google Scholar] [CrossRef] [PubMed]
  32. Ruan, L.; Zhang, L.; Zhou, T.; Long, Y. An Improved Bluetooth Indoor Positioning Method Using Dynamic Fingerprint Window. Sensors 2020, 20, 7269. [Google Scholar] [CrossRef] [PubMed]
  33. Dinh, T.M.T.; Duong, N.S.; Nguyen, Q.T. Developing a Novel Real-Time Indoor Positioning System Based on BLE Beacons and Smartphone Sensors. IEEE Sens. J. 2021, 21, 23055–23068. [Google Scholar] [CrossRef]
  34. Bai, L.; Ciravegna, F.; Bond, R.; Mulvenna, M. A Low Cost Indoor Positioning System Using Bluetooth Low Energy. IEEE Access 2020, 8, 136858–136871. [Google Scholar] [CrossRef]
  35. Ho, Y.H.; Chan, H.C.B. Decentralized adaptive indoor positioning protocol using Bluetooth Low Energy. Comput. Commun. 2020, 159, 231–244. [Google Scholar] [CrossRef]
  36. Serhan Danis, F.; Taylan Cemgil, A.; Ersoy, C. Adaptive Sequential Monte Carlo Filter for Indoor Positioning and Tracking with Bluetooth Low Energy Beacons. IEEE Access 2021, 9, 37022–37038. [Google Scholar] [CrossRef]
  37. Lie, M.M.K.; Kusuma, G.P. A fingerprint-based coarse-to-fine algorithm for indoor positioning system using Bluetooth Low Energy. Neural Comput. Appl. 2021, 33, 2735–2751. [Google Scholar] [CrossRef]
  38. Yang, S.; Liu, J.; Gong, X.; Huang, G.; Bai, Y. A Robust Heading Estimation Solution for Smartphone Multisensor-Integrated Indoor Positioning. IEEE Internet Things J. 2021, 8, 17186–17198. [Google Scholar] [CrossRef]
  39. Assayag, Y.; Oliveira, H.; Souto, E.; Barreto, R.; Pazzi, R. Indoor Positioning System Using Dynamic Model Estimation. Sensors 2020, 20, 7003. [Google Scholar] [CrossRef]
  40. Zhao, Z.; Zhang, M.; Yang, C.; Fang, J.; Huang, G.Q. Distributed and collaborative proactive tandem location tracking of vehicle products for warehouse operations. Comput. Ind. Eng. 2018, 125, 637–648. [Google Scholar] [CrossRef]
  41. Fister, I., Jr.; Yang, X.S.; Brest, J.; Fister, D. A brief review of nature-inspired algorithms for optimization. Electrotech. Rev. 2013, 80, 116–122. [Google Scholar]
  42. Yang, X.-S. Nature-Inspired Optimization Algorithms, 1st ed.; Elsevier: New York, NY, USA, 2014; pp. 26–29. [Google Scholar]
  43. Bäck, T. Evolutionary Algorithms in Theory and Practice: Evolution Strategies, Evolutionary Programming, Genetic Algorithms; Oxford University Press: New York, NY, USA, 1996; p. 328. [Google Scholar]
  44. Rechenberg, I. Evolutionsstrategie: Optimierung Technischer Systeme nach Prinzipien der Biologischen Evolution; Frommann-Holzbog: Stuttgart, Germany, 1994. [Google Scholar]
  45. Schwefel, H.P. Numerische Optimierung von Computer-Modellen Mittels der Evolutionsstrategie, 1st ed.; Birkhäuser: Basel, Switzerland, 1977. [Google Scholar]
  46. Storn, R.; Price, K. Differential Evolution—A Simple and Efficient Heuristic for Global Optimization over Continuous Spaces. J. Glob. Optim. 1997, 11, 341–359. [Google Scholar] [CrossRef]
  47. Brest, J.; Zamuda, A.; Bošković, B.; Maučec, M.S.; Žumer, V. Dynamic optimization using self-adaptive differential evolution. In Proceedings of the 2009 IEEE Congress on Evolutionary Computation, Trondheim, Norway, 18–21 May 2009; pp. 415–422. [Google Scholar]
  48. Eberhart, R.; Kennedy, J. A new optimizer using particle swarm theory. In Proceedings of the MHS’95, Sixth International Symposium on Micro Machine and Human Science, Nagoya, Japan, 4–6 October 1995; pp. 39–43. [Google Scholar]
  49. Yang, X.-S. A New Metaheuristic Bat-Inspired Algorithm. In Nature Inspired Cooperative Strategies for Optimization (NICSO 2010); Studies in Computational Intelligence; González, J.R., Pelta, D.A., Cruz, C., Terrazas, G., Krasnogor, N., Eds.; Springer: Berlin/Heidelberg, Germany, 2010; pp. 65–74. [Google Scholar]
  50. Šafarič, J.; Bencak, P.; Fister, D.; Šafarič, R.; Fister, I. Use of stochastic nature-inspired population-based algorithms within an online adaptive controller for mechatronic devices. Appl. Soft Comput. 2020, 95, 106559. [Google Scholar] [CrossRef]
  51. Li, G.; Geng, E.; Ye, Z.; Xu, Y.; Lin, J.; Pang, Y. Indoor Positioning Algorithm Based on the Improved RSSI Distance Model. Sensors 2018, 18, 2820. [Google Scholar] [CrossRef] [PubMed] [Green Version]
  52. Tomažic, S.; Škrjanc, I. An Automated Indoor Localization System for Online Bluetooth Signal Strength Modeling Using Visual-Inertial SLAM. Sensors 2021, 21, 2857. [Google Scholar] [CrossRef]
  53. Li, Z.; Tian, Z.; Wang, Z.; Zhang, Z. Multipath-Assisted Indoor Localization Using a Single Receiver. IEEE Sens. J. 2021, 21, 692–705. [Google Scholar] [CrossRef]
  54. Yu, H.K.; Oh, S.H.; Kim, J.G. AI based Location Tracking in WiFi Indoor Positioning Application. In Proceedings of the 2020 International Conference on Artificial Intelligence in Information and Communication, ICAIIC 2020, Fukuoka, Japan, 19–21 February 2020; pp. 199–202. [Google Scholar]
  55. Kontakt.io. BLE Bluetooth Beacons Technology Guide. Available online: https://kontakt.io/what-is-a-beacon/ (accessed on 26 November 2021).
  56. Bluetooth Technology Overview. Available online: https://www.bluetooth.com/learn-about-bluetooth/tech-overview/ (accessed on 24 November 2021).
  57. BLE Beacons and Location-Based Services. Available online: https://www.accton.com/Technology-Brief/ble-beacons-and-location-based-services/ (accessed on 26 November 2021).
  58. How Bluetooth Technology Uses Adaptive Frequency Hopping to Overcome Packet Interference. Available online: https://www.bluetooth.com/blog/how-bluetooth-technology-uses-adaptive-frequency-hopping-to-overcome-packet-interference/ (accessed on 26 November 2021).
  59. Huang, B.; Liu, J.; Sun, W.; Yang, F. A Robust Indoor Positioning Method based on Bluetooth Low Energy with Separate Channel Information. Sensors 2019, 19, 3487. [Google Scholar] [CrossRef] [Green Version]
  60. Packets Interleaving—Kontakt.io Knowledge Base. Available online: https://knowledgebase.kontakt.io/hardware/packets/interleaving/ (accessed on 29 November 2021).
  61. Hernández-Rojas, D.L.; Fernández-Caramés, T.M.; Fraga-Lamas, P.; Escudero, C.J. Design and Practical Evaluation of a Family of Lightweight Protocols for Heterogeneous Sensing through BLE Beacons in IoT Telemetry Applications. Sensors 2018, 18, 57. [Google Scholar] [CrossRef] [Green Version]
  62. Smart Beacon. Available online: https://store.kontakt.io/product/smart-beacon/ (accessed on 29 November 2021).
  63. Trust—Manga Bluetooth 4.0 Adapter. Available online: https://www.trust.com/en/product/18187-manga-bluetooth-4-0-adapter (accessed on 26 November 2021).
  64. Bluetooth® v4.0 Dual Mode Long Range USB Adapter—LM1010. Available online: https://www.lm-technologies.com/product/bluetooth-v4-0-dual-mode-long-range-usb-adapter-lm1010/ (accessed on 26 November 2021).
  65. RP SMA Antenna 2dBi—LM251. Available online: https://www.lm-technologies.com/product/rp-sma-antenna-2dbi-lm251/ (accessed on 26 November 2021).
  66. Ltd, R.P. Raspberry Pi 4 Model B Specifications. Available online: https://www.raspberrypi.com/products/raspberry-pi-4-model-b/ (accessed on 26 November 2021).
  67. Munoz, D.; Lara, F.B.; Vargas, C.; Enriquez-Caldera, R. Position Location Techniques and Applications; Academic Press, Inc.: Cambridge, MA, USA, 2009. [Google Scholar]
  68. Rappaport, T.S. Wireless Communications: Principles and Practice, 2nd ed.; Prentice Hall PTR: Hoboken, NJ, USA, 1996. [Google Scholar]
  69. Harvey, I. IanHarvey/Bluepy. Available online: https://github.com/IanHarvey/bluepy (accessed on 23 June 2021).
  70. Developers, G. Sheets API. Available online: https://developers.google.com/sheets/api (accessed on 20 November 2021).
  71. Imran, M.; Hashim, R.; Khalid, N.E.A. An Overview of Particle Swarm Optimization Variants. Proc. Eng. 2013, 53, 491–496. [Google Scholar] [CrossRef] [Green Version]
  72. Kachitvichyanukul, V. Comparison of Three Evolutionary Algorithms: GA, PSO, and DE. Ind. Eng. Manag. Syst. 2012, 11, 215–223. [Google Scholar] [CrossRef] [Green Version]
  73. 6.4.3.1. Single Exponential Smoothing. Available online: https://www.itl.nist.gov/div898/handbook/pmc/section4/pmc431.htm (accessed on 20 October 2021).
Figure 1. Original kontakt.io Smart Beacon SB16-2.
Electronics 11 00308 g001
Figure 2. Raspberry Pi 4 microcomputer.
Electronics 11 00308 g002
Figure 3. Phases of the proposed indoor positioning system.
Electronics 11 00308 g003
Figure 4. Calibration procedure.
Electronics 11 00308 g004
Figure 5. Beacon calibration tool, developed in MATLAB.
Electronics 11 00308 g005
Figure 6. The PSO optimization process in MATLAB.
Electronics 11 00308 g006
Figure 7. Real-time detection phase.
Electronics 11 00308 g007
Figure 8. Tracker application main window.
Electronics 11 00308 g008
Figure 9. Position of the selected beacons for the experiments.
Electronics 11 00308 g009
Figure 10. Layout of the test setting in the Laboratory for Cognitive Systems in Logistics. The red line indicates the path of the person performing the experiments. The blue circles represent the used beacons.
Electronics 11 00308 g010
Figure 11. Raspberry Pi attached to a person’s belt.
Electronics 11 00308 g011
Figure 12. Best fitness function value by generation, generated in the Beacon Calibration Tool.
Electronics 11 00308 g012
Table 1. Smart Beacon SB16-2 specification [62].
Specification
Supported Bluetooth versionBluetooth 4.2
Dimensions56 mm × 55 mm × 15 mm
Weight35 g
RangeUp to 70 m
Supported protocolsiBeacon, Eddystone
Available transmission power levels0 (−30 dBm), 1 (−20 dBm), 2 (−16 dBm), 3 (−12 dBm), 4 (−8 dBm), 5 (−4 dBm), 6 (0 dBm), 7 (4 dBm)
Sensitivity−93 dBm
Battery Life (Tx = −12 dBm; interval = 350 ms)Up to 24 months
(original batteries)
Table 2. Bluetooth USB adapter specifications.
Specification
Bluetooth USB adapterTrust Manga Bluetooth 4.0 USB [63]LM Technologies LM1010 [64]
Supported Bluetooth version4.04.0
Range15 mAntenna dependent
Dimensions17.6 mm × 13 mm × 4.5 mm58.5 mm × 28 mm × 14 mm (without antenna)
Weight3 g11 g
AntennaOnboardLM251 (2 dBi) [65]
Table 3. Raspberry Pi 4 (8 GB) technical specifications [66].
Specification
ProcessorBroadcom BCM2711, Quad core Cortex-A72 (ARM v8) 64-bit SoC @ 1.5 GHz
RAM8 GB LPDDR4-3200 SDRAM
Connectivity2.4 GHz and 5.0 GHz IEEE 802.11ac wireless, Bluetooth 5.0, BLE
EthernetGigabit Ethernet
Table 4. Location and height of beacons used in the office/laboratory setting.
Parameter/Beacon (ID)Location [m]Height [m]
Beacon 1 (A7Az)X: 9.01, Y: 2.920.85
Beacon 2 (VFI9)X: 10.12, Y: 1.460.86
Beacon 3 (zEs4)X: 9.65, Y: 6.401.04
Beacon 4 (ed5j)X: 2.47, Y: 2.240.86
Beacon 5 (UpCY)X: 6.45, Y: 5.280.99
Beacon 6 (CXOk)X: 4.20, Y: 7.241.03
Table 5. Calibration phase parameter settings.
ParameterValue
Transmitting   power   ( T xPower )−16 dBm
Transmitting   interval   ( T s )20 ms
Raspberry Pi scan rate (ms)100 ms
Movement   speed   ( v m )≈5 km/h
Perpendicular distance from receiver to beacon (d)0.5 m
Number of samples (n) per beacon7–9
Table 6. Parameter settings for scenarios 1–3.
Scenario/ParameterScenarios 1–3
Transmitting   power   ( T xPower )−16 dBm
Transmitting   interval   ( T s )20 ms
Raspberry Pi scan rate (ms)100 ms
BLE scanner timeout (ms)0 ms
Movement   speed   ( v m )≈5 km/h
Table 7. Beacon Calibration Tool parameter settings.
BeaconSensitivityNumber of SamplesNumber of Evaluations
1–50.858500
60.854500
Table 8. Results of Beacon Calibration Tool verification using LM Technologies LM1010.
Parameter/BeaconSetting 1Setting 2Setting 3Setting 4
Threshold [dBm]Threshold [dBm]Threshold [dBm]Threshold [dBm]
Beacon: CXOk−63.8−65.3−72.8−72.8
Number of matches/collected samples analyzed in the Beacon Calibration Tool7/77/78/88/8
Number of passings-by (n)27312731
False positives (fp) 10022
False negatives(fn) 22200
Successful triggers (ns)25292529
Success rate (SR)92.59%93.55%92.59%93.55%
Average   time   delay   ( t d ¯ )−0.79 s−0.69 s−0.10 s0.32 s
Standard   Deviation   of   time   delay   ( σ t d )0.17 s0.28 s0.52 s0.49 s
1 False positive—system detects passing by, even if there was none. 2 False negative—system does not detect actual passing by.
Table 9. Threshold values for the Bluetooth USB adapters, obtained in the Beacon Calibration Tool. All values are in dBm.
Bluetooth USB Adapter/Beacon (ID)Trust Manga Bluetooth 4.0 USBLM Technologies LM1010
Beacon 1 (A7Az)−61.4−60.5
Beacon 2 (VFI9)−63.2−64.0
Beacon 3 (zEs4)−57.8−60.0
Beacon 4 (ed5j)−63.5−64.5
Beacon 5 (UpCY)−63.0−63.0
Beacon 6 (CXOk)−68.5−67.0
Table 10. Results of real-time localization for two external Bluetooth USB adapters.
Bluetooth USB AdapterTrust Manga Bluetooth 4.0 USBLM Technologies LM1010
Scenario/ResultScenario 1Scenario 2Scenario 3Scenario 1Scenario 2Scenario 3
Number of passings-by (n)144143121137145135
False positives (fp)002022
False negatives (fn)546706
Successful triggers (ns)139139113130143128
Success rate (SR)96.53%97.20%93.39%94.89%98.62%94.07%
Average   time   delay   ( t d ¯ )−0.61 s−0.63 s−0.77 s−0.31 s0.24 s−0.19 s
Standard   Deviation   of   time   delay   ( σ t d )0.42 s0.49 s0.51 s0.61 s0.83 s0.53 s
Table 11. Results of real-time localization for the Trust Manga Bluetooth 4.0 USB adapter, using the calibration values from the LM Technologies LM1010 adapter. Calibration values are shown in Table 9.
Scenario/ResultScenario 1Scenario 2Scenario 3
Number of passings-by (n)494744
False positives (fp)100
False negatives (fn)639
Successful triggers (ns)424435
Success rate (SR)85.71%93.62%79.55%
Average   time   delay   ( t d ¯ )−0.82 s−0.79 s−0.79 s
Standard   Deviation   of   the   time   delay   ( σ t d )0.52 s0.41 s0.38 s
Publisher’s Note: MDPI stays neutral with regard to jurisdictional claims in published maps and institutional affiliations.

