Article

Simulation Study on Variable Pressure Margin Energy Recovery of Electric Loader Actuator

School of Mechanical Engineering, Guizhou University, Guiyang 550025, China
*
Author to whom correspondence should be addressed.
Electronics 2022, 11(24), 4215; https://doi.org/10.3390/electronics11244215
Submission received: 13 November 2022 / Revised: 30 November 2022 / Accepted: 5 December 2022 / Published: 16 December 2022

Abstract

:
The conventional electric loader uses a motor instead of an engine, which aligns with the current energy-saving and emission-reduction trend. However, the motor’s speed control performance and overload capacity are under-utilized, and the actuator suffers from the potential energy waste problem of the boom arm. This study proposes a variable pressure margin energy recovery system for the electric loader actuator. It uses a combination of a permanent magnet synchronous motor (PMSM) and a quantitative pump. It can achieve variable pressure margin control and energy recovery through the pressure feedback closed-loop control. AMESim is used to build the simulation model based on the system control strategy, actuator, supercapacitor, and PMSM mathematical mode. Under typical working conditions, the simulation study is conducted on a 50-type wheel loader to obtain cylinder displacement, system energy recovery, and energy-saving performance. The simulation results show that the system is feasible and can effectively reduce energy consumption. Its energy recovery efficiency is 65.4%. The PMSM energy supply is reduced by 28.6% with the variable pressure margin control. It has high energy-saving performance, and the energy-saving efficiency is 38.5%. It provides a reference for research on energy-saving systems for electric construction machinery.

1. Introduction

With global warming, the energy crisis, the rising oil prices, and the increasing improvement of emission regulations, conventional construction types of machinery with low energy efficiency and serious emissions can no longer meet the needs of the countries and the sustainable development of the industries in recent years. The pure electric system is an inevitable trend in developing construction machinery [1]. The electric construction type of machinery eliminates the engines and uses motors as the central drive units, which have the advantages of high power and energy efficiency, zero emissions, and are considered one of the ideal energy-saving and emission-reducing drive methods [2].
The PMSM has attracted more and more attention because of its high torque density and efficiency [3]. It is widely used in electric construction machinery because of its additional advantages of fast torque response and high-performance operation. The speed regulation control strategy of the PMSM is mainly divided into the variable-voltage variable-frequency control (VVVF), the direct torque control (DTC), the speed sensorless control, and the space vector pulse width modulation control (SVPWM) [4]. The SVPWM control system mainly includes a speed loop, current loop, and SVPWM control algorithm. With the development of sensor technology, the system can be detected in real-time and controlled [5,6]. Therefore, many scholars have applied sliding film control, fuzzy control, model predictive control, and other algorithms to PMSM speed control to further improve the performance of the PMSM. The SVPWM is a standard and successful technology for PMSM speed control [7].
The loaders are highly adaptable, flexible, and efficient as essential off-road machinery for construction transports. Therefore, they are widely used in mining, port terminal, and highway construction [8]. The actuator hydraulic system of the loaders also evolved from valve-controlled to pump-controlled technology with the development of hydraulic technology [9]. Using load-sensing (LS) technology to replace the throttling technology can reduce system overflow losses and improve system energy utilization. The series connection of pressure compensating valves before and after the multi-way valves allow the LS system to precisely control multiple actuators under conditions where a single pump is a driving unit [10]. Furthermore, the pressure compensation valves allow the pump outlet pressure to maintain the maximum load pressure value plus the preset LS differential pressure value to meet all the actuators. It also effectively avoids disturbances in flow distribution from individual actuators due to changes in load and operator commands. The preset LS pressure margin value is usually deliberately fixed at a high value to overcome throttling losses under the most severe operating conditions (maximum flow and minimum temperature) [11]. Therefore, it causes system pressure loss which leads to energy loss. Since the machine-hydraulic system with pressure feedback controls the LS pump, the system is less hydraulically damped and less stable under certain operating conditions [12]. Introducing the sensors to build electro-hydraulic control systems can effectively improve the performance of hydraulic systems in conventional scenarios [13,14,15]. Shengjie Fu et al. proposed an LS system of a quantitative pump based on variable speed control. A variable LS pressure margin control strategy was proposed for the static LS differential pressure that cannot meet the high efficiency of construction machinery under complex working conditions. It was tested on an 8 t pure electric drive excavator. The test results showed that it effectively reduced and improved the energy-saving performance of the system [16]. Madau R et al. proposed a variable LS pressure margin control strategy that was applied to the LS systems that used post-valve pressure compensation technology and tested on a full-size wheel loader. The test results showed that the system effectively reduced the loader energy consumption [17]. Therefore, using the sensor-based variable pressure margin LS systems can effectively improve the energy-saving performance of the systems.
The boom cylinders perform cyclic repetitive motion when the loaders perform loading and unloading operations. A large amount of actuator potential energy is converted into heat energy due to the multi-way valve throttling effect, causing the hydraulic oil temperature to rise. In severe cases, it may cause the deterioration of hydraulic oil, directly affecting the loader’s service life and work performance [18]. The loader energy recovery can effectively solve this problem. Jiangjiang Feng proposed a potential energy recovery and reuse system for driving the loader boom arm based on the three-chamber hydraulic cylinder, building the test platform of the loader based on it. The test results showed that it had an excellent energy-saving performance and made the operation process of the actuator smoother [19]. Lin Li et al. proposed an electro-hydraulic driving and energy recovery system for the excavator boom arm based on the battery and accumulator. A model of electro-hydraulic driving and power management strategy of a 1.6 t pure electric hydraulic excavator was established. The simulation results showed that the system’s potential energy recovery efficiency was as high as 92%, effectively reducing the system’s energy consumption [20]. Therefore, the energy recovery of the loader actuators can effectively improve the energy-saving performance of the systems.
A variable pressure margin energy recovery system Is proposed for the electric loader based on the above analysis and combined with the characteristics of the hydraulic system of the actuator. It uses the supercapacitor as the energy storage element. It can realize the variable LS pressure margin control and the variable pressure margin control of the pressure compensation valve according to the input control signal through pressure feedback closed-loop control. At the same time, the potential energy of the actuator can be recovered and stored in the supercapacitor when the boom arm drops. The simulation results show that the variable pressure margin control and energy recovery can effectively reduce the energy consumption of the electric loader.
The paper Is organized as follows. Section 2 introduces the working principle of the system. Section 3 introduces the analysis of the system mathematical model. Section 4 introduces the modeling and simulation of the system. Section 5 and Section 6 are the discussions and the conclusions, respectively.

2. Working Principle of the System

This section analyzes the working principle of the conventional system, the new system’s working principle, and the system’s control strategy.

2.1. Working Principle of the Conventional System

As shown in Figure 1, the system is an open-type system. The PMSM 2 drives the LS pump 1 to supply oil to the whole system, and the shuttle valve 6 feeds the maximum load pressure signal of the system to the pump to meet the pressure and flow of the actuator. The actuator can perform compound actions due to the system’s pre-valve pressure compensation technology. One-way relief valves 9.1, 9.2, and 9.3 are equipped with overload protection and oil replenishment functions. There is no fuel consumption or pollution emission as the system uses the PMSM as the power source, which aligns with the current energy-saving and emission-reduction trend. However, the PMSM’s speed control performance and overload capacity are under-utilized [16]. The LS and pressure compensation valves cannot be adjusted in real time to meet the demand of the actuator, which causes unnecessary energy loss in the system. At the same time, a large amount of actuator potential energy is directly converted into heat energy through boom multi-way valve 7 when the boom arm drops. It results in energy waste.

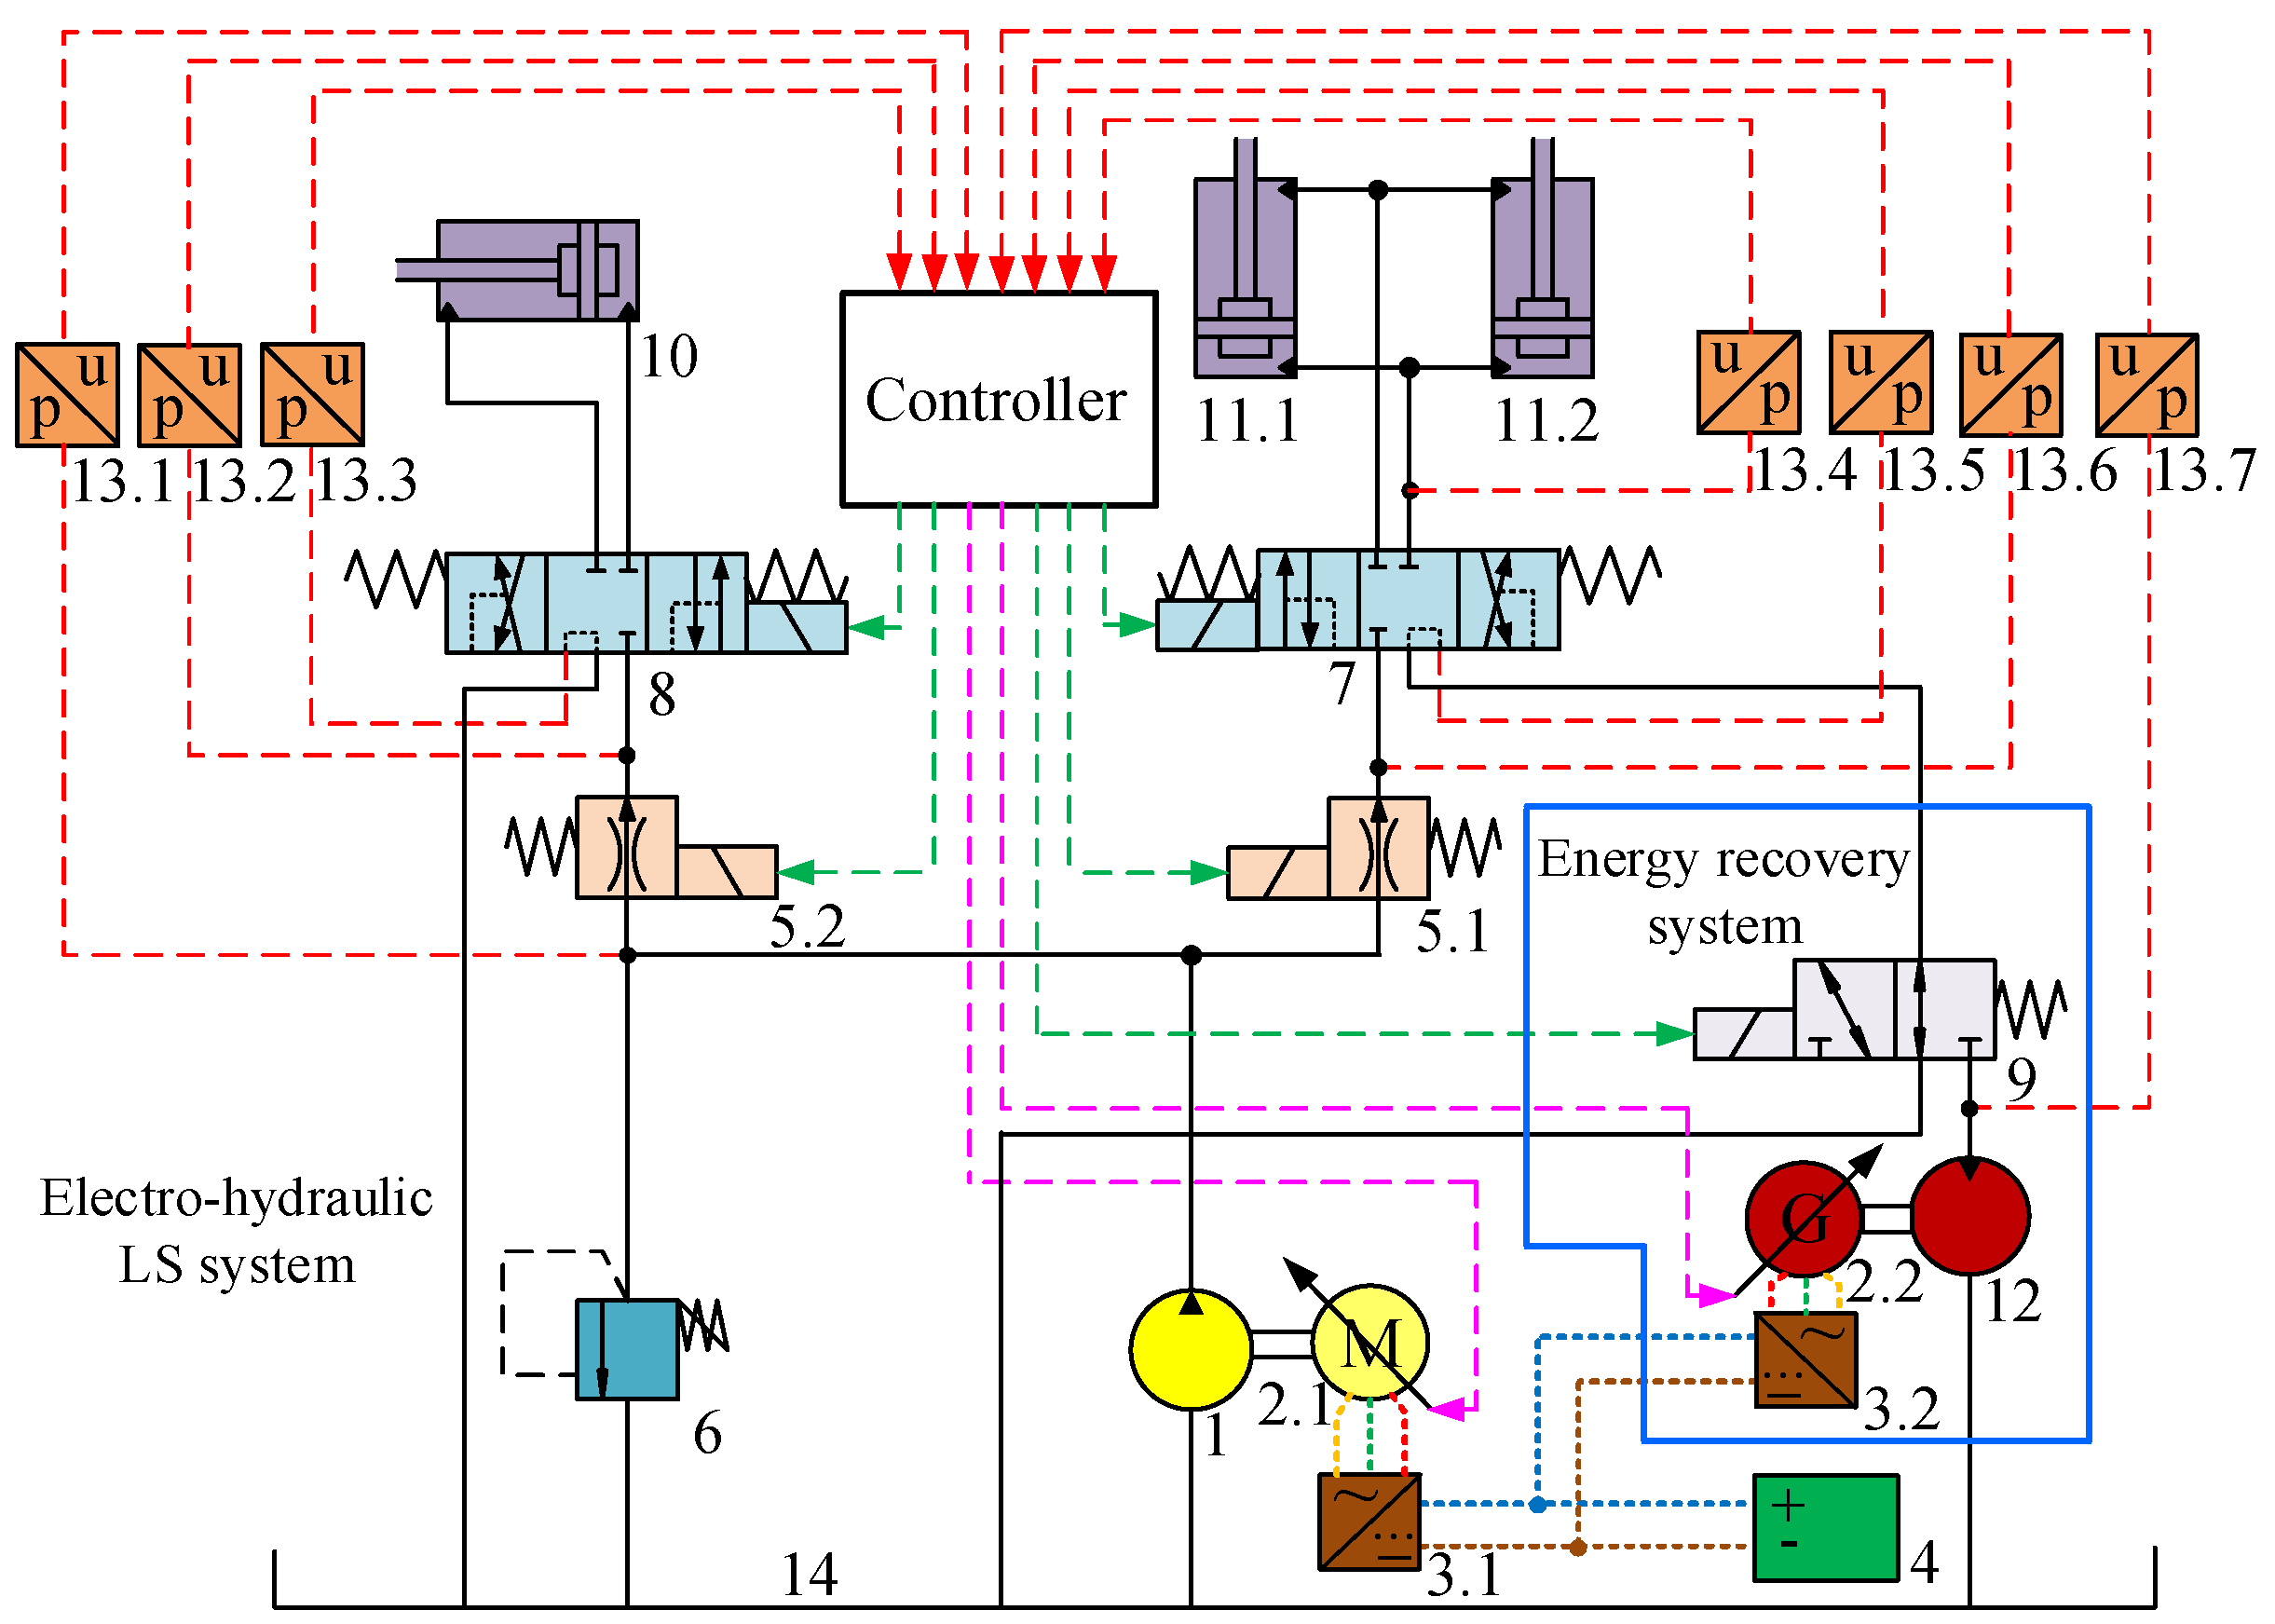
2.2. Working Principle of the New System

As shown in Figure 2, the variable pressure margin energy recovery system for the electric loader actuator is designed based on the above Section 2.1 analysis and simplification of the system. It consists of electro-hydraulic LS and energy recovery systems. The pressure sensors collect the multi-way valve’s before and after pressure, and the quantitative pump’s output pressure, respectively. They are transmitted to electrical signals and input to the controller. According to the preset pressure margin of the LS and the solenoid pressure compensation valve pressure, the controller outputs the control signal of the solenoid pressure compensation valve and the PMSM to maintain the system differential pressure. The control signal of the PMSM is obtained through pressure feedback closed-loop control to make the system meet the load’s pressure and flow requirements when the multi-way valve’s opening is changed. Oil in the piston chamber of the boom cylinders 11.1 and 11.2 drives the hydraulic motor–generator to charge the supercapacitor 4 through the reversing valve 9 when the boom arm drops, and it realizes energy recovery. It can realize variable pressure margin control and energy recovery through pressure feedback closed-loop control, which can effectively reduce system energy consumption.

2.3. Control Strategy of the System

This section analyzes the principle of the variable LS pressure margin control, the variable pressure margin control of the pressure compensation valve, and the energy recovery system.

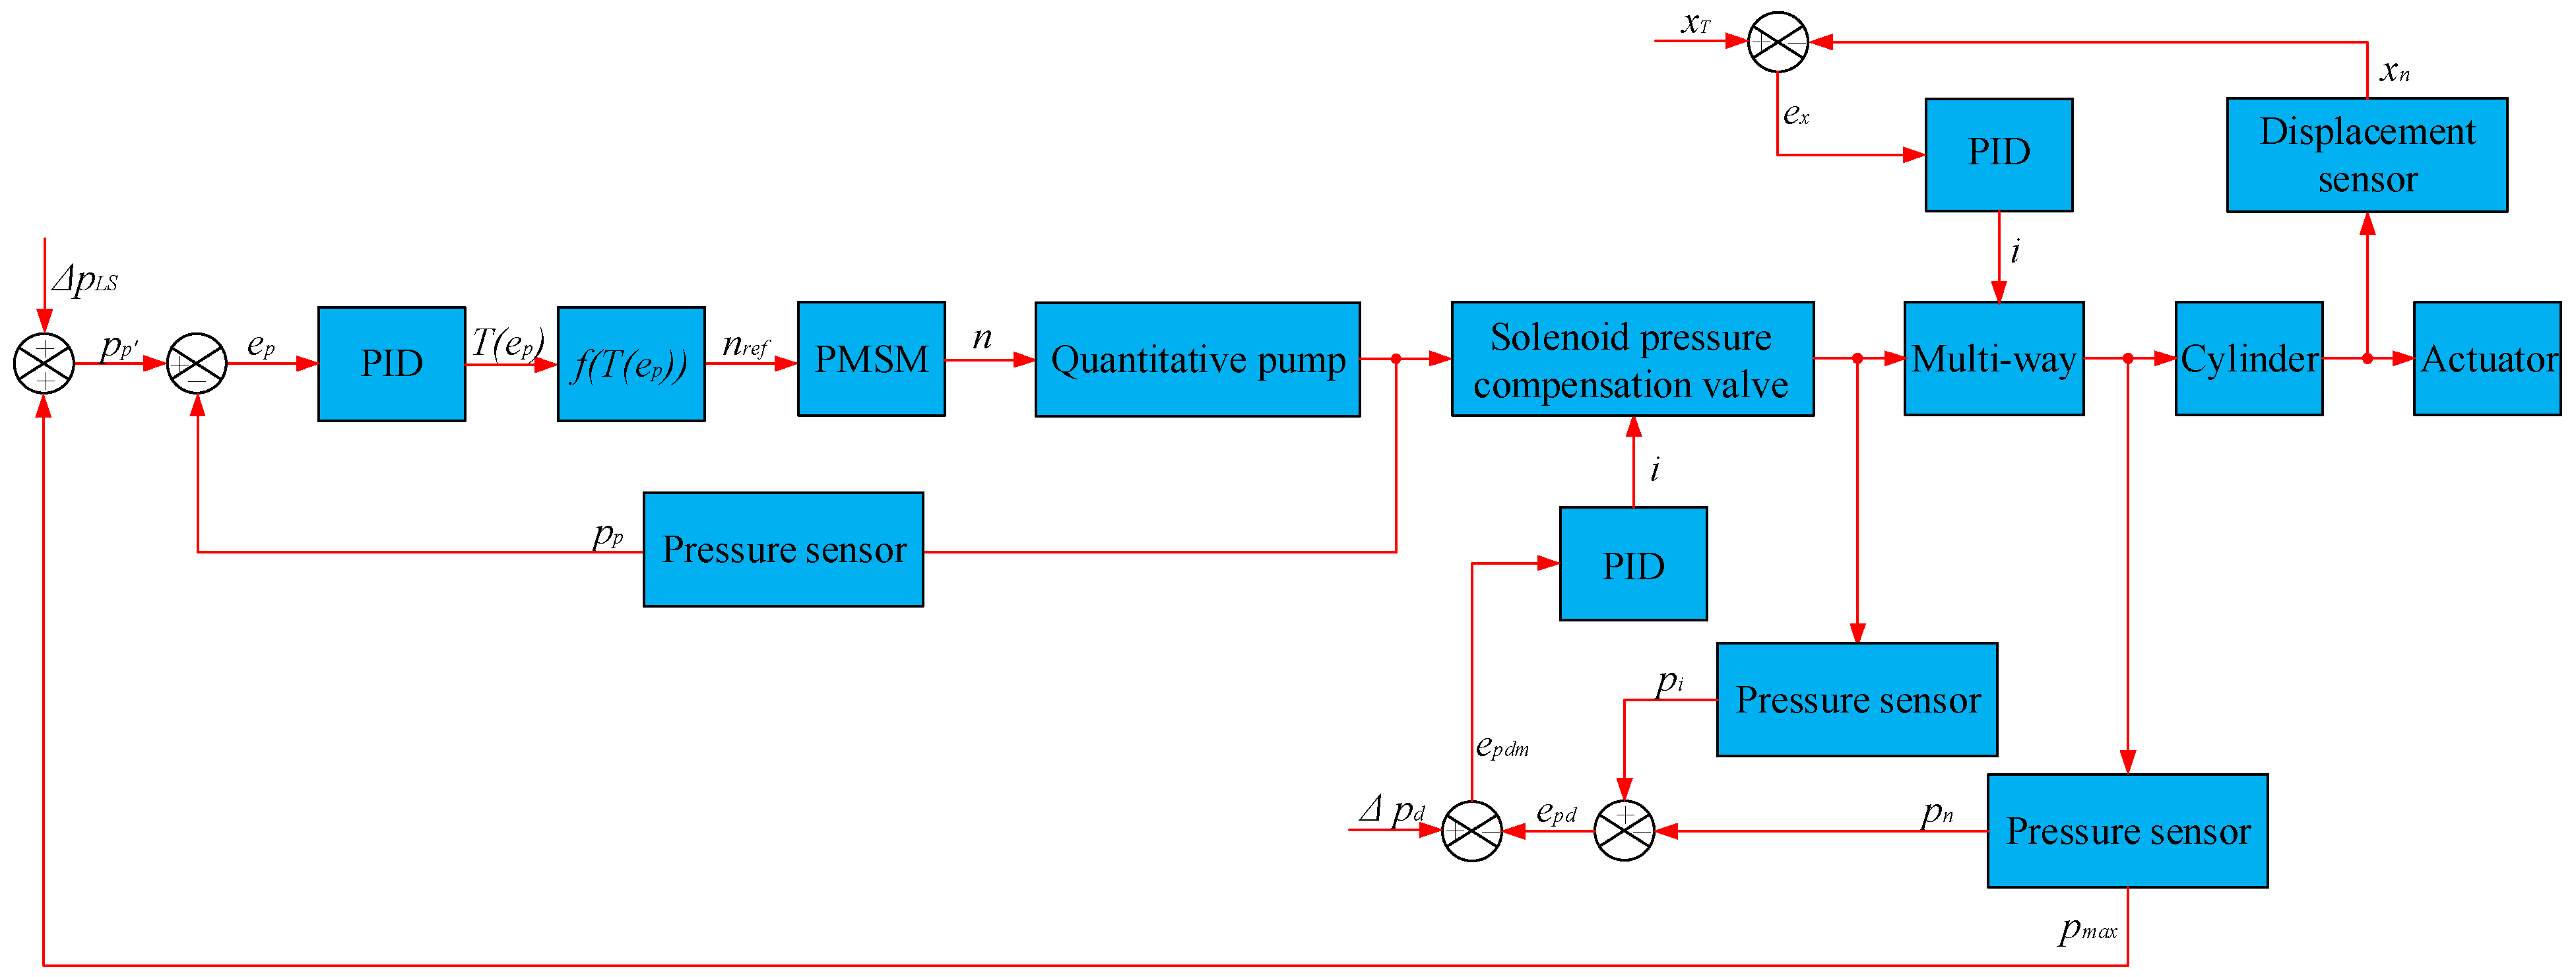
2.3.1. Principle of the Variable LS Pressure Margin Control

As shown in Figure 3, the system’s maximum load pressure is detected in real time through the pressure sensor. Then, the target output pressure of the quantitative pump can be described as:
p p = p M a x + Δ p L s ,
where p p is the target output pressure of the quantitative pump, bar; p M a x is the maximum load pressure, bar; Δ p L s is the LS preset pressure margin, bar.
The output pressure error of the quantitative pump can be described as follows:
e p = p p p p ,
where e p is the output pressure error of the quantitative pump, bar; p p is the actual output pressure of the quantitative pump, bar.
The target torque of the PMSM can be obtained by feedback control through the PID controller using the e p as the control quantity. Then, the target torque of the PMSM can be described as follows:
T ( e p ) = k p e p + k i e p d t + k d e p ˙ ,
where T ( e p ) is the target torque of the PMSM, Nm; k p the proportional value; k i is the integral value; k d is the differential value.
The target speed of the PMSM can be described as follows:
n r e f = f ( e p ) = 9550 P T ( e p ) ,
where n r e f is the target speed of the PMSM, rev/min; P is the PMSM rated power, kW.
It can be seen that the actual speed of the PMSM also changes with it when the n r e f dynamically changes, from Equations (1)–(4), thus the outlet pressure and flow of the quantitative pump is dynamically controlled. The differential pressure between the actual outlet pressure of the quantitative pump and the p M a x is a constant Δ p L s . The system can follow the new Δ p L s by controlling the PMSM speed with feedback from the PID controller when the Δ p L s changes. Thus, it can realize the variable LS pressure margin control.

2.3.2. Principle of the Variable Pressure Margin Control of the Pressure Compensation Valve

The replacement of a solenoid pressure compensation valve with the conventional pressure compensation valve can effectively improve the system response speed and control performance. The variable pressure margin control of the pressure compensation valve can be realized by changing the preset pressure margin of the solenoid pressure compensation valve. The before and after the multi-way valve of the actual differential pressure can be described as follows:
e p d = p n p i ,
where e p d is the before and after the multi-way valve of the actual differential pressure can be described as, bar; p n is the pressure before the multi-way valve, bar; p i is the pressure after the multi-way valve, bar.
The preset differential pressure error of the solenoid pressure compensation valve can be described as follows:
e p d m = Δ p d e p d ,
where e p d m is the preset differential pressure error of the solenoid pressure compensation valve, bar; Δ p d is the preset pressure margin of the solenoid pressure compensation valve, bar.
The control current of the solenoid pressure compensation valve can be obtained by feedback control through the PID controller using the e p d m as the control quantity. Then, the control current of the solenoid pressure compensation valve can be described as follows:
i c = k p e p d m + k i e p d m d t + k d e p d m ˙ ,
where i c is the control current of the solenoid pressure compensation valve, mA.
It can be seen that the solenoid pressure compensation valve spool changes when the i c changes dynamically from Equations (5)–(7), thus dynamically controlling the differential pressure between before and after the multi-way valve. The system can follow the new Δ p d by controlling the spool displacement with the PID controller when the Δ p d changes. The principle of the cylinder position control system is the same as that of the solenoid pressure compensation valve, so it will not be analyzed in detail.
The flow of the multi-way valve [21] can be described as follows:
Q = C d w x 200000 Δ p d ρ ,
where Q is the flow of the multi-way valve, m3/s; C d is the flow coefficient of the multi-way valve; w is the spool area gradient of the multi-way valve; x is the multi-way valve spool displacement, m; ρ is the fluid density, kg/m3.
When taking the maximum load branch as an example, the differential pressure between before and after the solenoid pressure compensation valve [21] can be described as follows:
Δ p C = Δ p L S Δ p d ,
where Δ p C is the differential pressure between before and after the solenoid pressure compensation valve, bar.
It can be seen that the Q reduces when the Δ p d reduces from Equation (8). Therefore, the Δ p d cannot be too small to meet the actuator demand. It can be seen that the system pressure loss reduces when the Δ p L S reduces from Equation (9). In summary, reducing the Δ p L S can effectively reduce the system pressure loss and thus reduce the system energy loss under the actuator demand.

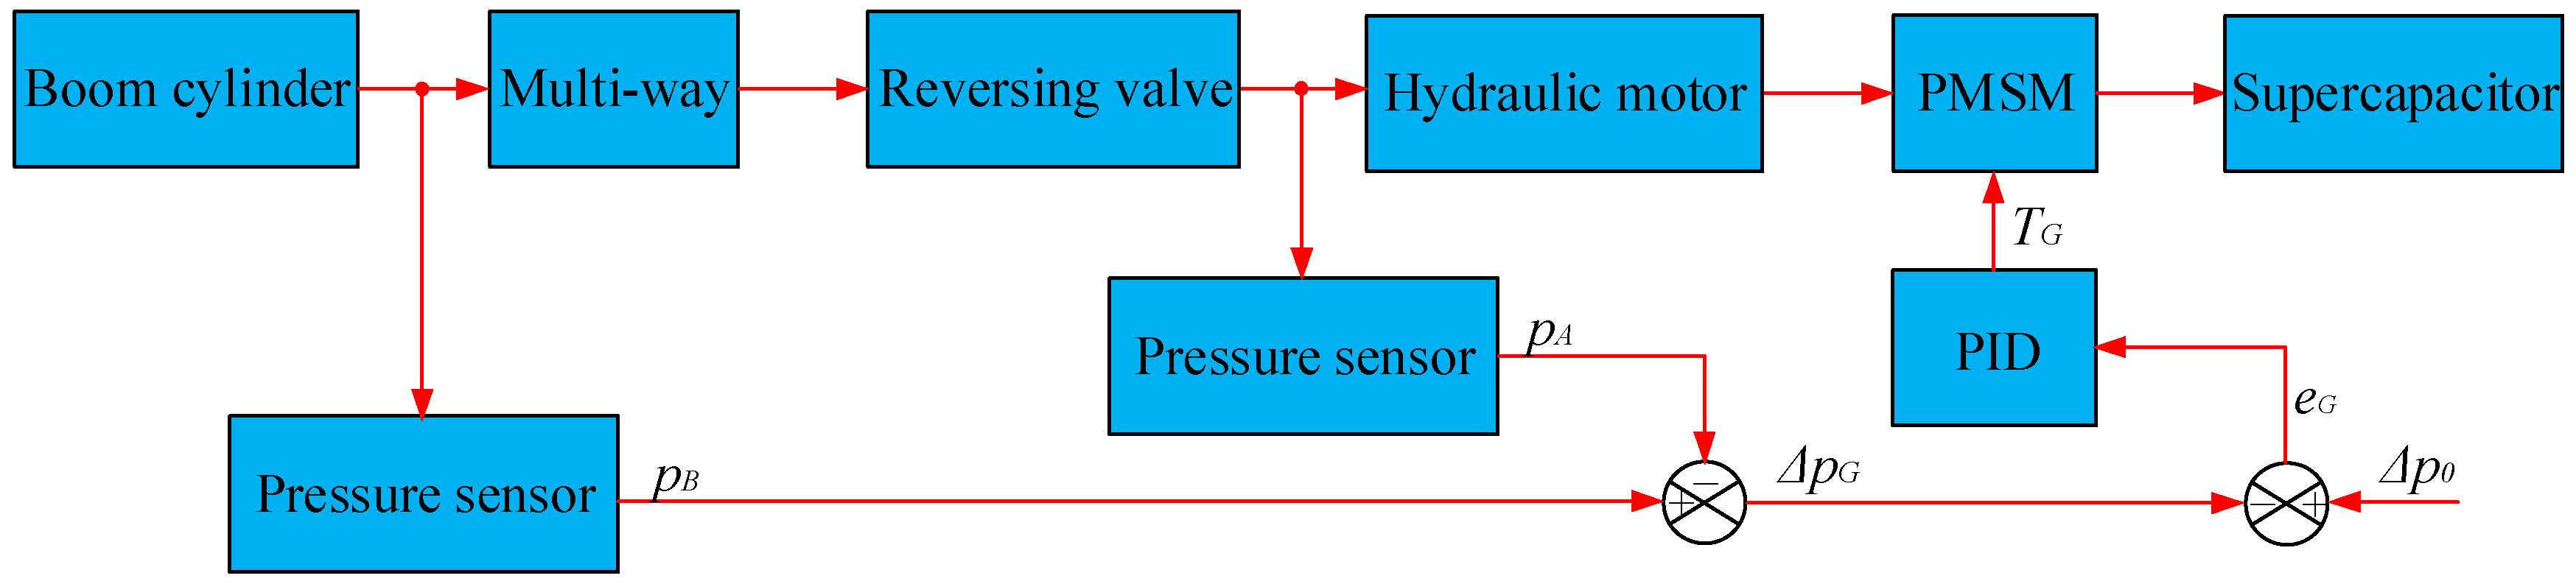
2.3.3. Control Principle of the Energy Recovery System

The PMSM control methods are divided into direct speed control, load pressure control, and differential pressure control [22], according to the structural characteristics of the energy recovery system and the operating mode of the hydraulic motor–generator unit. We choose differential pressure control in this paper, as shown in Figure 4. The actual differential pressure between the piston chamber of the boom cylinder and the reversing valve can be described as follows:
Δ p G = p B p A ,
where Δ p G is the actual differential pressure between the piston chamber of the boom cylinder and the reversing valve, bar; p B is the pressure of the piston chamber of the boom cylinder, bar; p A is the pressure after the reversing valve, bar.
The target differential pressure error of the PMSM can be described as follows:
e G = Δ p 0 Δ p G ,
where e G is the target differential pressure error of the PMSM, bar; Δ p 0 is the target differential pressure, bar.
The target torque of the PMSM [22] can be described as follows:
T G = D m 2 π ( k p e G + k i e G d t + k d e G ˙ ) ,
where T G is the target torque of the PMSM, Nm; D m is the hydraulic motor displacement, m3/rev.
It can be seen that the T G changes accordingly to maintain the Δ p G at a constant value of the Δ p 0 when the Δ p G changes dynamically from Equations (10)–(12). Therefore, the energy recovery system can recover energy at different velocities and loads of the actuator.

3. Analysis of the System Mathematical Model

This section analyzes the mathematical model of the actuator, the mathematical model of the supercapacitor, and the analysis and validation of the PMSM mathematical model.

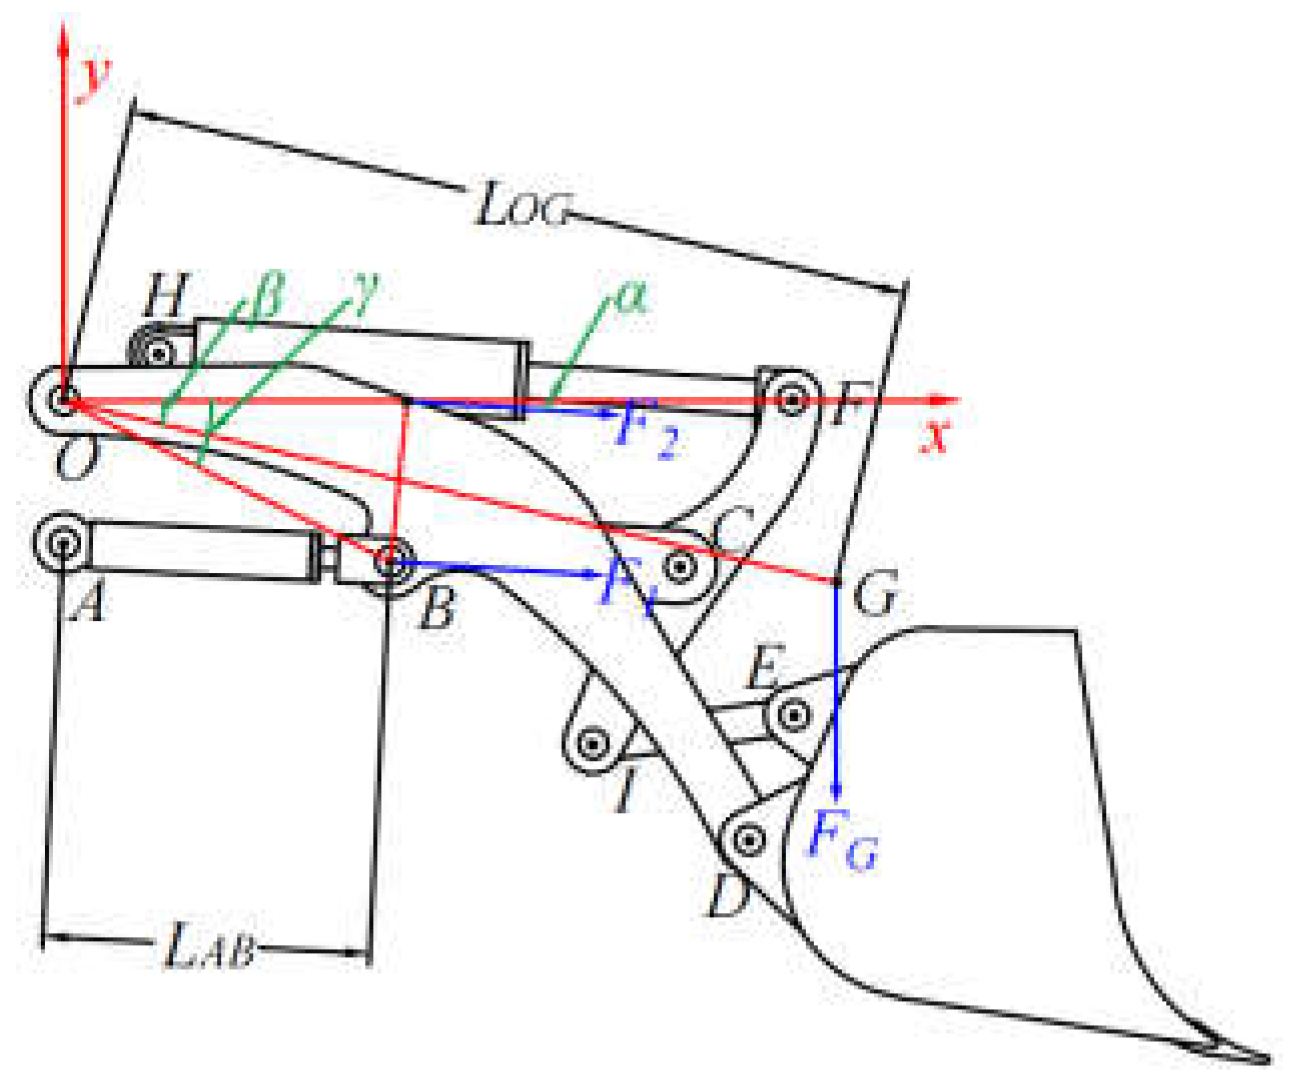
3.1. Analysis of the Mathematical Model of the Actuator

As shown in Figure 5, according to the principle of the loader actuator, the XY coordinates are established with the center of rotation of the loader boom arm as the coordinate origin O. The hinge point of the boom cylinder with the frame is A, and the boom arm is B. The hinge point of the boom arm with the rocker’s arm is C, and the bucket is D. The center of the gravity point of the actuator is G. The hinge point of the bucket cylinder with the frame is H, and the rocker’s arm is F. The hinge point of the pull rod with the rocker’s arm is H, and the bucket is E. In the clockwise direction, the kinetic equation of the actuator [23] can be described as follows:
J 1 d 2 γ d t 2 = F 1 sin α L A B cos α F G L 0 G cos β T 1 ,
where J 1 is the rotational inertia of the boom arm with respect to O, kg·m2; γ is the angle of OB with respect to the x-axis, °; F 1 is the combined force on the boom cylinder, N; α is the angle between F 1 and the x-axis, °; L A B is the distance between points A and B, m; F G is the gravitational force, N; L 0 G is the distance between point O and point G, m; β is the angle of OG with the x-axis, °; T 1 is the moment of resistance to the rotation of the boom arm, Nm.
The dynamic equation of the boom cylinder [23] can be described as follows:
F 1 = 100000 ( p 1 A 1 p 2 A 2 ) b d L A B d t F f F L = m d L A B d t ,
where p 1 is the piston chamber pressure of the boom cylinder, bar; A 1 is the area of the piston chamber of the boom cylinder, m2; p 2 is the pressure in the rod chamber of the boom cylinder, bar; A 2 is the area of the rod chamber of the boom cylinder, m2; b is the damping factor of the oil boom cylinder; F f is the frictional resistance of the oil-operated arm cylinder, N. F L is the load resistance of the boom cylinder, N; m is the total mass of the actuator, kg.
A large amount of gravitational potential energy of the actuator is converted into pressure energy through the piston chamber of the boom cylinders due to gravity when the boom arm drops. Therefore, the energy flowing out of the boom cylinders is the recoverable energy of the boom cylinders. It [24] can be described as follows:
E 1 = 100 v 1 A 1 p 1 d t ,
where E 1 is the recoverable energy of the boom cylinders, kJ; v 1 is the velocity of the boom cylinders, m/s.
It can be seen that the p 1 is larger when the F 1 is more significant from Equation (14). It can be seen that the E 1 is larger when the p 1 is more significant from Equation (15). In summary, the recoverable energy of the boom cylinders depends on the F 1 and the v 1 .

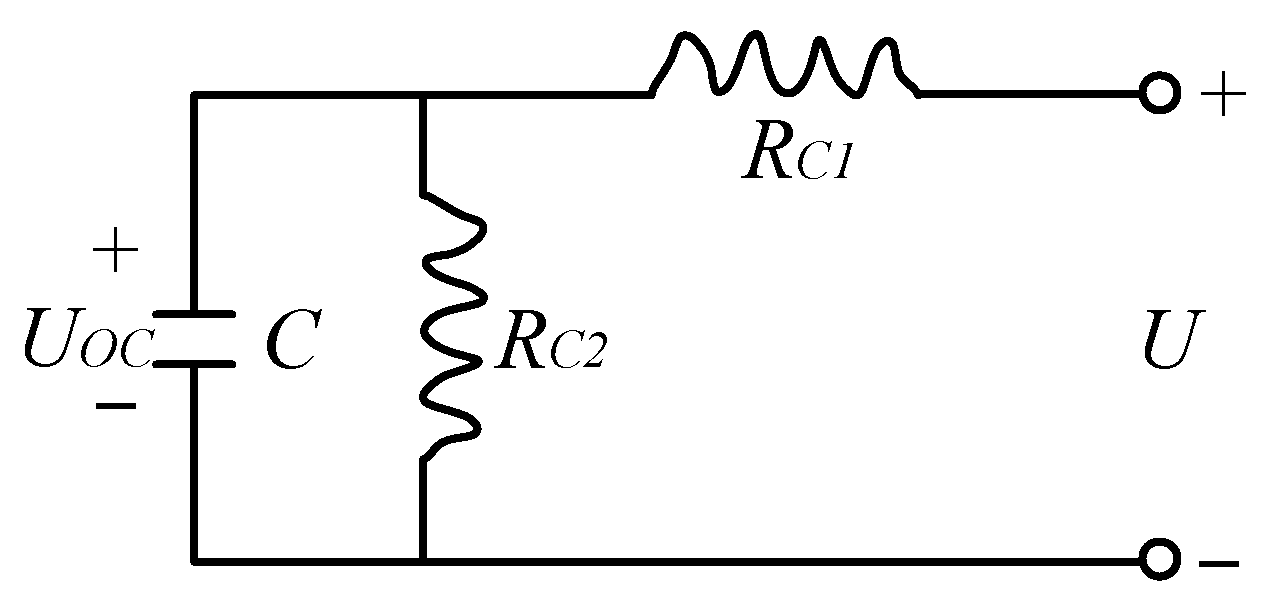
3.2. Analysis of the Mathematical Model of the Supercapacitor

The supercapacitor charging and discharging performance can be described by the voltage change or charge across the positive and negative terminals. As shown in Figure 6, the open-circuit voltage [25] can be described as follows:
U = U O C R C 1 I C = U O C R C 1 C d U O C d t ,
where U is the open-circuit voltage, V; U O C is the ideal capacitor voltage, V; R C 1 is the equivalent resistance, Ω; I C is the series circuit current, A; C is the equivalent capacitance, F.
The stored energy of the supercapacitor [25] can be described as follows:
{ E = 1 2 C ( U m a x 2 U m i n 2 ) E C ( t ) = E C ( t 1 ) T ε C ( t 1 ) + T η C P C ( t ) ,
where E is the maximum stored energy of the supercapacitor, J; U m a x is the maximum open-circuit voltage of the supercapacitor, V; U m i n is the minimum open-circuit voltage of the supercapacitor, V; E C ( t ) is the actual stored energy of the supercapacitor, J; T is the time interval, s; ε C is the self-discharge efficiency; η C is the charge and discharge efficiency; P C ( t ) is the charge and discharge power, W.
The charge state of the supercapacitor [25] can be described as follows:
S O C = U O C R C 1 C d U O C d t U m i n U m a x U m i n ,
where SOC is the charge state of the supercapacitor.
It can be seen that keeping the U m a x and the U m i n constant, the E is larger when the C is more significant from Equation (17), i.e., more energy is stored in the supercapacitor. It can be seen that the S O C is smaller when the R C 1 is larger from Equation (18). In summary, the E is related to the C . The S O C is related to the R C 1 .

3.3. Analysis and Validation of the PMSM Mathematical Model

This section analyzes the PMSM mathematical model and validation of the PMSM simulation model.

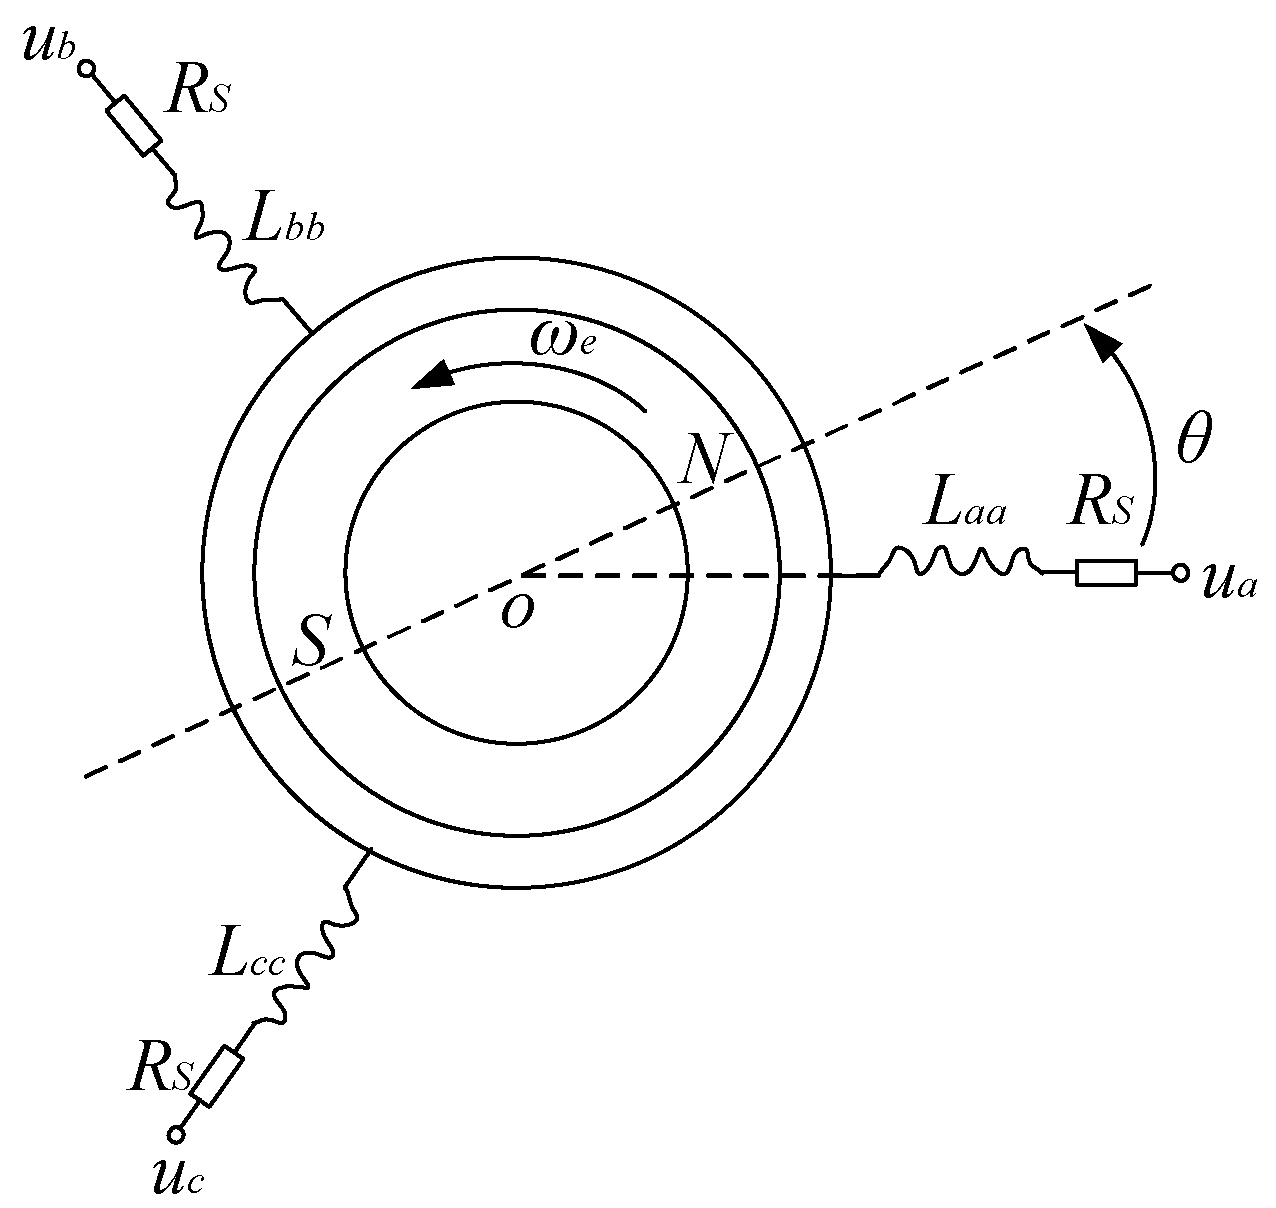
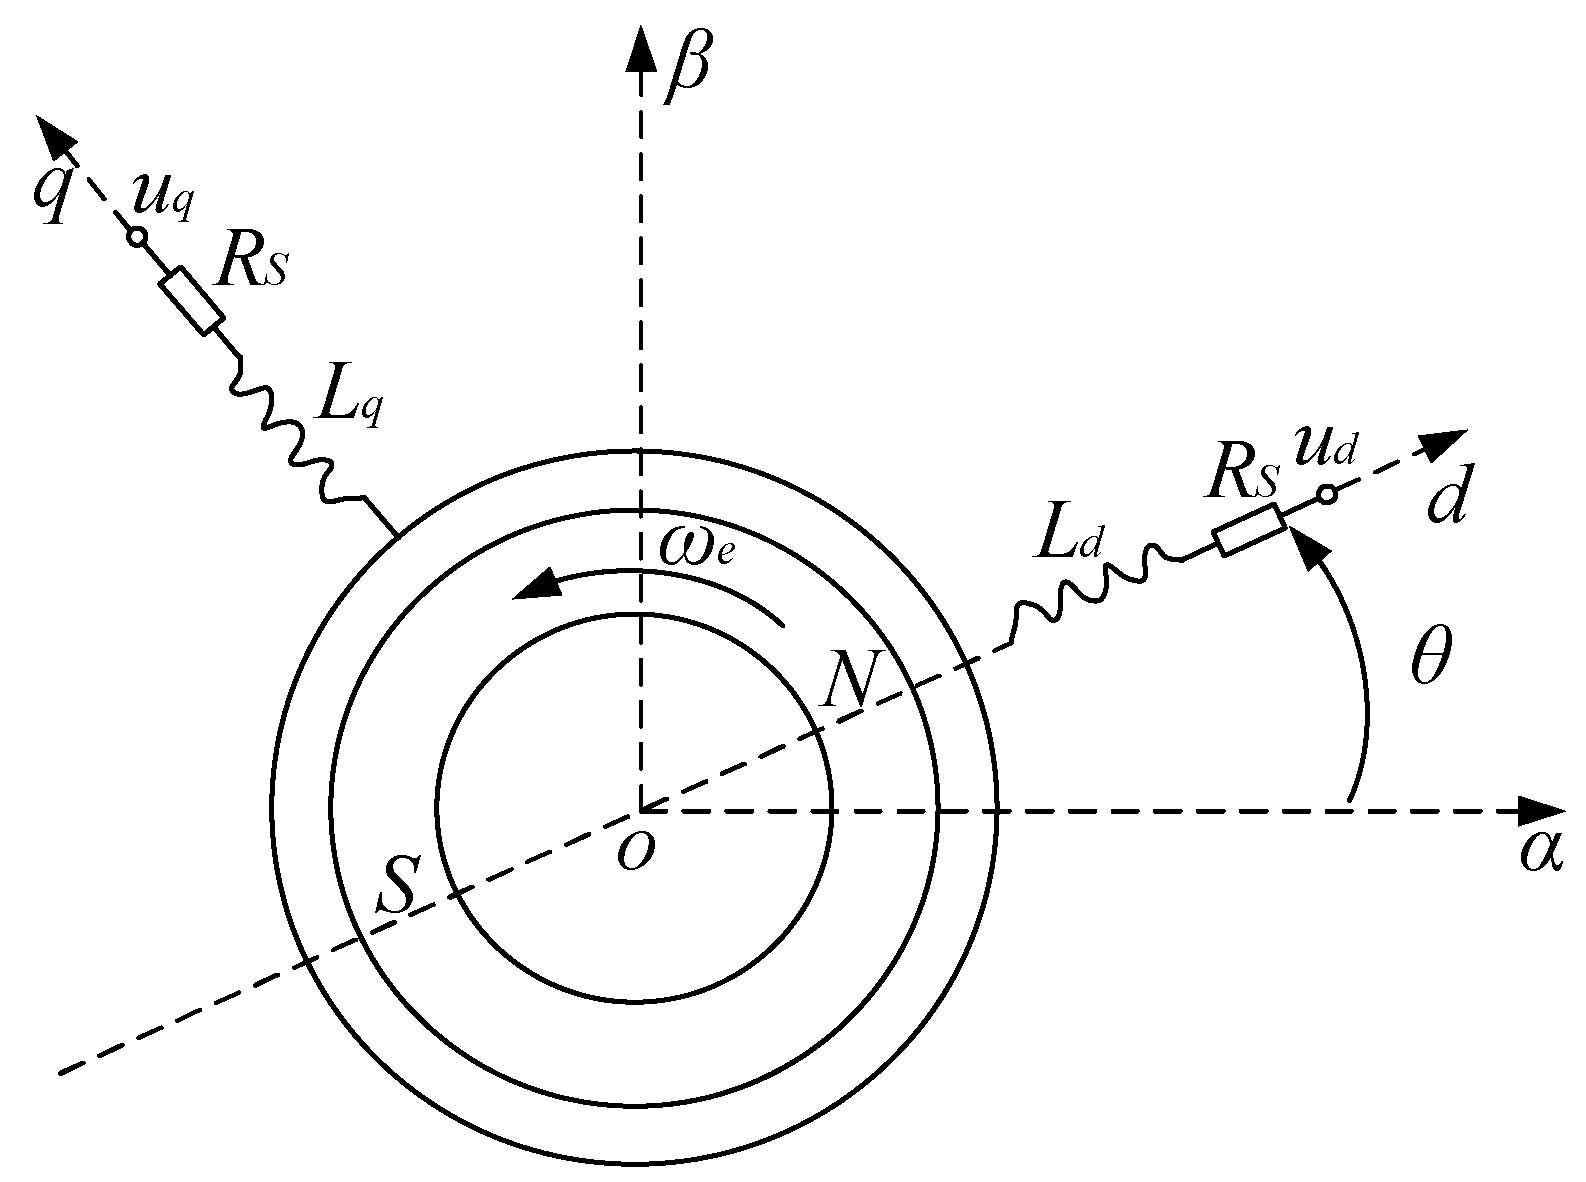
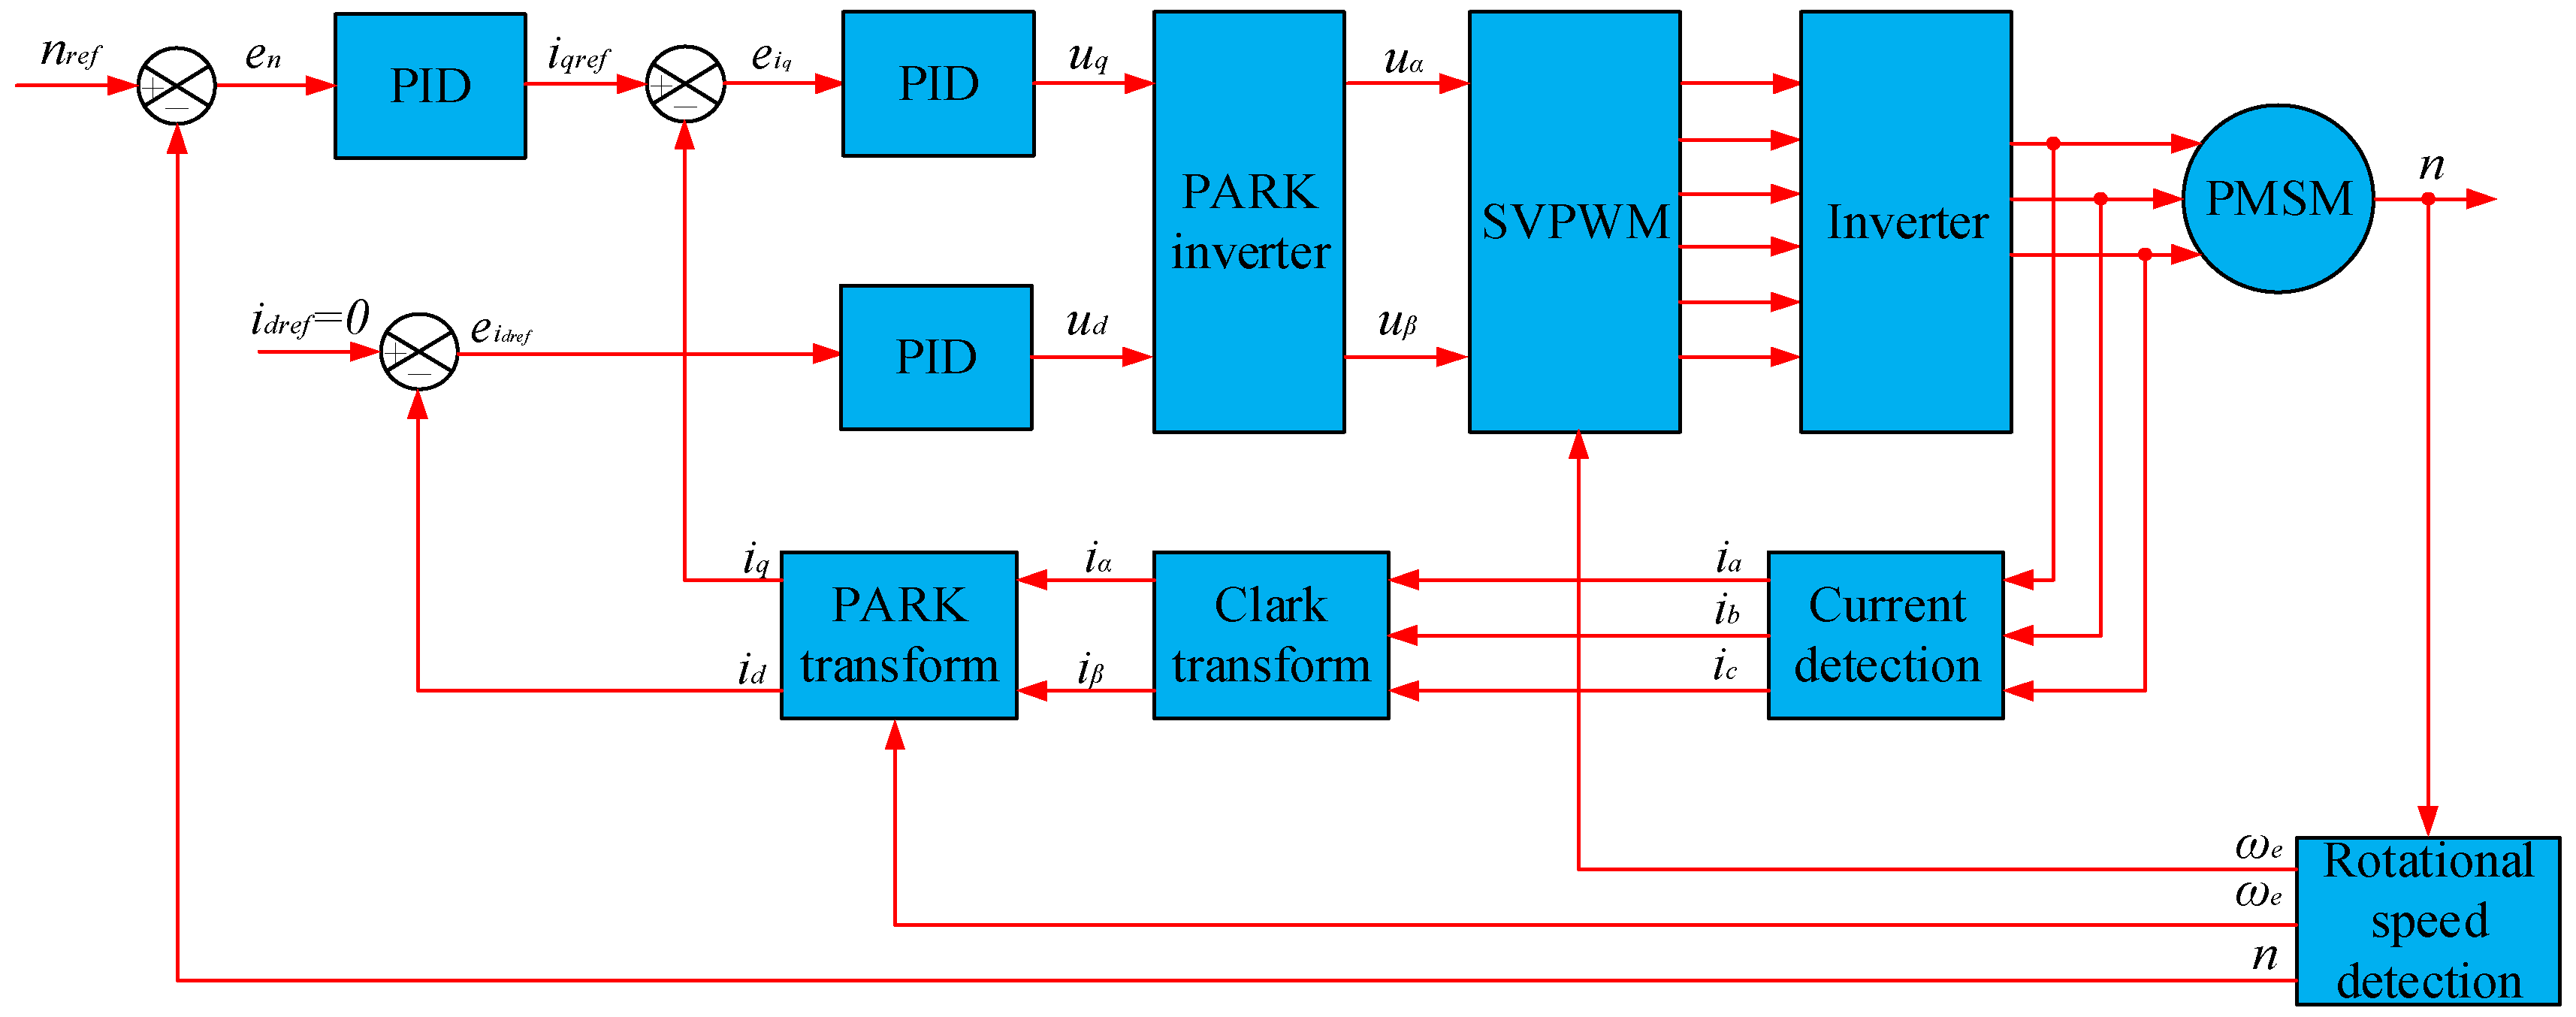
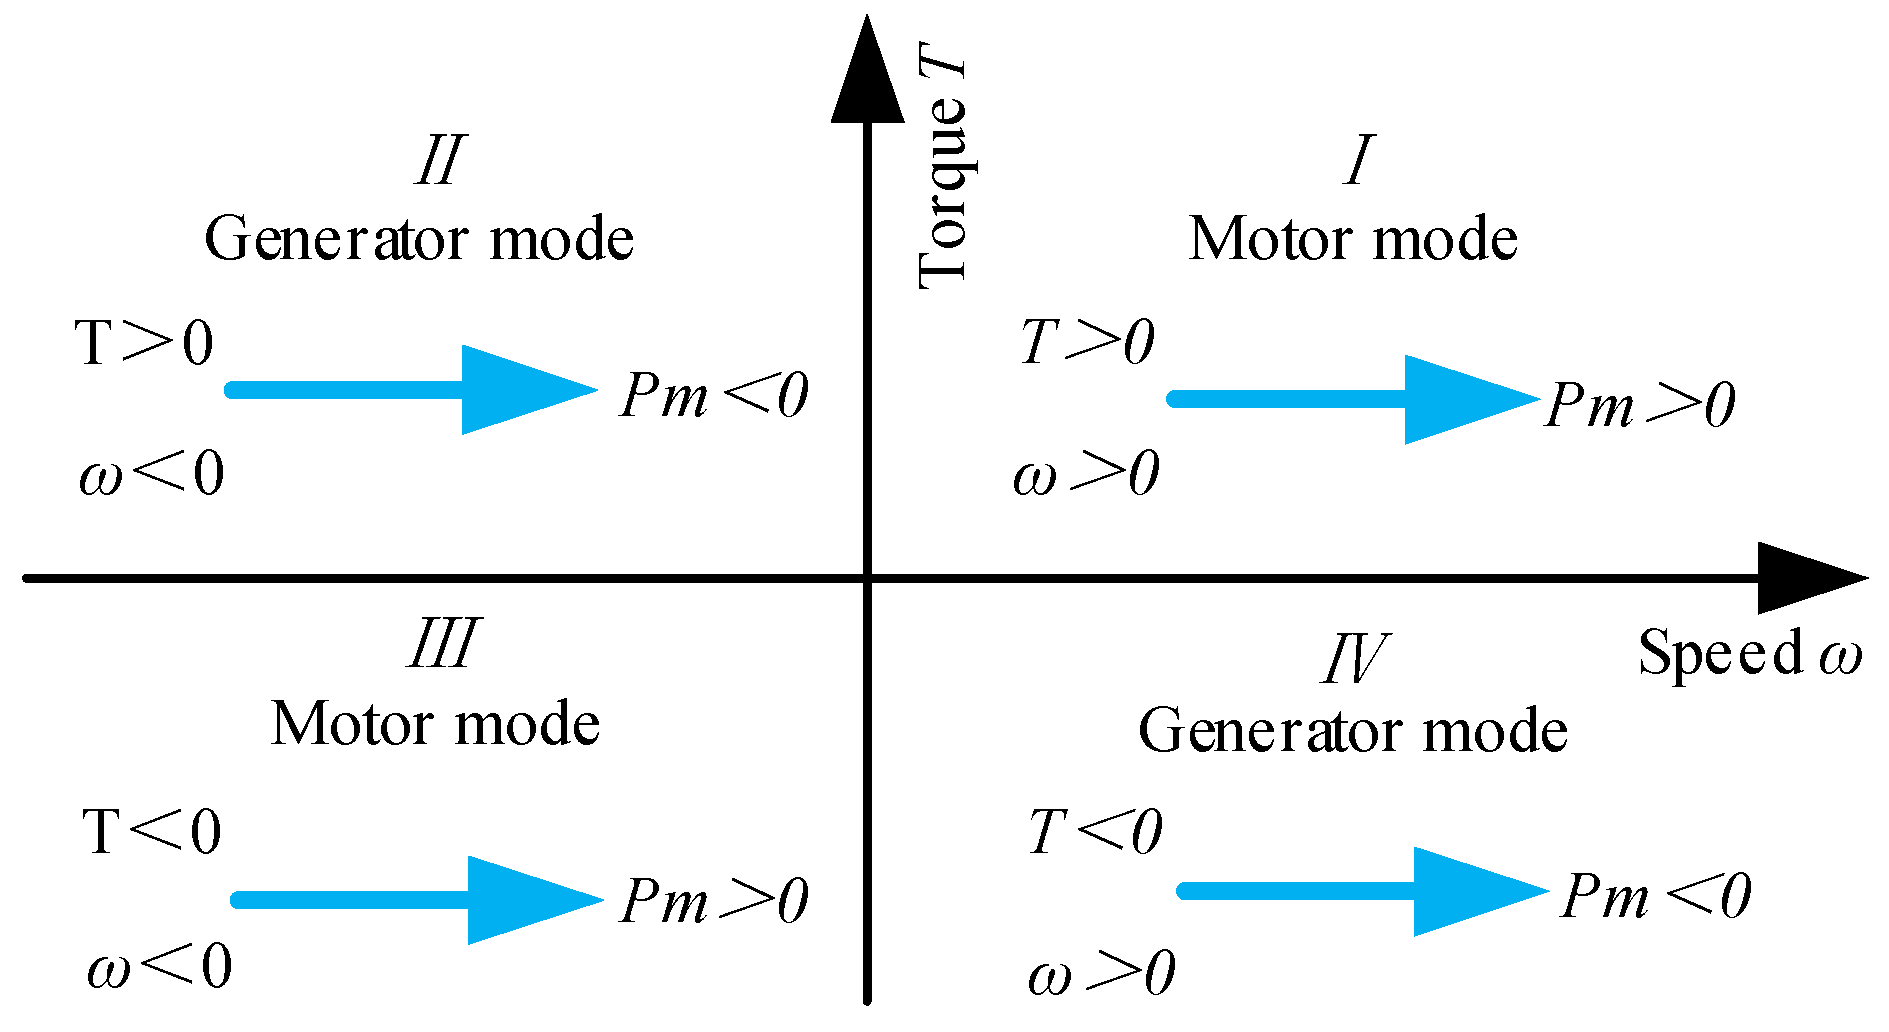
3.3.1. Analysis of the PMSM Mathematical Model

The PMSM is a typical nonlinear system with many internal variables and strong coupling from its structure and principle. The mathematical model is simplified to facilitate the analysis and ensure the result accuracy, and then the equivalent schematic diagram is shown in Figure 7. The electrical mathematical model of the PMSM is established, mainly the equation of the stator voltage, the magnetic chain, the electromagnetic torque vector, and the motion. The stator voltage equation of the PMSM in the ABC coordinate system [26] can be described as follows:
[ u a u b u c ] = [ R s 0 0 0 R s 0 0 0 R s ] [ i a i b i c ] + [ ψ a ψ b ψ c ] ,
where u a , u b , u c are the ABC three-phase stator winding voltages, V; R s is the stator winding resistance, Ω; i a , i b , i c are the ABC three-phase stator winding currents, A; ψ a , ψ b , ψ c is the sum of the magnetic chains generated in the ABC three-phase stator winding, Wb.
The magnetic chain equation of the PMSM in the ABC coordinate system [26] can be described as follows:
[ ψ a ψ b ψ c ] = [ L a a M a b M a c M b a L b b M b c M c a M c b L c c ] [ i a i b i c ] + ψ f [ c o s θ c o s ( θ 2 π 3 ) c o s ( θ + 2 π 3 ) ] ,
where M a b , M a c , M b a , M b c , M c a , M c b are the mutual inductances between the windings, H; L a a , L b b , L c c are the respective winding self-inductances, H; ψ f is the rotor permanent magnet chain, Wb; θ is the rotor pole position, rad, and M a b = M a c = M b a = M b c = M c a = M c b = M a c .
The electromagnetic torque vector equation of the PMSM in the ABC coordinate system can be described as follows:
T e = N n ψ f × i c ,
where T e is the output torque of the PMSM, Nm; N n is the number of the PMSM pole pairs.
The mathematical model in the ABC coordinate system can be transformed into the DQ rotating coordinate system to facilitate the analysis of the PMSM steady-state dynamic performance. The ABC coordinate system is first transformed into alpha and beta coordinate systems. Then, it is transformed into the DQ coordinate system, i.e., by Clark and Park coordinate transformation. As shown in Figure 8, the mathematical model in the ABC coordinate system is obtained by transforming its mathematical model in the DQ coordinate system. The stator voltage equation of the PMSM in the DQ coordinate system [26] can be described as follows:
[ u d u q ] = [ R s ω e L q ω e L d R s ] [ i d i q ] + d d t [ ψ d ψ q ] + [ 0 ω e ψ f ] ,
where u d , u q are DQ-axis voltages, V; ω e is the rotor angular velocity, rad/s; i d , i q are dp-axis currents, A; ψ d , ψ q are the DQ-axis magnetic chain, Wb.
The magnetic chain equation of the PMSM in the DQ coordinate system [26] can be described as follows:
[ ψ d ψ q ] = [ L d 0 0 L d ] [ i d i q ] + [ ψ f 0 ] .
The electromagnetic torque vector equation of the PMSM in the DQ coordinate system can be described as follows:
T e = 3 2 p n [ ψ f i q + ( L d L q ) i d i q ] ,
where T e is the output torque of the PMSM, Nm.
Equation (24) consists of two terms. The first term ψ f i q is the excitation torque, the electromagnetic torque formed by the interaction of the permanent magnet excitation field with the stator current. The second term ( L d L q ) i d i q is the magnetoresistive torque formed by the rotor convex pole effect. The magnetoresistive torque is inherent to the convex polar PMSM. Moreover, for the hidden polar PMSM, no magnetoresistive torque is formed due to L d = L q , from which the output torque of the PMSM can be described as follows:
T e = 3 2 p n ψ f i q .
The motion equation of the PMSM can be described as follows:
T e = T L + J d ω d t + B ω ,
where T L is the load torque, Nm; J is the equivalent rotational inertia converted to the motor shaft, kg·m2; B is the coefficient of viscous friction; ω is the mechanical angular velocity of the PMSM output shaft, rad/s.
In this paper, the usual control method i d r e f = 0 control in SVPWM control is used, i.e., the speed control of the PMSM by the SVPWM vector control technique. The control principle of the PMSM can be obtained based on the above analysis, as shown in Figure 9.

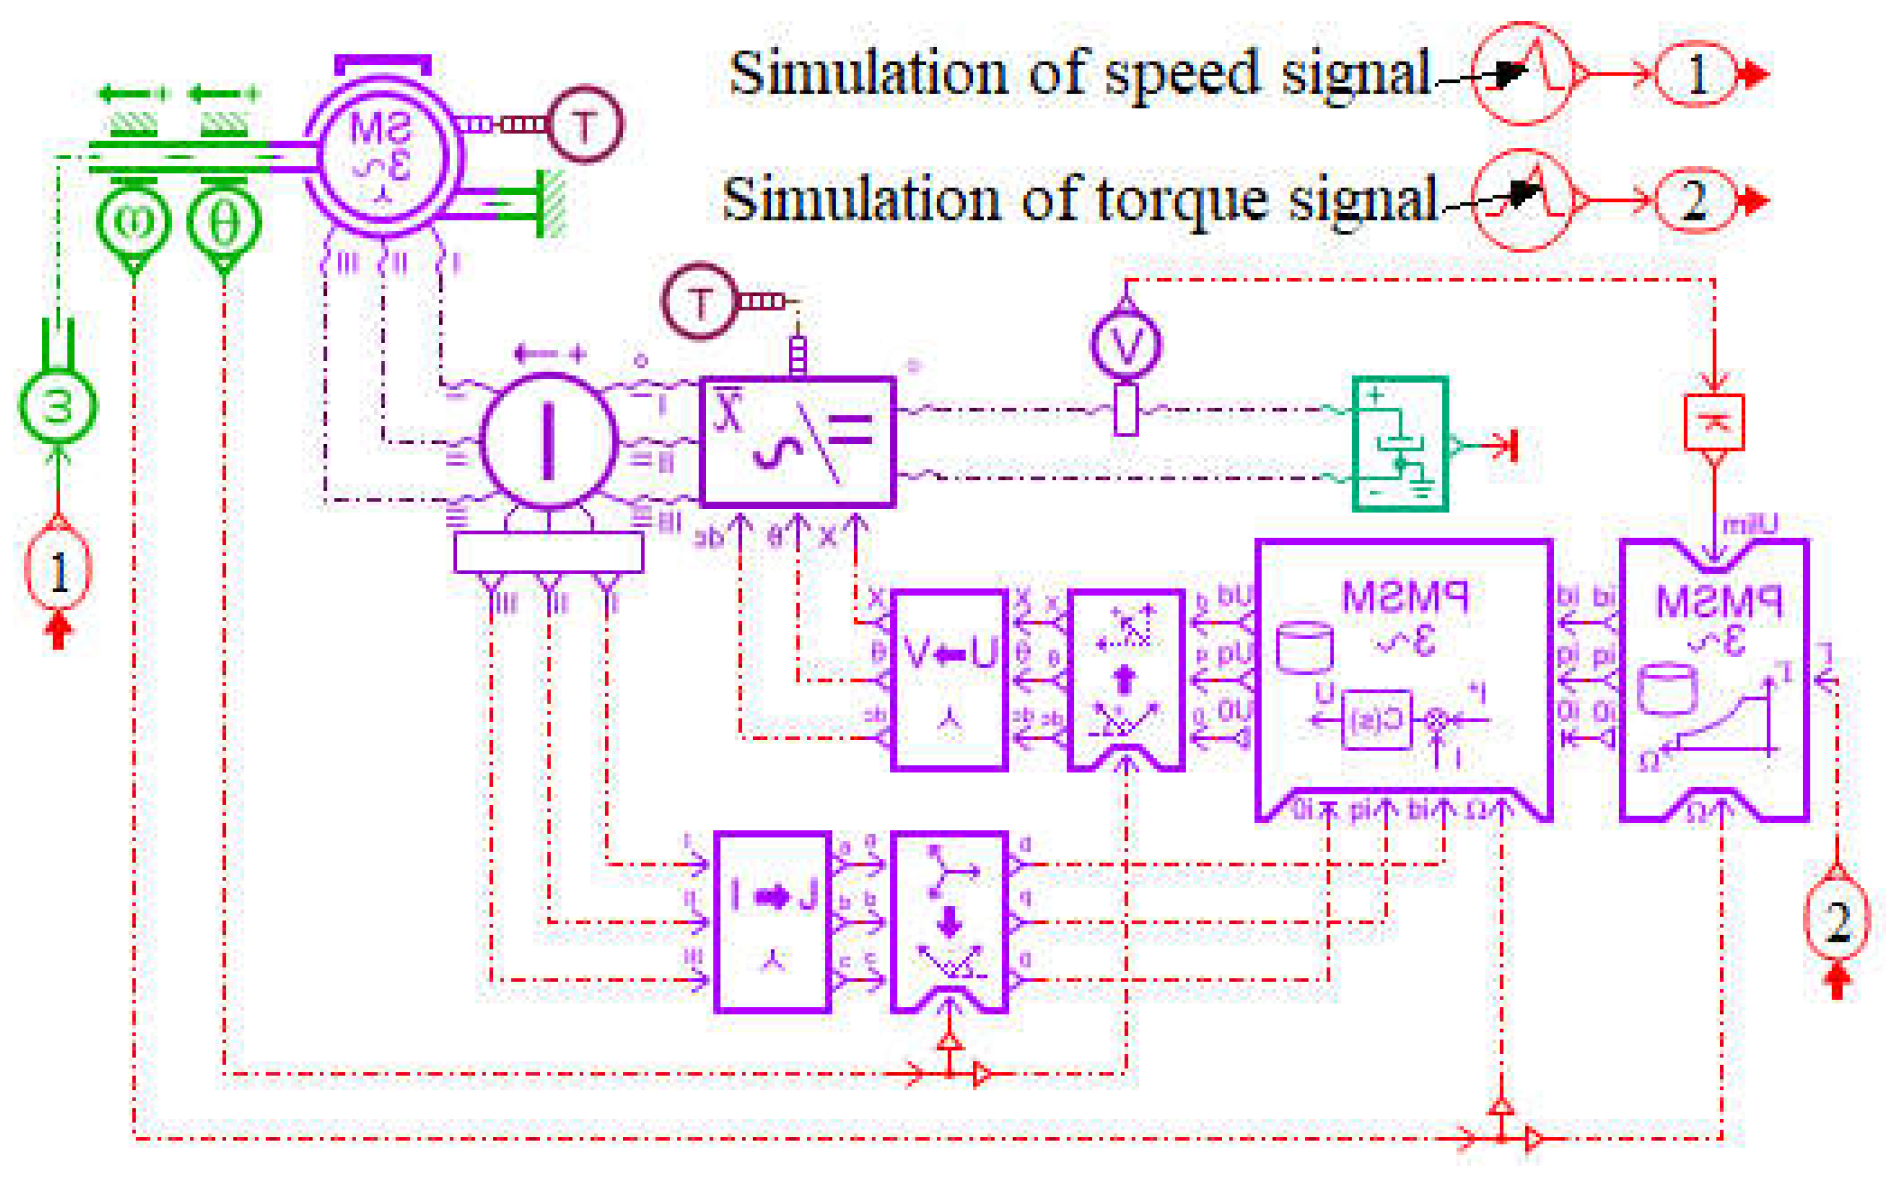
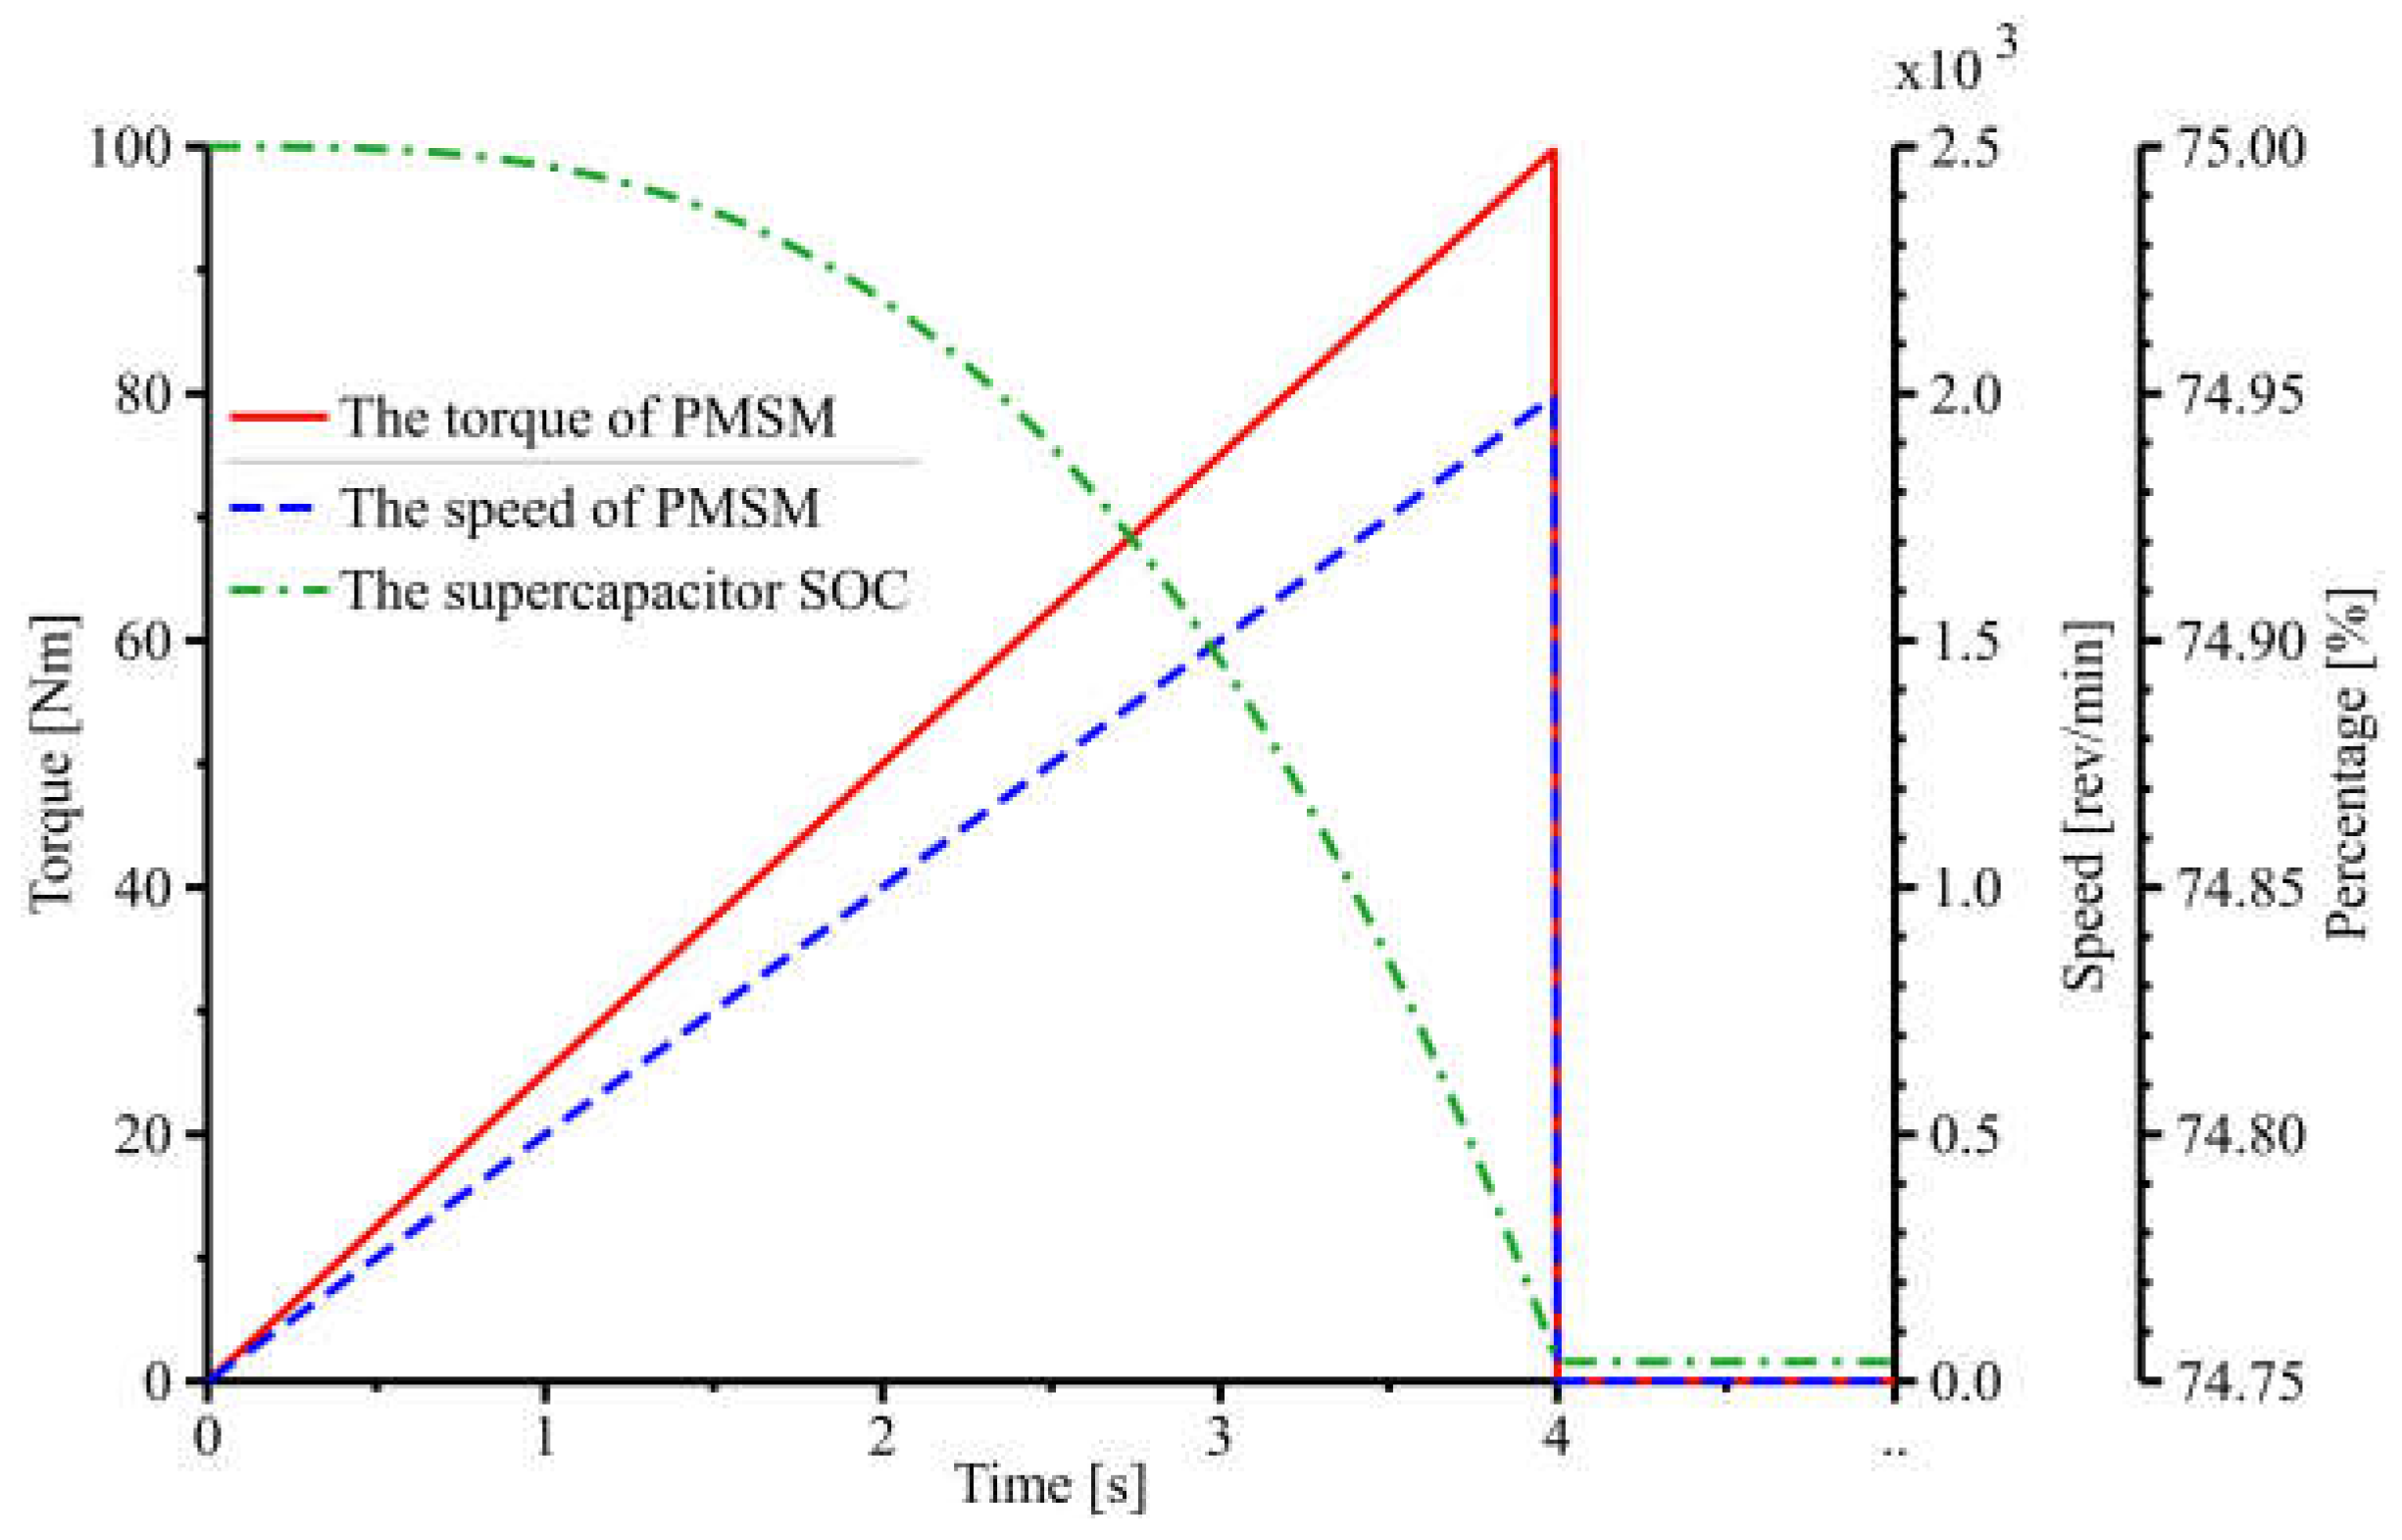
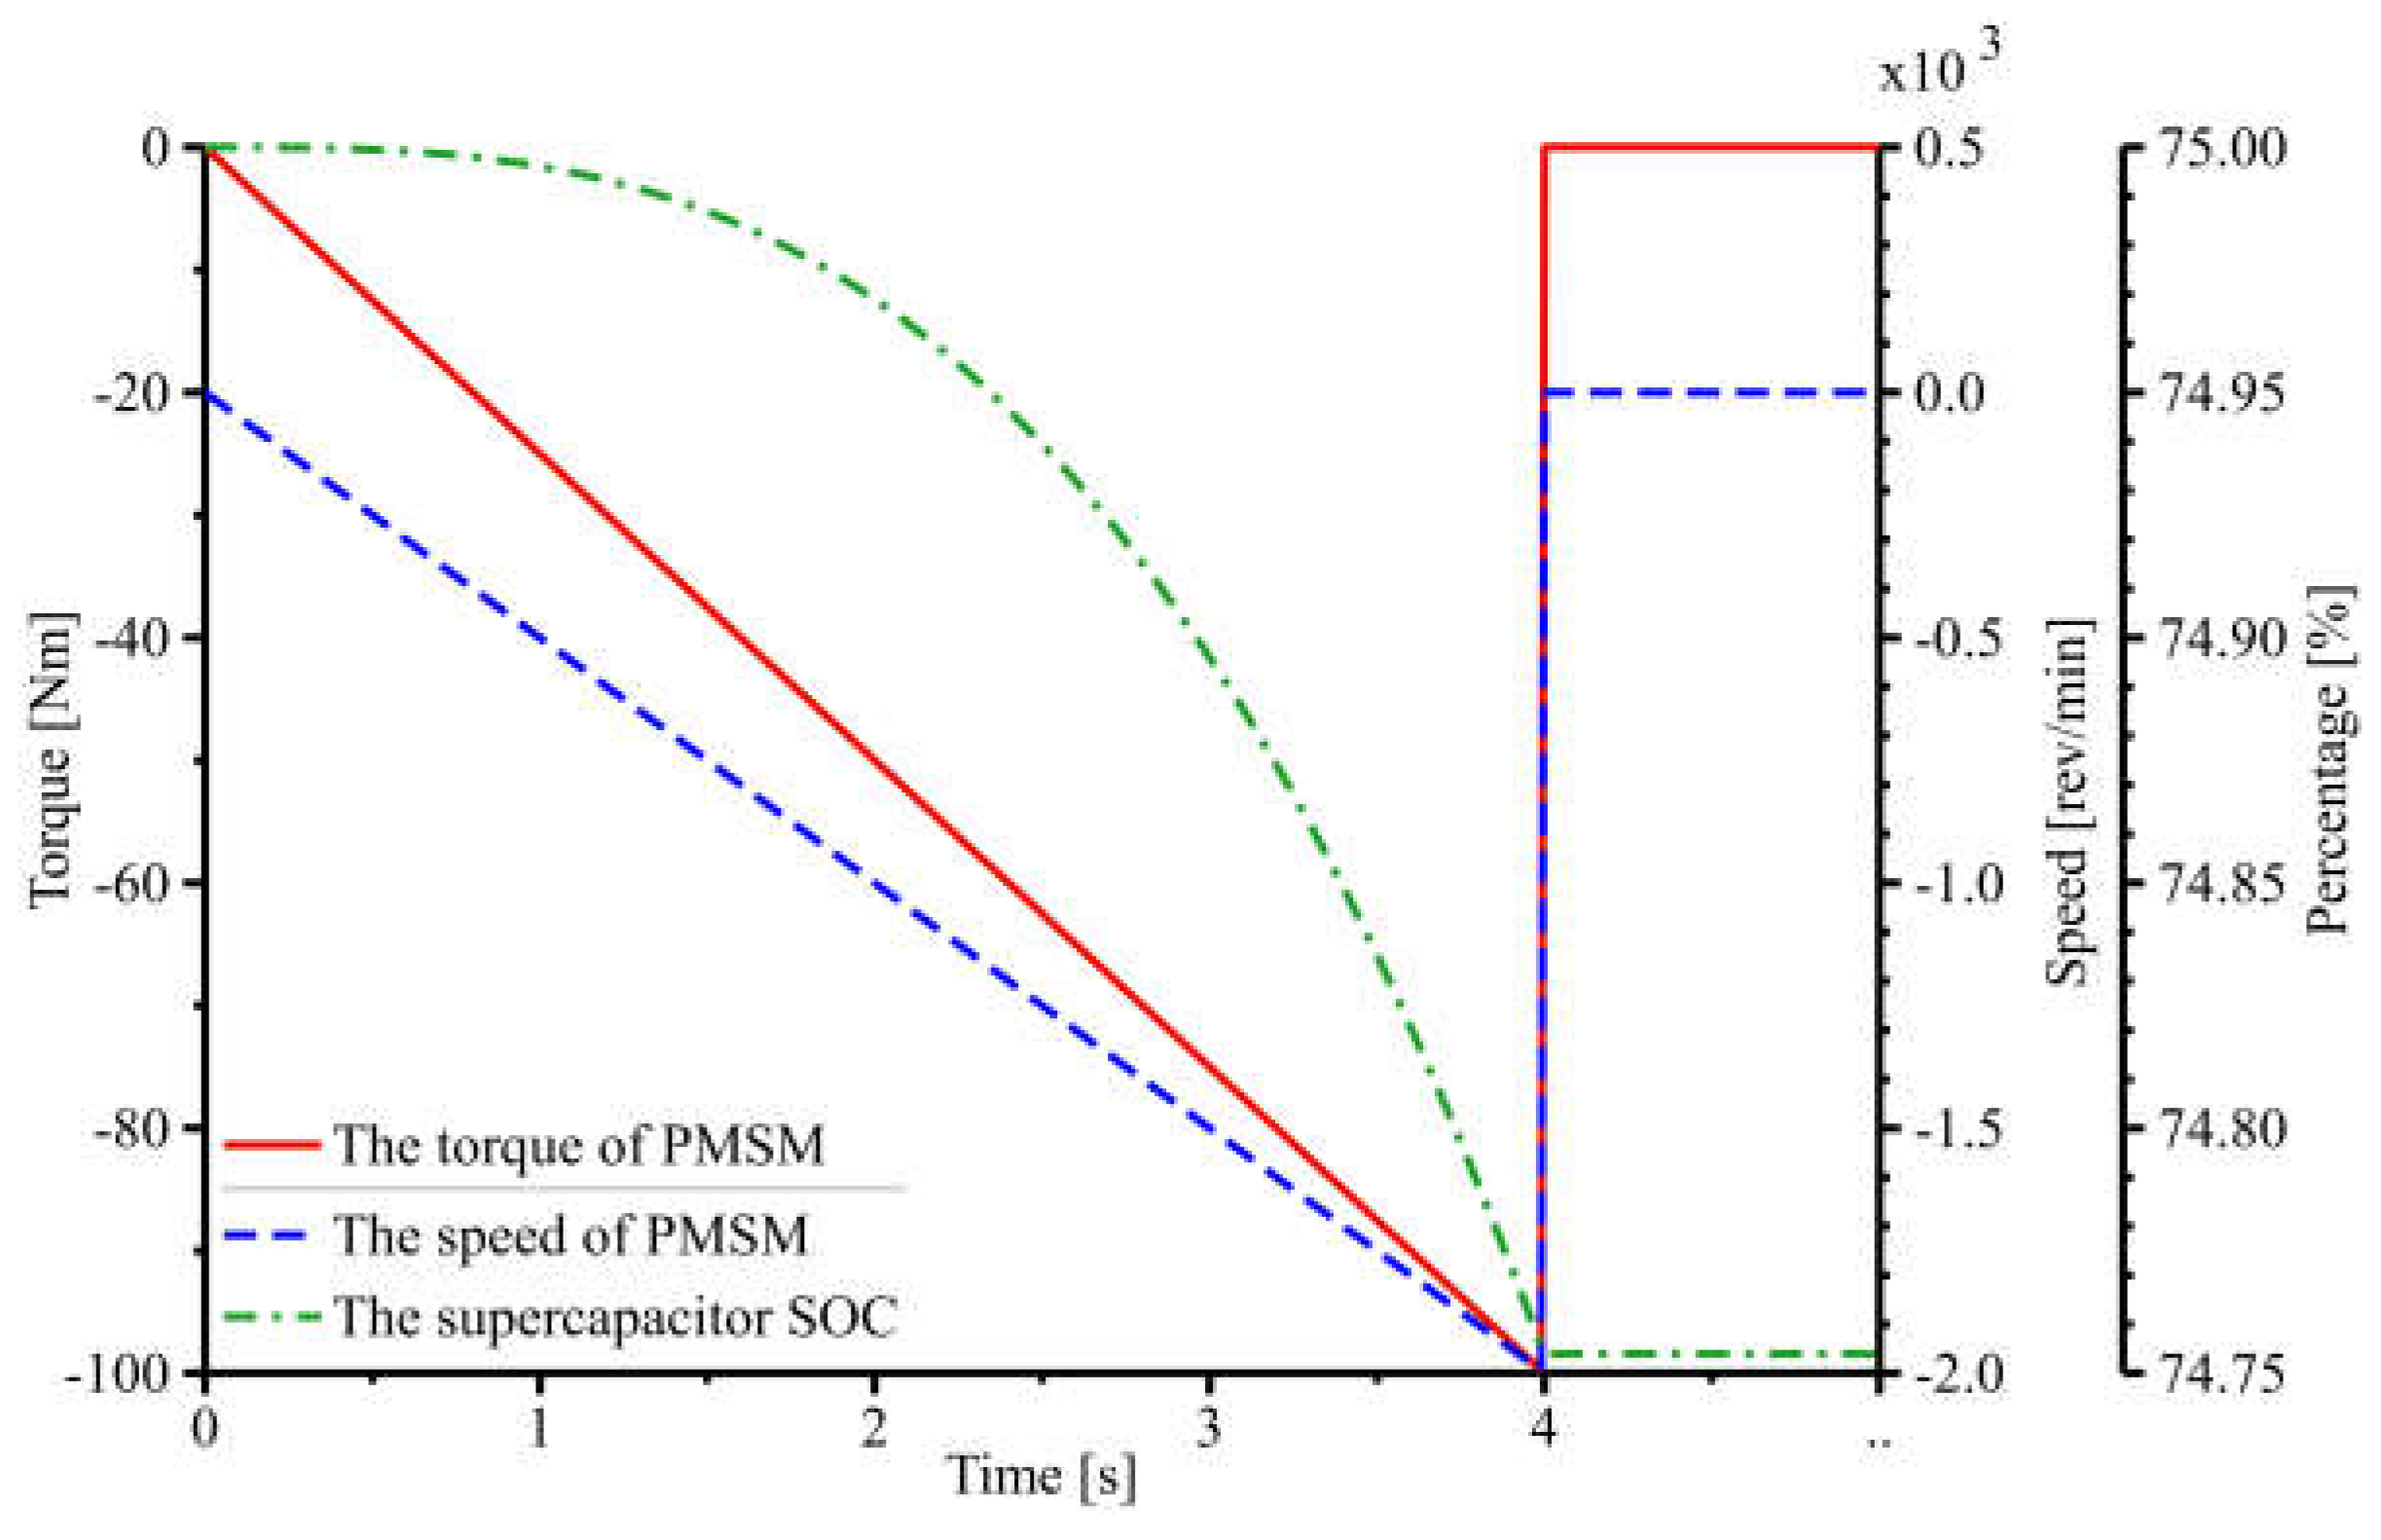
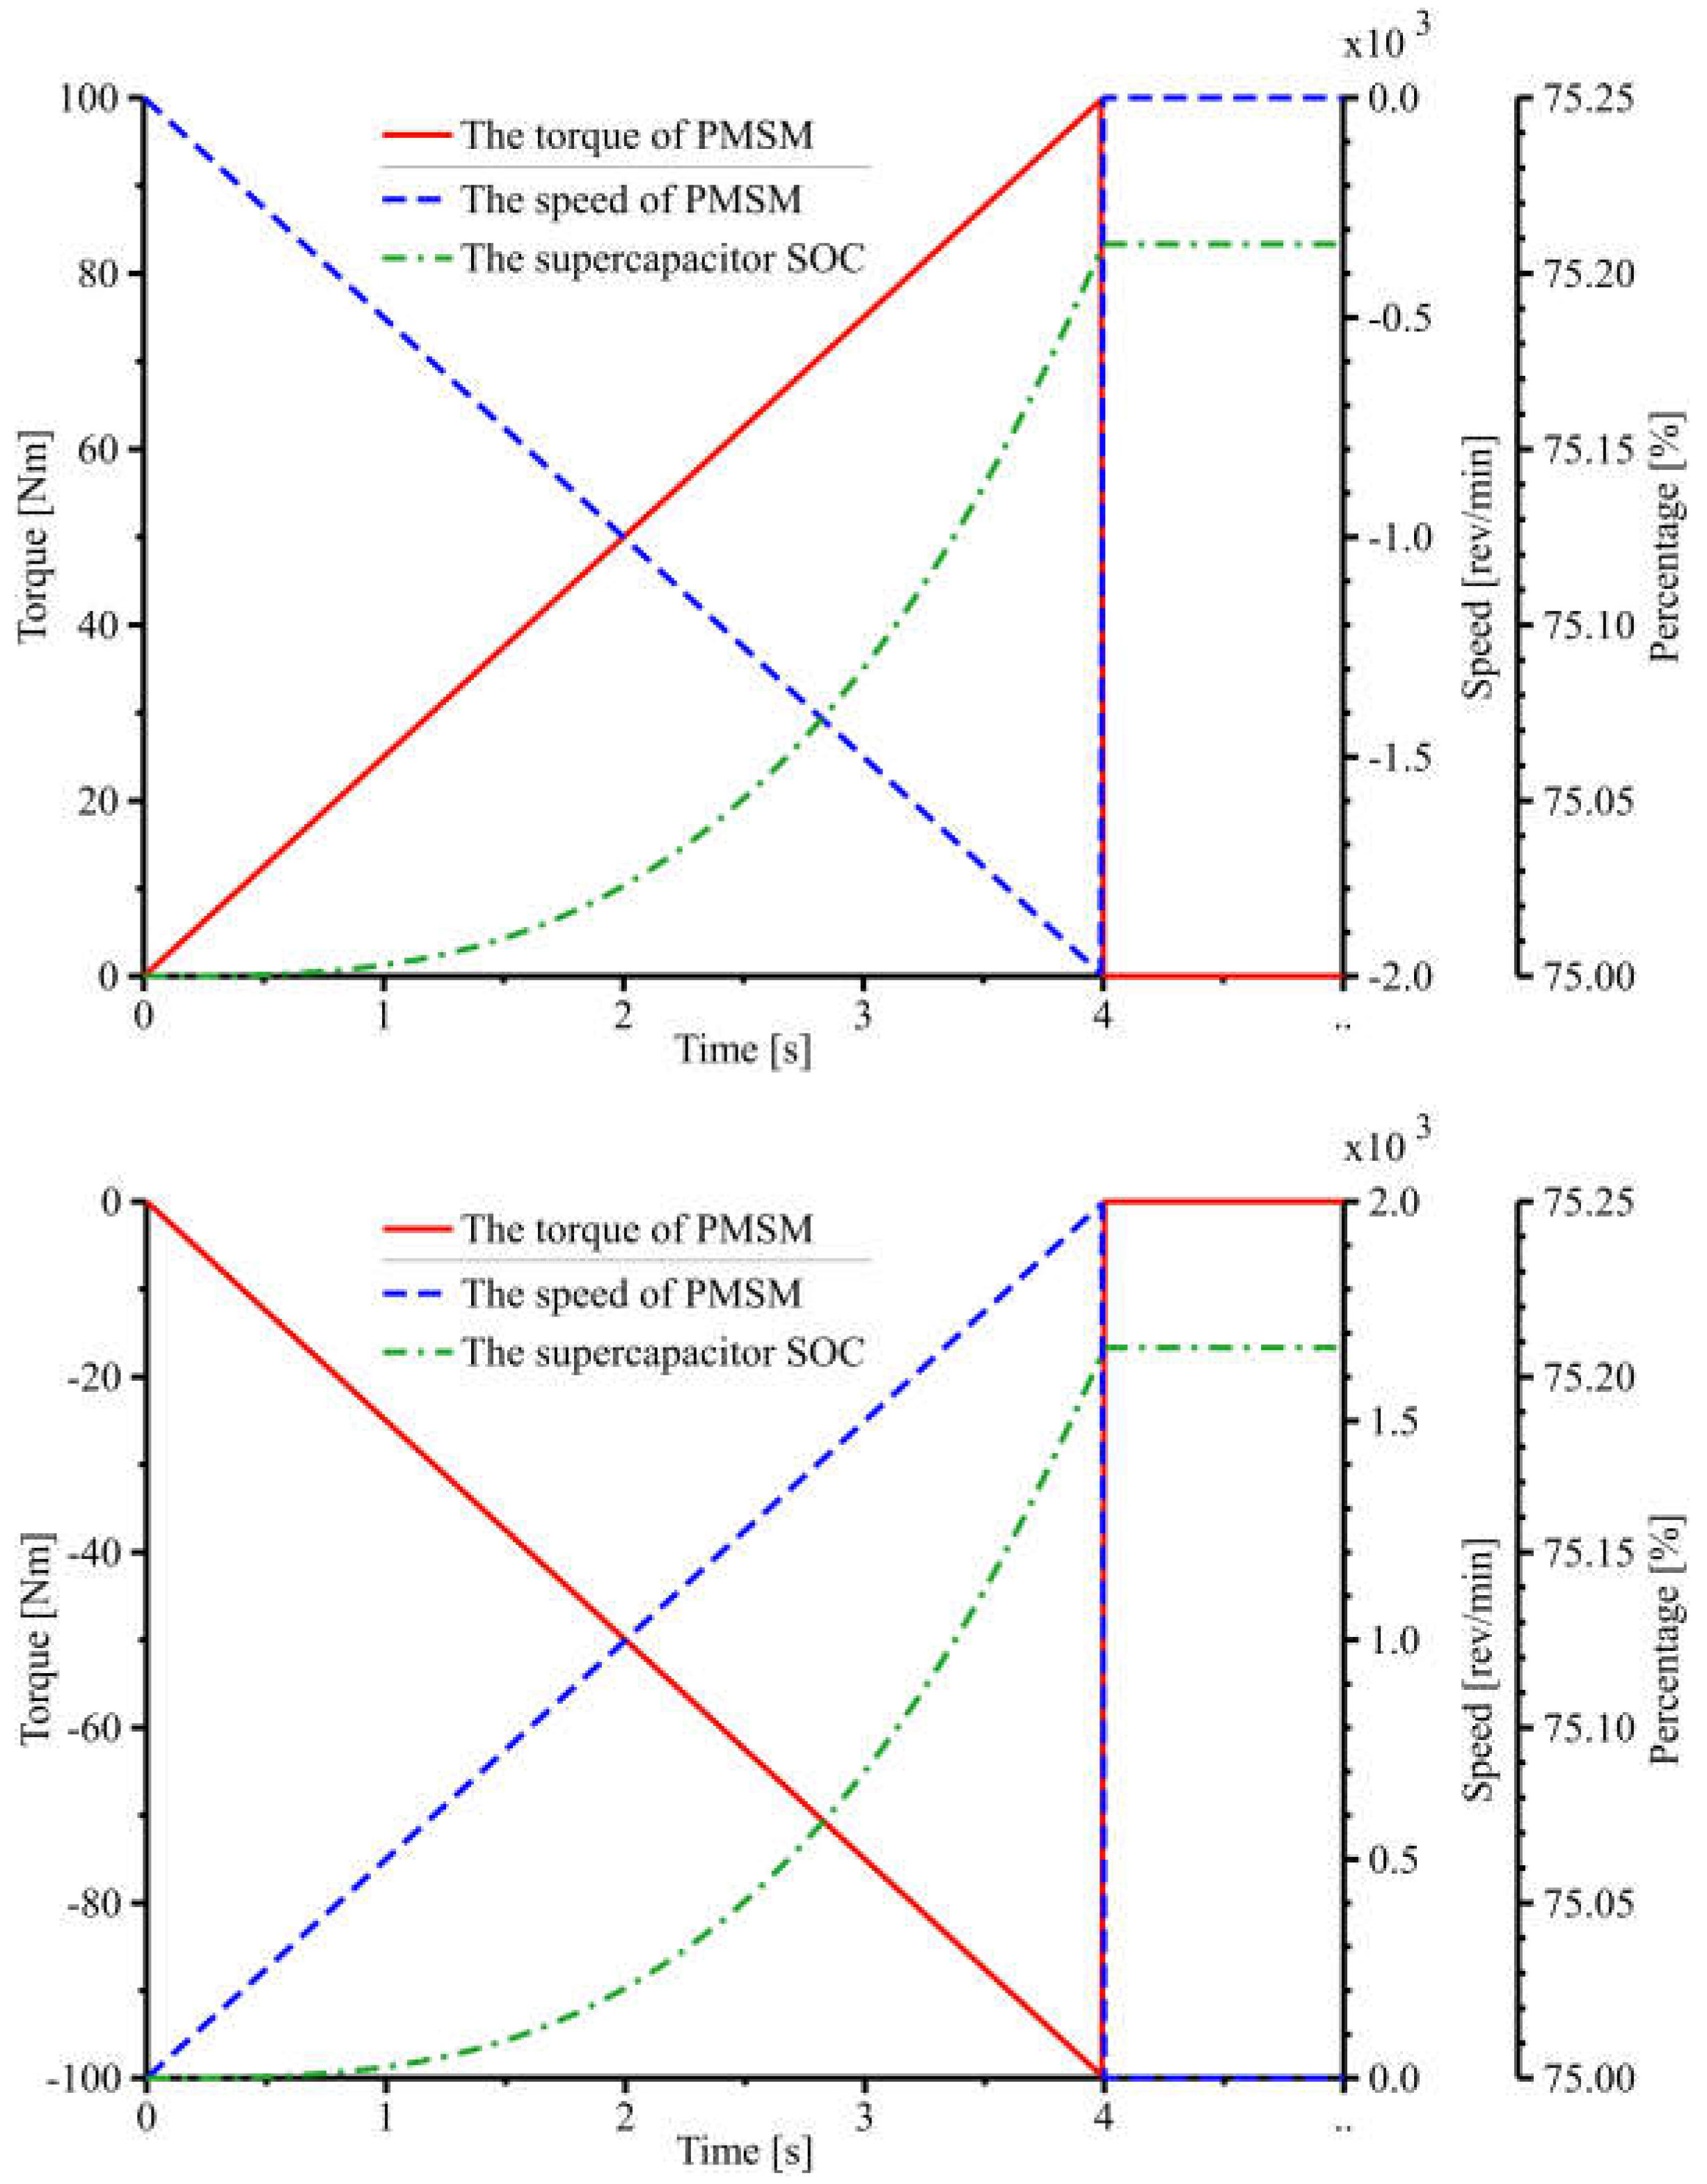
3.3.2. Validation of the PMSM Simulation Model

The PMSM can be divided into generator and motor modes according to its working situation. As shown in Figure 10, the speed and the torque are used as the horizontal and the vertical coordinate, respectively. According to equation P m = T ω , the PMSM enters motor mode when P m > 0 , and the PMSM enter the generator mode when P m < 0 . The AMESim EMD library is used to build the simulation model shown in Figure 11 based on the above Section 3.3.1 analysis to further verify the operating mode of the PMSM in four quadrants. The simulation time is set to 5 s. The speed control signal is 0 to 2000 rev/min or 0 to −2000 rev/min, and the torque control signal is 0 to 100 Nm or 0 to −100 Nm from 0 to 4 s. The speed and torque control signals are 0 from 4 to 5 s.
As shown in Figure 12, the PMSM enters the motor mode, and the supercapacitor SOC is reduced by 0.25% when the PMSM enters the I and III quadrants of operation. As shown in Figure 13, the PMSM enters the generator mode, and the supercapacitor SOC increases by 0.25% when the PMSM enters the II and IV quadrants of operation. The simulation results are consistent with the previous analysis and verify the feasibility of the PMSM simulation model.

4. Modeling and Simulation of the System

This section analyzes the modeling and simulation results of the system.

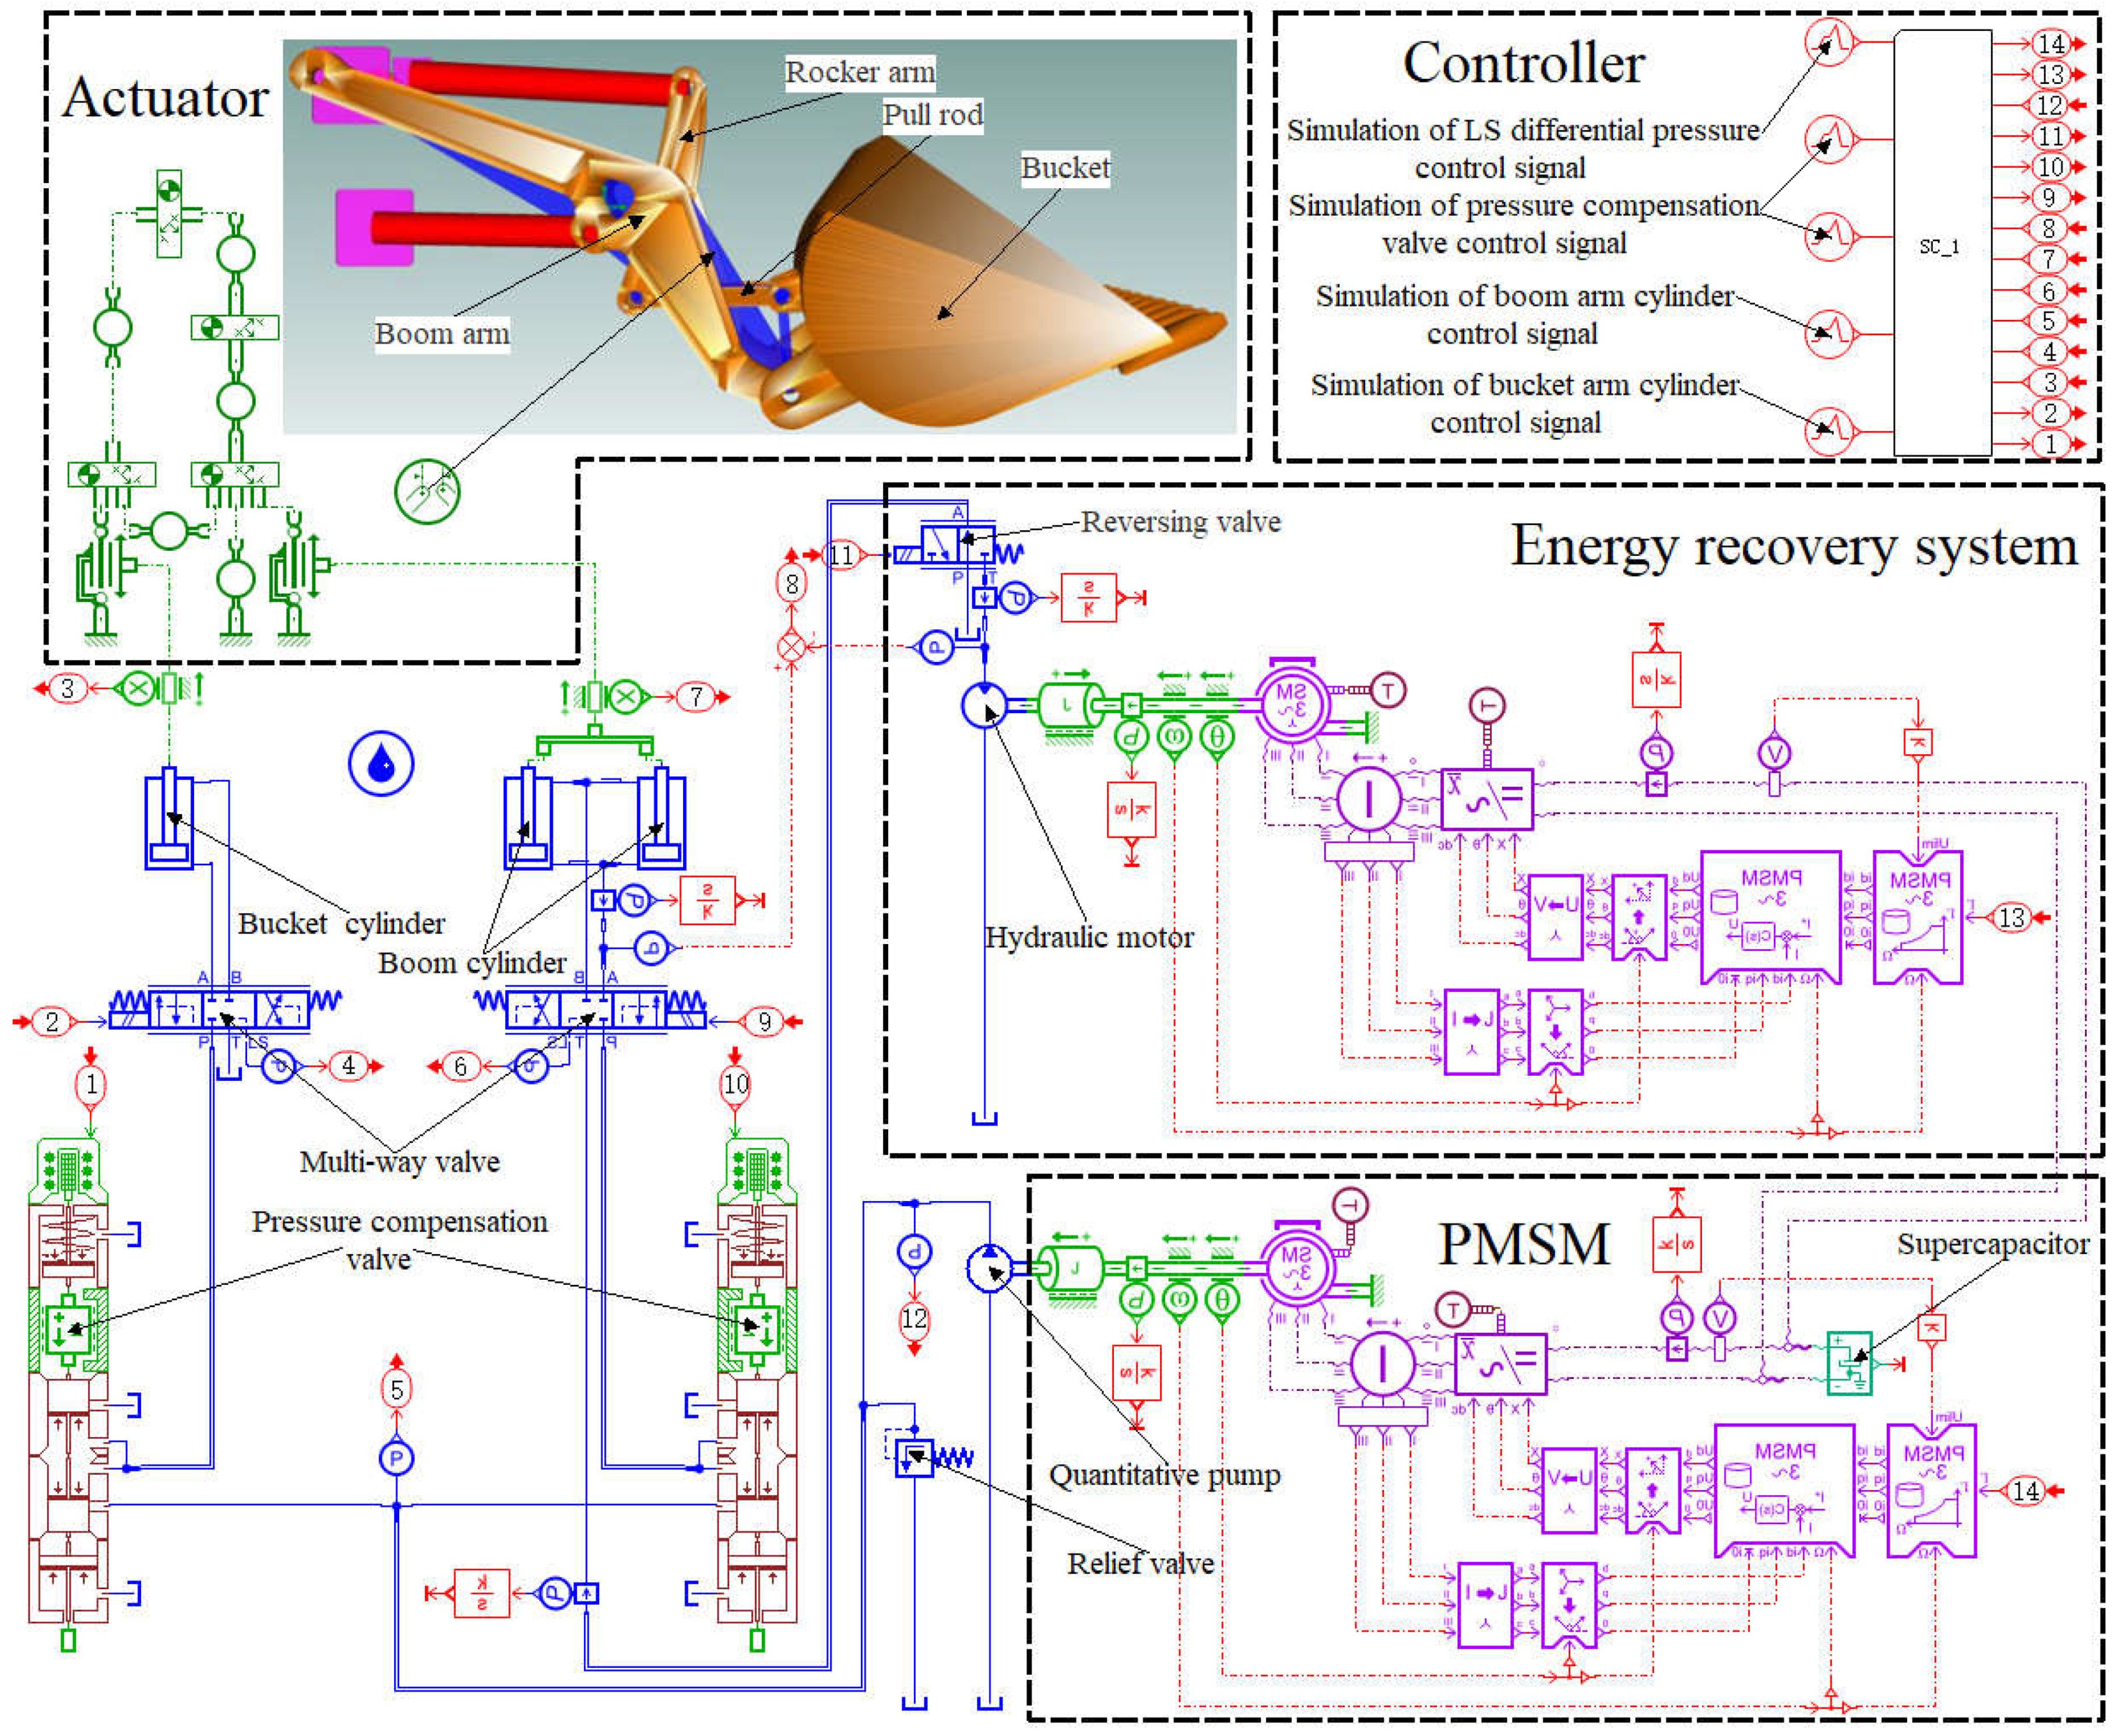
4.1. Modeling of the System

According to Figure 2, the AMESim hydraulic library is used to build the hydraulic system model. According to Figure 3 and Figure 4, the AMESim signal library is used to build the system control strategy. According to the drawings provided by the manufacturer, the AMESim 2D mechanical library is used to build the actuator model. Furthermore, combined with the simulation model of the PMSM, the simulation model can be built, as shown in Figure 14.
This paper studies and simulates a 50-type wheel loader under typical working conditions. Loaders can perform shoveling and short-distance material transport operations. The I-type working condition has the highest number of times per unit time, which is one of the standard working methods when conducting loaders tests [27]. Therefore, this paper takes the I-type working condition. It is generally lifted by the load and dropped by the no-load when the loader performs loading and unloading operations. Thus, the recoverable energy is mostly the gravitational potential energy of the actuator when the boom arm drops [28]. Therefore, the loader is set up under no-load conditions for the simulation. The system’s variable pressure margin control range can be determined based on the pressure margin range of the conventional LS system [29]. The system parameters are set based on the above analysis, as shown in Table 1. The Δ p L S is 25 bar, and the Δ p d is 15 bar in the conventional system. The Δ p L S is 25 bar, and the Δ p d is 15 bar in the before the variable pressure margin control system. The Δ p L S is 20 bar, and the Δ p d is 15 bar in the after the variable pressure margin control and energy recovery systems. Furthermore, the Δ p 0 is 1 bar. The control signal of the cylinders is set, as shown in Figure 15. The system completes the excavation from 0 to 5 s, the raising action from 5 to 11 s, the dumping from 11 to 18 s, and the resetting from 18 to 25 s. This way, the system completes a complete I-type working condition in 25 s. The simulation time is set to 50 s, i.e., the system completes the action twice under the I-type working condition.

4.2. Simulation of the System

This section analyzes of the characteristics of the cylinder displacement, the system robustness, the system energy recovery performance, and the system energy-saving performance.

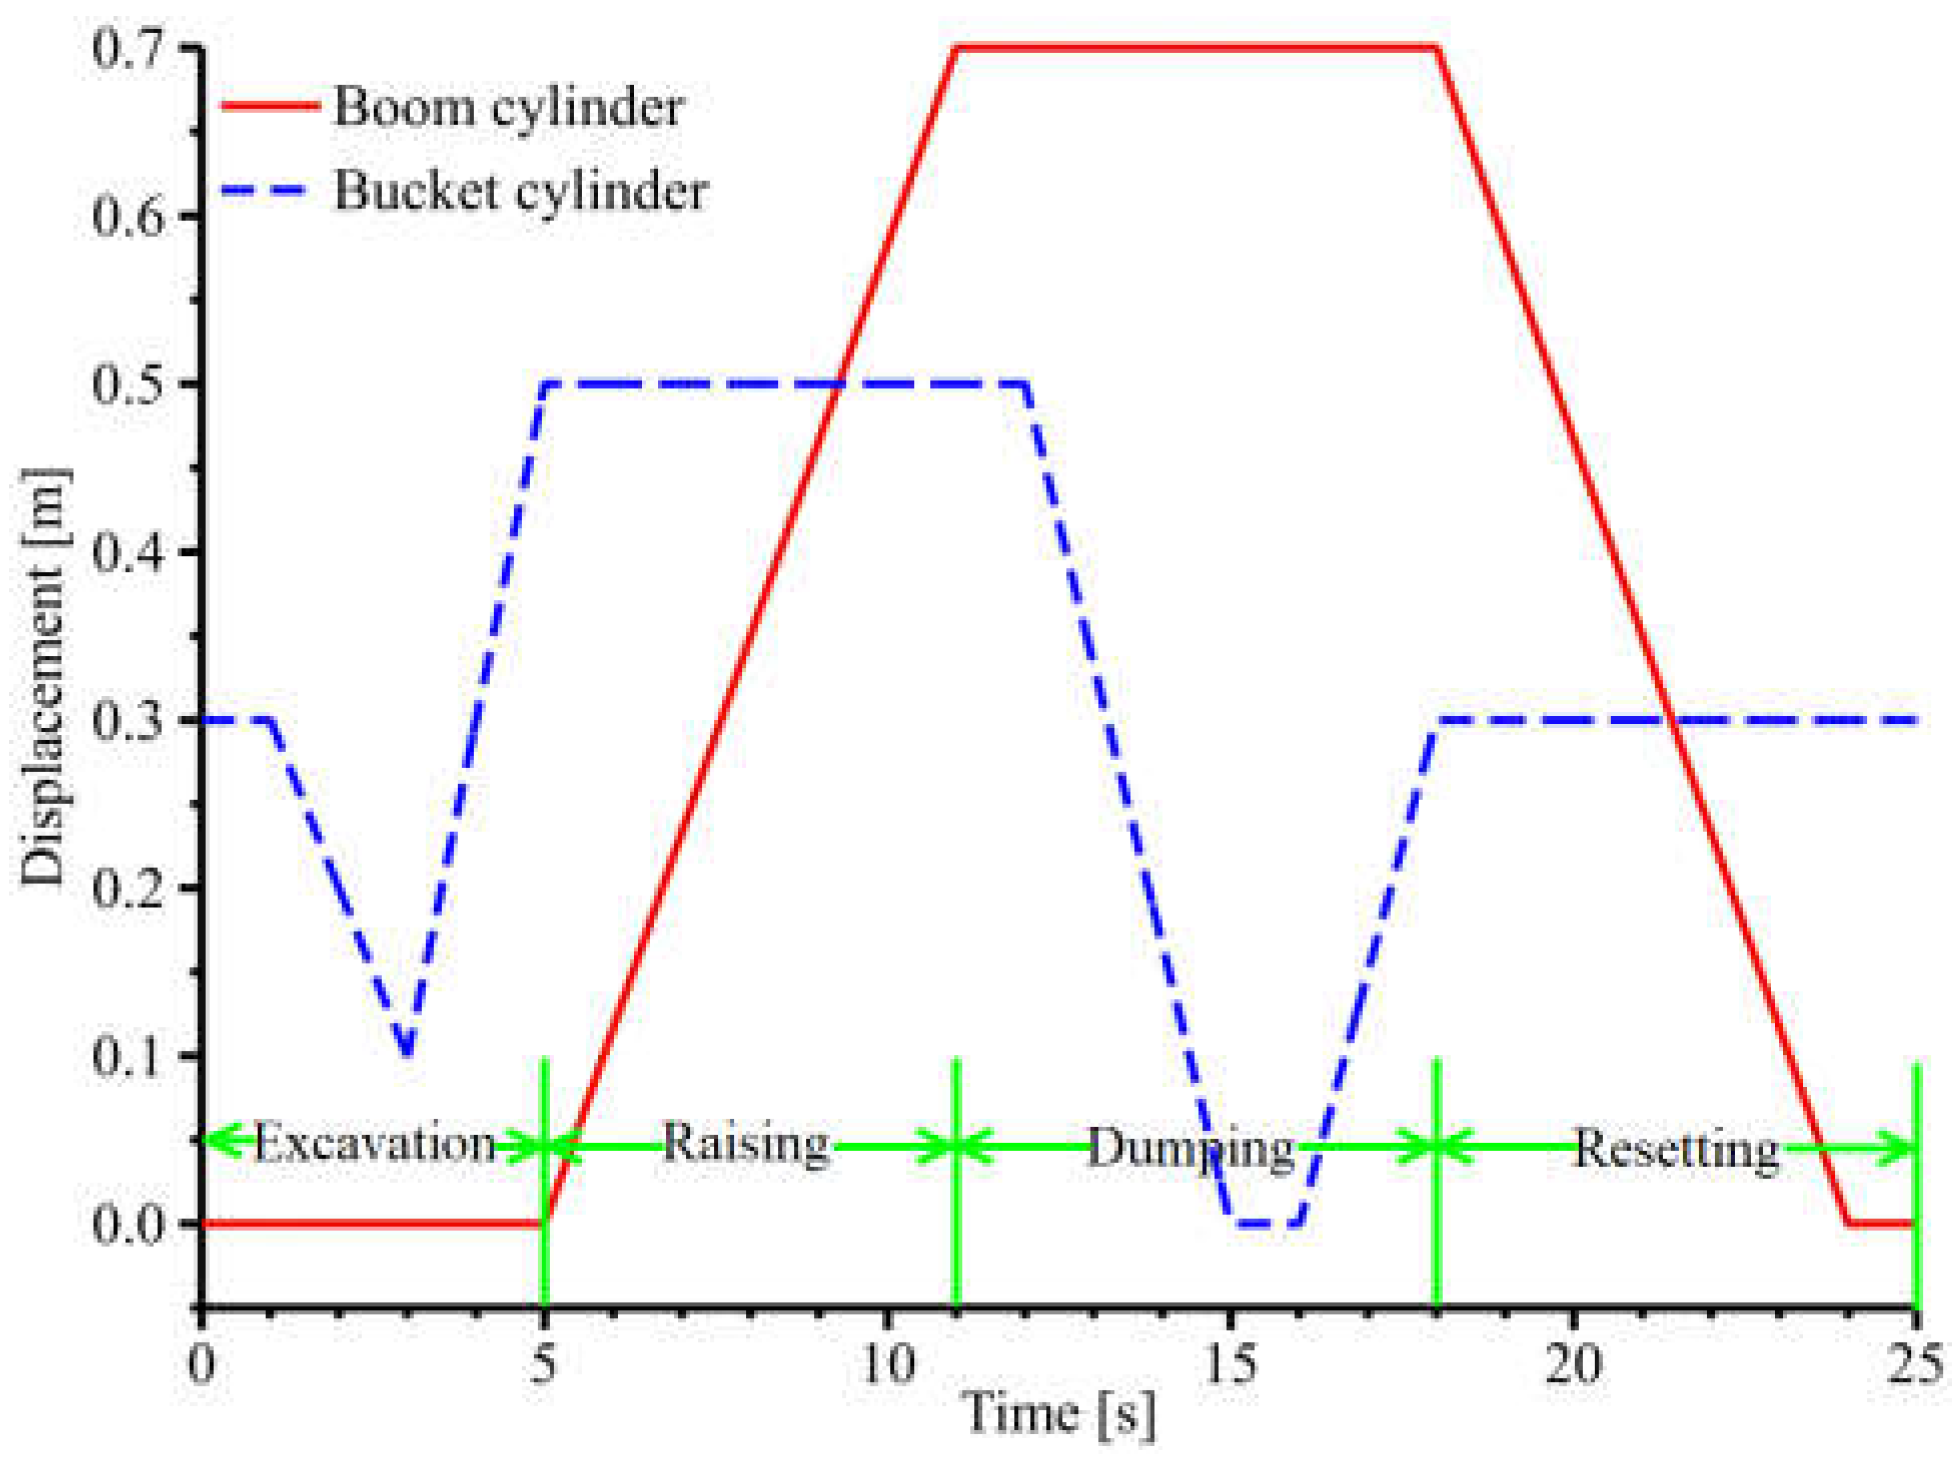
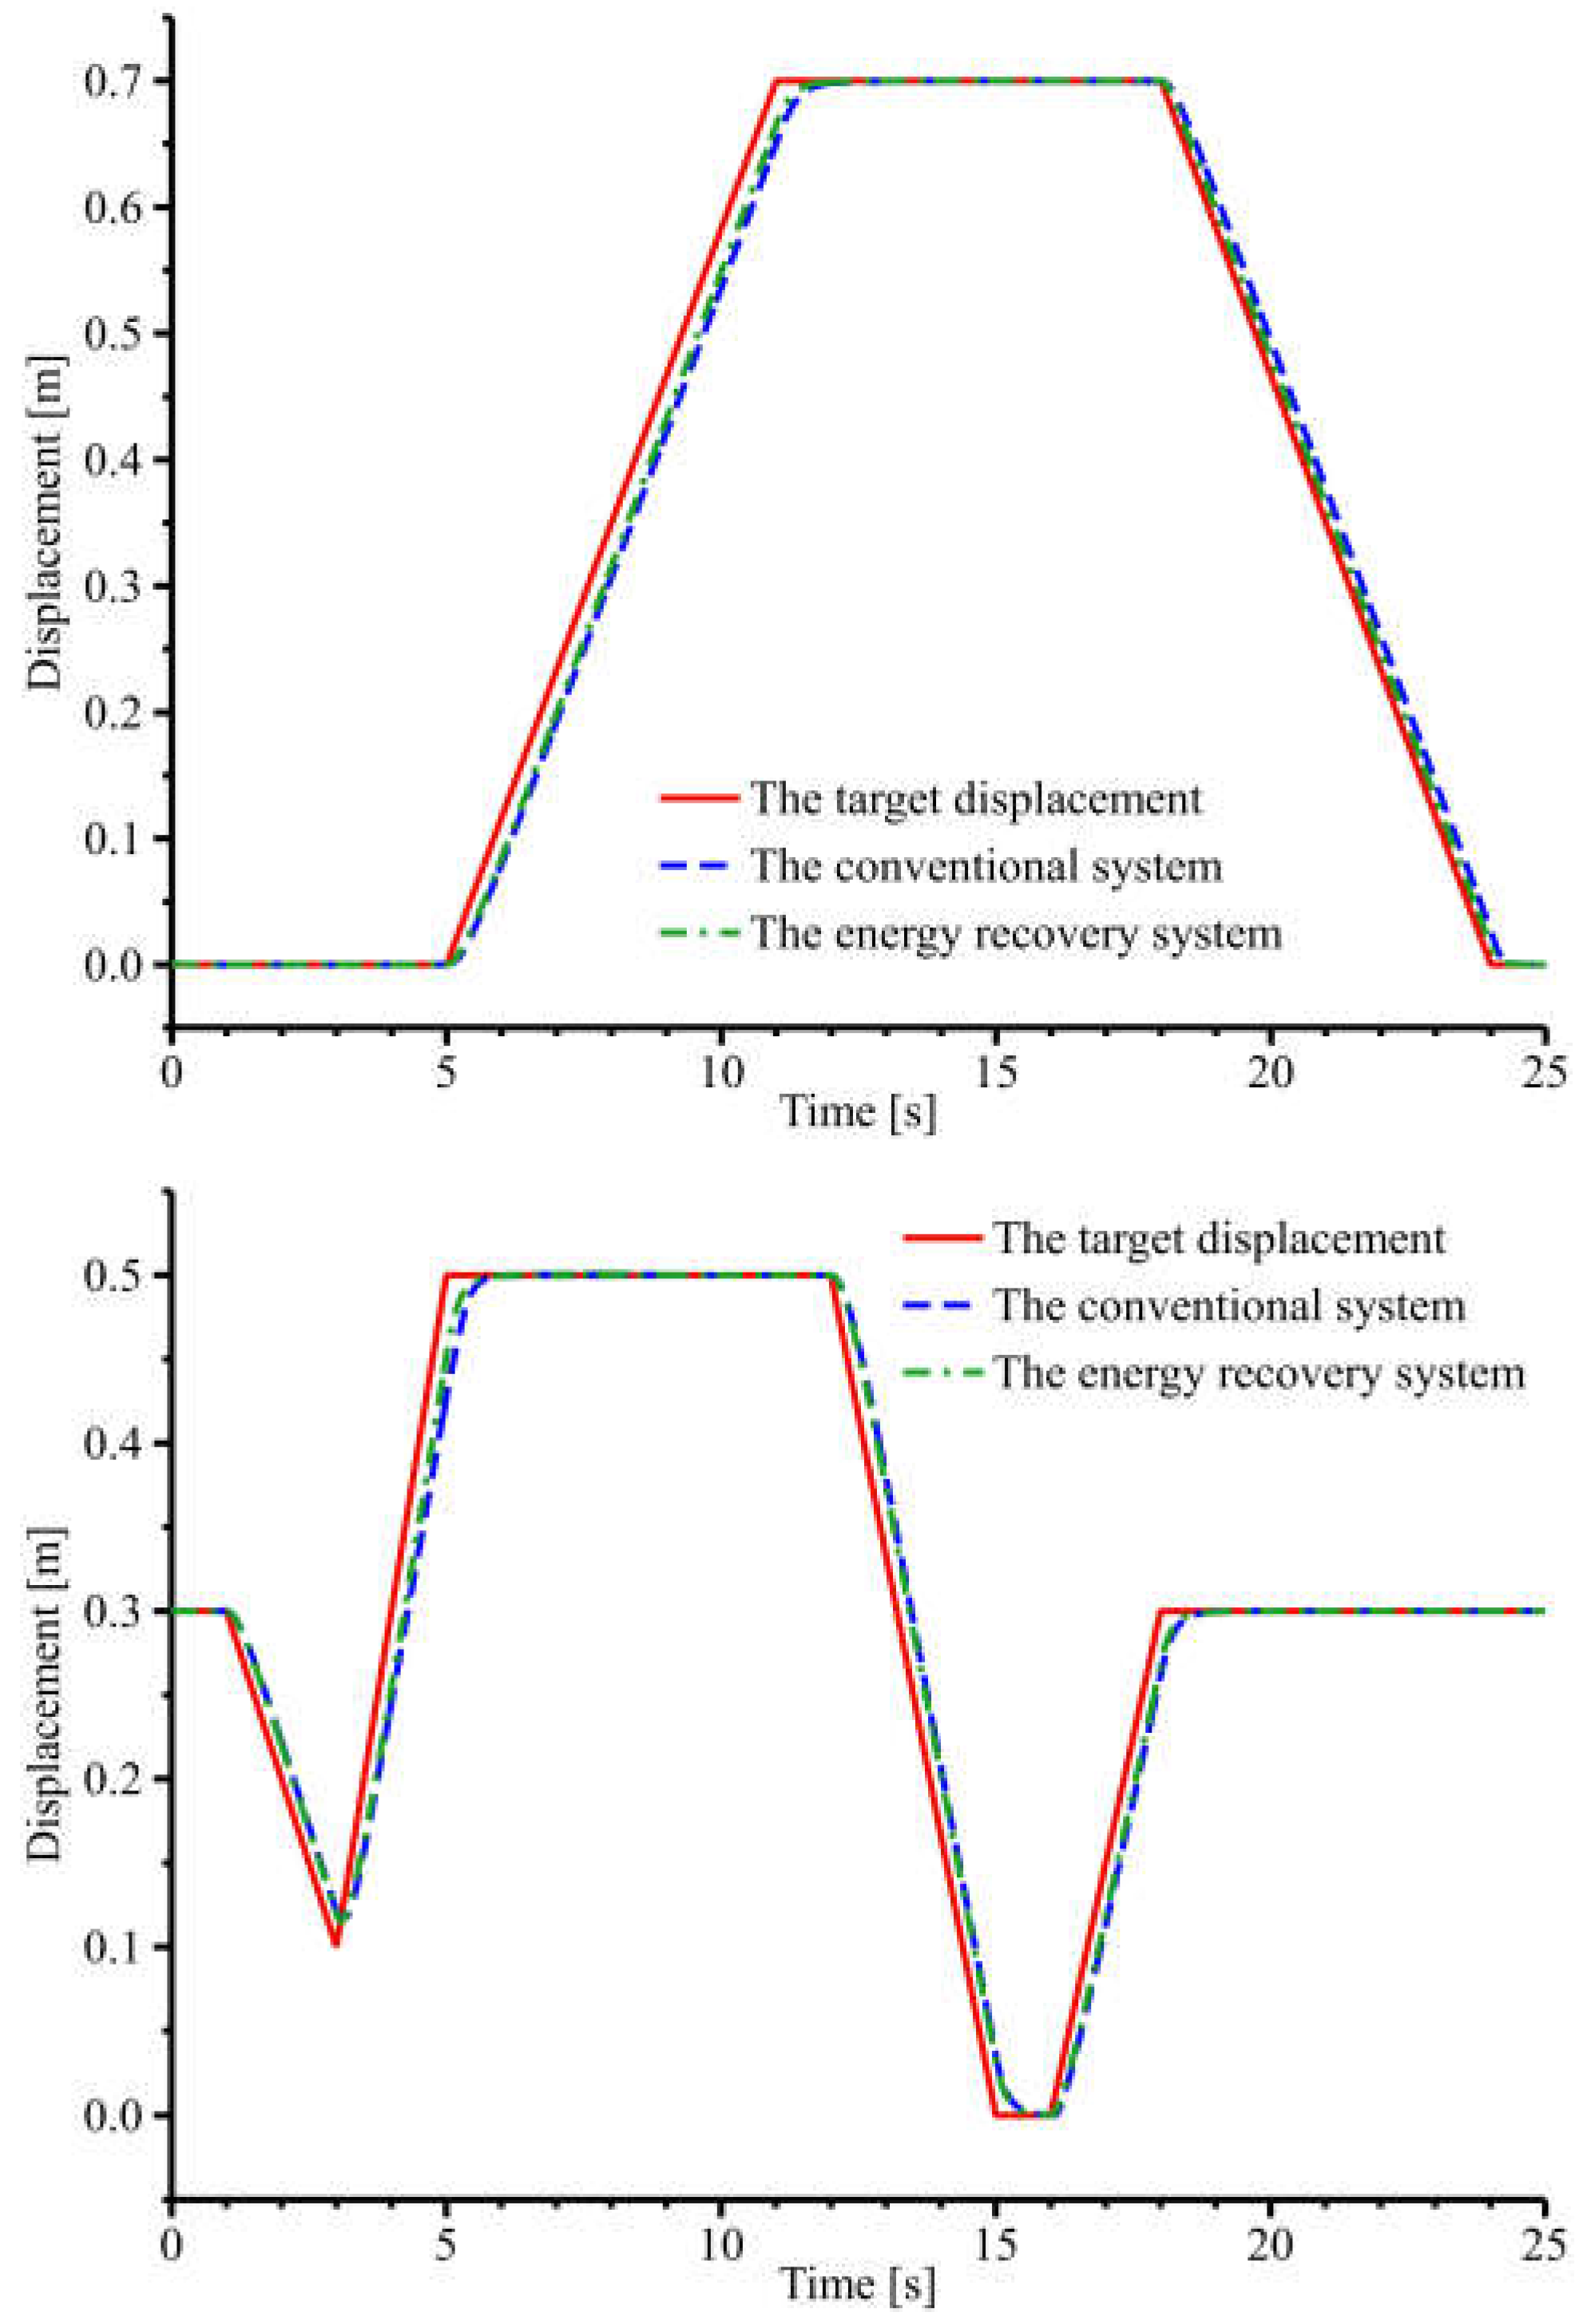
4.2.1. Analysis of the Characteristics of the Cylinder Displacement

As shown in Figure 16, after the first working cycle, the boom and bucket cylinders of the conventional and energy recovery systems can carry out compound actions due to the pre-valve pressure compensation technology and the cylinder position control systems. Both the boom and bucket cylinders can track the target displacements. As shown in Figure 17, the displacement error of the energy recovery system is smaller than that of the conventional system when the target displacement of the boom cylinder changes. The same is true when the target displacement of the bucket cylinder changes. Then, the transient performance of the energy recovery system is better. The displacement error of both the energy recovery system and the conventional system is 0 when the target displacement of the boom bucket and cylinder is constant. Then, both the energy recovery and conventional systems have better steady-state performance. In summary, the energy recovery system’s transient performance is better than the conventional system.

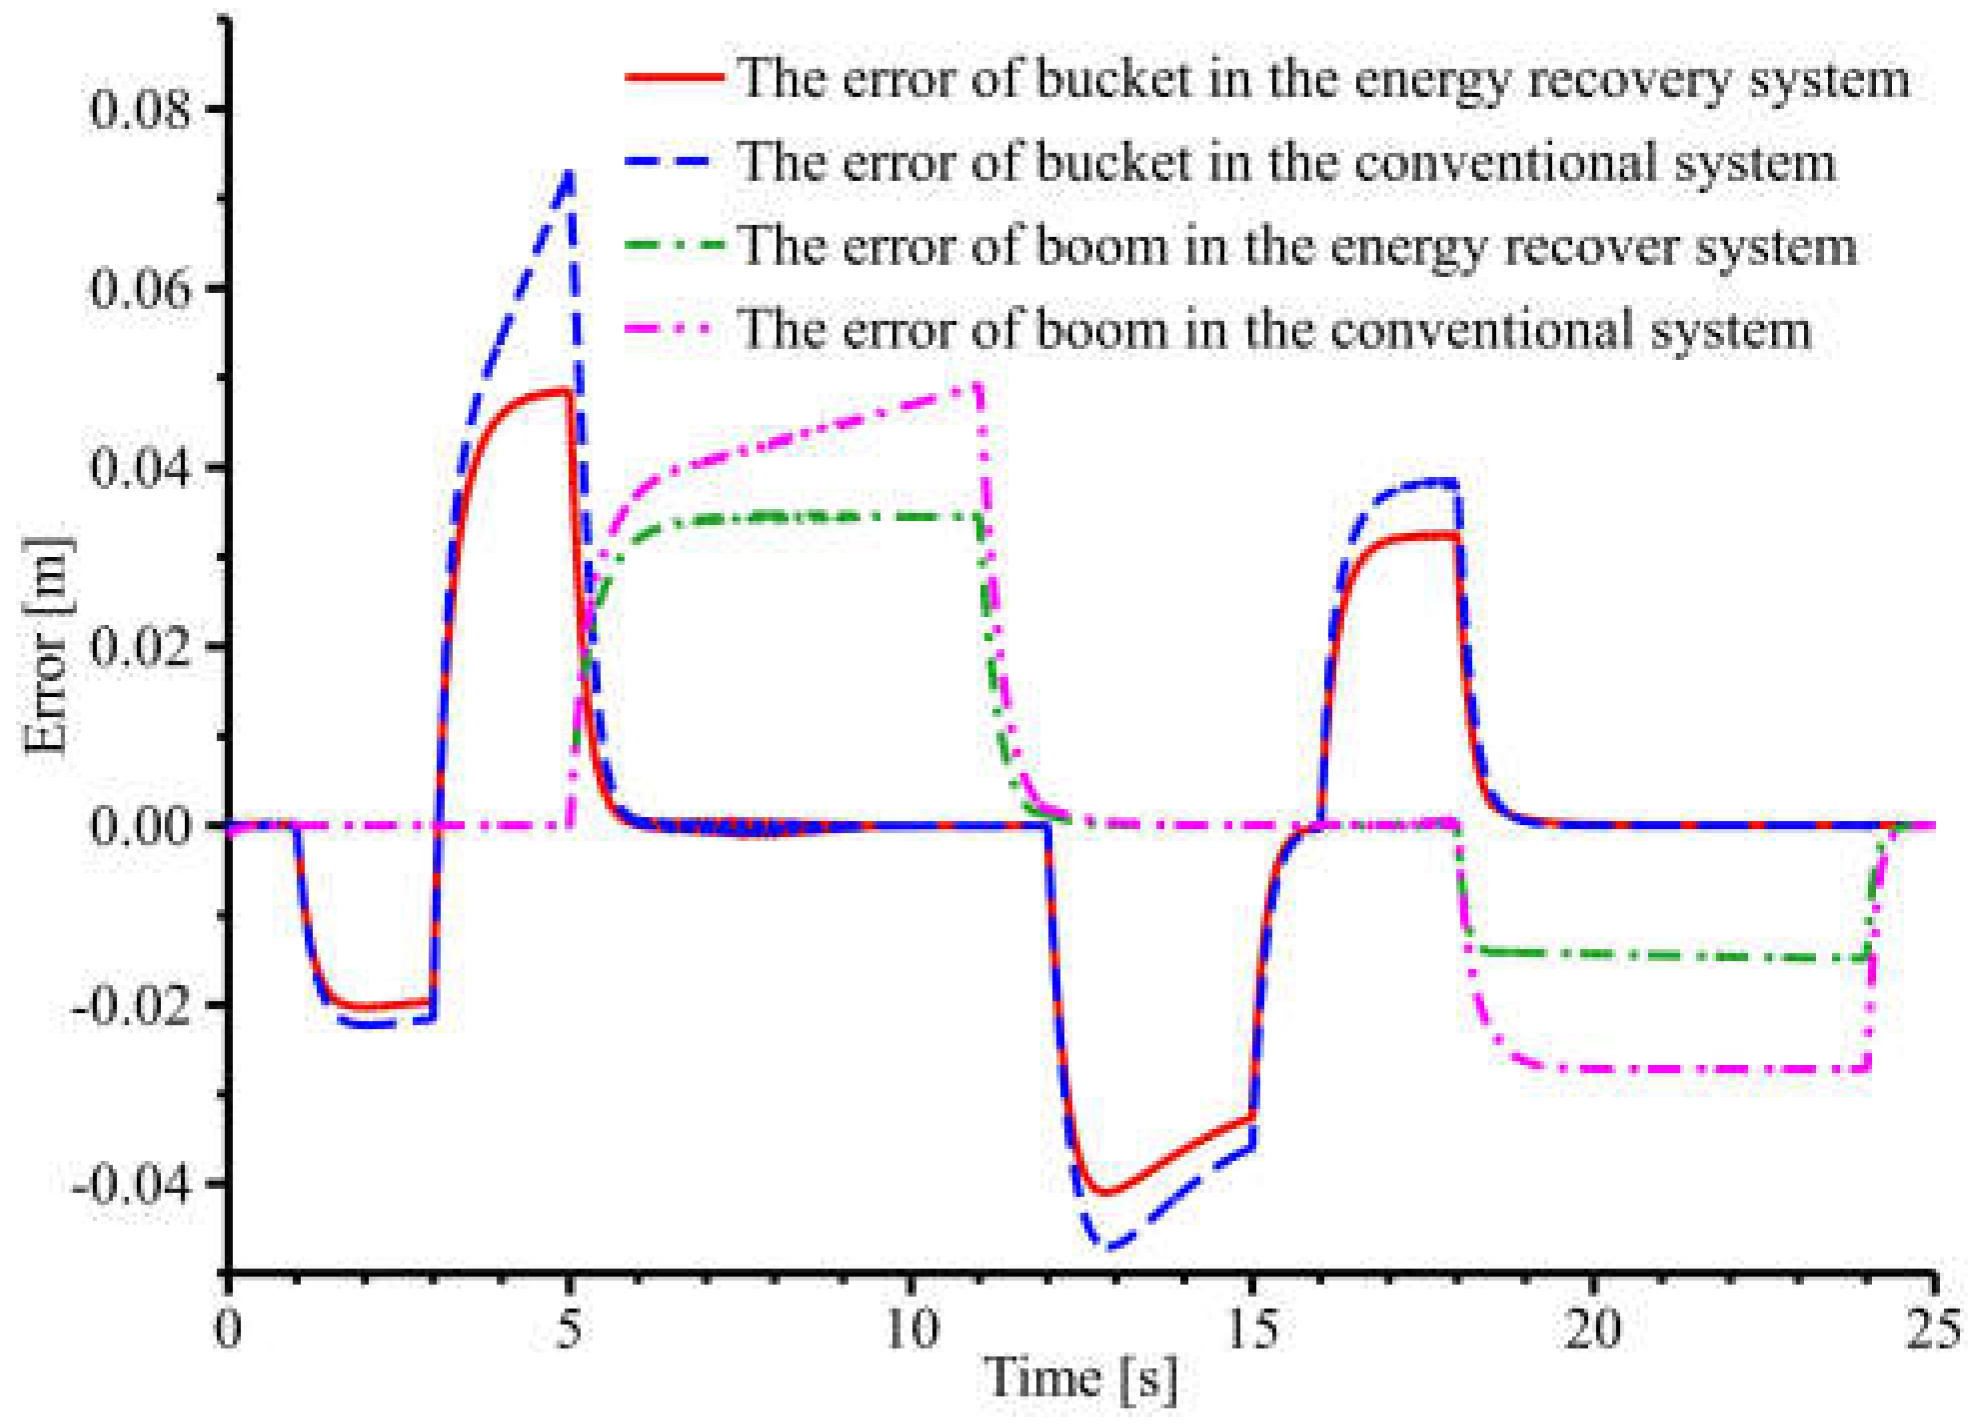
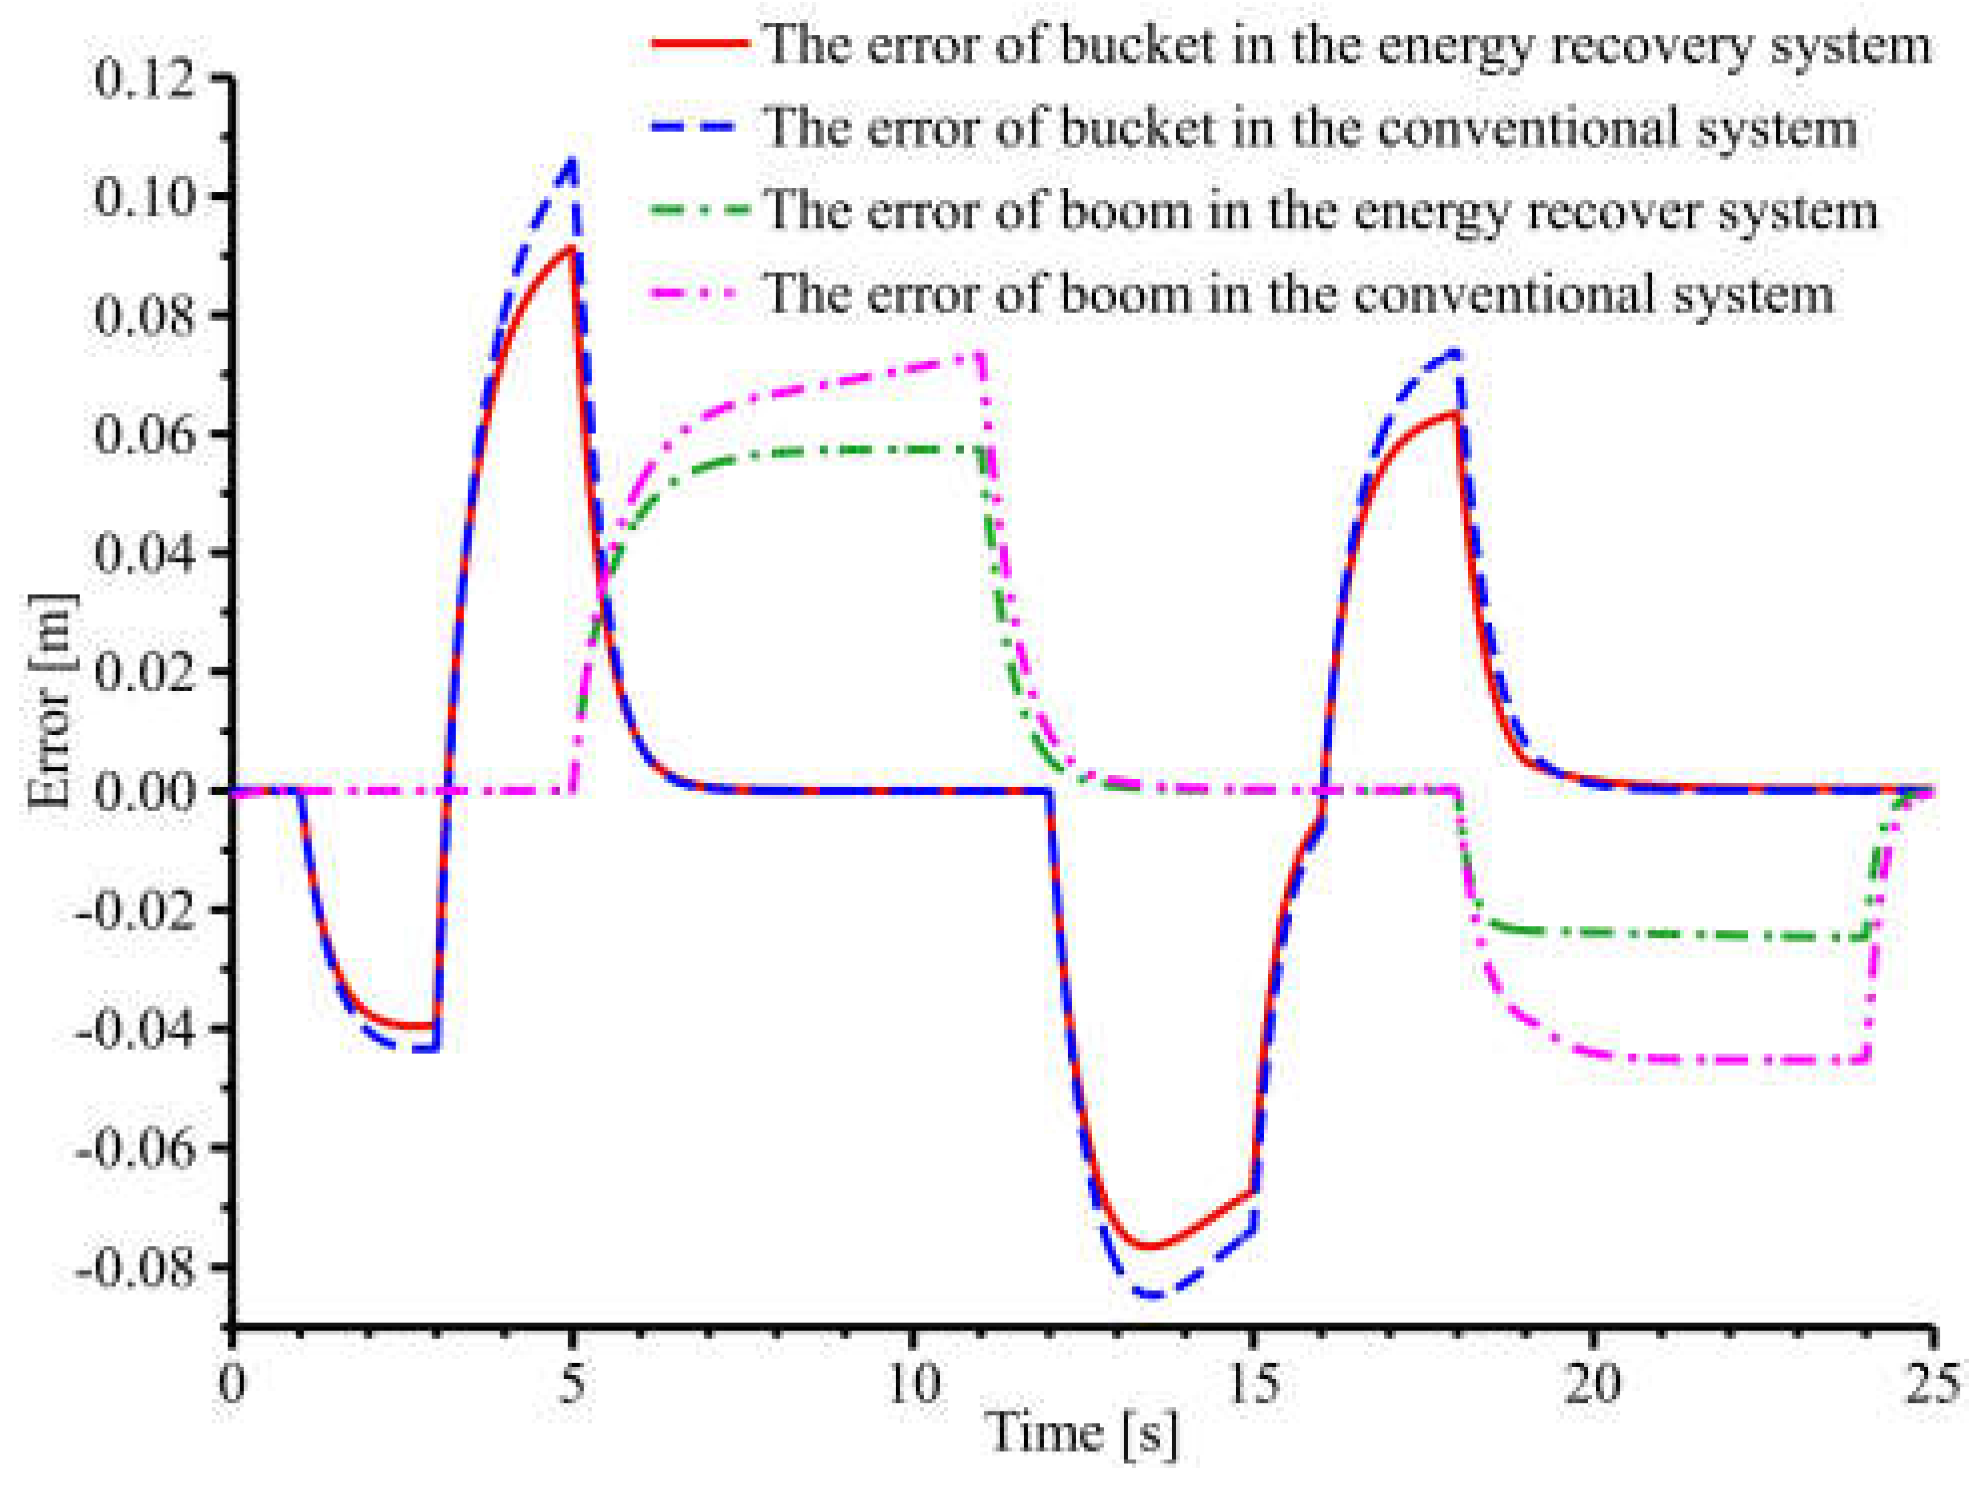
4.2.2. Analysis of the System Robustness

To further test the system’s robustness, 1 t and 2 t of material are added to the bucket and compared with the conventional system. The cylinder displacement error curves are shown in Figure 18. When the material mass is 1 t, the maximum displacement error of the boom cylinder of the conventional system is 0.058 m, and the bucket cylinder is 0.082 m. The maximum displacement error of the boom cylinder of the energy recovery system is 0.043 m, and the bucket cylinder is 0.064 m. Then, the maximum displacement error of the boom cylinder is reduced by 25.9%, and the maximum displacement error of the bucket cylinder is reduced by 22%. When the material mass is 2 t, the maximum displacement error of the boom cylinder of the conventional system is 0.073 m, and the bucket cylinder is 0.105 m. The maximum displacement error of the boom cylinder of the energy recovery system is 0.057 m, and the bucket cylinder is 0.091 m. Then, the maximum displacement error of the boom cylinder is reduced by 21.9%, and the maximum displacement error of the bucket cylinder is reduced by 13.3%. In summary, the energy recovery system effectively reduces the cylinder displacement error and has better robustness than the conventional system when the bucket material mass changes.

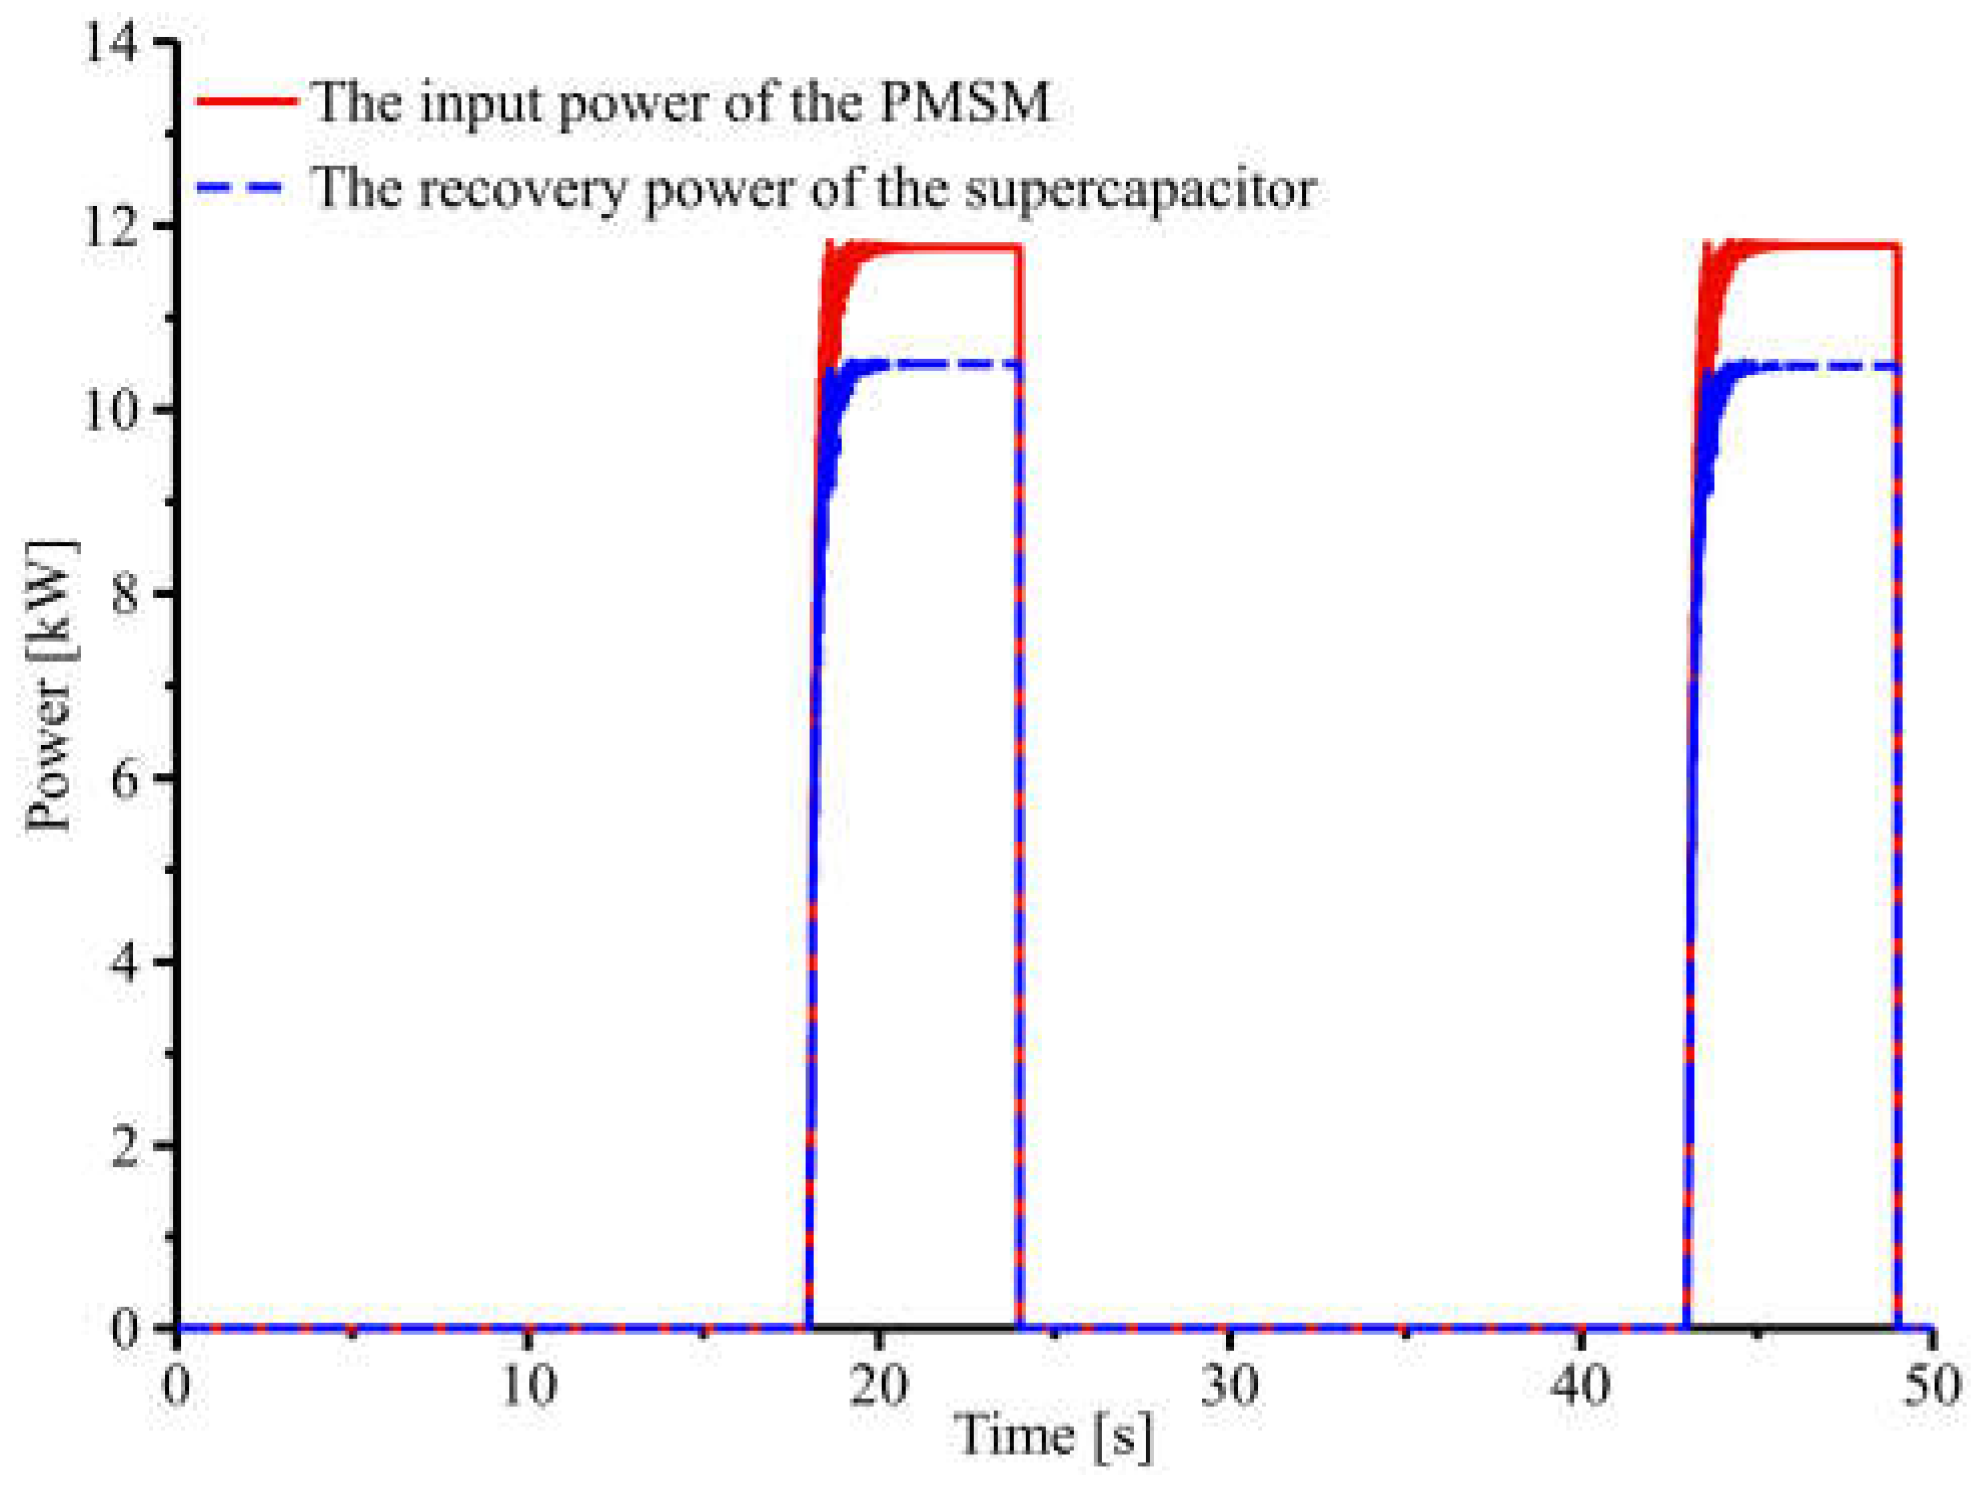
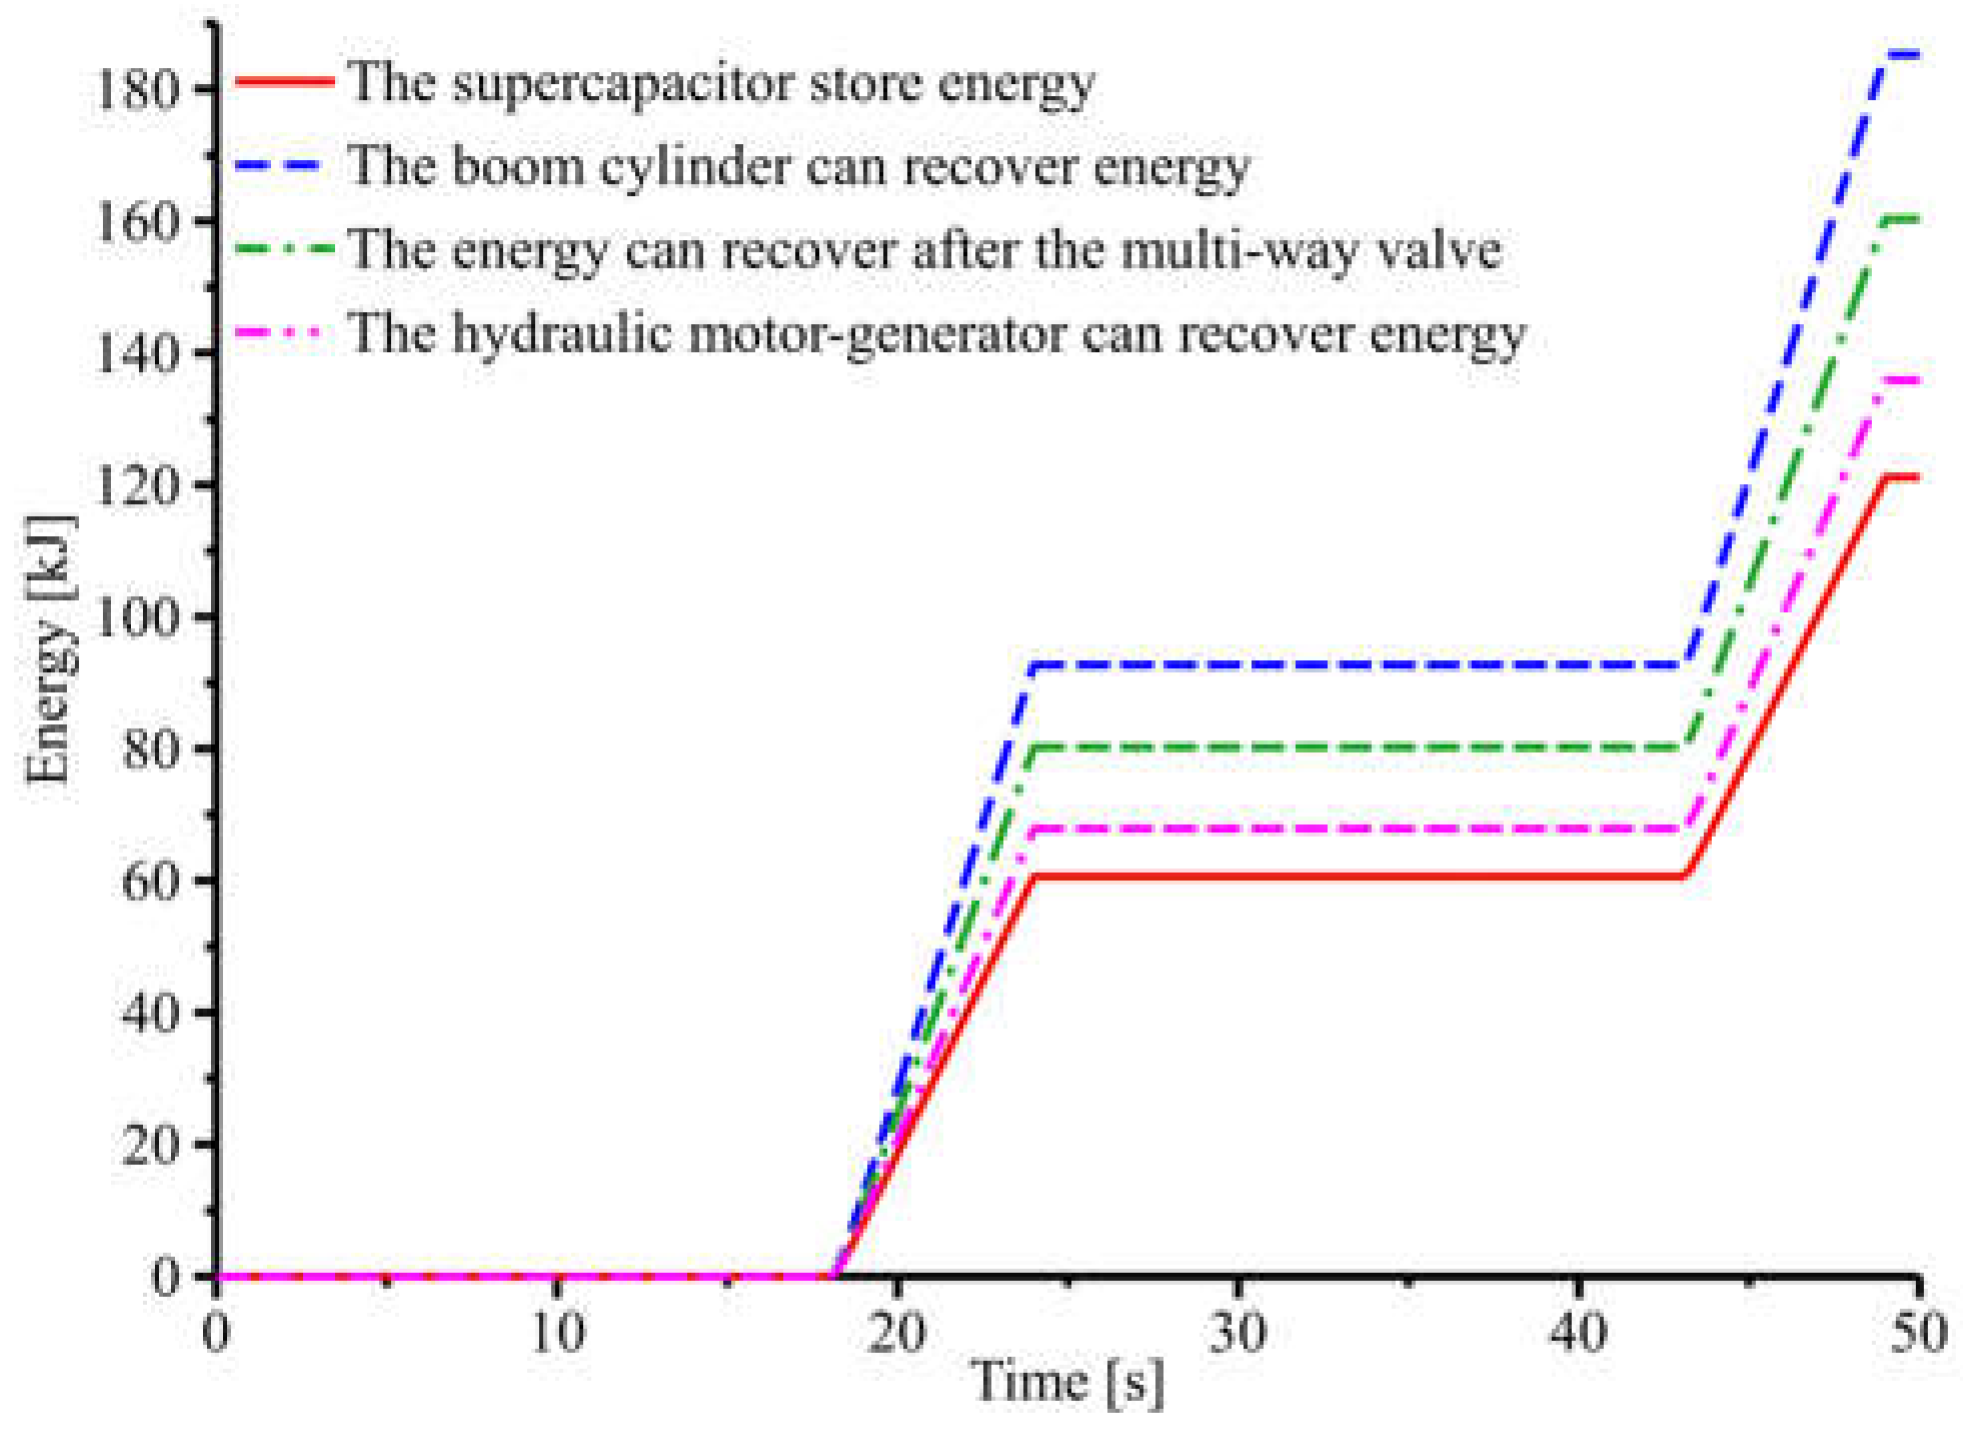
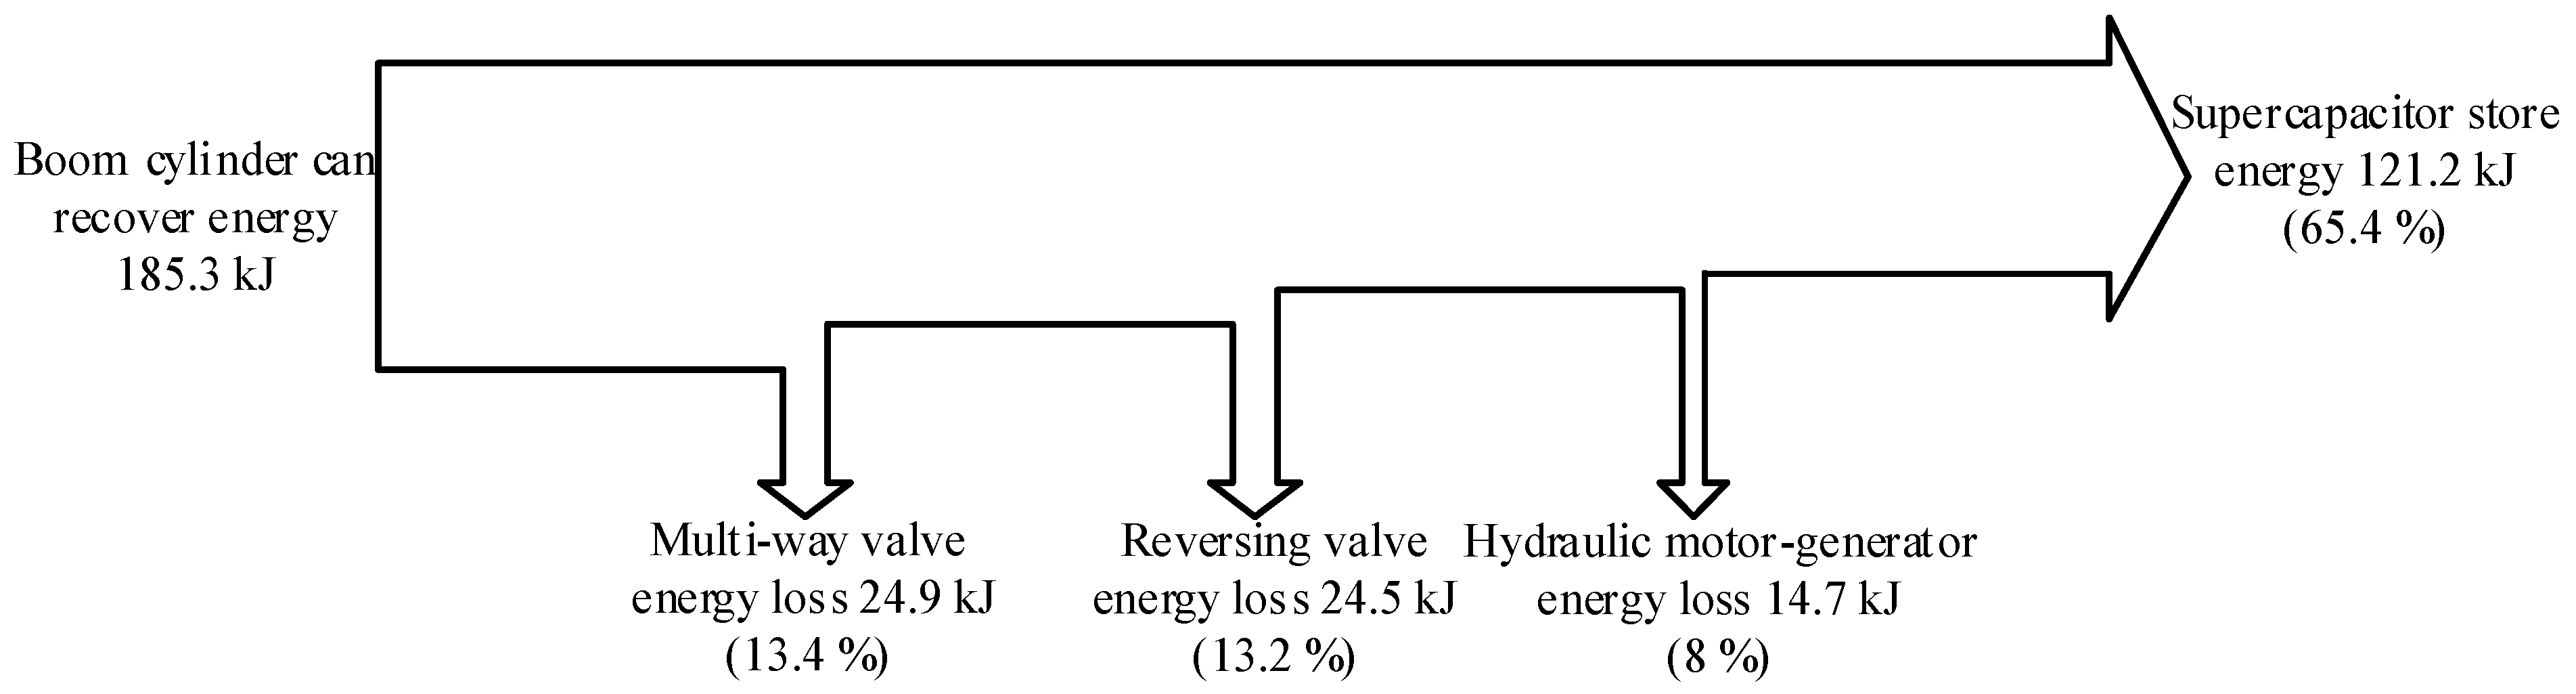
4.2.3. Analysis of the System Energy Recovery Performance

As shown in Figure 19, after two working cycles, the input power of the PMSM is 11.8 kW, and the recovery power of the supercapacitor is 10.5 kW in the energy recovery system when the boom drops during 18 to 24 s and 33 to 39 s. The energy recovery efficiency of the PMSM is 89%. The input energy of the PMSM is fully recovered and stored in the supercapacitor.
As shown in Figure 20, after two working cycles, the total recoverable energy of the boom cylinders is 185.3 kJ, the multi-way valve is 160.4 kJ, and the hydraulic motor-generator is 135.9 kJ. Furthermore, the supercapacitor stored energy is 121.2 kJ. Therefore, the energy loss through the multi-way valve is 24.9 kJ, the reversing valve is 24.5 kJ, and the hydraulic motor-generator is 14.7 kJ. The system energy loss diagram is shown in Figure 21. The energy recovery efficiency of the system is 65.4%, and most of the gravitational potential energy generated by the boom cylinders is recovered when the boom arm drops. In summary, the system has high energy recovery efficiency and good energy recovery performance.

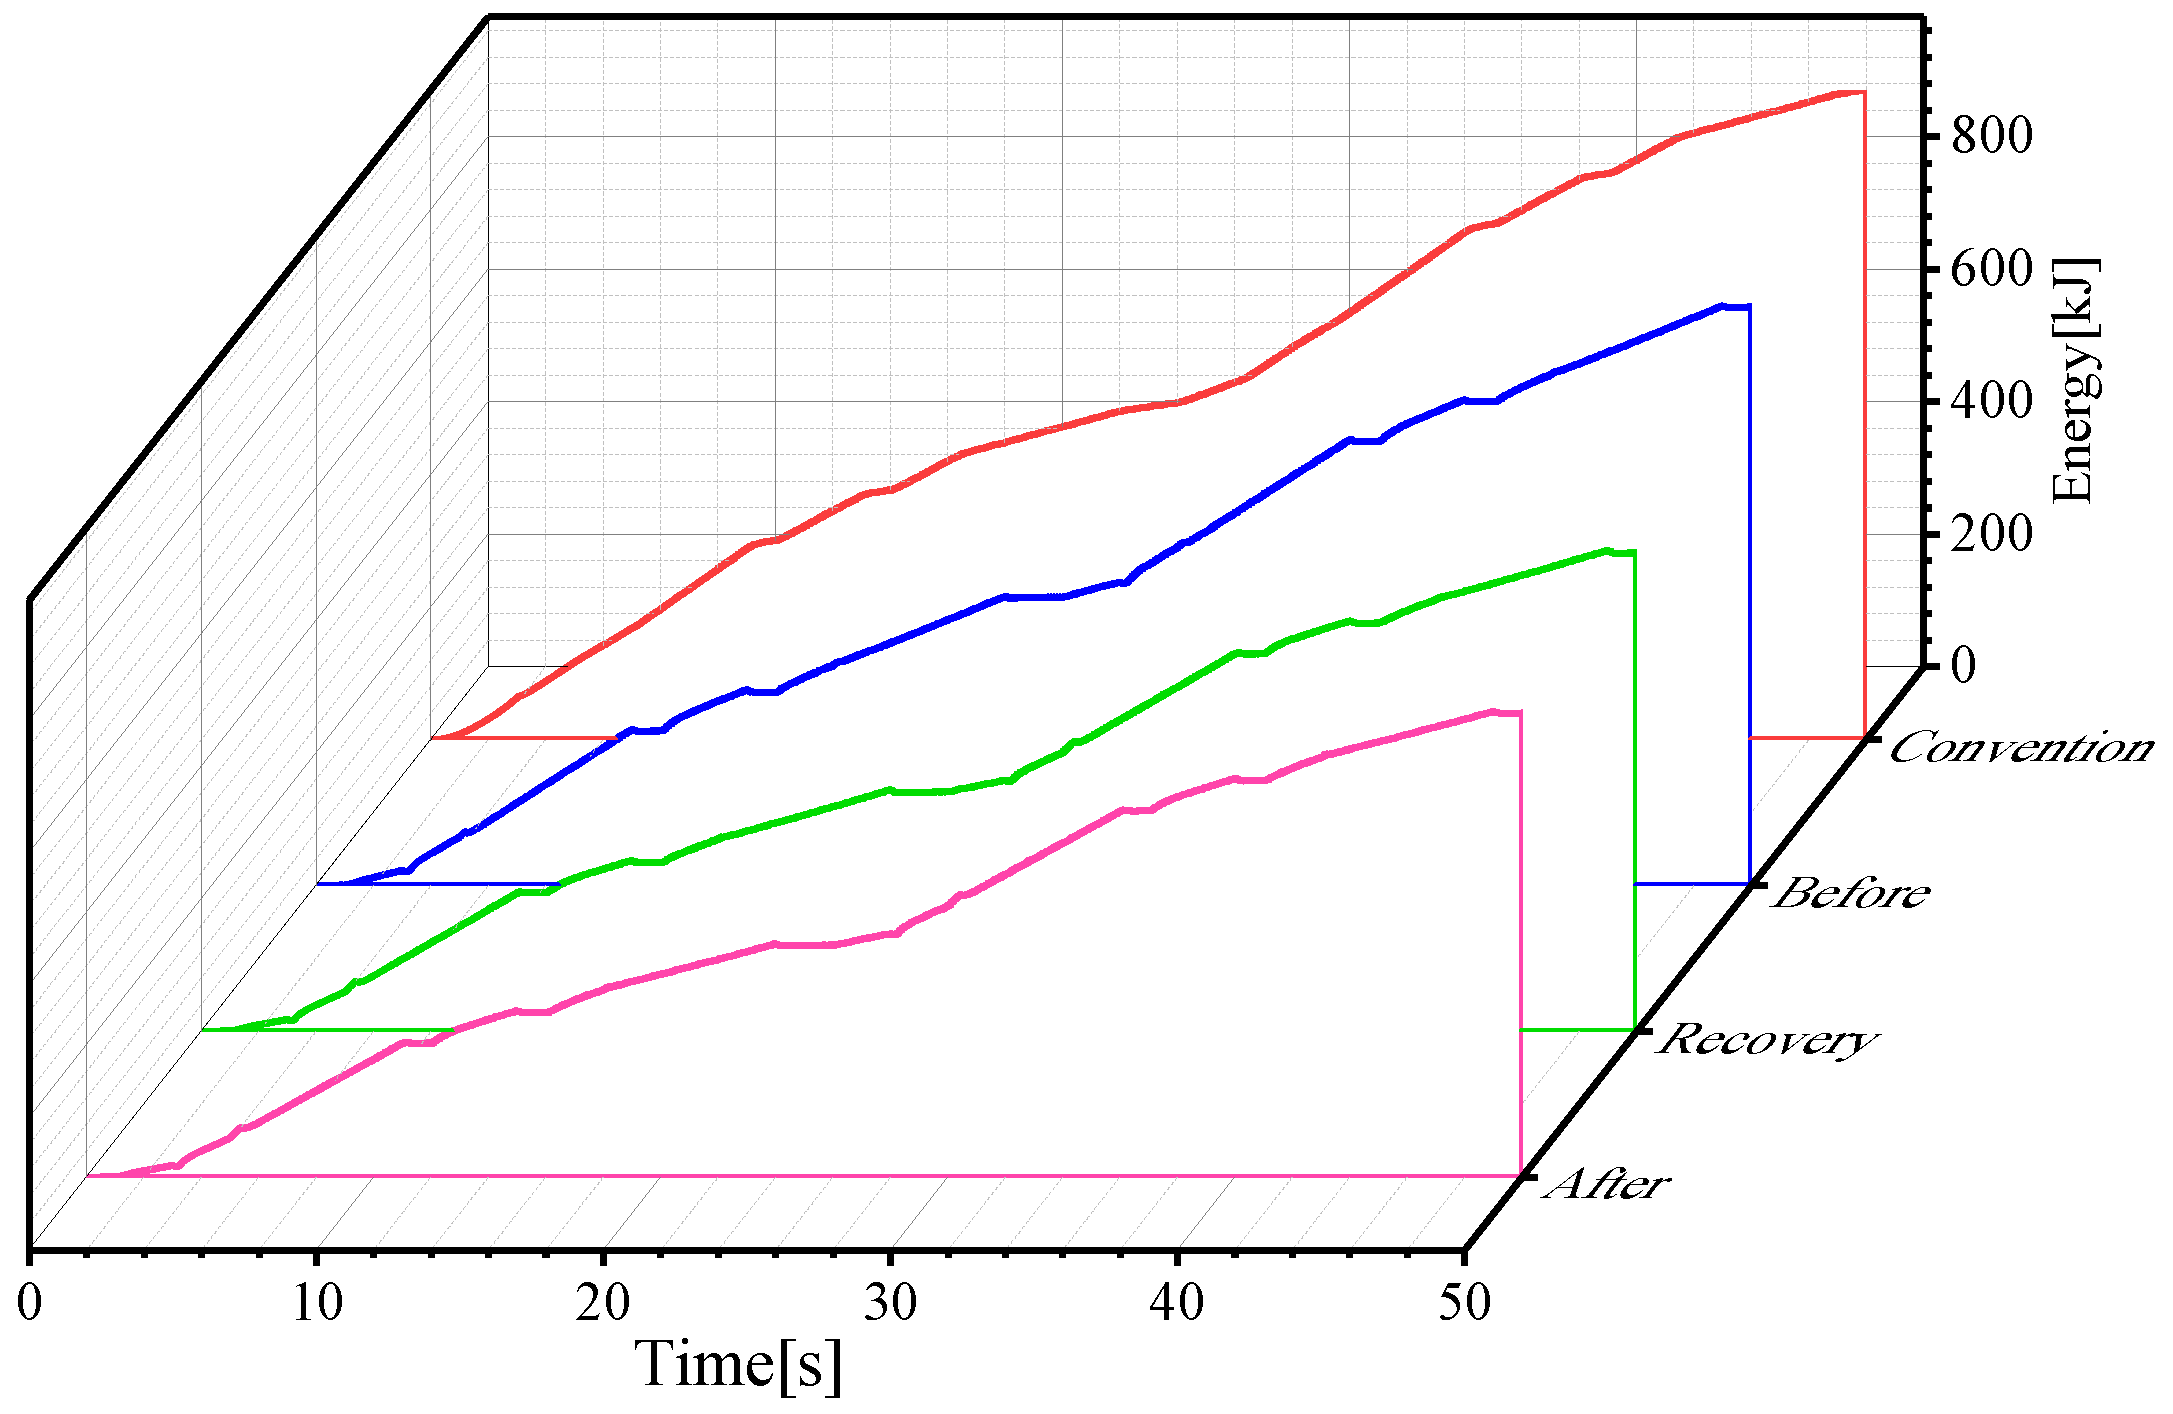
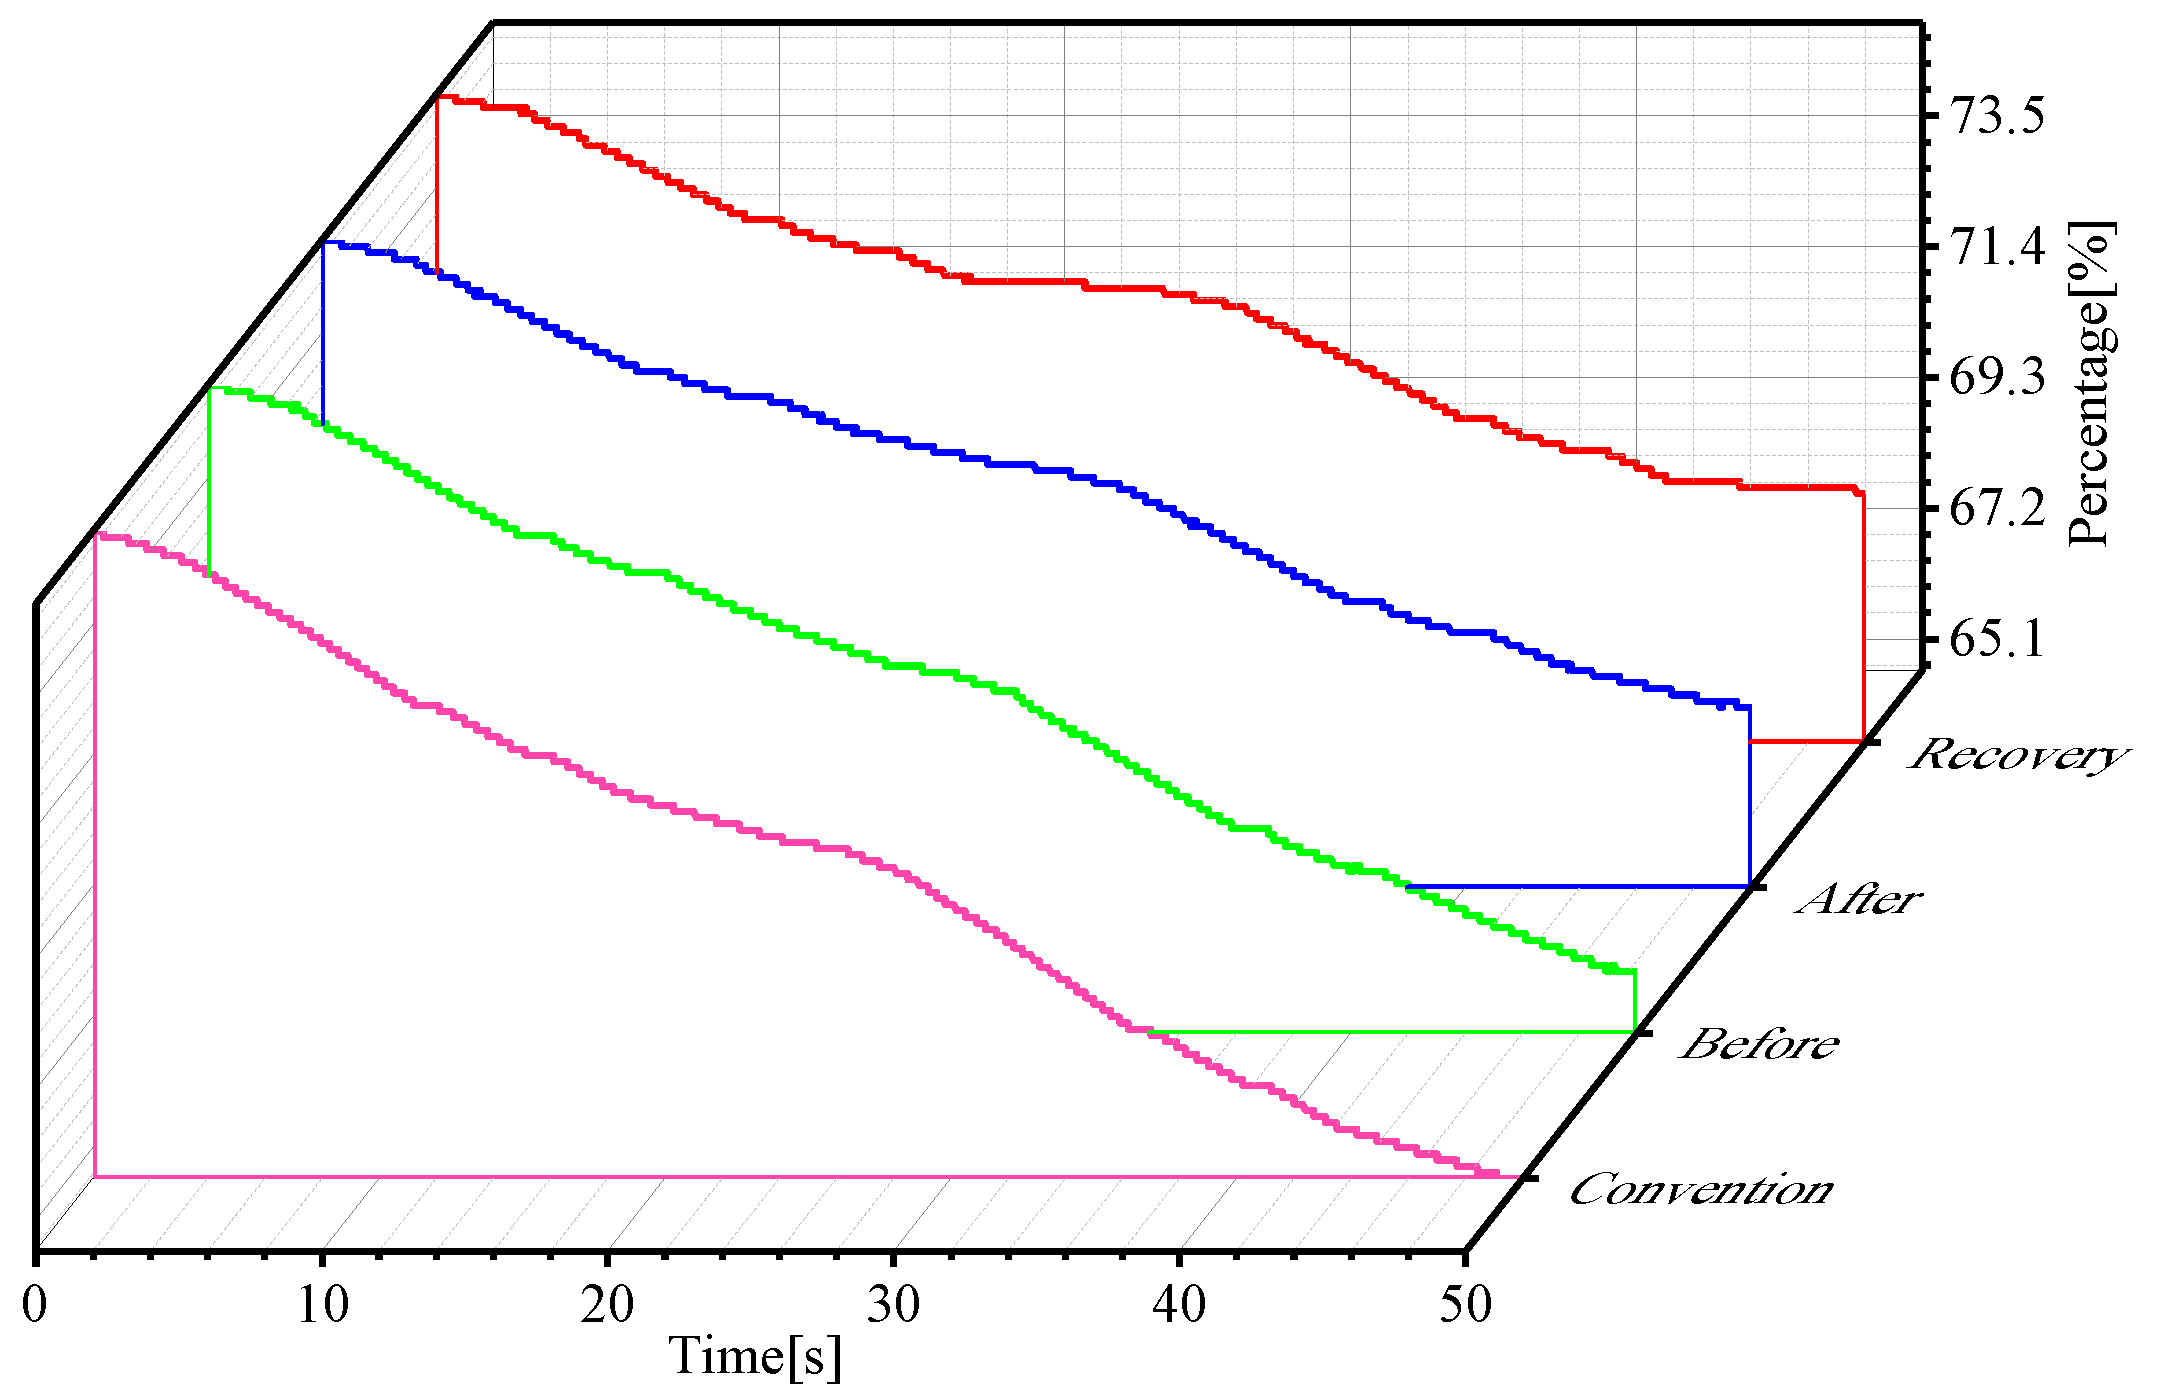
4.2.4. Analysis of the System Energy-Saving Performance

As shown in Figure 22, the total energy provided by the PMSM of the conventional system is 981.1 kJ, the before system is 873.4 kJ, the after system is 700.4 kJ, and the energy recovery system is 722.6 kJ after two working cycles. Because the speed of the conventional system of the PMSM is higher than the one before, after, and energy recovery systems, more energy is consumed under the same friction coefficient. It can be seen that the before system provides less energy by 11% than the conventional system under the guarantee of the functional performance of the boom and bucket cylinders, combined with the analysis in Section 4.2.1. The after system provides less energy by 28.6%. The energy recovery system provides less energy by 26.3%. The energy recovery system provides only 2.3% more energy than the after system due to the hydraulic motor–generator acting behind the multi-way valve and increasing the system load. In summary, the variable pressure margin control is feasible and can effectively reduce the system pressure loss, thus reducing the system energy loss. The energy recovery system has less impact on the variable pressure margin control. The before, after, and energy recovery systems are more energy-saving than the conventional system.
As shown in Figure 23, the supercapacitor SOC of the energy recovery system is 68.6%, the after system is 67.5%, the before system is 65.6%, and the conventional system is 64.6% after two operating cycles. Therefore, the supercapacitor SOC of the energy recovery system reduces by 6.4%, the after system reduces by 7.5%, the before reduces by 9.4%, and the conventional system reduces by 10.4%. Then, the energy consumption before the system is reduced by 9.6% than the conventional system, the after system is reduced by 27.9%, and the energy recovery system is reduced by 38.5%. The energy recovery system is more energy-saving than others due to the variable pressure margin control and energy recovery. In summary, the variable pressure margin energy recovery system is feasible and can effectively reduce energy consumption than the conventional, before, and after systems.

5. Discussion

A sensor-based variable pressure margin energy recovery system for the electric loader is constructed, modeled, and simulated based on the hydraulic system of the conventional electric loader actuator; it analyzes system energy consumption. The simulation results show that the variable pressure margin control and energy recovery can effectively reduce the energy consumption of the electric loader.
The system pressure loss is reduced by reducing the preset LS pressure margin, thus reducing the system energy consumption under the guarantee of the functional performance of the boom and bucket cylinders based on the above simulation results. The system simulation results are similar to [30] in that when the preset LS pressure margin is 10 bar, the motor energy supply is reduced by one-third of that when the pressure difference is 30 bar. In this paper, the PMSM energy supplies less energy by 17.6% due to the preset LS pressure margin being less under the guarantee of the functional performance of the boom and bucket cylinders. The system simulation results are similar to [31] in that the system’s energy consumption is reduced by 32.22% through the energy recovery of the boom cylinder. This paper proposes a method which reduces the system’s energy consumption by 38.5% due to the variable pressure margin control. A large amount of gravitational potential energy is recovered. The energy recovery system combines the advantages of the above references to reduce system energy consumption further.
The system optimizes the drive unit to reduce energy losses and recover potential energy. Therefore, it can be applied to electric construction machinery such as loaders, excavators, and forklifts to reduce system energy consumption and can be tested and studied later.

6. Conclusions

The working principle, control strategy, and mathematical and simulation model of the electric loader actuator’s variable pressure margin energy recovery system are analyzed. Some conclusions that can be obtained:
  • The energy recovery system’s transient performance is better than that of the conventional system.
  • The energy recovery system effectively reduces the cylinder displacement error and has better robustness than the conventional system when the bucket material mass changes.
  • The system has high energy recovery efficiency and good energy recovery performance, and the energy recovery efficiency is 65.4%.
  • The variable pressure margin control is feasible and can effectively reduce the system pressure loss, thus reducing the system energy loss. The energy recovery system has less impact on the variable pressure margin control. The before, after, and energy recovery systems are more energy-saving than the conventional system.
  • The variable pressure margin energy recovery system is feasible and can effectively reduce energy consumption than the conventional, before, and after systems.
  • The energy recovery system has high energy-saving performance, and the energy-saving efficiency is 38.5%.

Author Contributions

Conceptualization and methodology, H.M.; software, validation, and writing—original draft preparation, H.M. and Y.L. (Yu Luo); writing—review and editing, supervision, project administration and funding acquisition, Y.L. (Yanlei Luo), Y.L. (Yu Luo) and L.C. All authors have read and agreed to the published version of the manuscript.

Funding

Research is funded by the Key Topics of Teaching Reform of Postgraduate Education in Guizhou Province (YJSCXJH (2020) 006), Science and Technology Project of Guizhou Province (Qiankehe Foundation-ZK [2022] General 087), National Natural Science Foundation of China Project (52265007), the State Scholarship Fund of China (201906675018), and Fund project of Guizhou Provincial Education Department (Qianjiaohe Foundation-KY[2020]130).

Institutional Review Board Statement

Not applicable.

Informed Consent Statement

Not applicable.

Data Availability Statement

Data sharing is not applicable.

Acknowledgments

We would like to express our gratitude to the anonymous reviewers and friends who helped us in the process of completing this paper.

Conflicts of Interest

The authors declare no conflict of interest.

References

  1. Lin, T. Energy-Saving Technology and Application of Construction Machinery; China Machine Press: Beijing, China, 2018. [Google Scholar]
  2. Lin, Y.; Lin, T.; Chen, Q.; Li, Z.; Fu, S.; Ren, H.; Guo, T. Research Progress on Key Technologies of Electric Construction Machinery. Chin. Hydraul. Pneum. 2021, 45, 1. [Google Scholar]
  3. Fan, Z.; Tao, P.; Dan, H.; Lin, J.; Mei, S. Modulated model predictive control of permanent magnet synchronous motor. In Proceedings of the 2018 IEEE International Conference on Industrial Electronics for Sustainable Energy Systems (IESES), Hamilton, New Zealand, 31 January–2 February 2018. [Google Scholar]
  4. Qin, D. Research and implementation of PMSM-DTC system. Master’s Thesis, Anhui University of Science and Technology, Anhui, China, 2018. [Google Scholar]
  5. Shi, Y.; Xu, S.; Sun, Z.; Nie, Y.; Wang, Y. Research on the Pressure Regulator Effect on a Pneumatic Vibration Isolation System. Chin. J. Mech. Eng. 2022, 35, 128. [Google Scholar] [CrossRef]
  6. Shi, Y.; Chang, J.; Wang, Y.; Zhao, X.; Zhang, Q.; Yang, L. Gas Leakage Detection and Pressure Difference Identification by Asymmetric Differential Pressure Method. Chin. J. Mech. Eng. 2022, 35, 44. [Google Scholar] [CrossRef]
  7. Chakraboity, A.K.; Sliamia, N. Control of permanent magnet synchronous motor (PMSM) using vector control approach. In Proceedings of the 2016 IEEE/PES Transmission and Distribution Conference and Exposition (T&D), Morelia, Mexico, 3–5 May 2016. [Google Scholar]
  8. Cao, B. Study on Dynamic Power Matching and Energy-saving Control Technology of Loaders with Bi-variable Hydraulic System. Ph.D. Thesis, Jilin University, Jilin, China, 2020. [Google Scholar]
  9. Yuan, S.; Yin, C.; Liu, S. Performance analysis of machinery load sensitive quantitative pump system. Trans. Chin. Soc. Agric. Eng. 2013, 29, 38–45. [Google Scholar]
  10. Pedersen, H.C.; Andersen, T.O.; Hansen, M.R. Load Sensing Systems—A Review of the Research Contributions Throughout the Last Decades. In Proceedings of the 4th IFK Workshop, Dresden, Germany, 25–26 March 2004; pp. 125–139. [Google Scholar]
  11. Vukovic, M.; Leifeld, R.; Murrenhoff, H. Reducing fuel consumption in hydraulic excavators—A comprehensive analysis. Energies 2017, 10, 687. [Google Scholar] [CrossRef] [Green Version]
  12. Cheng, M.; Zhang, J.; Xu, B.; Ding, R. An Electrohydraulic Load Sensing System based on flow/pressure switched control for mobile machinery. Isa Trans. 2020, 96, 367–375. [Google Scholar] [CrossRef] [PubMed]
  13. Luo, S.; Cheng, M.; Ding, R.; Wang, F.; Xu, B.; Chen, B. Human–Robot Shared Control Based on Locally Weighted Intent Prediction for a Teleoperated Hydraulic Manipulator System. IEEE/ASME Trans. Mechatron. 2022. Early Access. [Google Scholar] [CrossRef]
  14. Na, W.; Qing, L.; Yan, S.; Shi, W.; Xian, Z.; Cheng, H.; Xun, J. Modeling and Simulation of an Invasive Mild Hypothermic Blood Cooling System. Chin. J. Mech. Eng. 2021, 34, 23. [Google Scholar]
  15. Zhang, F.; Zhang, J.; Cheng, M.; Xu, B. A Flow-Limited Rate Control Scheme for the Master–Slave Hydraulic Manipulator. IEEE Trans. Ind. Electron. 2021, 69, 4988–4998. [Google Scholar] [CrossRef]
  16. Fu, S.; Lin, T.; Wang, L.; Liao, C. Load Sensitive System Based on Variable Speed Control. China J. Highw. Transp. 2020, 33, 189. [Google Scholar]
  17. Madau, R.; Vacca, A.; Pintore, F. Energy Saving on a Full-Size Wheel Loader Through Variable Load Sense Margin Control. J. Dyn. Systems. Meas. Control 2022, 144, 031003. [Google Scholar] [CrossRef]
  18. Chen, Q.; Lin, T.; Ren, H.; Fu, S. Novel potential energy regeneration systems for hybrid hydraulic excavators. Math. Comput. Simul. (MATCOM) 2019, 163, 130–145. [Google Scholar] [CrossRef]
  19. Feng, J. Research on Characteristics of Three-chamber Hydraulic Cylinder Driving Loader Boom. Master’s Thesis, Taiyuan University of Technology, Taiyuan, China, 2019. [Google Scholar]
  20. Li, L.; Zhang, T.; Wu, K.; Lu, L.; Lin, L.; Xu, H. Design and Research on Electro-Hydraulic Drive and Energy Recovery System of the Electric Excavator Boom. Energies 2022, 15, 4757. [Google Scholar] [CrossRef]
  21. Wang, C. Research on Hybrid Pressure Compensated Hydraulic Control System. Master’s Thesis, Guizhou University, Guiyang, China, 2021. [Google Scholar]
  22. Wang, T. Study on Boom Energy Recovery Element and System of Hybrid Excavator. Ph.D. Thesis, Zhejiang University, Hangzhou, China, 2013. [Google Scholar]
  23. Zhang, X.; Wang, X.; Zhang, H.; Quan, L. Characteristics of Wheel Loader Lifting Device Based on Closed Pump-controlled Three-chamber Hydraulic Cylinder. Trans. Chin. Soc. Agric. Eng. 2019, 50, 410–418. [Google Scholar]
  24. Lin, T. Research on the Potential Energy Recovery System Based on the Hybrid Hydraulic Excavator. Ph.D. Thesis, Zhejiang University, Hangzhou, China, 2011. [Google Scholar]
  25. Wu, S.; Wang, W.; Wang, H.; Yuan, J. Study on hybrid energy storage control strategy based on quadratic exponential smoothing. Mod. Electron. Tech. 2022, 45, 133–138. [Google Scholar]
  26. Wei, X. Research on Dual-variable Control Algorithm of Electro-hydrostatic Actuator. Master’s Thesis, Beijing Jiaotong University, Beijing, China, 2020. [Google Scholar]
  27. Liu, X. Study on Energy characteristics of Working Device Hydraulic System for 50-type Loaders. Master’s Thesis, Jilin University, Changchun, China, 2017. [Google Scholar]
  28. Wang, K. The Working Characteristics and Energy Consumption Analysis of the 50 Wheel loader’s Hydraulic System. Master’s Thesis, Jilin University, Changchun, China, 2011. [Google Scholar]
  29. Luo, K. Simulation model and test verification of loader working device and its electro-hydraulic control system. Master’s Thesis, Zhejiang University, Hangzhou, China, 2020. [Google Scholar]
  30. Fu, S.; Wang, L.; Lin, T. Control of electric drive powertrain based on variable speed control in construction machinery. Autom. Constr. 2020, 119, 103281. [Google Scholar] [CrossRef]
  31. Chi, B. Analysis of Energy Recovery System for Electric Excavator. Hydraul. Pneum. Seals 2022, 42, 56–61. [Google Scholar]
Figure 1. Principle diagram of the hydraulic system of the conventional electric loader actuator. 1. LS pump 2. PMSM 3. Inverter 4. Supercapacitor 5.1–5.2. Pressure compensation valve 6. Shuttle valve 7. Boom multi-way valve 8. Bucket multi-way valve 9.1–9.3. One-way relief valve 10. Bucket cylinder 11.1–11.2. Boom cylinder 12. Filter 13. Relief valve 14. Tank.
Electronics 11 04215 g001
Figure 2. Schematic diagram of the hydraulic system of the new electric loader actuator. 1. Quantitative pump 2.1–2.2. PMSM 3.1–3.2. Inverter 4. Supercapacitor 5.1–5.2. Solenoid pressure compensation valve 6. Relief valve 7. Boom multi-way valve 8. Bucket multi-way valve 9. Reversing valve 10. Bucket cylinder 11.1–11.2. Boom cylinder 12. Hydraulic motor 13.1–13.7. Pressure sensor 14. Tank.
Electronics 11 04215 g002
Figure 3. Closed-loop control block diagram of the system.
Electronics 11 04215 g003
Figure 4. Block diagram of the closed-loop control of the energy recovery system.
Electronics 11 04215 g004
Figure 5. Principle diagram of the actuator.
Electronics 11 04215 g005
Figure 6. Equivalent schematic of the supercapacitor.
Electronics 11 04215 g006
Figure 7. Equivalent schematic of the PMSM in the ABC coordinate system.
Electronics 11 04215 g007
Figure 8. Equivalent schematic of the PMSM in the DQ coordinate system.
Electronics 11 04215 g008
Figure 9. Control principle schematic of the PMSM.
Electronics 11 04215 g009
Figure 10. Four-quadrant schematic of the PMSM.
Electronics 11 04215 g010
Figure 11. Simulation model of the PMSM.
Electronics 11 04215 g011
Figure 12. PMSM in the I and III quadrants.
Electronics 11 04215 g012aElectronics 11 04215 g012b
Figure 13. PMSM in the II and IV quadrants.
Electronics 11 04215 g013
Figure 14. AMESim simulation model of the system.
Electronics 11 04215 g014
Figure 15. Control signal of the cylinders.
Electronics 11 04215 g015
Figure 16. Cylinder displacement curves.
Electronics 11 04215 g016
Figure 17. Cylinder displacement curves.
Electronics 11 04215 g017
Figure 18. Cylinder displacement error curves when material mass is 1 t and 2 t.
Electronics 11 04215 g018aElectronics 11 04215 g018b
Figure 19. System energy recovery power curves.
Electronics 11 04215 g019
Figure 20. System energy recovery curves.
Electronics 11 04215 g020
Figure 21. System energy loss diagram.
Electronics 11 04215 g021
Figure 22. PMSM energy supply curves.
Electronics 11 04215 g022
Figure 23. Supercapacitor SOC curves.
Electronics 11 04215 g023
Table 1. Simulation parameter settings.
ComponentsName of ParametersValue
PMSMRated speed2000 rev/min
Efficiency95%
Quantitative pumpDisplacement150 cm3/rev
Efficiency90%
Boom cylinderThe diameter of piston0.165 m
The diameter of rod0.08 m
The length of stroke0.757 m
Bucket cylinderThe diameter of piston0.2 m
The diameter of rod0.1 m
The length of stroke0.54 m
BucketMass1433.8 kg
Pressure compensation valvePressure range10~15 bar
LSPressure range20~25 bar
Energy recovery systemPreset differential pressure1 bar
Multi-way valveValve rated current40 mA
Valve natural frequency80 Hz
Hydraulic motorDisplacement100 mL/rev
Efficiency90%
SupercapacitorOpen circuit Voltage375 V
Capacitance40 F
Initial charge18,000 C
Maximum charge24,000 C
Relief valvePreset pressure170 bar
Publisher’s Note: MDPI stays neutral with regard to jurisdictional claims in published maps and institutional affiliations.

