1. Introduction
Radio interference has been confirmed as one of the most important issues currently affecting the performance of analog FM radio services in Cyprus [
1,
2]. The interference is seasonal and is caused by numerous analog radio signals that broadcast from the Middle East in Band II (87.5–108 MHz). Although VHF radio waves propagate only under line of sight conditions, when the ambient temperature is high, i.e., at the end of spring but mainly during the summer months, numerous very strong Middle Eastern FM radio signals can be monitored along the southern coast of the island. As a result, these signals interfere with the local radio services in Cyprus. This problem is very crucial because it not only causes very poor reception quality among listeners but many times results in a complete loss of the desired signal. It is worth noting that in the past decades, the local terrestrial analog TV services, which were broadcast in VHF/UHF bands, have also encountered very serious reception problems due to unwanted signals from the Middle East. Initially, in order to overcome the problem, the Cyprus government has recommended that the radio and TV broadcasters install FM and TV translators in areas where the problem of interference was very acute such as, for example, on the southern coast of the island along the highway. However, the introduction of additional transmitting units is an expensive solution. Further, these units occupy extra bandwidth at new frequencies, due to which the commercial band FM has already been saturated for years. In this respect, following the EU regulation, analog TV services have been upgraded to DVB-T since 2012, where the situation regarding interference has improved dramatically. Because the cause of interference created very serious problems for the local radio industry, various attempts to solve the problem have been proposed over the years. In this respect, the Cyprus government is now planning to upgrade the FM analog radio to DAB, DAB+ attempting to solve the problem permanently. To release additional spectrum for other new radio services in Cyprus as well. However, a serious concern is the extent by which new digital radio will be affected by unwanted signals. Beyond indoor reception, it is very crucial considering the highway along the coast, where the Tropospheric Ducting interference affects the in-vehicle radio receivers while driving. This serious problem has not yet been solved till today. It is worth stating that the problem of interference may not be appeared on digital receivers immediately after the switchover in Cyprus since no other DAB services are broadcasting in the region to cause interference. Therefore, the pre-mentioned will become very important in the coming years when the Easter Mediterranean region will adopt DAB, DAB+ radio technology broadcast on the same spectrum as the local services in Cyprus, i.e., as is the case with FM Radio at present. Thus, sudden reception problems may appear if the DAB and DAB+ broadcast networks’ specifications are insufficient.
However, digital radio has neither been launched in Cyprus yet, nor in the region, thus, real-time measurements of the unwanted signals could not be conducted in order to model the future interference in band III. Thus, the novelty of this research lies in the fact that by extending a previous investigation that was conducted as a part of Antonios Constantinides Doctorate research on the analysis of refraction interference in the Eastern Mediterranean, it has been possible to simulate the field strength variations of the future overseas DAB and DAB+ radio reception in band III as received in Cyprus from the Middle East based on specific atmospheric conditions. This can be achieved by utilizing as a reference the measurements of two overseas signals, broadcast in Band II from the Middle East, and could be received on clear frequencies (without interference from local channels) along the southern coast of Cyprus with very high field strength intensity during the summer months of 2015. These measurements, which have been obtained in Band II, can then be converted to an interference model in band III and be applied to DAB and DAB+ propagation characteristics as it is discussed later.
The paper’s outline is given as follows: A brief overview of the technical characteristics of DAB and DAB+, which concerns this paper, are discussed in
Section 2. The reception’s location and equipment, which monitored the unwanted signals, are described in
Section 3. The measurements and free space path loss calculations of the unwanted monitored signals are computed in
Section 4. The analysis of the overseas signals and investigation of the abnormal propagation mechanism that causes the interference is analyzed in depth in
Section 5. Finally, the results of the study regarding the performance of DAB and DAB+ under interference conditions along the southern coast of Cyprus are demonstrated in
Section 6.
4. Discussion of Measurements
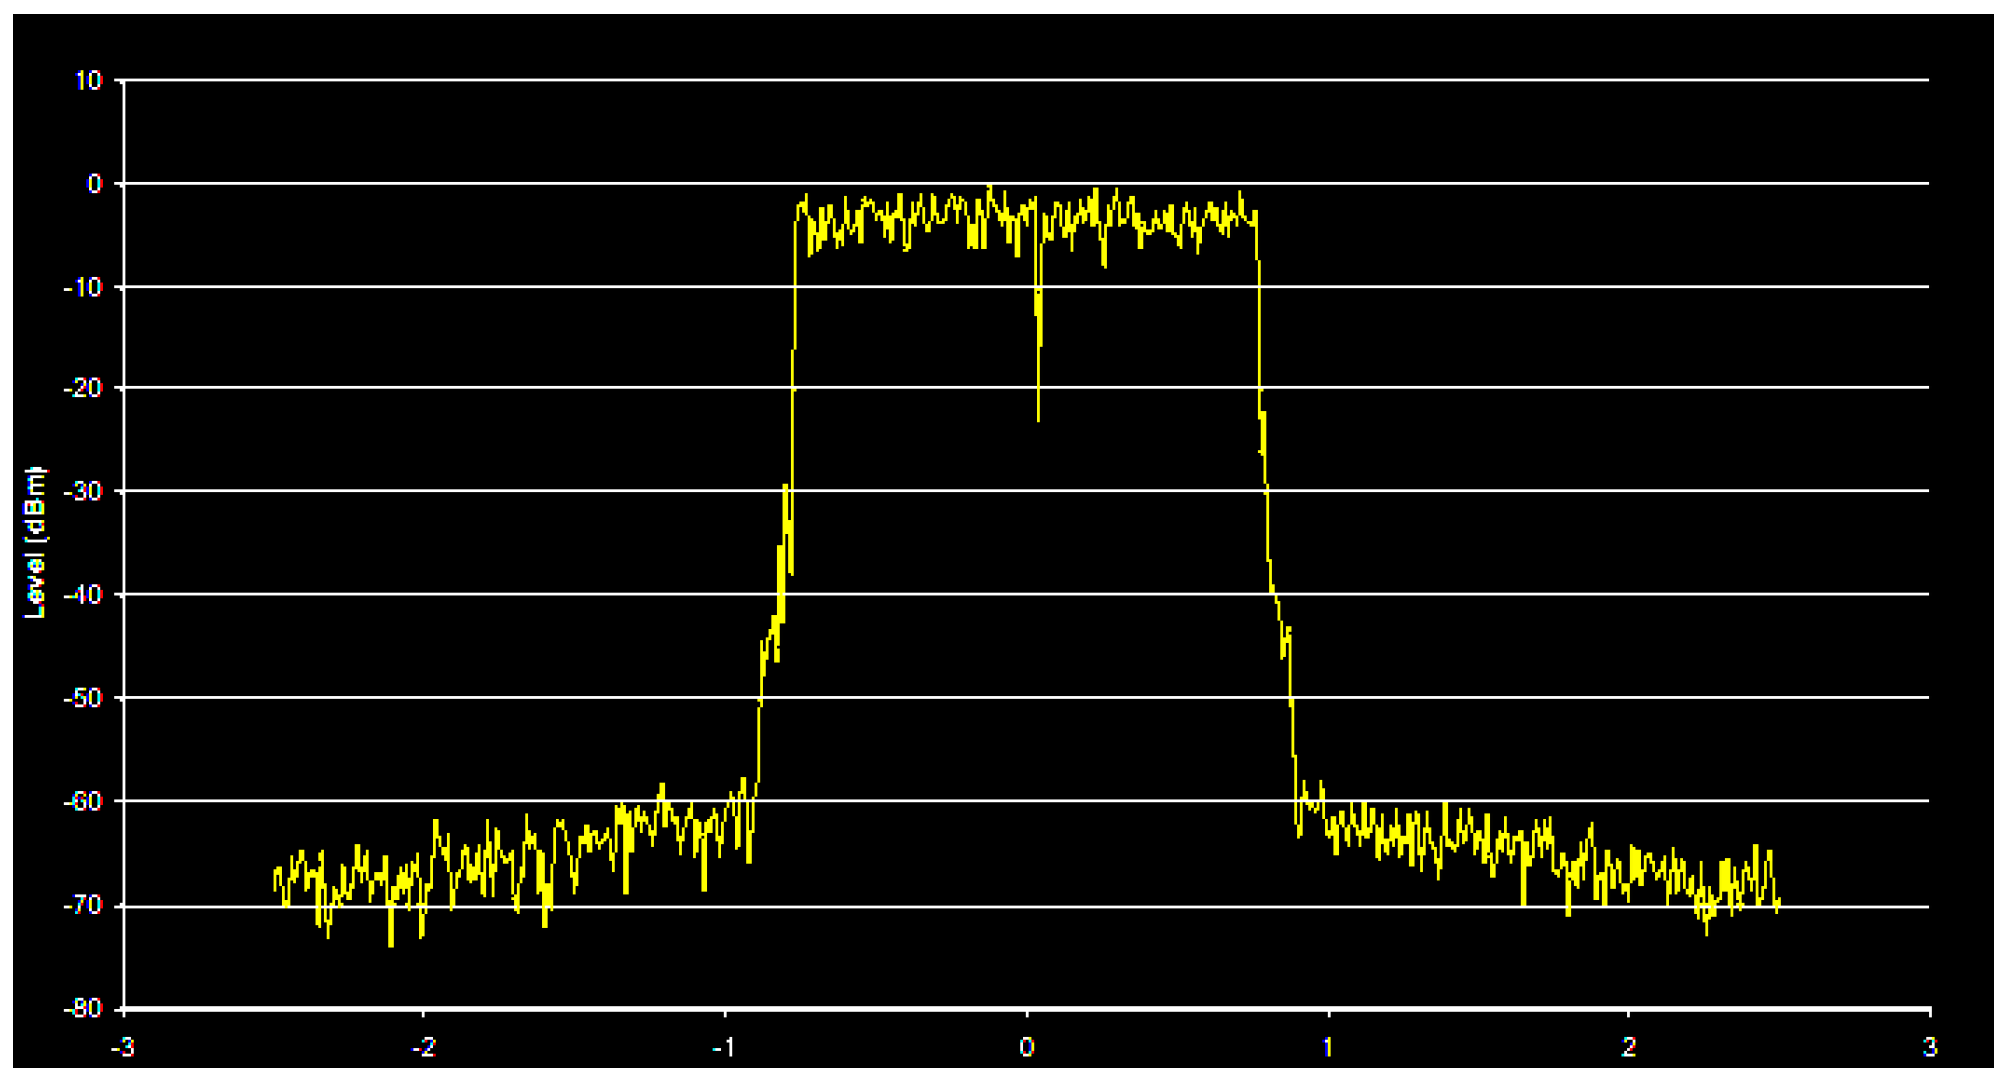
This section discusses the spectrum analyzer readings of the field strength variations in the two overseas FM transmissions under study. As can be justified later, these two overseas radio services could cause co-channel interference to the local radio services along the Southern coast of Cyprus. Their technical characteristics are illustrated in
Table 1 below.
The mentioned overseas transmissions were broadcast from Israel on 95.5 MHz and Lebanon on 102.5 MHz. The national radio CYBC signal was also monitored because it was constituted as a reference for the other local radio services in Cyprus. Both discussed overseas signals, which had been monitored in Limassol, were evaluated as follows. According to the measurements, both signals’ field strength intensities were not stable, as illustrated in
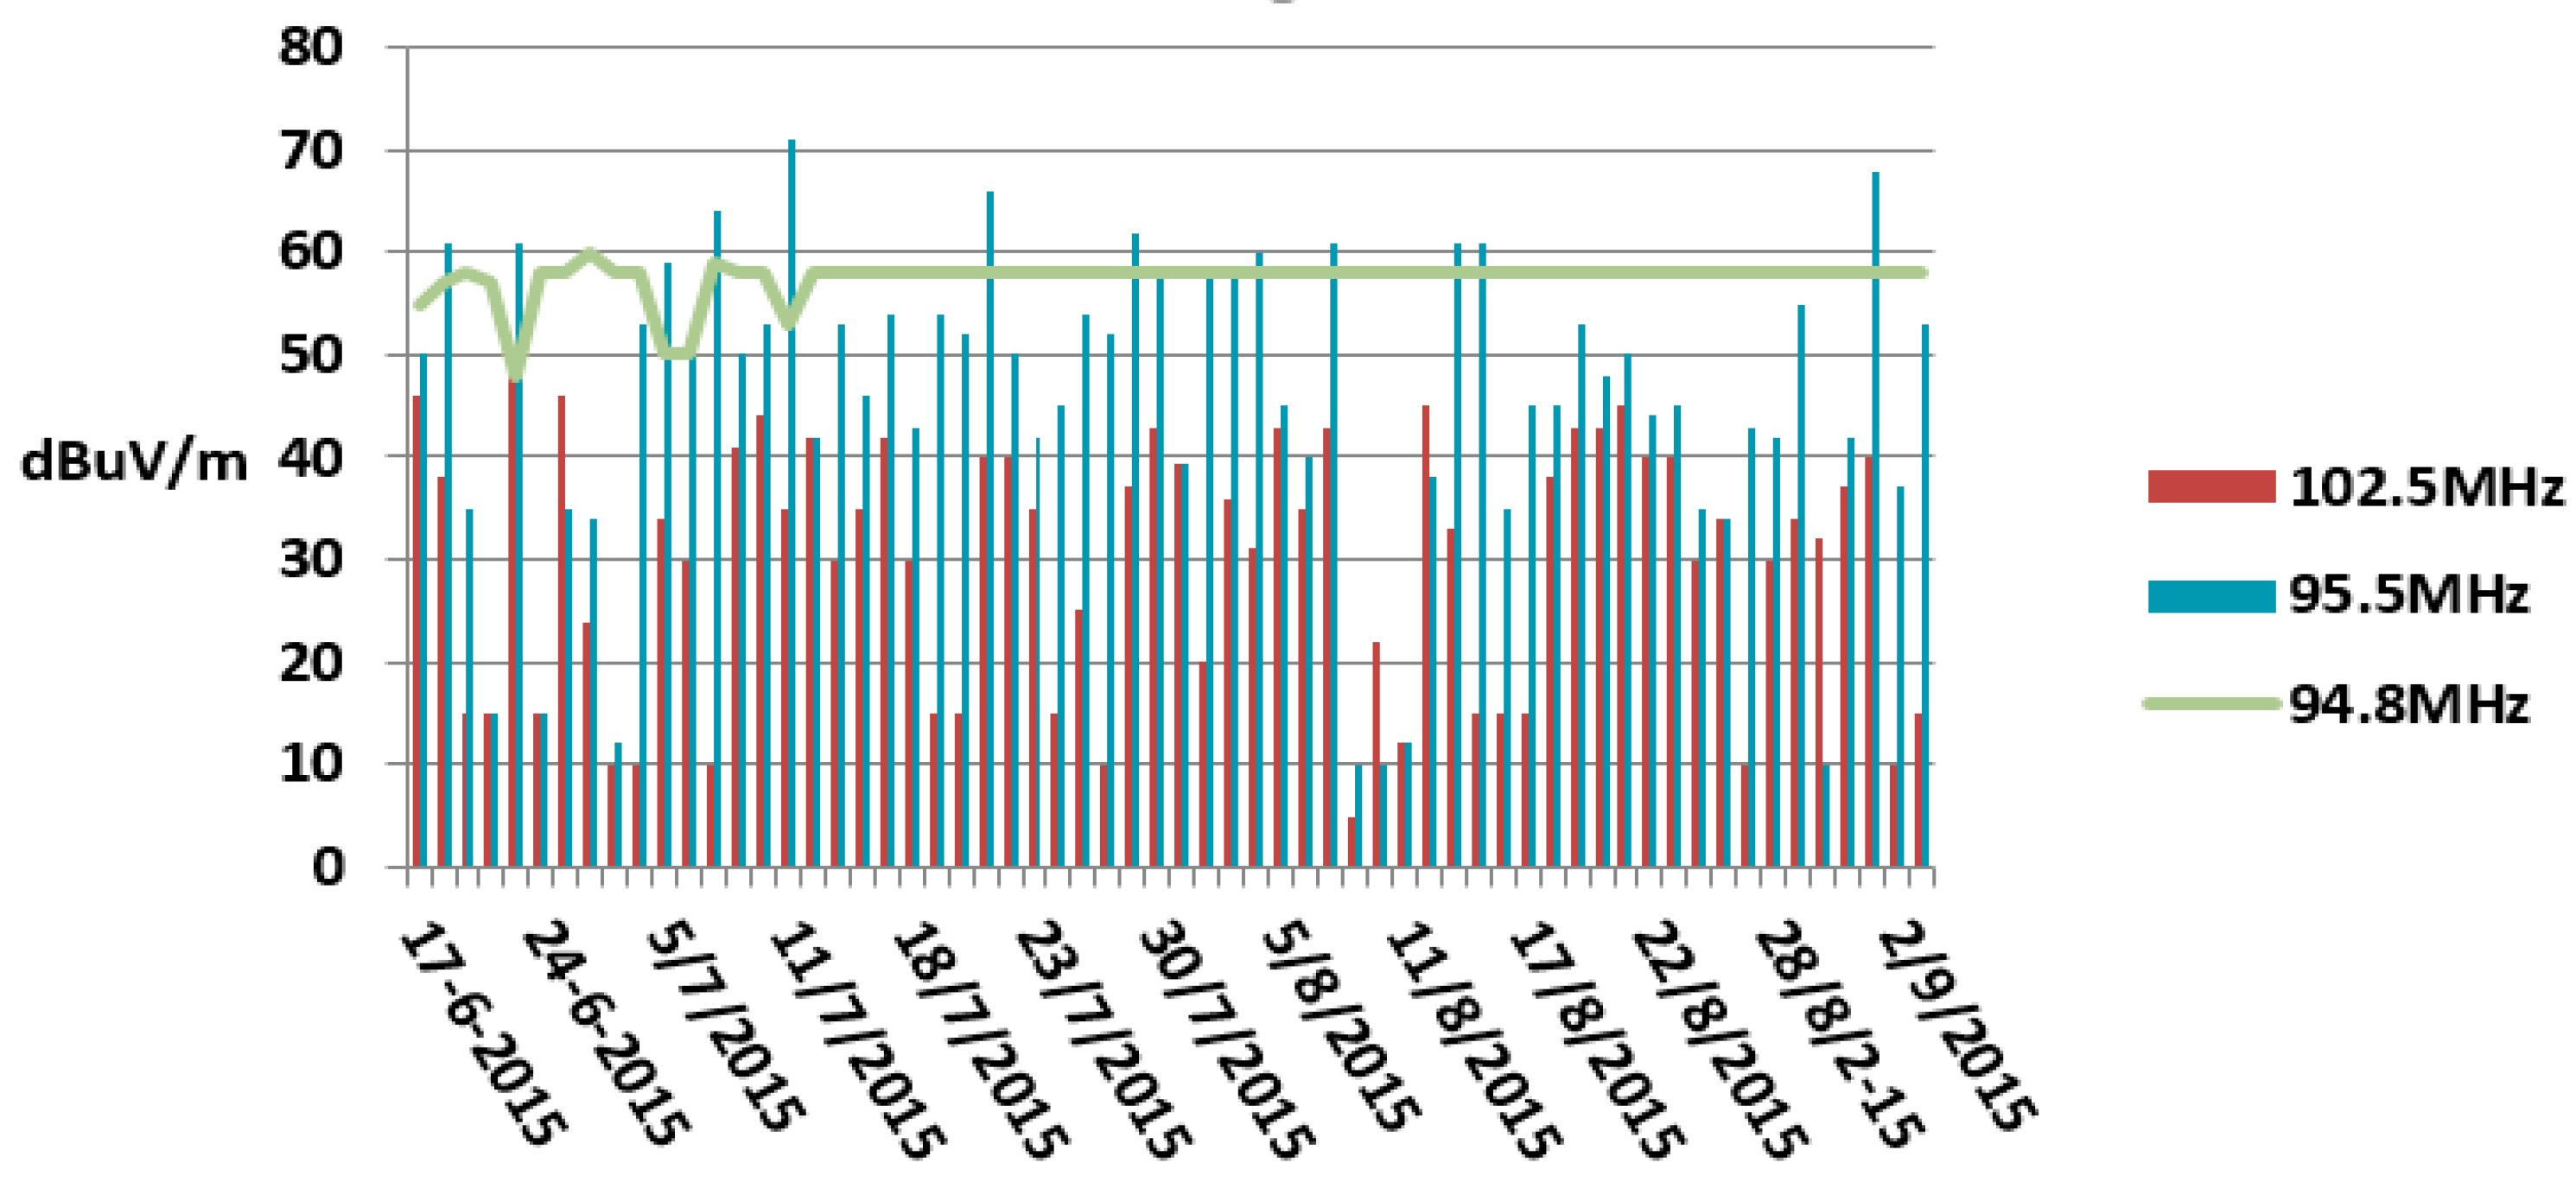
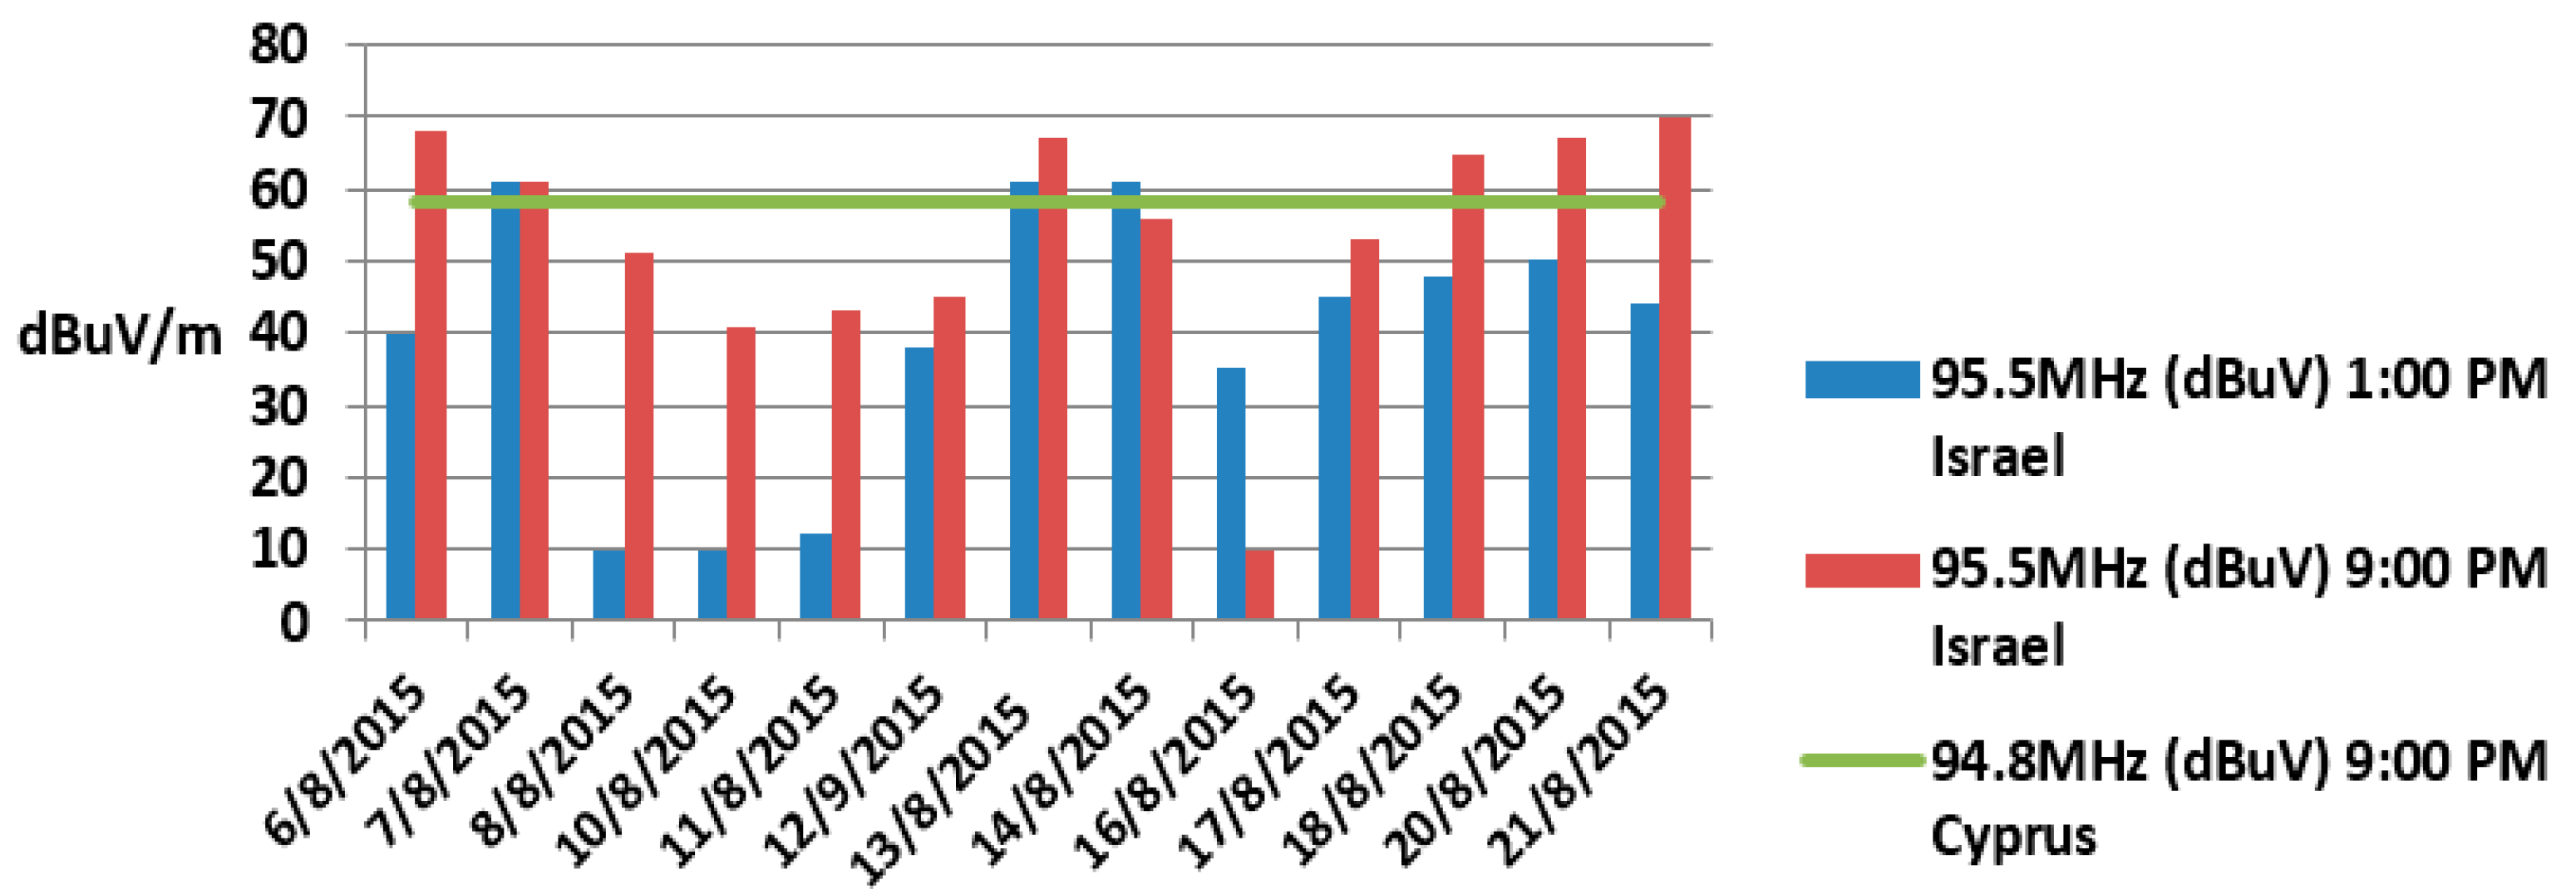
Figure 3. Particularly, their field strength intensity varied with the month, day and time of the reception, as illustrated in
Figure 4 and
Figure 5. As concerns the national radio CYBC, its signal strength was stable as expected. The spectrum analyzer readings revealed that the worst scenario occurred when an unwanted signal’s field strength intensity could be stronger than that of the local services for a period of time enough to interrupt the reception of indoor, portable, but especially in-vehicle radio receivers.
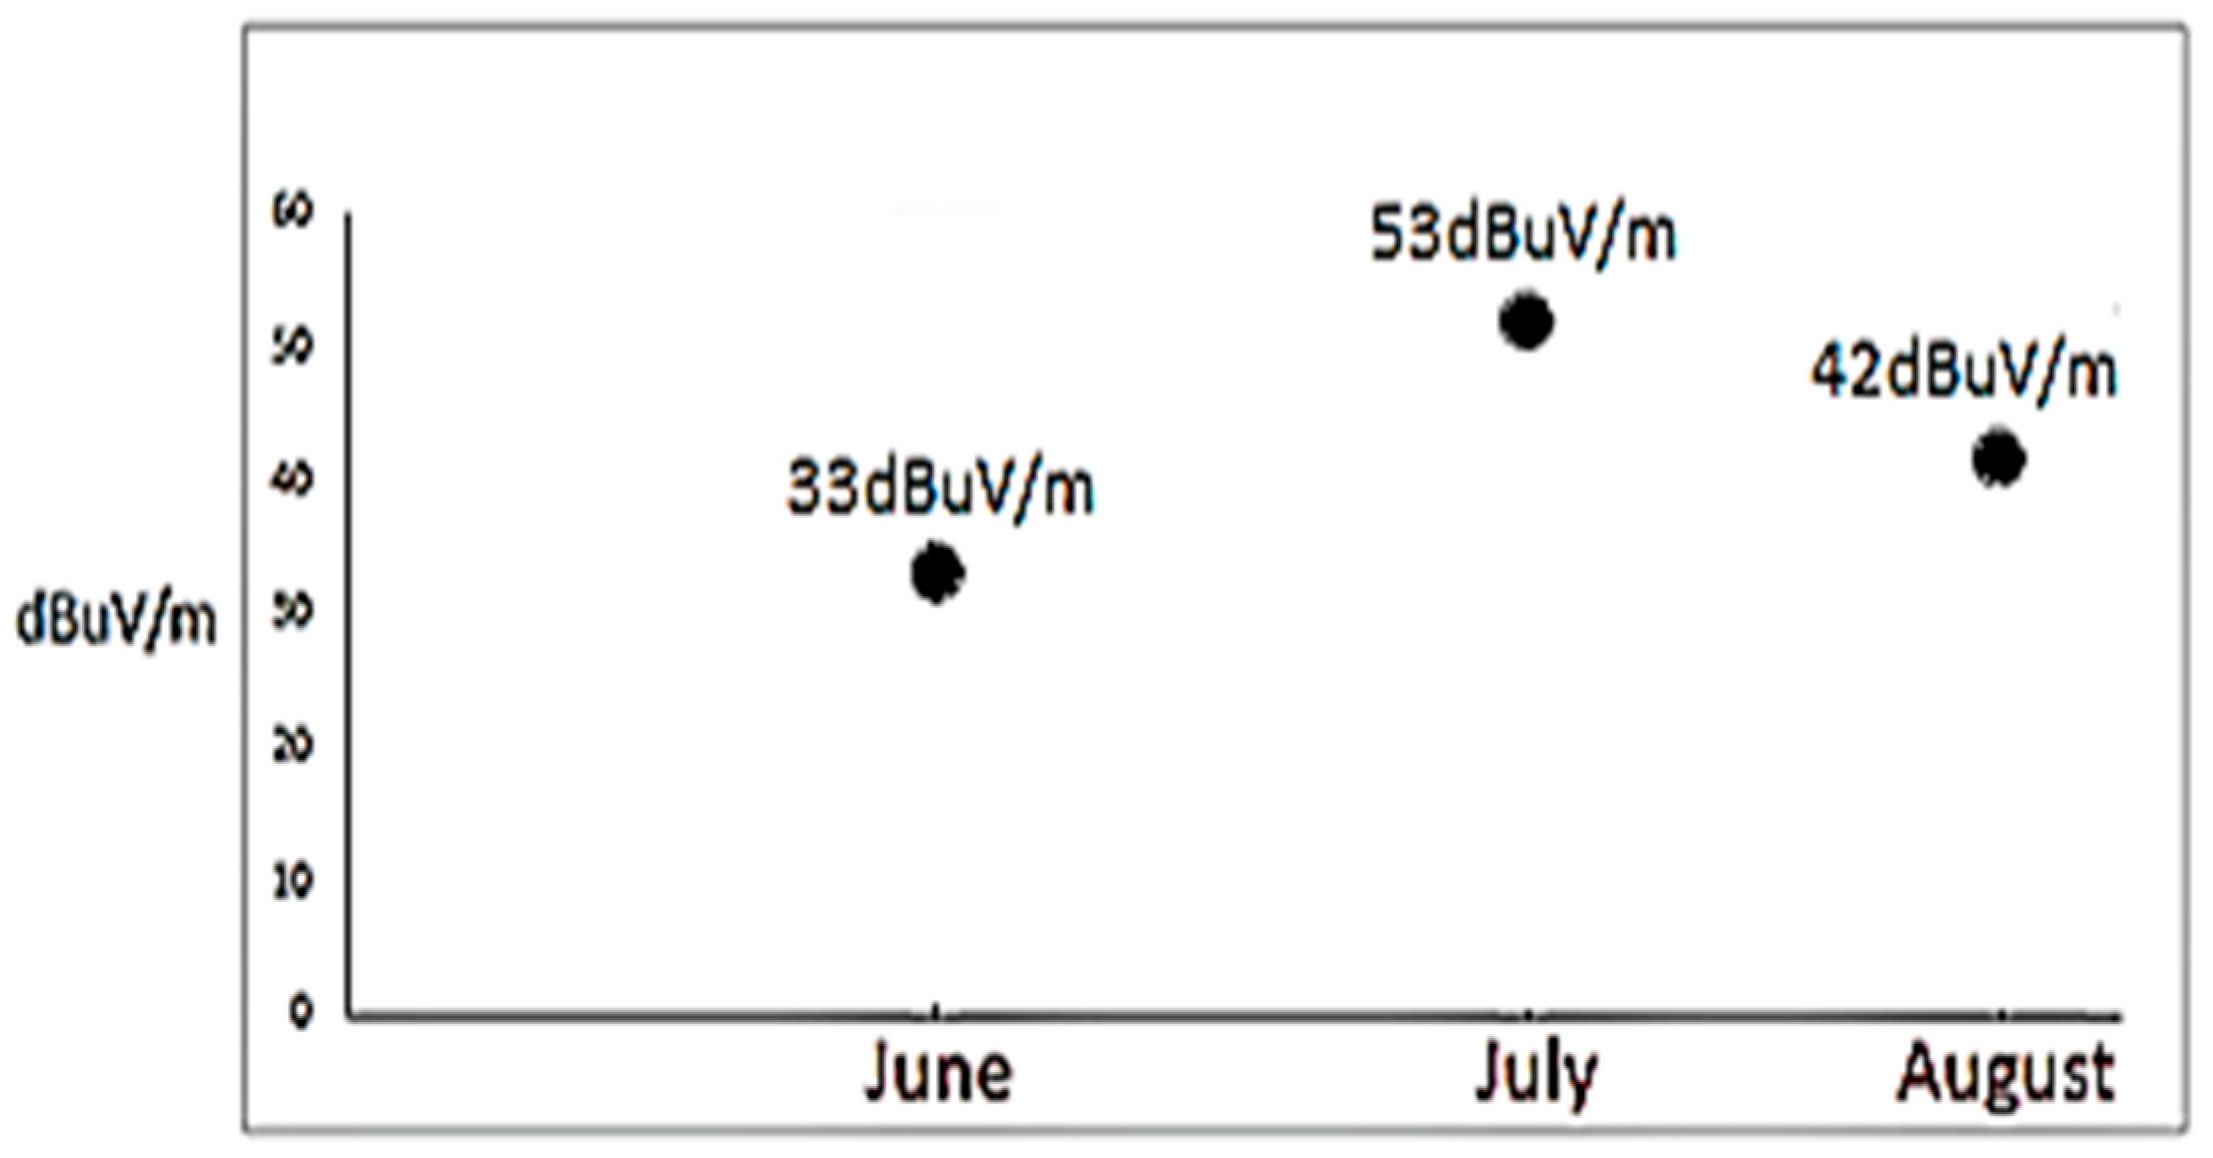
Due to the fact that the interference is seasonal, the average field strength intensity per month has been computed as follows. The field strength’s mean value of the unwanted signal 95.5 MHz recorded during the summer months is shown in
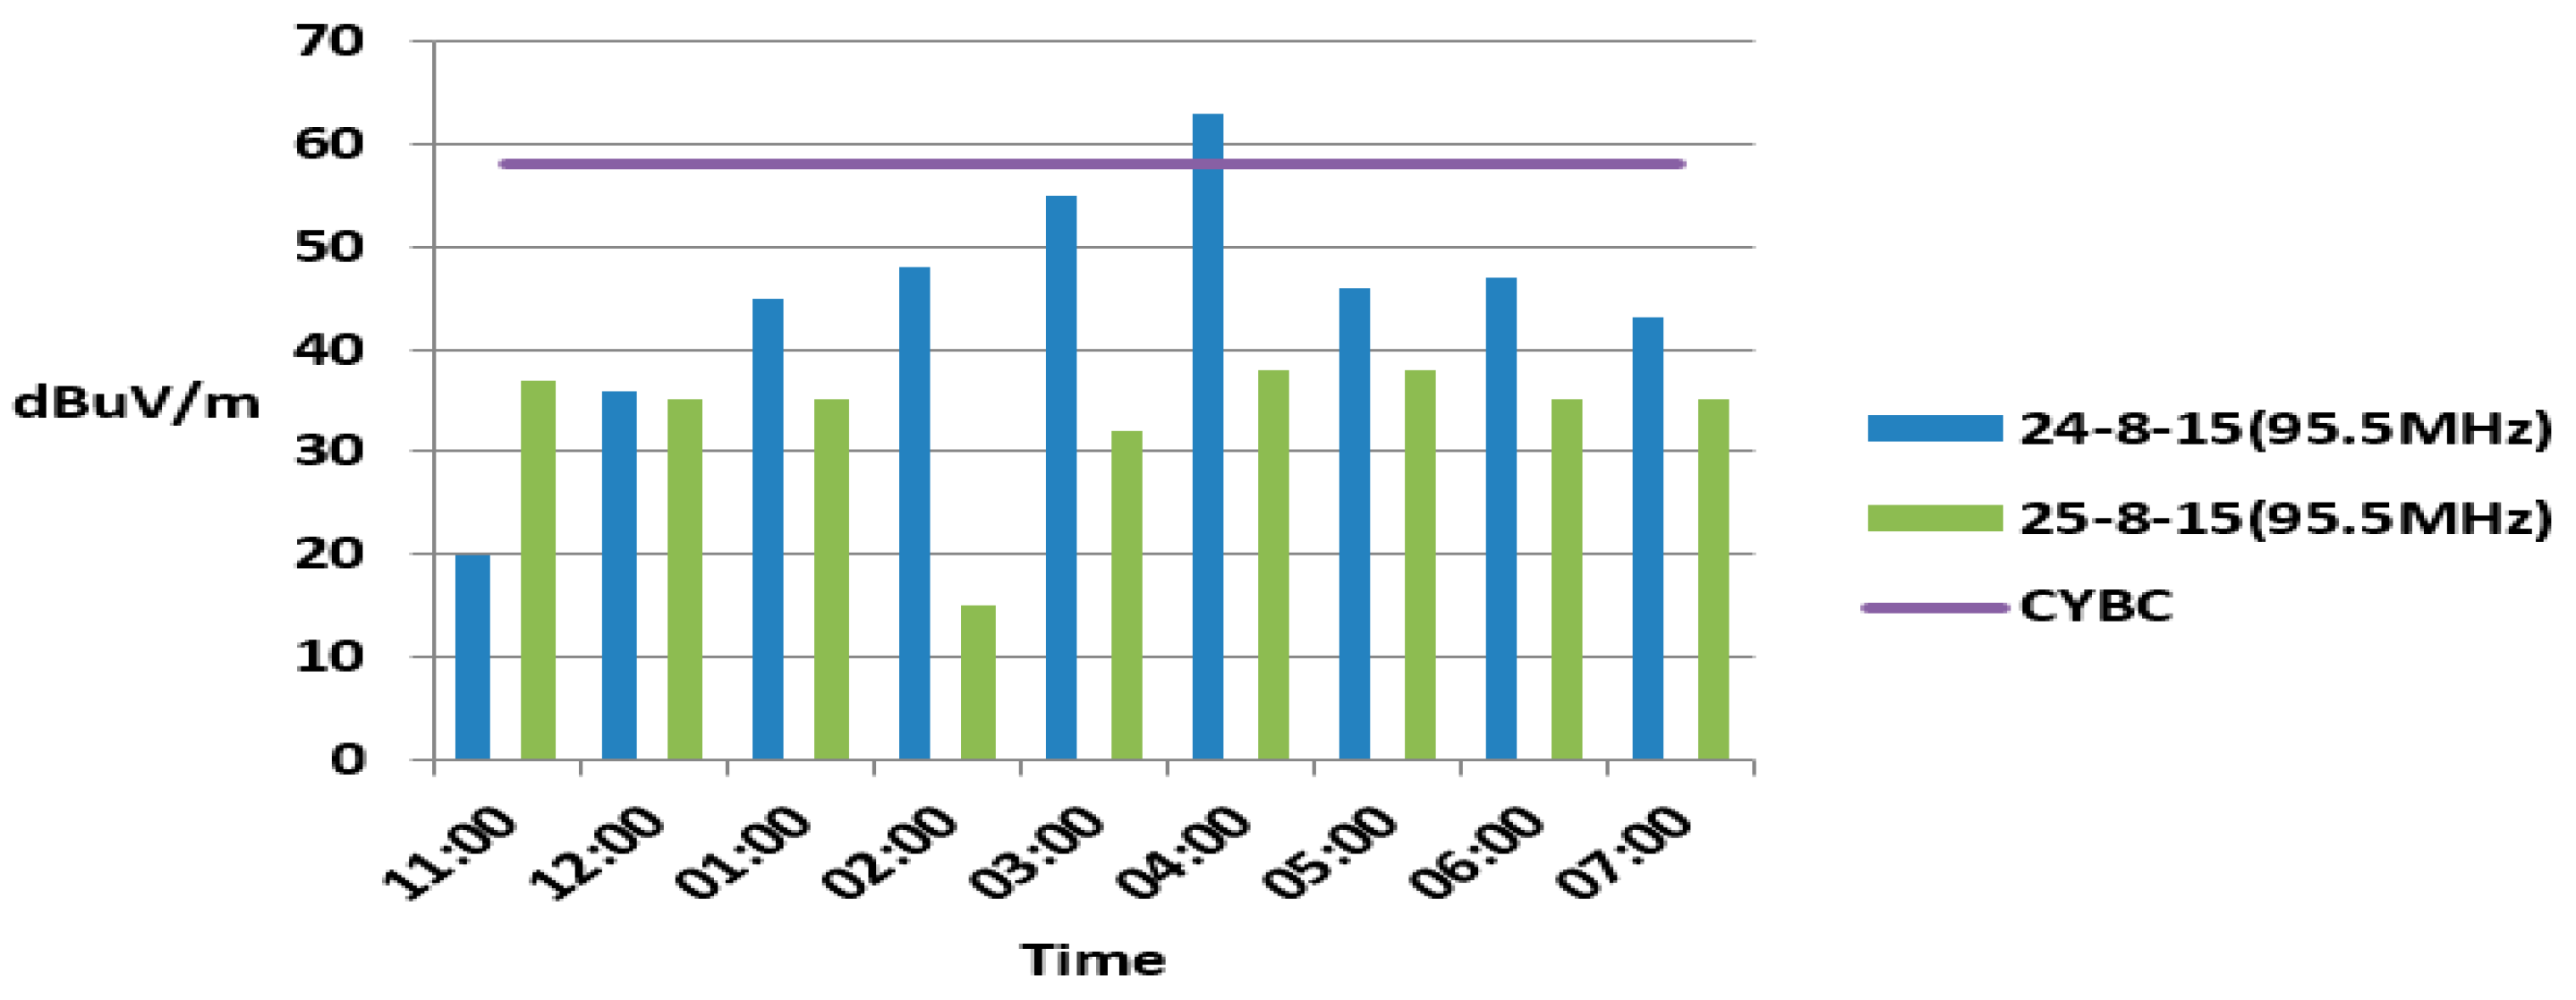
Figure 6. According to the simulated results based on the spectrum analyzer readings, the mean values of the unwanted signals’ strength were 33 dBuV/m in June, increased to 53 dBuV/m in July and reduced to 42 dBuV/m in August. Therefore, the field strength intensity of the unwanted reported signals presented their maximum field strength intensity in July. Further, according to
Figure 5, the intensity of the unwanted 95.5 MHz signal broadcast from Israel exceeded CYBC 94.8 MHz national radio service at 4:00 P.M. on 24 August.
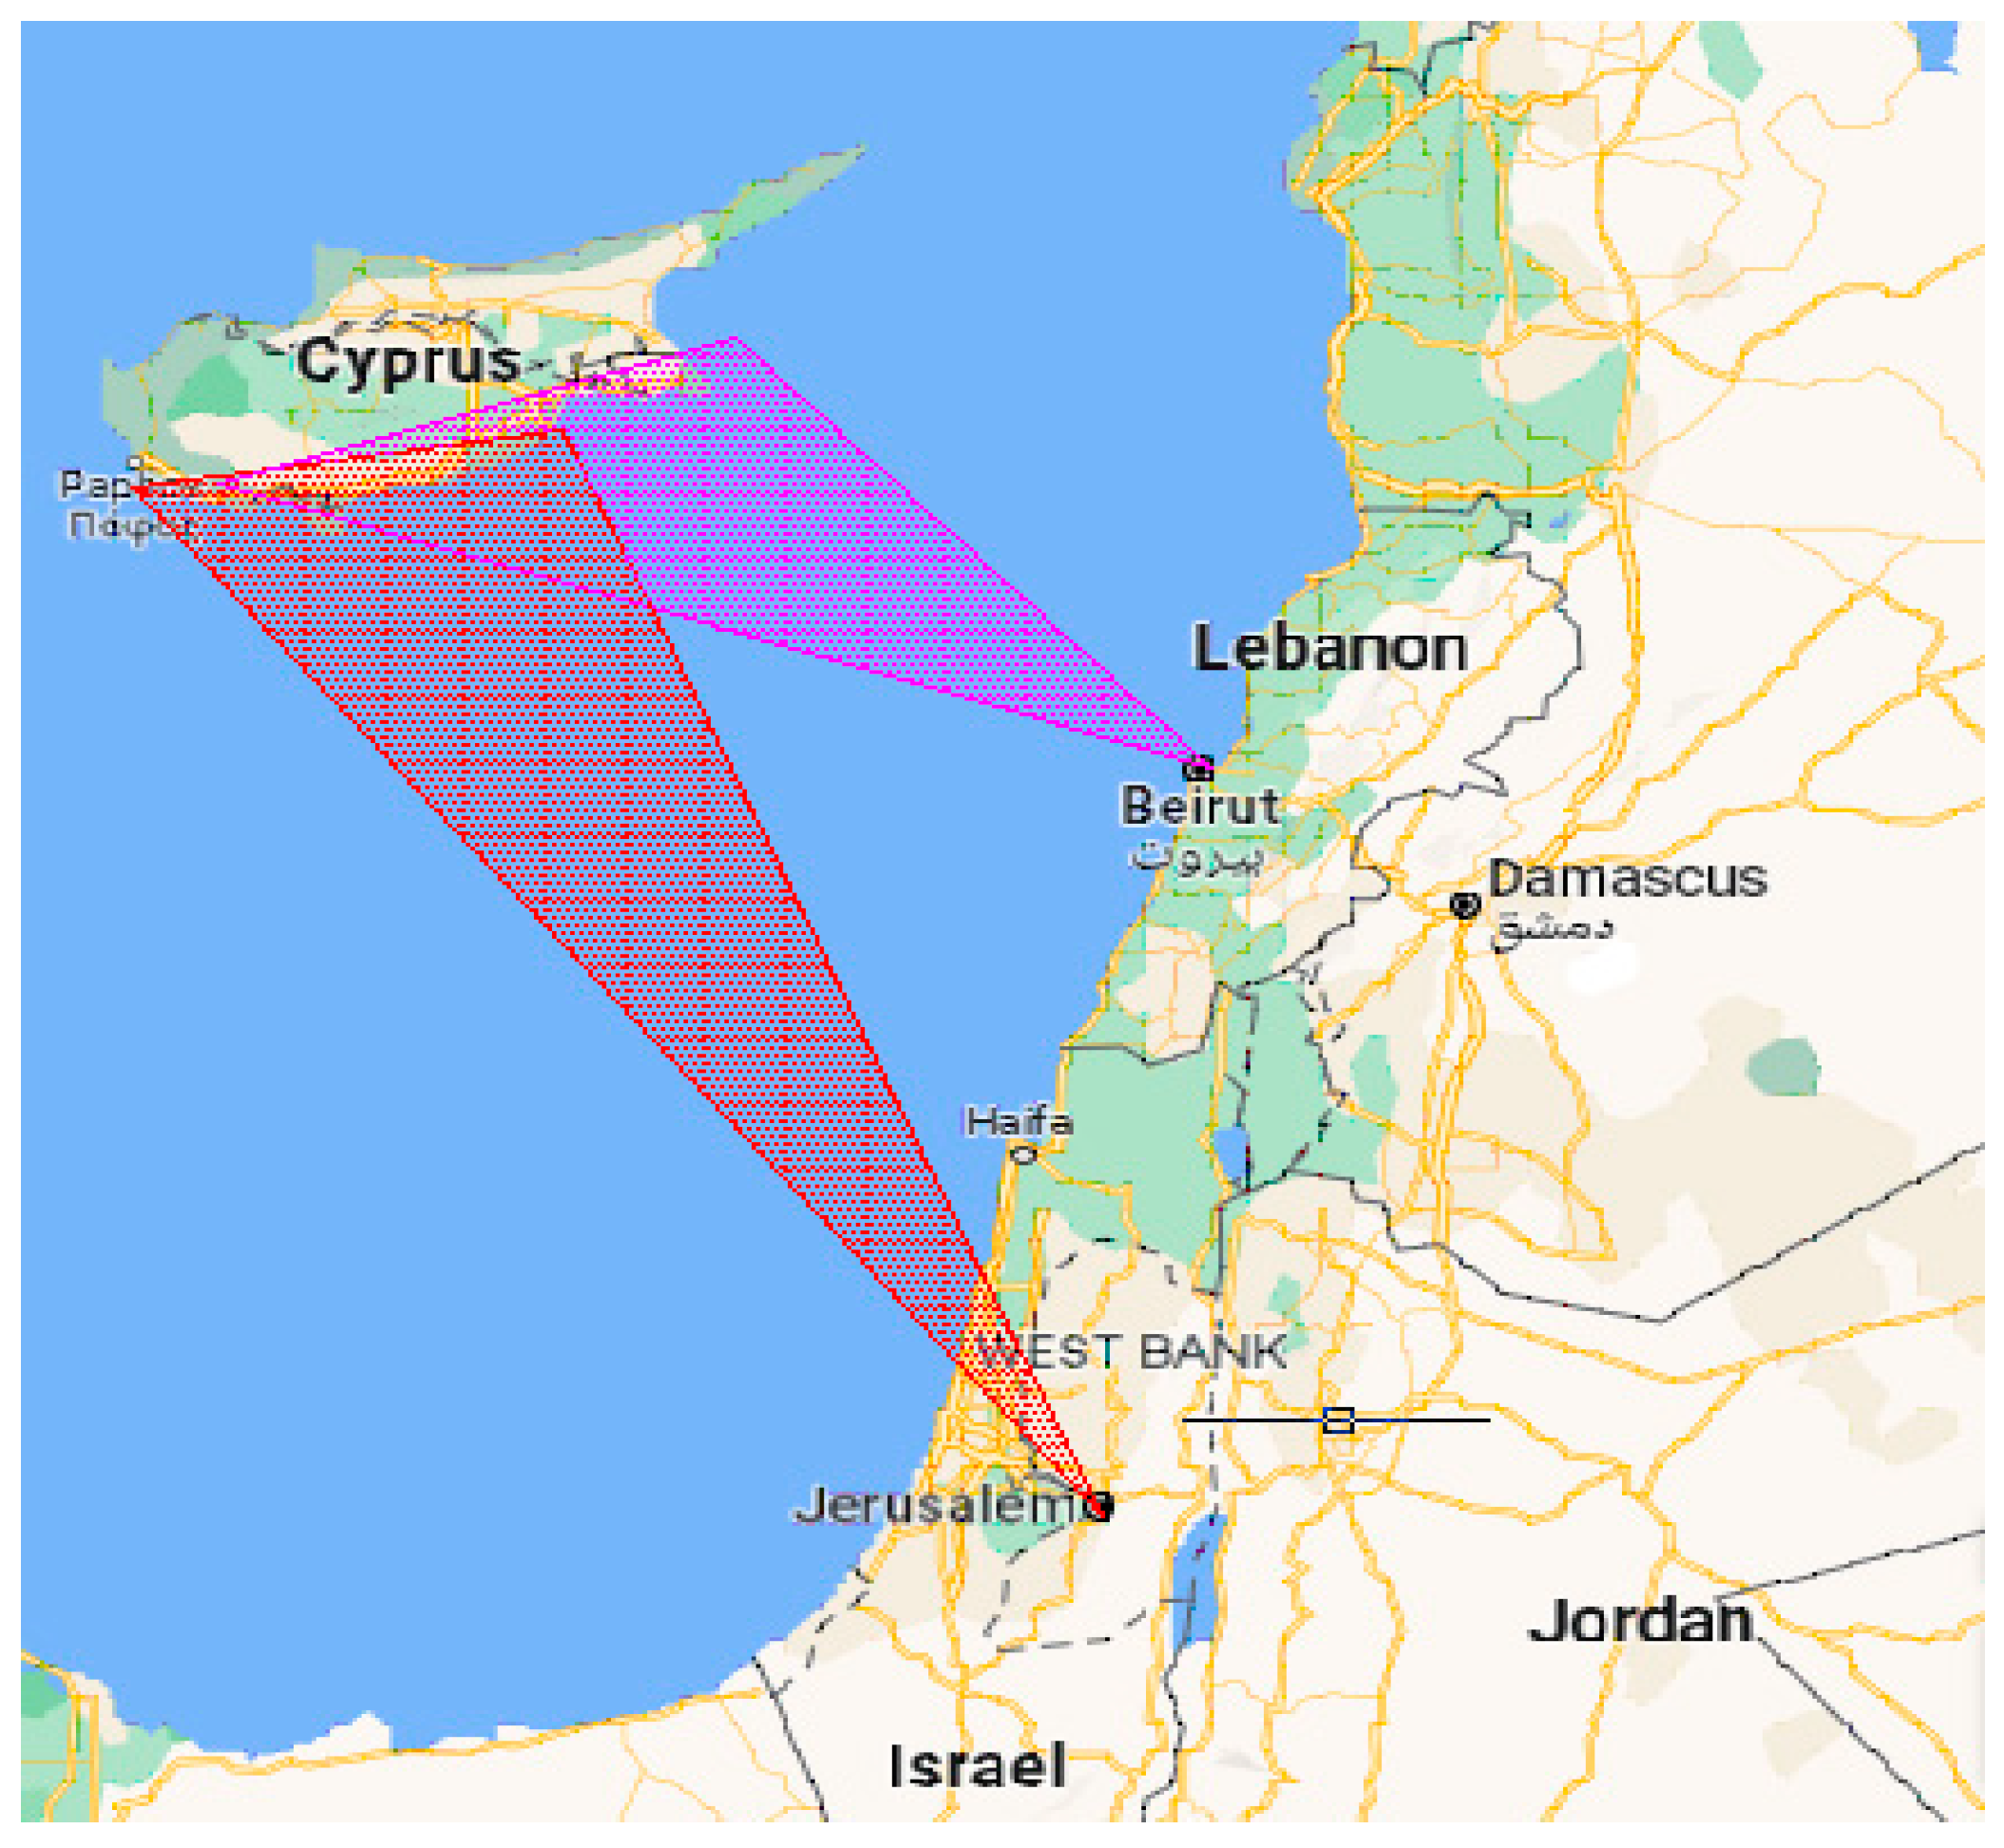
As a result, if the two radio services under discussion, i.e., the national CYBC and the overseas 95.5 MHz from Israel, were broadcasting on the same frequency, CYBC could not be received locally because 95.5 MHz would be dominated over its signal. Particularly, an FM receiver has a capture effect, i.e., it selects only the strongest signal than all the others it receives on the same frequency. Despite taking into account the distance between Cyprus and the Middle East, the problem of interference should not have occurred. Particularly, because the propagation losses are inversely proportional to the square of the distance, the mentioned radio signal arriving from Jerusalem to Limassol from a distance of 376 km should have been much weaker than the local, national radio broadcast from Olympus from a distance of 29 km. For this to be true, both signals must be traveling under line-of-sight conditions and broadcast with the same or similar EIRP. As a result, the expected field strength intensity of the signal 95.5 MHz (40 KW EIRP) should have been considerably lower than that of the CYBC (30 KW EIRP), as this was also confirmed during the winter season as well as by Equations (1)–(3) below. For the aforementioned, the technical characteristics of each monitored signal under study were obtained from the ITU for deeper analysis and are given below.
The path loss in case study 1 can be then calculated by applying Equation (1):
Case 1: Path Length between Jerusalem and Limassol—376 km;
Based on the Recommendation ITU-R P.525-3 (calculation of free-space attenuation), the free space path loss (FSPL) can be expressed by Equation (1) [
13]. The reason this formula was chosen is that it calculates the free space path loss on the basis that the gain of the receiving and transmitting antennas is zero. The gain of the receiving antenna was considered zero because it is a circularly polarized consists of two half-wave crossed dipoles. That is, with respect to the linear polarization transmitting FM radio antennas that most services in the region employ, it entails a polarization loss of the order of −3 dB relative to an isotropic radiator [
14]. Considering the gain of the two crossed half-wave dipoles is around 2 dBi each, the theoretical gain of our receiving antenna is about −0.8 dBi. By taking into account the radiation patterns’ distortion from the mast that the antenna is mounted, real-world measurements revealed that its gain could be considered zero. On the other hand, the gain of the transmitting antennas is considered to be zero because it is already included in the EIRP calculations. When applying Equation (1), the attenuation of the electromagnetic wave propagating from Jerusalem to Limassol is 123.54 dB.
By taking into account the effective radiated Isotropic Power (EIRP) of the 95.5 MHz, which is 40 KW and the path length, the expected free space monitored signal strength in Limassol is 0.018 uW or 59.99 dBuV/m. However, it is very important to be stated that the spectrum analyzer readings presented in
Figure 3 revealed that on 11 July, the signal level of the mentioned signal was monitored at 71 dBuV/m. As a result, its free space value was enhanced by eleven decibels over the calculated results. According to
Figure 3,
Figure 4 and
Figure 5, the field strength intensity of the national radio CYBC 94.8 MHz was almost constant, as expected.
On the other hand, the FSPL calculations of the CYBC 94.8 MHz can be computed by applying Equation (2). The technical characteristics that are given below were also obtained by the ITU:
Distance from Olympus to Limassol: 29 kM;
By applying Equation (2), the FSPL of CYBC is calculated at 101.22 dB. Since its effective isotropic radiated power is 30 kW, under line-of-sight conditions, the attenuation of 101.22 dB corresponds to 2.26 uW or 80.99 dBuV/m, which exceeds the measured 58 dBuV/m. Therefore, the standard error between the theoretical calculations and the real-world measurements can be attributed to the monitor’s antenna height. It was not considered important for the monitor antenna to be installed in absolute line of sight with the transmitting point on Olympus because the field intensity of the local radio services is known.
Further, the mean value of 102.5 MHz signal intensity arriving from Lebanon was dBuV/m in June, increased to 31 dBuV/m in July, and reduced to 30 dBuV/m in August. The FSPL calculations pertaining to the path from Lebanon to Limassol are given below. The technical characteristics were obtained by ITU. The FSPL is calculated by applying Equation (3):
Case 2: distance from Lebanon to Limassol: 271 km;
According to Equation (3), the FSPL between Lebanon and Limassol is 121.31 dB or 62.99 dBuV/m. Based on the monitored data, the minimum field strength intensity in regard to the signal arriving from Lebanon was 13 dBuV/m, which is below its maximum free space value.
As a result, the field strength instability in terms of the FSPL calculations confirms that the propagation of the two discussed overseas signals monitored in Limassol, as illustrated in
Figure 7, is affected by an abnormal propagation mechanism. In order to reveal it, a deeper scientific analysis based on the ITU recommendations was performed and is discussed in the next sections.
5. Analysis of the Overseas Monitored Signals
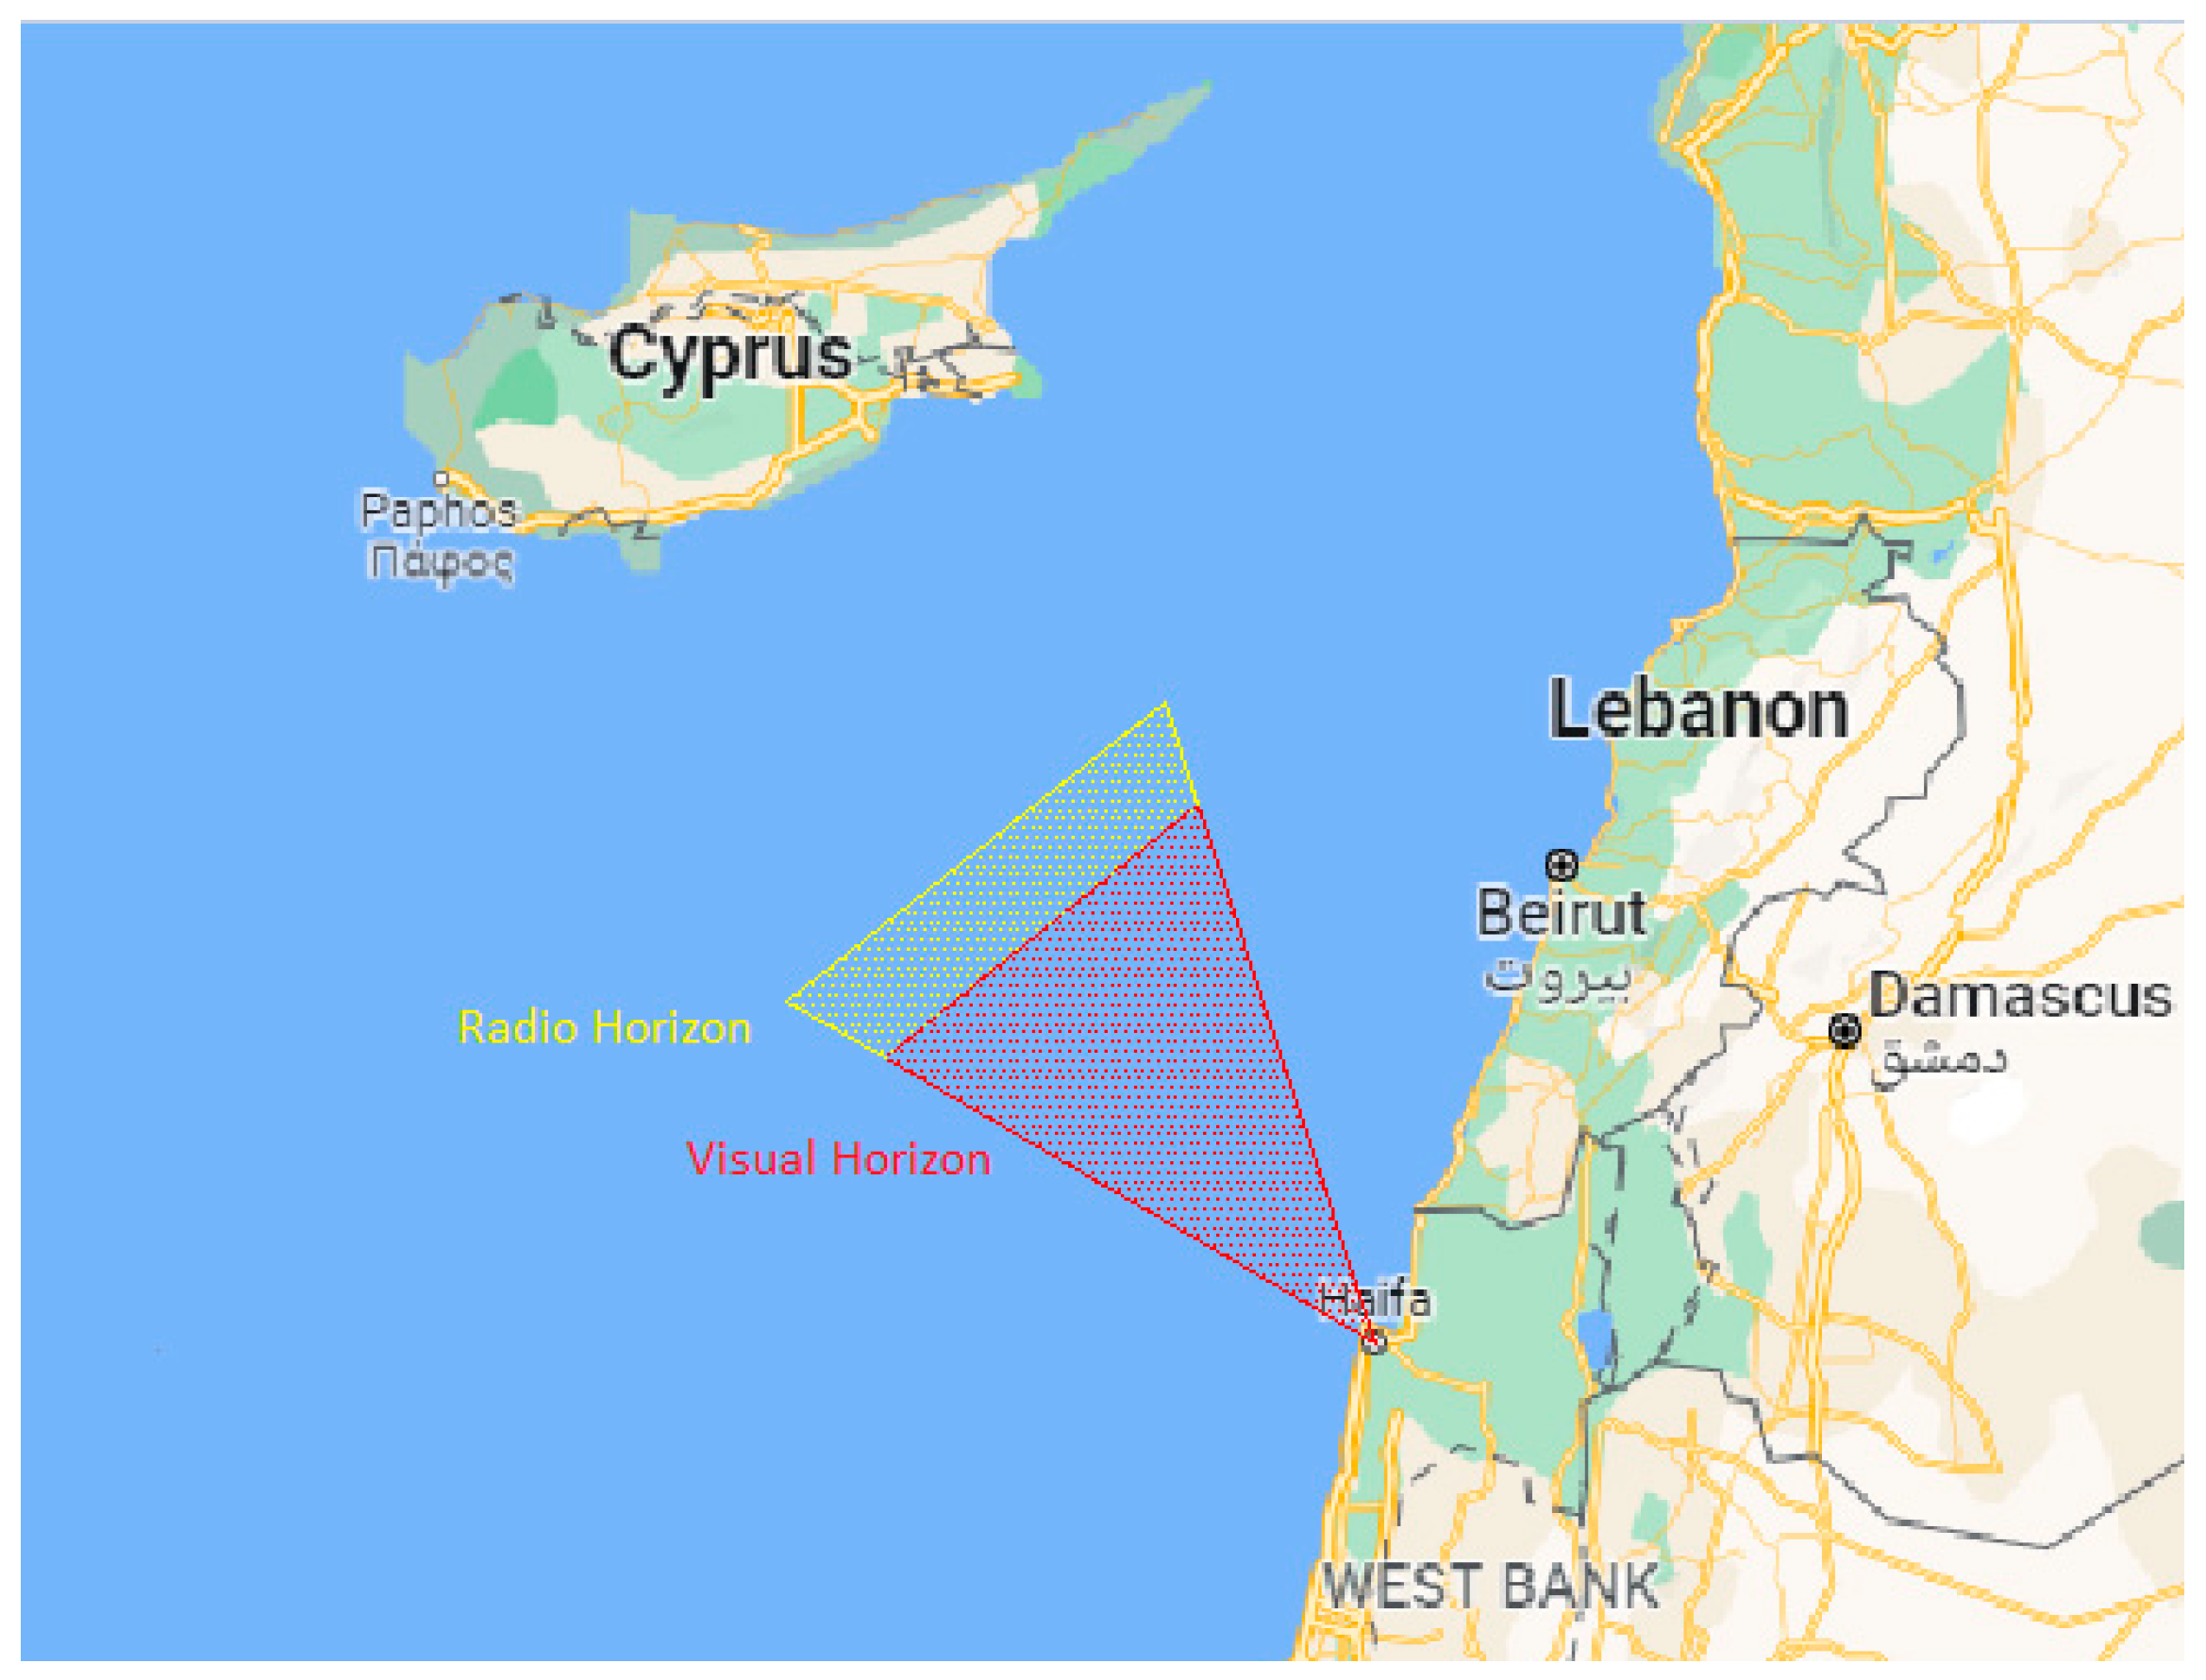
Line of sight interference from the Middle East should only occur when the unwanted signal travels to Limassol without encountering any obstacles in the path. Since there are no obstacles between Limassol Israel and Lebanon, the only limitation that could interrupt the propagation of the unwanted signals is the curvature of the Earth, i.e., the horizon. The visual horizon is basically the visual field limit imposed by Earth’s curvature. On the other hand, the radio horizon, as shown in
Figure 8, extends beyond the visual horizon. For the aforementioned, it occurs as the incident waves bend downwards due to the gradient of the refractive index that is different from zero. This phenomenon is also discussed in the recommendation ITU-834-9 [
15] and can be expressed by Equation (4) below:
where:
ρ = radius of the ray path curvature;
n = refractive index of the atmosphere;
dn/dh = vertical gradient of the refractive index;
h = the point elevation above the Earth’s surface in km;
φ = angle of the ray path measured from the horizontal plane.
Under normal atmospheric conditions, the refractive index is equal to unity, and the angle φ is equal to zero. Thus, Equation (4) can be simplified to Equation (5).
In order to calculate whether a radio wave propagates under line of sight conditions from one region to another, Equation (6) is used. In this regard, the shape of the Earth is considered spherical and without atmosphere where propagation paths are straight lines. However, due to the fact that Earth’s shape is not a perfect sphere, a constant coefficient k’, which is approximately 1.33 (under normal atmospheric conditions), is derived from the vertical refractivity gradient in the first kilometer above the surface of the Earth. The constant coefficient k’ must be then multiplied by Earth’s geometric radius (6370 km) to correct the error and thus the effective radius to be calculated by applying Pythagorem theorem as given by Equation (6):
where KR = 6370 km × 1.33;
H1: Height.
Further, by applying the Pythagorean Theorem on Equations 7 and (8), the path lengths of the signal under study can be calculated below:
Paths Lengths calculations:
According to Equation (7), the radio horizon is 120 km. Due to the fact that the path length between Limassol and Jerusalem is greater than 120 km, i.e., it is actually 376 km, by applying Equation (7), it is confirmed that the signal 95.5 MHz broadcast from Israel is not arriving at Limassol by a line-of-sight propagation mechanism:
Based on Equation (8), the radio horizon between Beirut and Limassol is 224 km. Thereby, it is also confirmed that the mentioned unwanted signal is not traveling to Limassol under line-of-sight conditions.
As a rule of thumb, beyond the radio horizon, VHF signals fade over a short distance [
16].
By exploring the literature regarding abnormal propagation mechanisms that could cause severe interference along the coast of Cyprus, the following cases were investigated and discussed below. These are defined as diffraction, tropospheric scattering and refraction.
Diffraction enables overseas interference when the transmitted signals are low frequency due to the long wavelength approaching the length of the Earth’s radius. In Band II, the wavelength is approximately quantified to 3 m, which, relative to the radius of Earth (6370 km), is too short. Thus, diffraction will not favor VHF signals to propagate over a path that is greater than 200 km [
17]. Therefore, diffraction interference is not explored further as the distance of the unwanted transmitted signals exceeds 200 km.
On the other hand, tropospheric scattering is not considered the cause of the interference problem in Cyprus because it is mainly applied to microwave radio link communications. This is achieved by utilizing the transmitted power of Megawatts EIRP utilizing very high gain antennas [
18]. According to
Table 1, the EIRP of the monitored overseas signals is on the power of Kilowatts.
Regarding refraction, this anomalous mechanism occurs when an incident wave is traveling through two atmospheric layers characterized by distinct dielectric constants. As a result, the refraction angle is determined by the gradient of the refractive index. For instance, when a radio wave travels in a straight line, the refractive index of the media through which the signal is passing is unity. The refractive index is defined as the ratio of the speed of light in the free space to the wave’s velocity in a substance. In the real world, the refractive index is not unity, but it is about 1.0003. However, this is true only when atmospheric conditions are normal. In this respect, it is worth noting that the radio horizon (under normal atmospheric conditions) is extended beyond the visual horizon by 4/3 times, as illustrated in
Figure 8. However, the radio horizon can extend much longer under certain atmospheric conditions, which are discussed deeply by recommendation ITU-R P 453-9 [
18]. The recommendation also provides the mathematical expressions related to the atmospheric parameters that determine the anomalous propagation mechanisms to occur. For instance, the radio refractive index n, in terms of the radio refractivity N, is given in Equation (9) below:
In this regard, the radio refractivity N can be then expressed by Equations (10) and (11), as follows:
where:
P is atmospheric pressure in hPa, T is the temperature in C and RH is the relative humidity in %.
where:
P is atmospheric pressure (hpa);
e represents water vapor pressure (hpa);
T denotes absolute temperature (K).
In this respect, the three types of refraction propagation mechanisms are discussed further: Particularly, when atmospheric conditions are normal, the atmospheric pressure temperature and moisture decrease with altitude. Further, the refractive index’s value declines uniformly with height. This exponential function, within 1 km of Earth’s surface, is sufficiently regular to be approximated by a linear function, i.e., be defined as the standard gradient N of 39 units per km of distance [
19]. As a result, the propagating wave is refracted so that it can travel beyond the visual horizon by additional 4/3 times.
As concerns sub-refraction, this anomalous propagation mechanism occurs when the normal gradient lies between 0 and −79 N/km. Under sub-refraction conditions, the propagated waves travel upwards far away from the Earth’s surface. Due to the fact that non-line-of-sight overseas signals reach the southern coastal region of Cyprus at a low altitude, the interference is not produced by the sub-refraction propagation mechanism.
On the other hand, super refraction occurs from temperature inversion at a certain height within the troposphere. Furthermore, super refraction can also occur from water vapor content when the moisture decreases with height. In this case, the N gradient lies between −157 N/km and approximately −79 N/km. As a result, the refraction of the propagated wave is such that its radius will eventually approach the radius of the Earth in order to continue traveling at a fixed height, maintaining the trajectory parallel to the Earth’s surface.
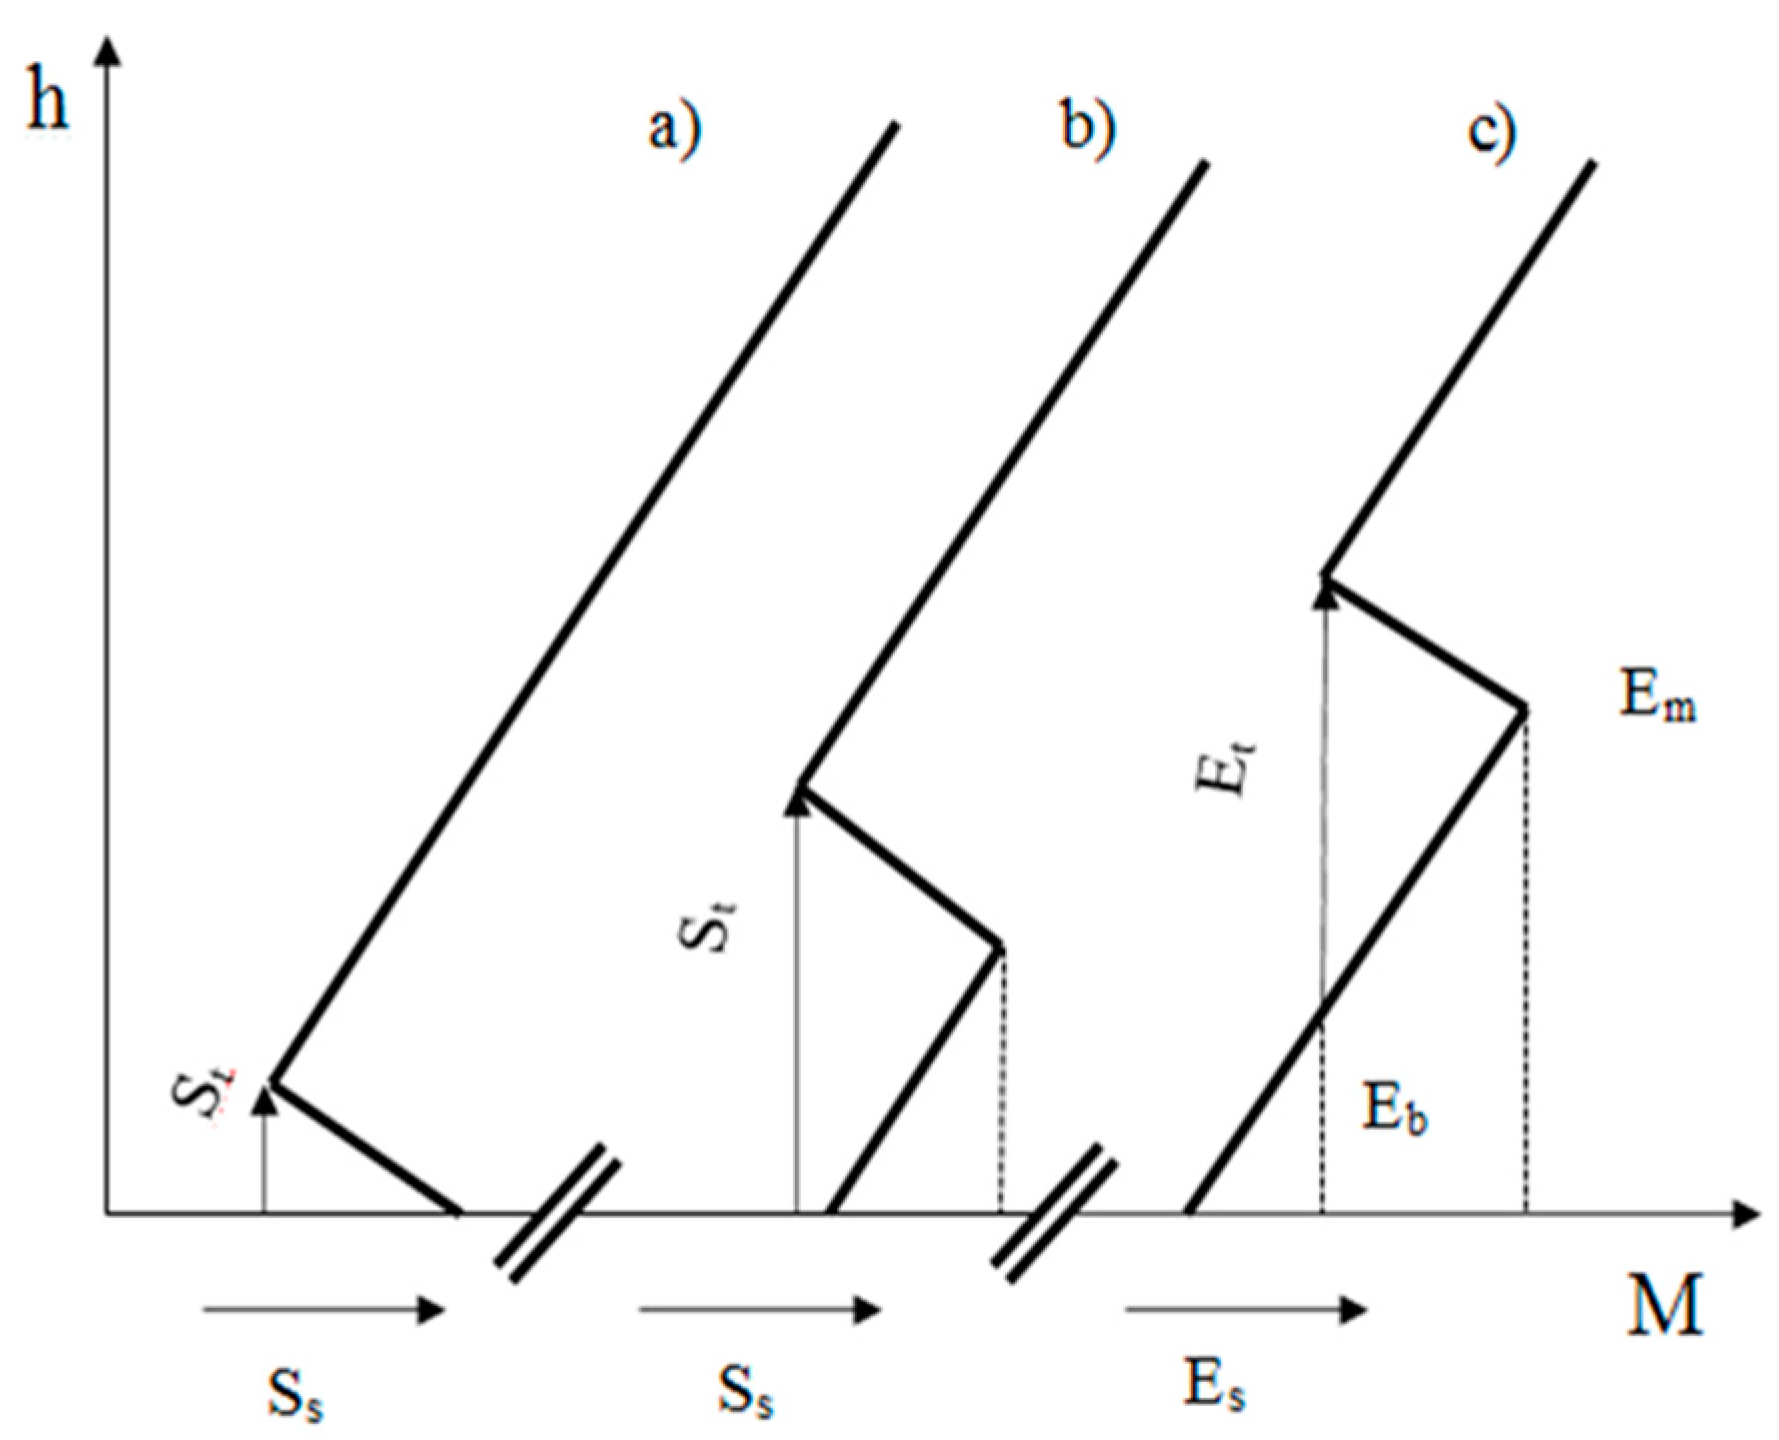
Lastly, the most severe interference can be caused due to trapping or ducting. Trapping is caused by temperature inversion as well. In this case, the N gradient exceeds −157 N/km. Therefore, trapping can cause severe interference because the radius of the propagated waves becomes smaller than Earth’s radius as it decreases beyond the critical gradient. As a result, the unwanted signals are trapped within a thin layer of the troposphere, denoted as a duct that acts as a waveguide. This is the reason that radio waves in the VHF/UHF band can travel very long distances beyond the horizon with very low attenuation. This phenomenon is discussed deeply by Rec. ITU-R P.453-8. For instance, the ducts can be expressed in terms of modified refractivity M(h) by Equation (12):
where h (km) is the height.
The three types of ducts encountered in nature are illustrated in
Figure 9 below.
6. Results
Based on the literature review, DAB, DAB+ is expected to be less prone to interference compared to analog FM radio. For instance, according to the recommendation ITU-R BS.641, the AF signal-to-noise ratio of FM Radio required for a robust reception is 56 dB for an input signal level of 40 dB (PW) [
19]. In contrast, unlike FM radio, DAB and DAB+ do not suffer from audio distortion at any level of interference [
20]. However, the DAB and DAB+ receiver will mute when the carrier-to-noise ratio C/N is worse than 15 dB due to continuous interference from an unwanted signal. As a result, the first step towards the analysis of the impact of overseas interference on DAB and DAB+ radio in Cyprus is to determine the level of interference that enables this problem to be originated, i.e., a long duration very strong field strength intensity interference, which will mute the local DAB and DAB+ reception. This can be implemented considering the effect of the atmospheric conditions of the strongest overseas signal, which was monitored in Limassol, as it was discussed in the previous sections. In this regard, it was the unwanted signal analyzed in case study 1, 95.5 MHz from Israel.
Since the propagation mechanisms favored the mentioned unwanted signal to travel beyond the horizon to Cyprus is known, as is discussed later, the field strength intensity of the corresponding DAB transmission from the given transmitting point can be simulated based on the following assumption. It is assumed that the mentioned FM radio service from Israel has been upgraded to DAB and DAB+ and now is broadcasting, for example, on 213.36 MHz with 40 KW EIRP from the given transmitting point and under the same propagation conditions that were in effect when the analog signal measurements were conducted. It has also been considered that the local DAB and DAB+ services in Cyprus broadcast an average field strength intensity of 65 dBuV/m within the service area, which corresponds to the field strength intensity of the local services today. The target is to simulate the level of the mentioned DAB interference model along the coast of Cyprus in terms of the atmospheric conditions presented below. Further, the simulation takes into account that the threshold for a DAB receiver to mute is when the unwanted signal’s level is by approximately 10 dB lower, equal or higher than its carrier level. Hence, using Equation (5), the propagation loss of the overseas DAB and DAB+ signal can be calculated in Band III based on Equation (13):
Distance from Jerusalem to Limassol: 376 km;
Frequency: 213.36 MHz (Assumed);
Altitude: 860 m above sea level;
Effective isotropic radiated power: 40 KW.
According to Equation (13), the FSPL between Jerusalem and Limassol in Band III is 130.52 dB. The effective isotropic radiated power (EIRP) of the 213.36 MHz DAB signal is 40 kW. Thus, under line-of-sight conditions, the expected signal strength of the interference signal in Limassol is approximately 51.99 dBuV/m. However, based on the previous section, it has been revealed that during atmospheric trapping conditions, the field strength intensity of the overseas signal can be higher than that of its free space value. This consideration is valid because trapping favors a propagated wave to travel very long distances with very low attenuation.
Further, it was justified in the previous section that the worst-case scenario occurred when the signal level of analog radio 95.5 MHz was enhanced by eleven decibels over its free space value. Therefore, the DAB signal assuming that it broadcasts on 213.36 MHz with 40 KW EIRP from Jerusalem, will result in at least a signal level of 63 dBuV/m along the coast of Limassol.
In order to be more specific in this analysis, the dates of the maximum, medium and low field strength intensity of 95.5 MHz were gathered and presented in
Table 2,
Table 3,
Table 4 and
Table 5, respectively. The field strength intensity of the DAB radio broadcast on 213.36 MHz from Jerusalem can be then computed and presented below.
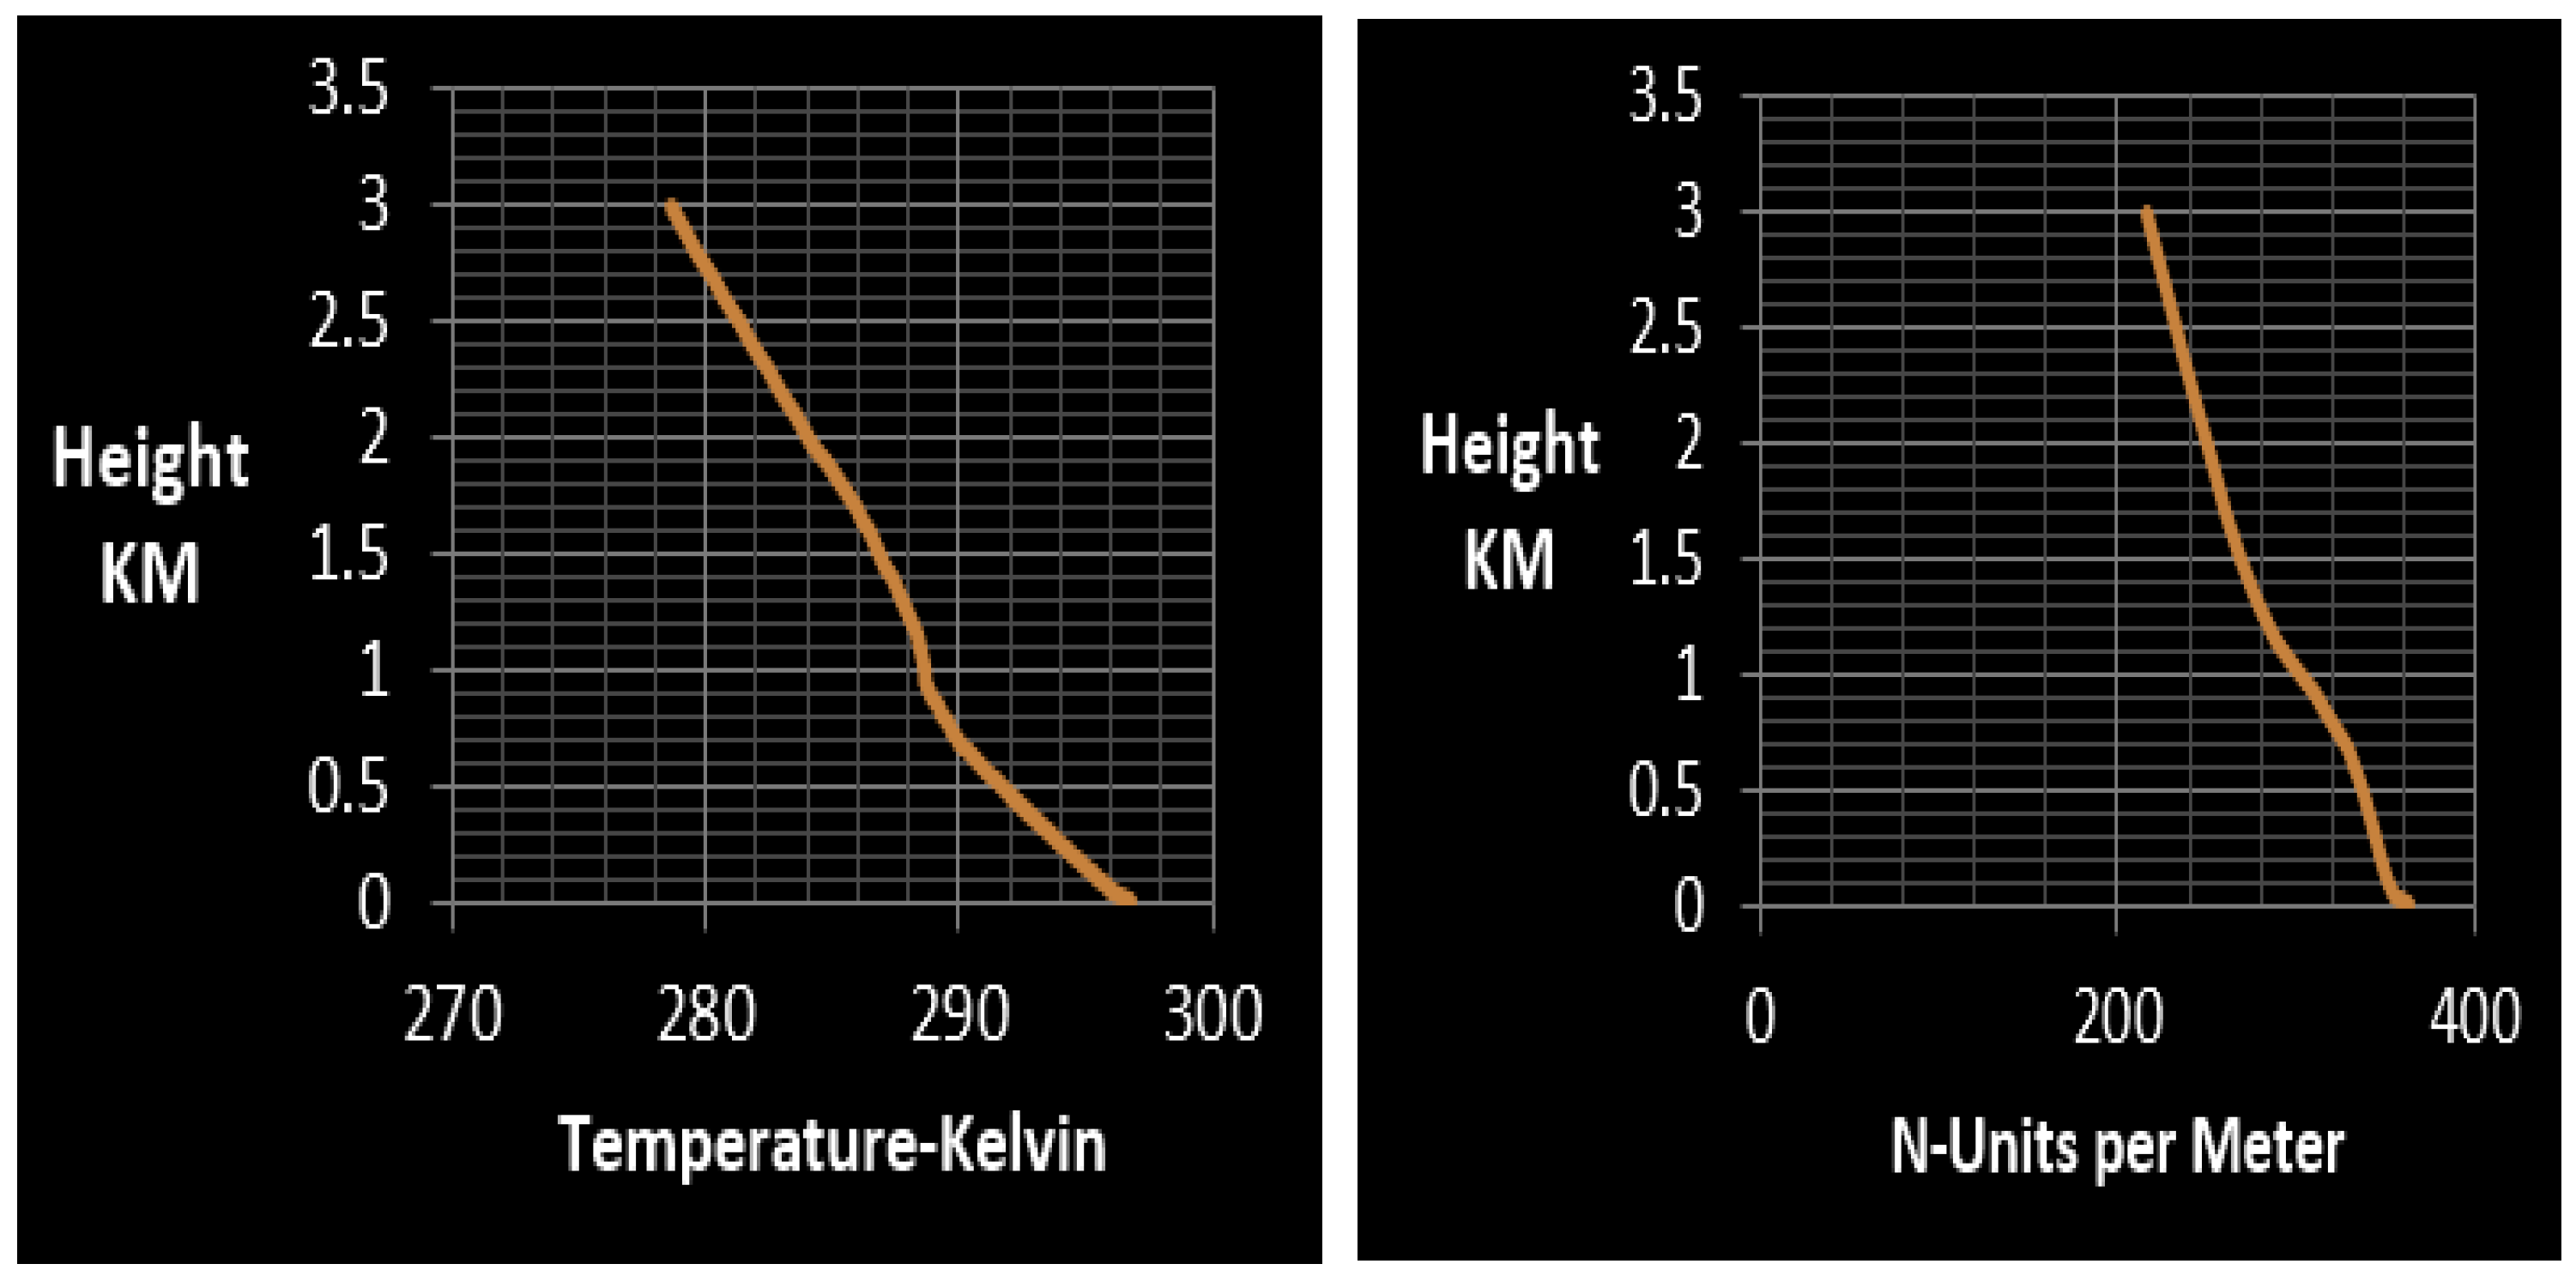
According to
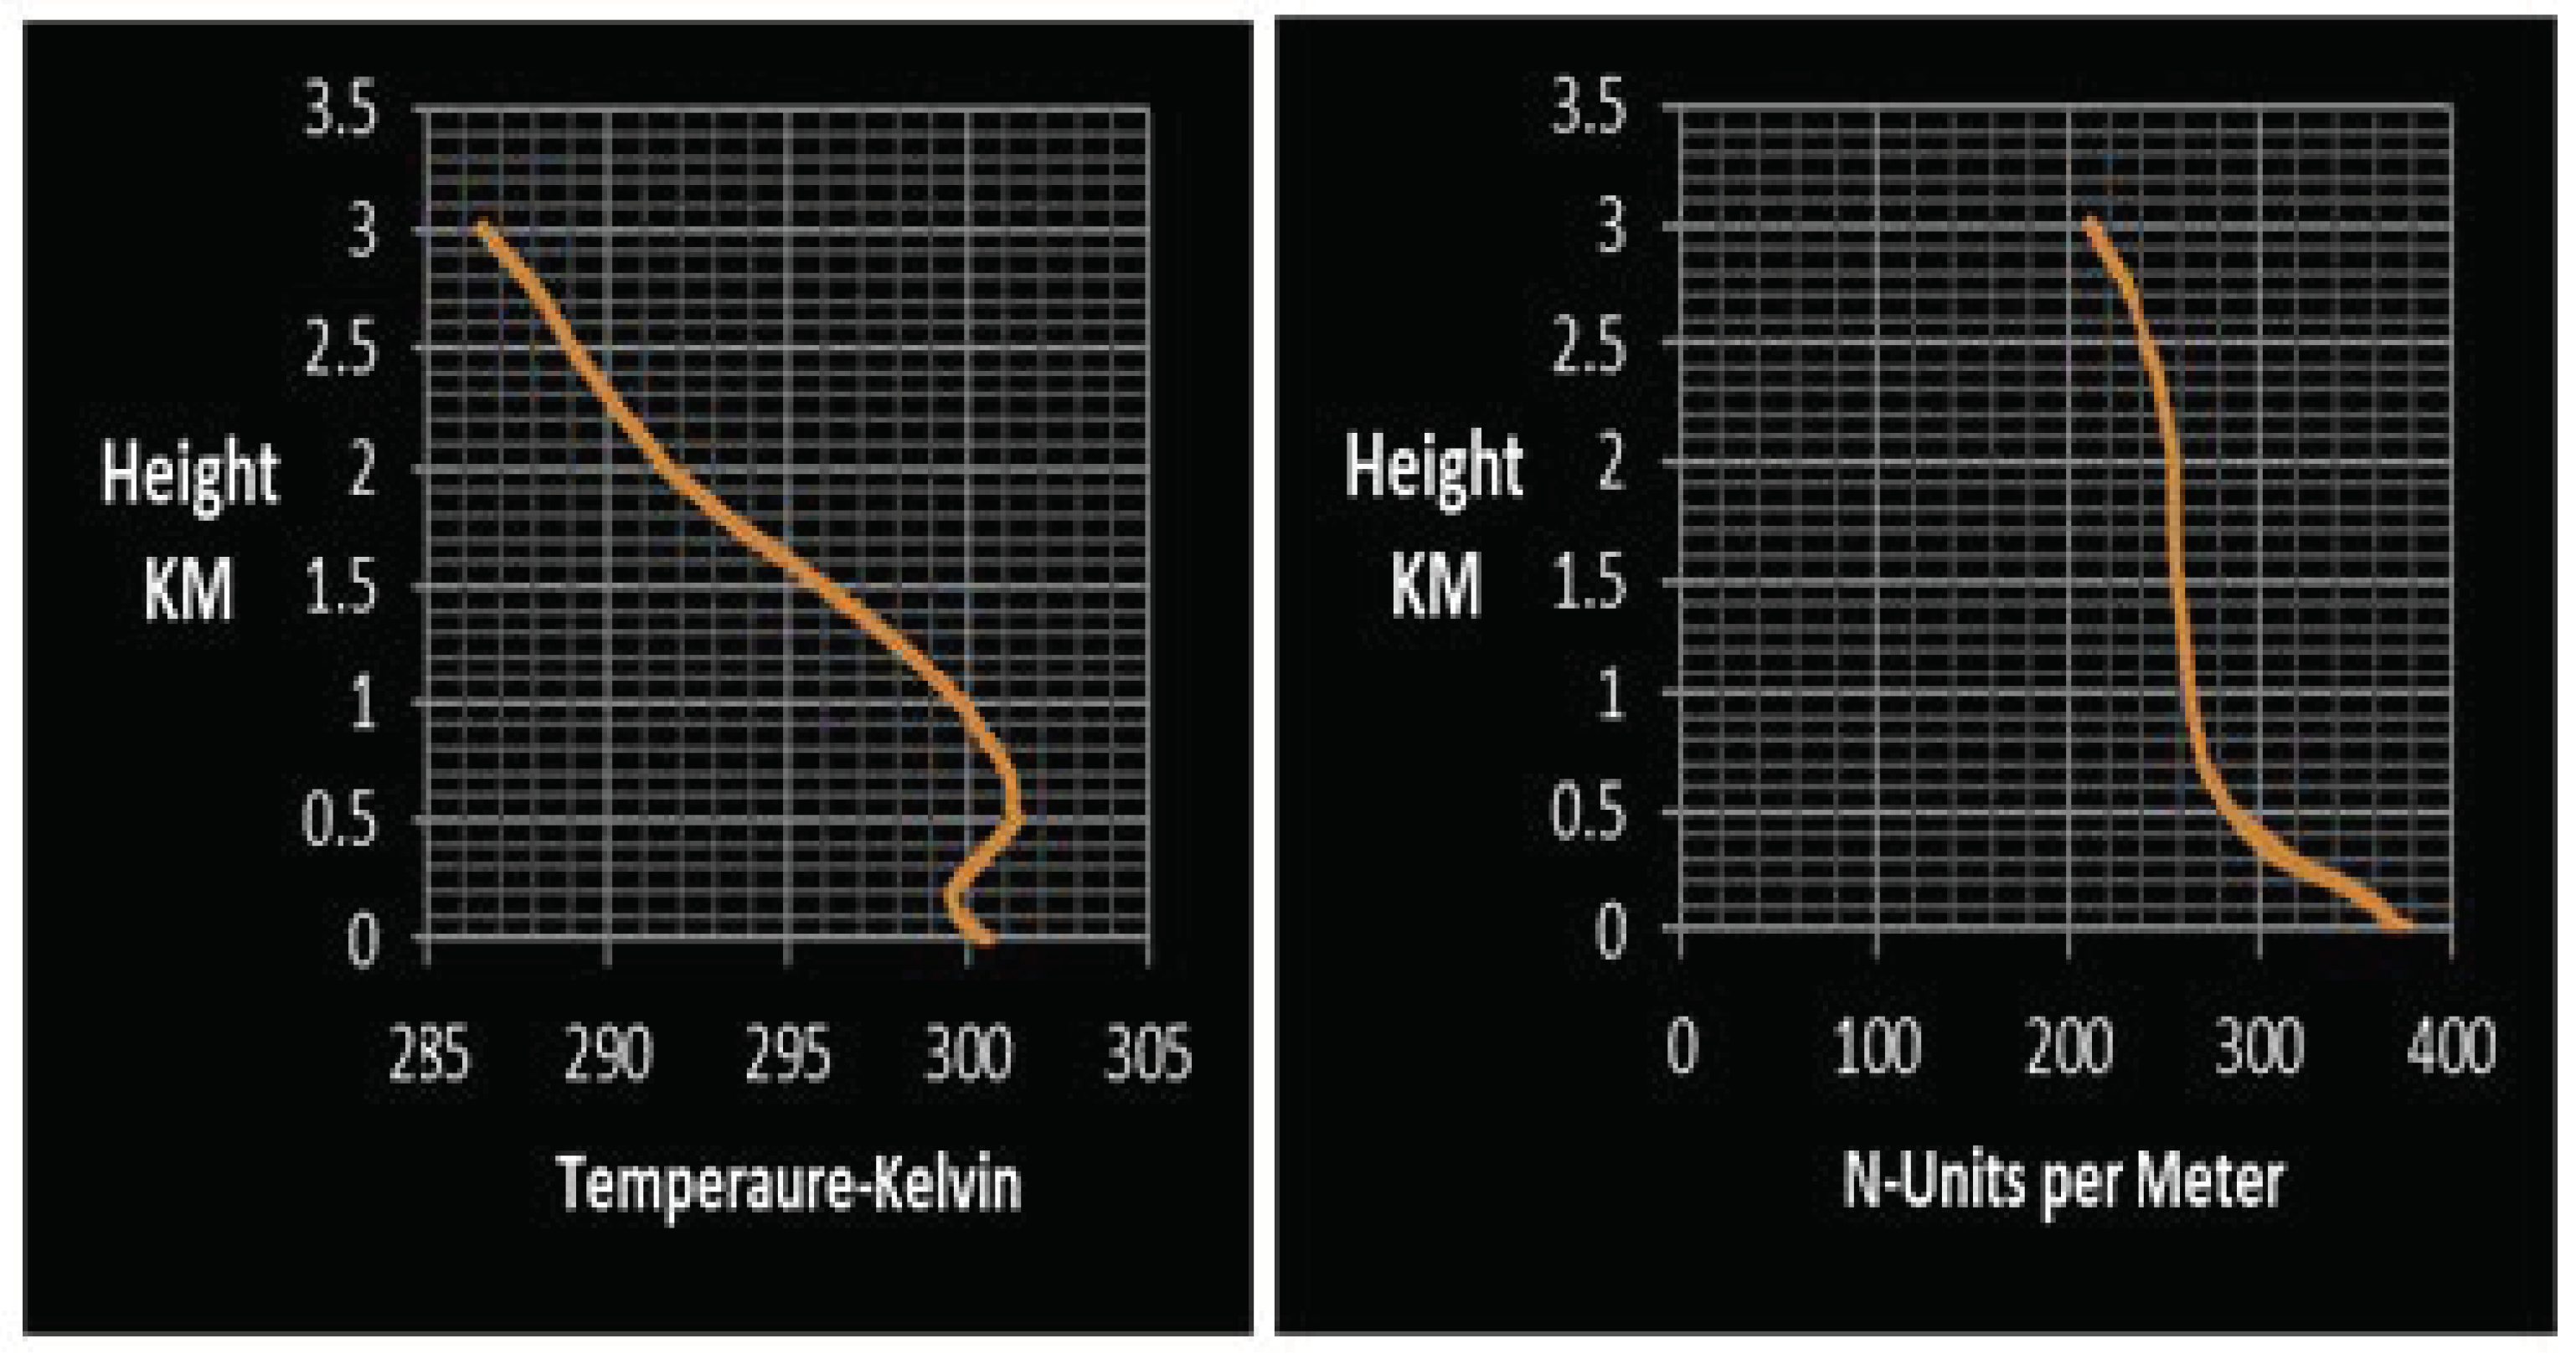
Figure 10, on 18 June, the N gradient lies between −157 N/km and −79 N/km. Further, a temperature inversion occurred at 300 m. As a result, super refractive atmospheric conditions have affected the transmitted signal to travel successfully from Jerusalem to Limassol with very high field strength intensity, as shown in
Figure 11.
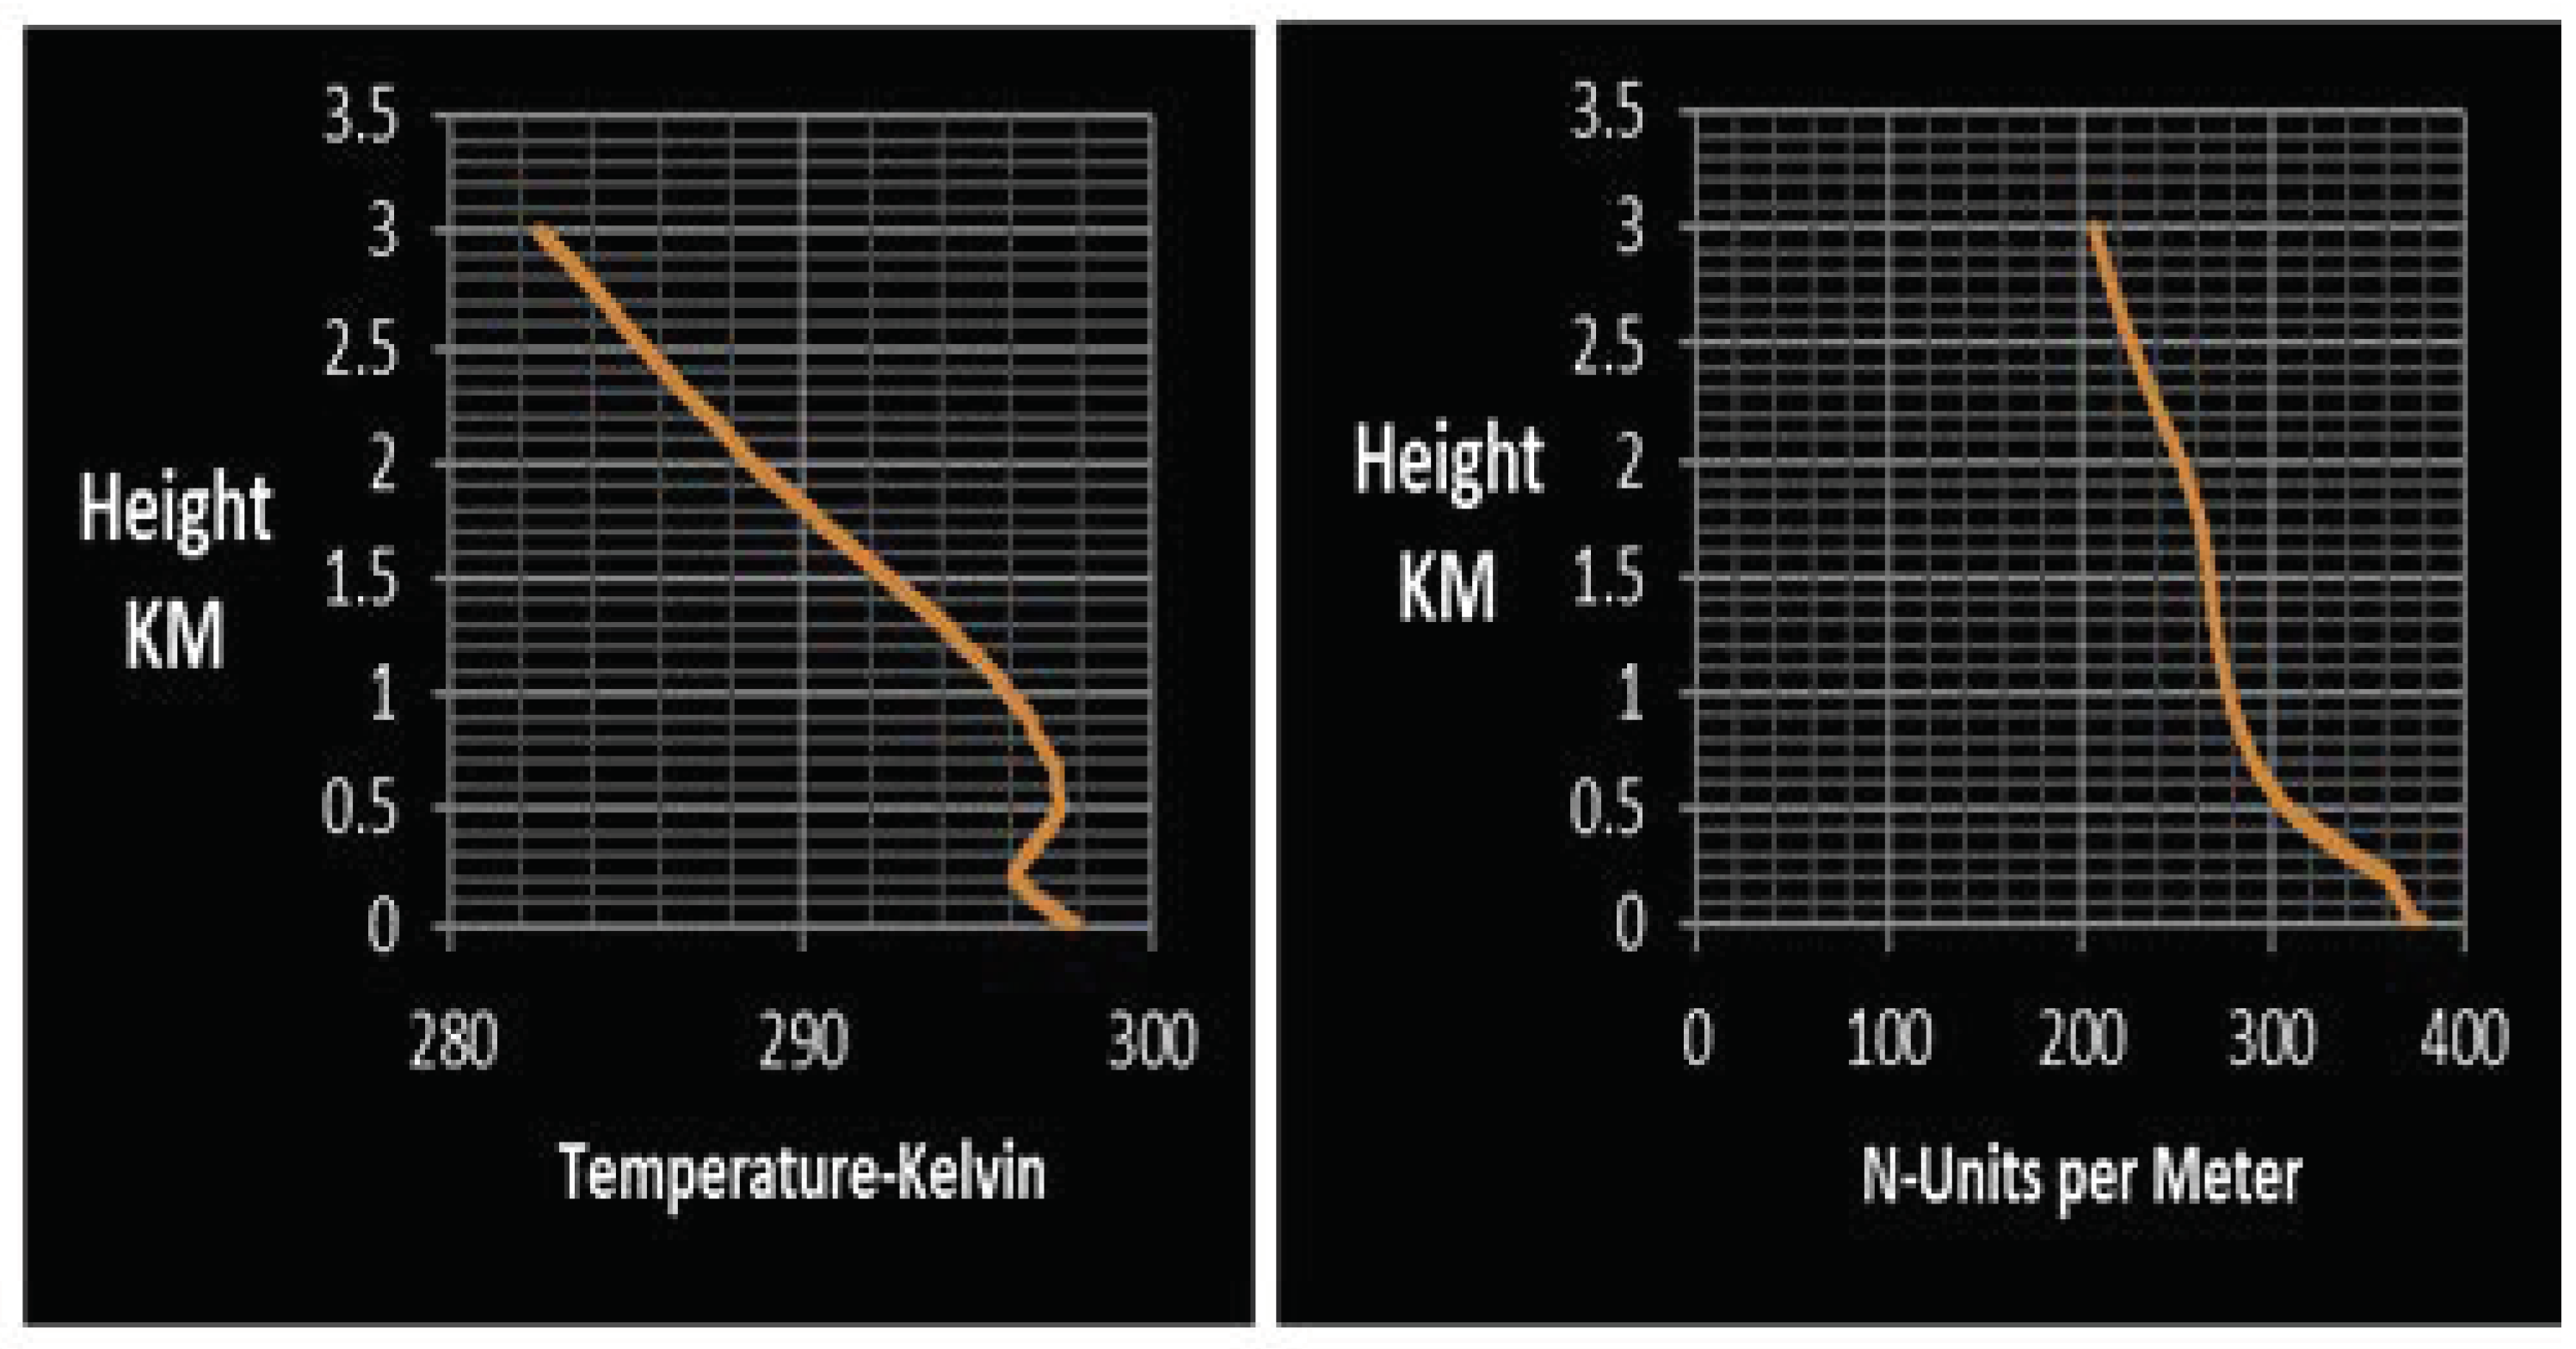
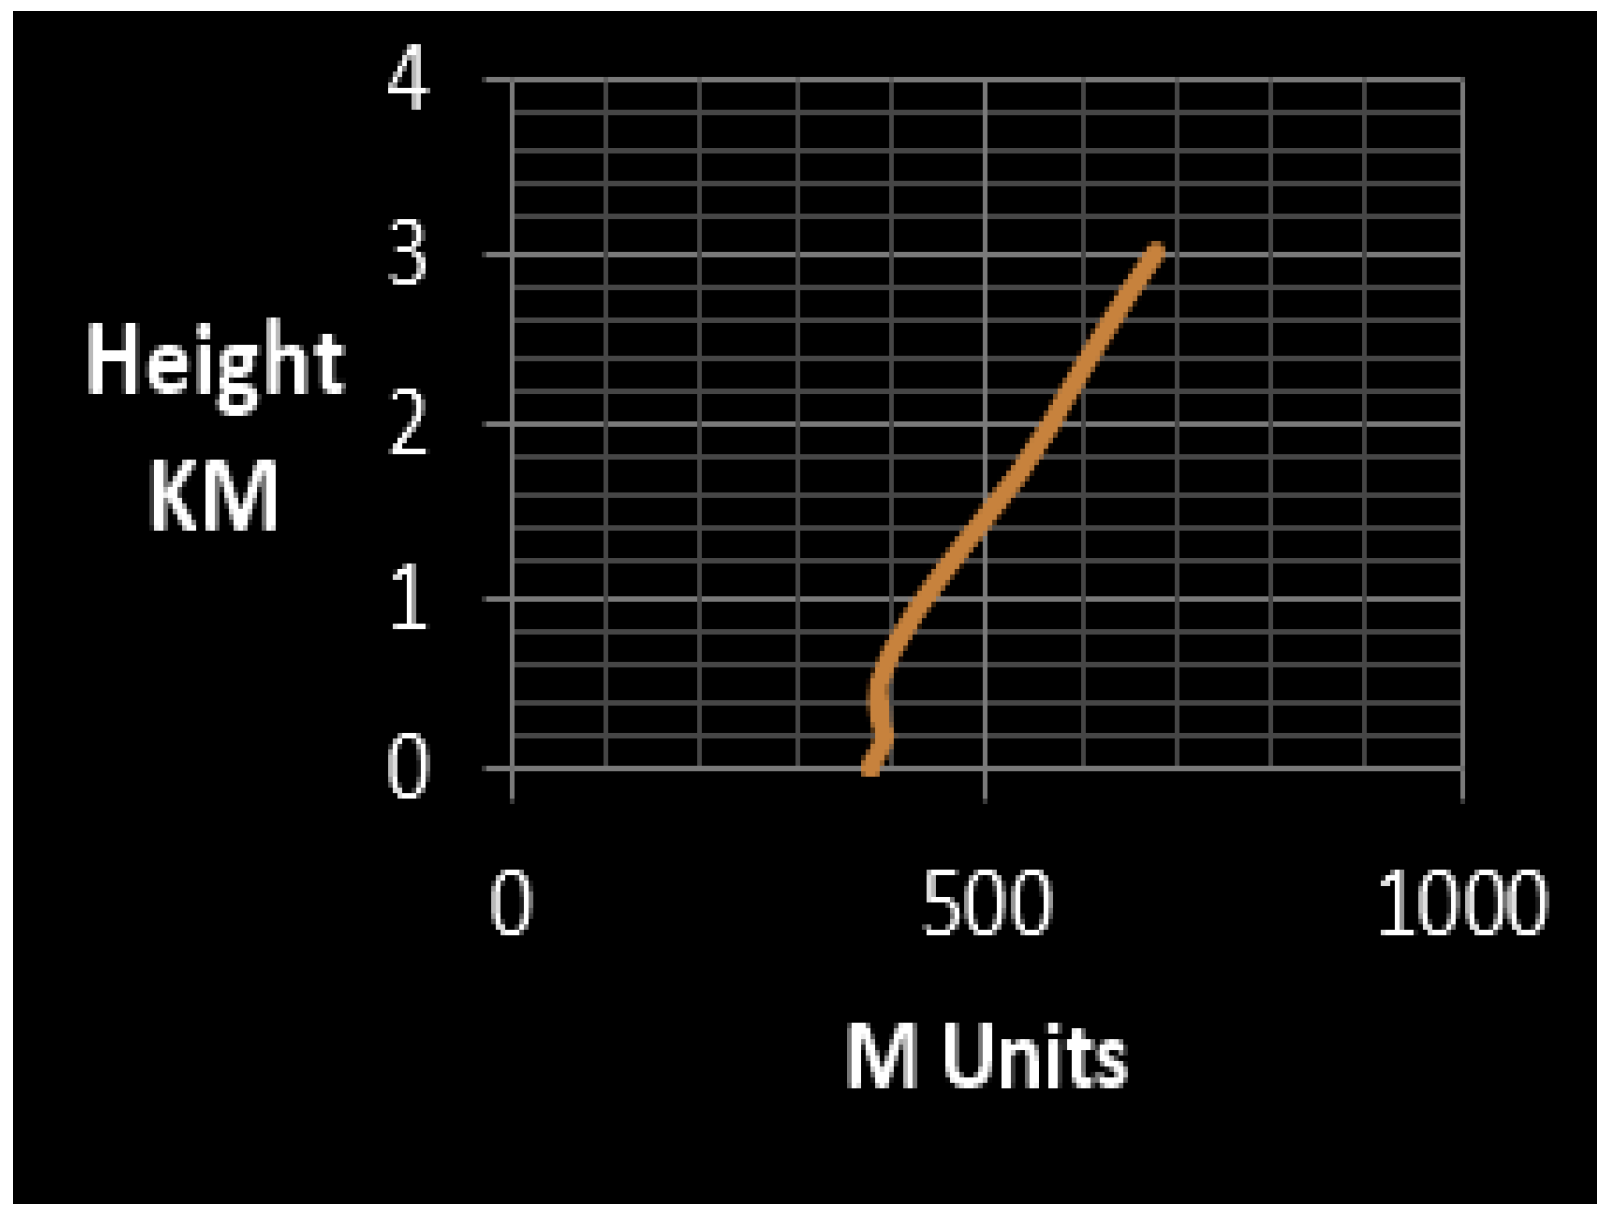
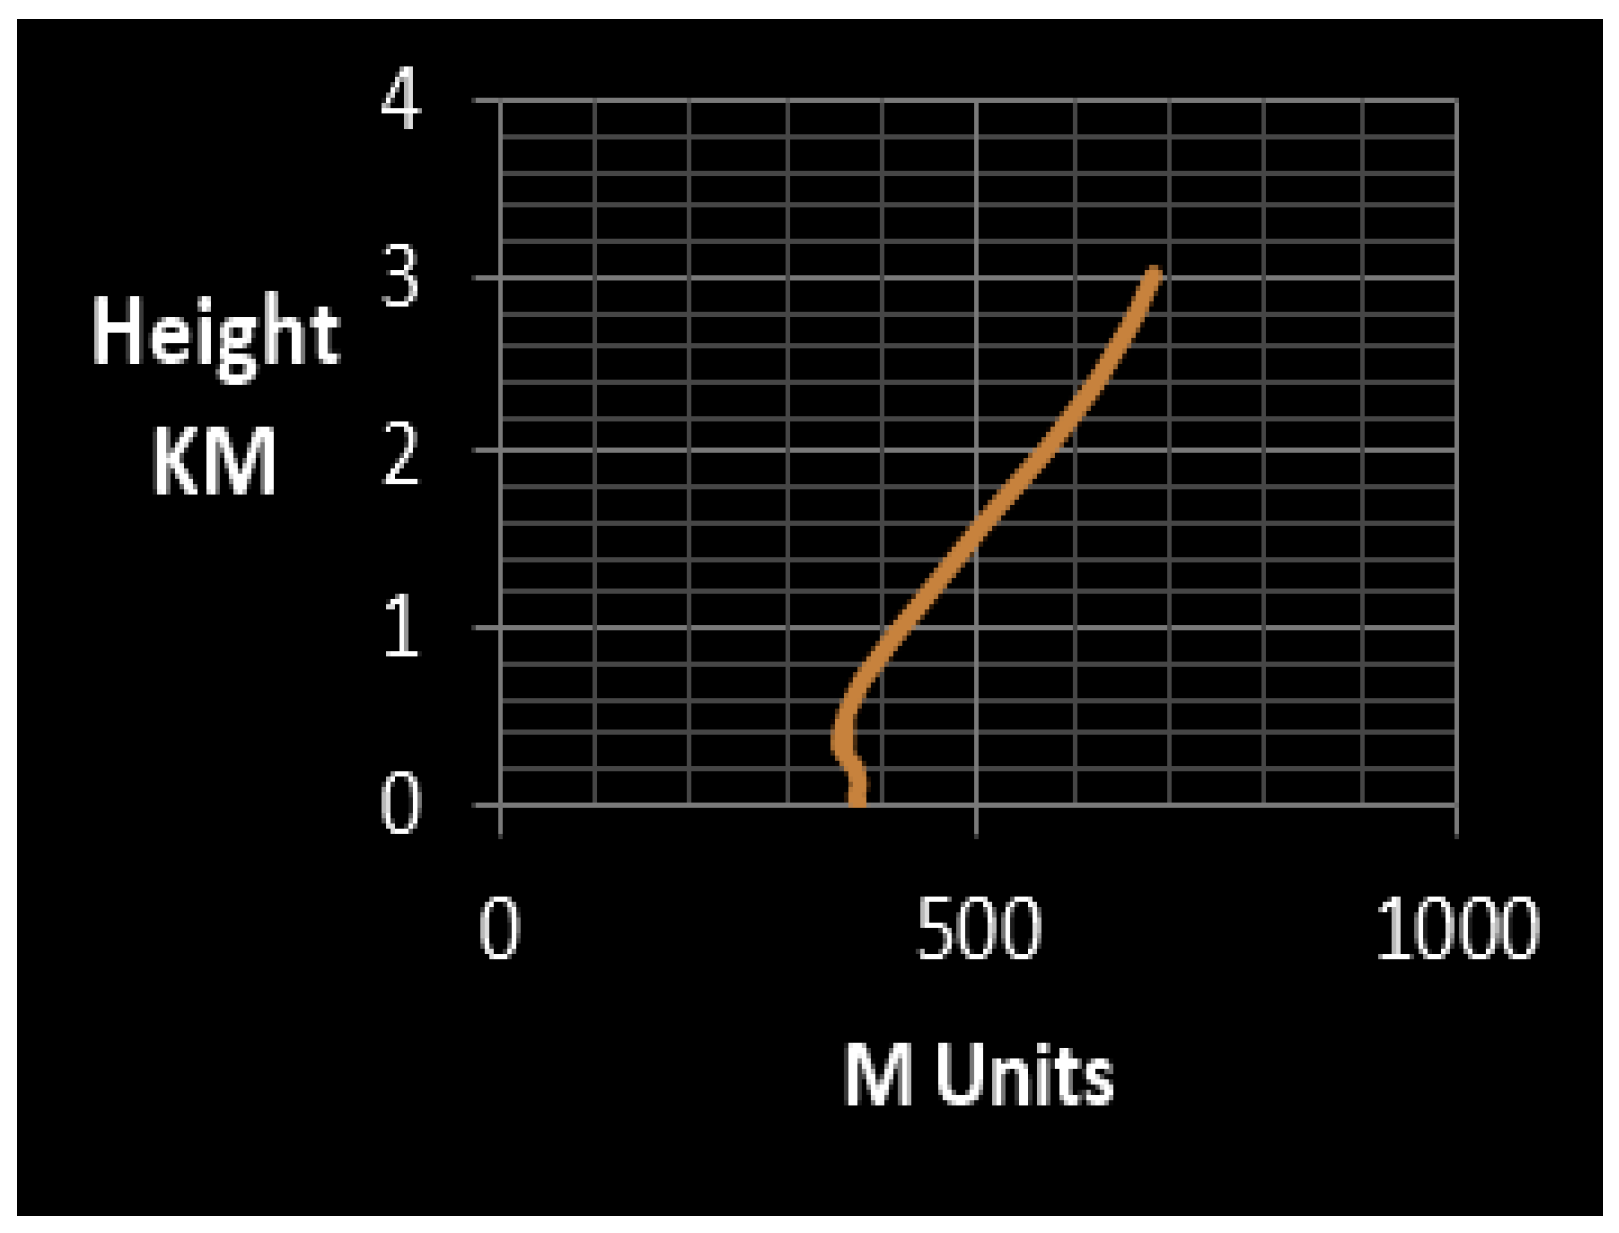
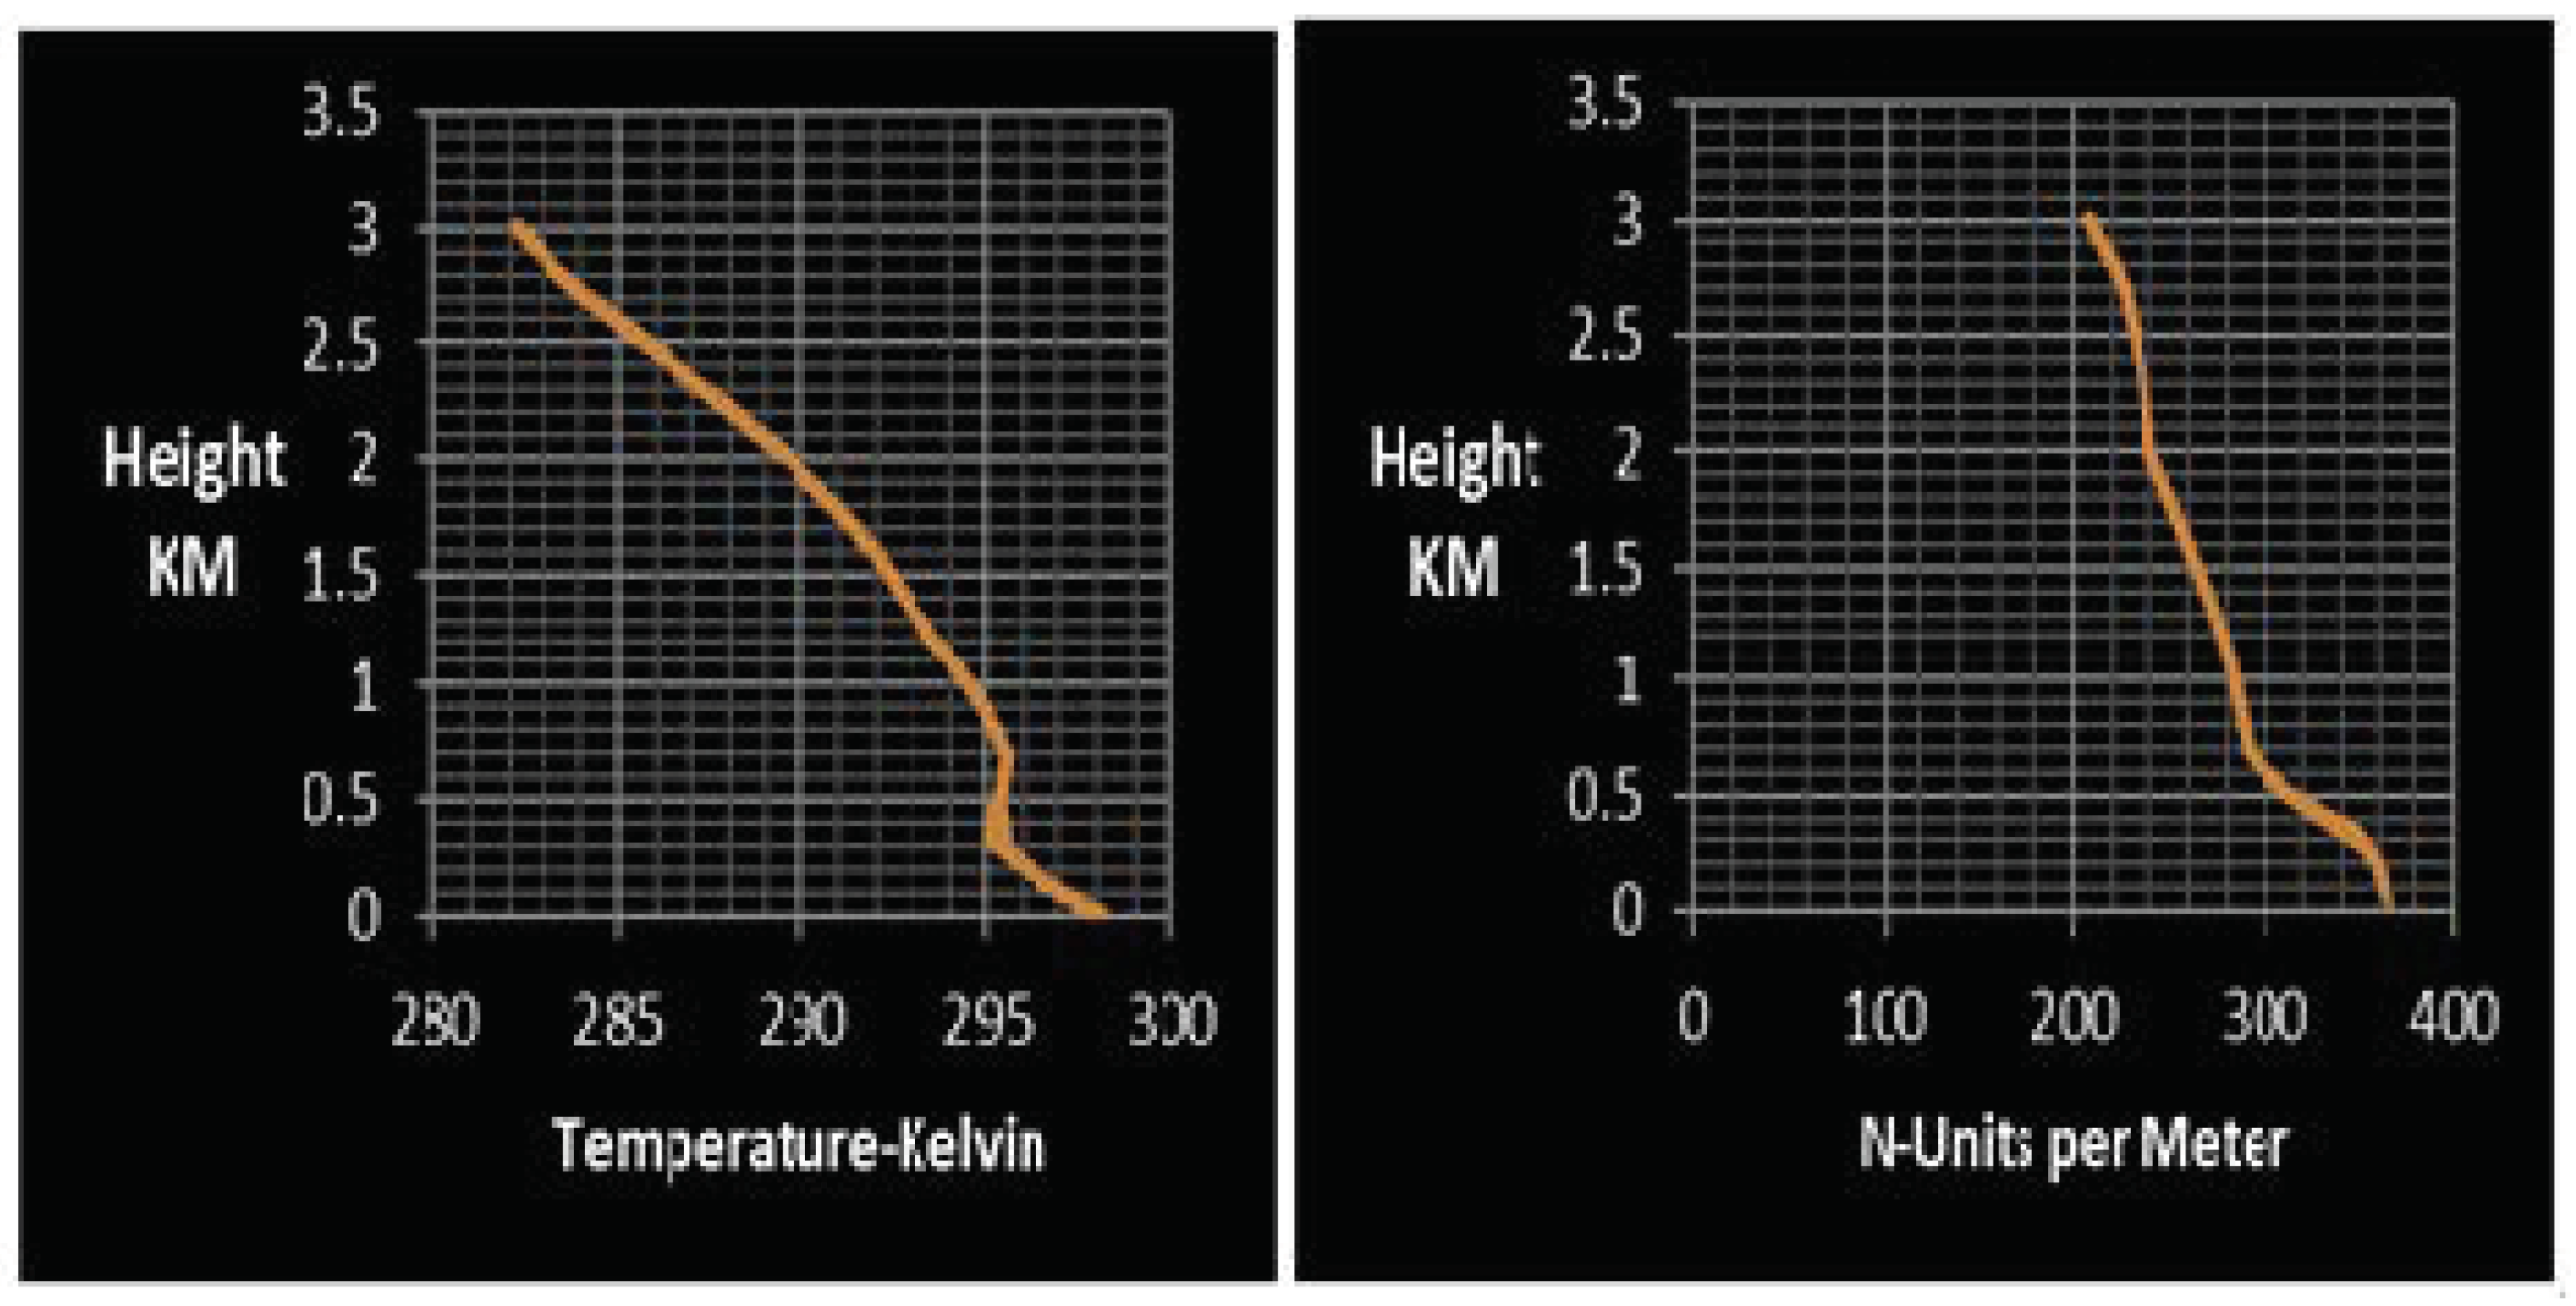
On the other hand, the maximum field strength intensity of the overseas signal under consideration occurred on 11 July due to trapping atmospheric conditions, as presented in
Figure 12. The temperature inversion, in this case, begins from the altitude of 150 m and forms a surface duct, as shown in
Figure 13.
In this regard, the N gradient exceeded −157 N/km. Under these atmospheric conditions, it is confirmed that the possibility of causing interference in the local DAB and DAB+ services will be extremely high.
Further,
Table 3 presents the medium field strength interference for the signal 95.5 MHz broadcast from Israel on the given dates. As it is demonstrated in
Figure 14, the temperature inversion begins at 400 m and is now higher than before; therefore, the level of interference was also reduced.
The DAB and DAB+ signal level from Israel is still high, as justified by
Figure 15, due to the surface-based duct, but the chance of creating interference to the local DAB Radio services is lower than before, provided that the local services will sustain a field strength intensity equal or higher than 65 dBuV/m.
Table 4 demonstrates the level of the unwanted overseas signals at specific dates and times of the monitored analog FM with respect to the simulated DAB interference. The dates and times in which the overseas DAB radio signal can cause interference at the local DAB services are highlighted in yellow. Respectively, on dates and times in which the overseas analog FM radio signals could cause interference at the local analog services (before upgrading to DAB) are highlighted in light blue. According to
Table 4, analog FM radio was affected by interference 88% during the assessment period compared to the DAB signals, which were affected by only 30%. As a result, according to the simulated data in
Table 4, the DAB radio will provide 58% better interference performance than Analog FM.
Finally,
Table 5 presents the overseas analog signal monitored in Cyprus under normal atmospheric conditions. The corresponding DAB unwanted signals are very weak as well. Thus, under normal atmospheric conditions, the unwanted signals will not cause interference with the local services.
For instance,
Figure 16 depicts a very small temperature inversion that occurred at the altitude of 900 m on 20 June 2015.
Figure 17 also demonstrates normal atmospheric conditions on 30 June 2015. In both mentioned cases, the refractive index’s value declines uniformly with height, and the standard gradient N is 39 units per km of distance.


