Article

Spectral Data Analysis for Forgery Detection in Official Documents: A Network-Based Approach

by
Mohammed Abdulbasit Ali Al-Ameri
1,*,
Bunyamin Ciylan
2 and
Basim Mahmood
3,4
1
Graduate School of Natural and Applied Sciences, Gazi University, 06570 Ankara, Turkey
2
Computer Engineering Department, Faculty of Technology, Gazi University, 06570 Ankara, Turkey
3
Computer Science Department, University of Mosul, Mosul 41002, Iraq
4
Bio Complex Laboratory, Exeter 03833, UK
*
Author to whom correspondence should be addressed.
Electronics 2022, 11(23), 4036; https://doi.org/10.3390/electronics11234036
Submission received: 11 October 2022 / Revised: 9 November 2022 / Accepted: 17 November 2022 / Published: 5 December 2022
(This article belongs to the Section Computer Science & Engineering)

Abstract

:
Despite the huge advances in digital communications in the last decade, physical documents are still the most common media for information transfer, especially in the official context. However, the readily available document processing devices and techniques (printers, scanners, etc.) facilitate the illegal manipulation or imitation of original documents by forgers. Therefore, verification of the authenticity and detection of forgery is of paramount importance to all agencies receiving printed documents. We suggest an unsupervised forgery detection framework that can distinguish whether a document is forged based on the spectroscopy of the document’s ink. The spectra of the tested documents inks (original and questioned) were obtained using laser-induced breakdown spectroscopy (LIBS) technology. Then, a correlation matrix of the spectra was calculated for both the original and questioned documents together, which were then transformed into an adjacency matrix aiming at converting it into a weighted network under the concept of graph theory. Clustering algorithms were then applied to the network to determine the number of clusters. The proposed approach was tested under a variety of scenarios and different types of printers (e.g., inkjet, laser, and photocopiers) as well as different kinds of papers. The findings show that the proposed approach provided a high rate of accuracy in identifying forged documents and a high detection speed. It also provides a visual output that is easily interpretable to the non-expert, which provides great flexibility for real-world application.

Graphical Abstract

1. Introduction

Digital forensics has significantly evolved over recent years to be an essential part of many investigations conducted by law enforcement agencies, the military, and other government organizations. This has been mainly driven by the rapid evolution of digital technology, which has led to the widespread use of digital devices, such as smartphones, notebooks, printers, scanners, and software applications. Despite the potential benefits that can be achieved through such digital technologies, some choose to exploit them illegally to manipulate or imitate official documents, i.e., document forgery. Such actions embrace many threats, especially when dealing with important formal documents such as identity documents, bank checks, medical prescriptions, paper currency, or even evidence in a court of law. “Hundreds of document forgery cases are being reported every day around the world” [1]. It is therefore of paramount importance that agencies accepting formal documents be able to verify the authenticity of such documents before accepting or relying on them. To that end, an efficient, accurate, easy-to-use, automatable, cheap, and non-destructive method for forgery detection is needed [2]. However, such a method does not exist yet [3].
Current forgery detection approaches can broadly be categorized into two main categories. The first relies on image processing techniques to identify potential forgery [4]. Most of the image processing techniques include steps that start from image acquisition, image enhancement, segmentation, feature extraction, and analysis of extracted features [5,6,7,8]. This technique, however, is relatively technically complex and has a very high computational burden [9,10].
On the other hand, the second category of methods relies on analyzing the spectra of components of the document, e.g., printing ink, writing ink, and printing paper) [11,12]. It can be argued that spectroscopic methods can have far better accuracy since they deal with the characteristics of the material used to produce the document [13]. Back in 2006, In [14], it was proposed a method for the examination of the documents inks by combining several spectral techniques, namely, micro-Fourier transform infrared spectroscopy (micro-FT-IR), Raman spectroscopy, and X-ray fluorescence methods. They were able to distinguish between different types of black and blue inks with an accuracy of up to 95%. However, the tests were destructive, which greatly limits the practical applicability of this approach. Alternatively, a non-destructive approach based on the analysis of spectral features in the UV-VIS-NIR and IR regions was developed by Gál et al. [15]. They aimed to develop a non-destructive method to differentiate between documents printed by laser versus inkjet printers. Although their approach was able to differentiate between documents printed with different types of printers, they were not able to use that approach to differentiate between individual printers of the same type and suggested that the approach needs to be optimized through a computational chemical measurement method. Furthermore, Ameh and Ozovehe [16] used FT-IR for the types of inks extracted from printed documents. The extracted inks were compared using two different printer cartridge brands. The results demonstrated that FT-IS may be used to examine inks on papers by picking extremely tiny regions from irrelevant portions of the document. They also discovered that FT-IS was an effective, straightforward, and repeatable approach for differentiating printing inks.
“Laser-induced breakdown spectroscopy (LIBS), is one of the most used methods to obtain the spectra of materials and has a great potential for forgery detection applications” [17]. It has gained immense interest from forensic scientists as it provides them with the capabilities for analyzing and identifying various traces from forensic evidence including but not limited to inks, drugs, hair, bloodstains, and fingerprints [17]. LIBS is also a non-destructive tool, which makes it useful in enhancing the interpretability of ink images for the determination of ink age, backdated and forged documents [18], overwritten scripts [19], and the dating of manuscripts [20].
Several applications of LIBS around forgery detections have been illustrated. Cicconi et al. [21] employed LIBS to assess difficulties with commercial inks in their investigation. The research studied pen inks for one paper type and many paper kinds and determined the deposition sequence of stacked inks. They also examined signatures and toners from a disputed paper (DQ). The researchers then detected up to seven distinct metals in the inks tested, allowing them to fully differentiate all eight black inks on a single type of printing paper. The validity of the categorization was lowered when the inks were tested on 10 different sheets for a variety of reasons. The existence of the same ingredients in both the ink and the paper ablated concurrently with ink was one of the causes. Another difference was the varied uptake of inks into paper. Five out of six times, the testing at three crossing sites using a pair of black or blue inks was effective.
As could be seen from this literature review, most approaches for forgery detection have difficulties achieving high detection rates while keeping the computational burden and complexity levels low. There is a clear need for an easy-to-use approach (ideally fully automatable) that can achieve a high detection rate with fewer computations and at a low cost. This study proposes a new approach for forgery detection based on the analysis of LIBS spectra using concepts of complex networks. Our focus is to address the following limitations of previous forgery detection methods:
  • The level of complexity and computational burden;
  • Efficiency and detection rates;
  • Ease of use and accessibility by non-experts;
  • Adoption costs.
To the best of our knowledge, the proposed method is one of the very first trials of the integration of complex networks and digital forensics fields.
The rest of this paper is organized as follows. Section 2 sets the context for the article by providing a theoretical background about the major technique employed, which was the LIBS. The proposed research method is presented in Section 3. The results and discussion of the research are presented in Section 4. Finally, we conclude this paper in Section 5.

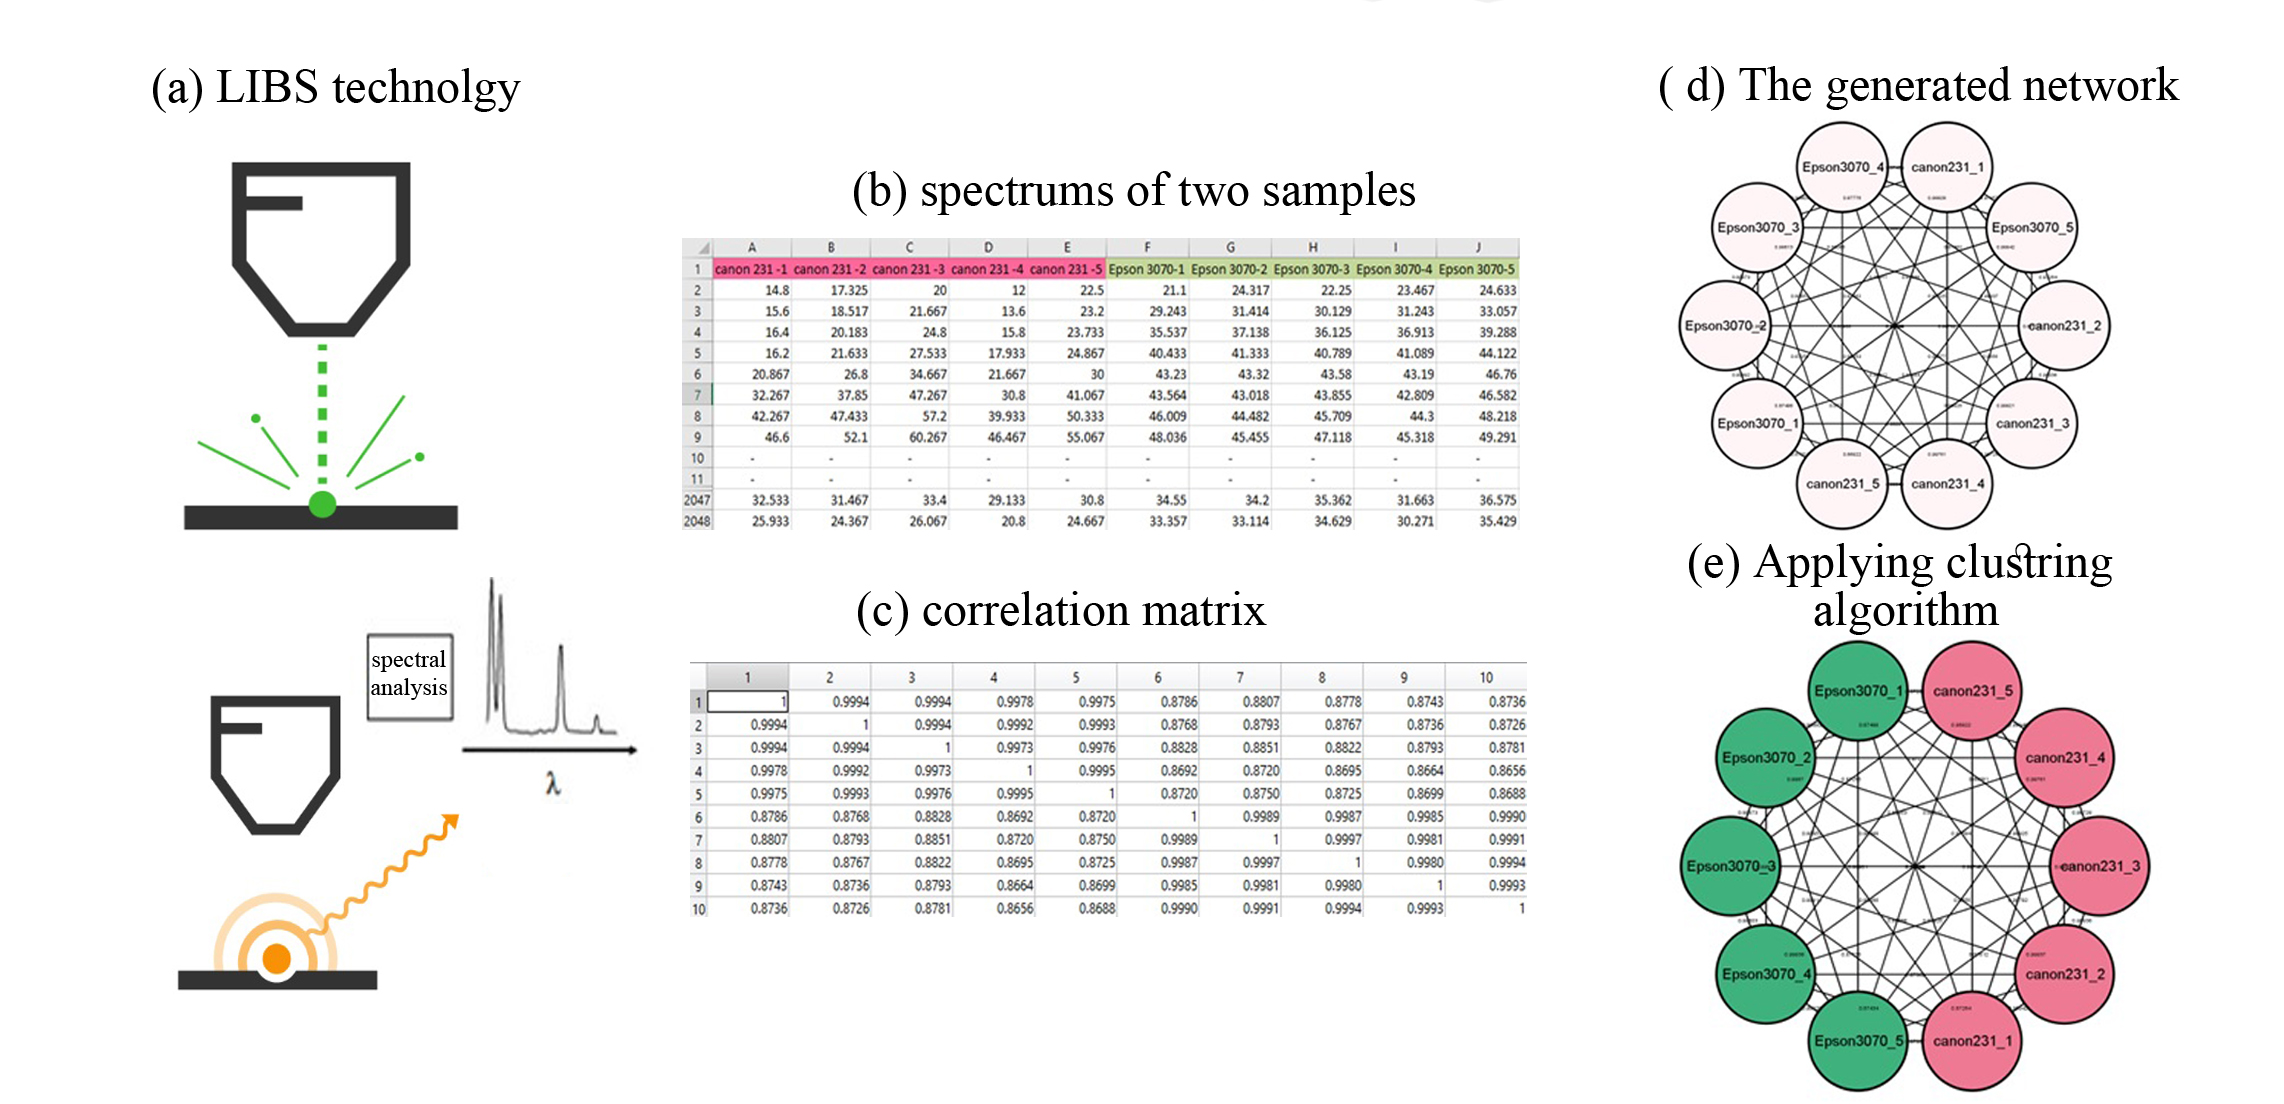
2. Laser-Induced Breakdown Spectroscopy

LIBS is an analytical technique of elemental analysis in real-time to identify and analyze biological and chemical materials in different cases of gases, liquids, and solids. LIBS provides information on the material’s elemental composition, which is considered essential information in sample analysis. LIBS technology is based on laser-generated plasma for elemental analysis where pulses from a laser as the excitation source (e.g., Q-switched Nd: YAG) are focused on the surface of the target material to atomize a tiny amount (in the range of nanograms to picograms) of material under examination resulting in vaporization, atomization, and formation of the plasma as shown in Figure 1. As a result of the high temperature of the resultant plasma, the expelled material is disassociated into excited ionic and atomic types. As excited atoms and ions retreat to lower energy levels, they generate distinctive optical light. The detecting and spectral analysis of the optical radiation produced by this technique are used to establish the sample’s elemental composition dependent on each element’s unique emission spectrum (atomic emission lines) [22,23].
The LIBS device consists of several main parts [25], and its components and apparatus are as follows:
  • Laser source: generates the light pulses used to create the plasma plume;
  • Focusing optics: the optical system used to focus the laser beam on the target material;
  • Target container: place a sample that needs to be hit by the laser;
  • Sample: the sample to be tested (this component relates mostly to the test);
  • Light collection unit: collects and transports the plasma spectrum wavelengths to the detection system through fiber optical cable;
  • Spectral analysis unit: a detection system (or spectrum analyzer) used to provide the spectral analysis of the emitted light of the target by spectrally dispersing the light;
  • Detector: collects and records the resulting spectrum records them in terms of intensity and wavelength;
  • Computer: to control the laser synchronization, detector gating, and other configurations and store the spectrum;
  • Delay-gate generator: used to provide a specific time delay before the spectrum analyzer starts to collect the emitted light from the plasma.
LIBS is a simple spectroscopy technique. It is a method of atomic emission spectroscopy (AES). The LIBS has significant advantages as the following [26,27]:
  • Materials’ elemental analysis in solids, gases, and liquids;
  • Can detect and analyze all sample elements simultaneously with a single laser pulse;
  • It is low cost compared to other conventional techniques (e.g., LA-ICP-MS);
  • Can be miniaturized and portable to allow the field analysis of evidence to be at or near a crime scene;
  • Analysis of solid materials directly, without the need to solubilize the material;
  • Because each laser pulse ablates a small quantity of material (in the nanograms to picograms range) during the LIBS operation, the technology is deemed non-destructive;
  • LIBS is a speedy technique; the ablation and evaporation processes are executed in one step;
  • Possible multi-elemental simultaneous analysis;
  • LIBS technique does not require sample preparation as in other spectroscopic techniques.
Similar to other technologies, the LIBS has limitations such as the following [26,27,28]:
  • Difficult to get suitable standards (semi-quantitative);
  • Precision decreases by (usually 5–10%) as compared with other spectroscopic techniques;
  • It cannot be believed that spectra acquired from the same material using different LIBS instruments would match perfectly. This is because the strength of emission lines is determined by the specific system settings and components employed (spectrometer, detector, laser, optics);
  • Other limitations such as spectral matrix interference, sample heterogeneity, and differences in physical properties of the sample (e.g., reflectivity and hardness of the surface).
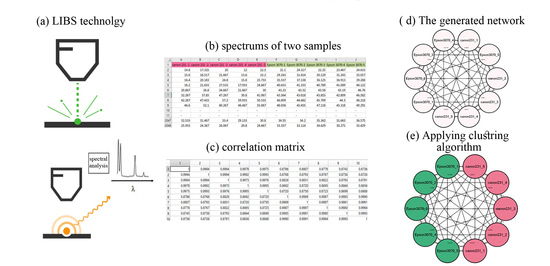
3. Research Method

3.1. General Workflow and Testing Scenarios

The basic principle of the proposed framework is that documents printed with different printers can be differentiated through the differences in the LIBS spectra they produce. The first step in using the proposed framework is, therefore, to obtain the LIBS spectra of the document(s) to be tested. The LIBS device model type is LIBSLAB. Then, the spectral data are processed to construct a network. Finally, a clustering algorithm is applied to identify the number of clusters that the spectra can be grouped into. This is then used to decide whether the spectra originated from documents printed with the same printer/paper. We applied these three basic steps to several scenarios expected to be encountered in the context of the forensic examination of official documents.

3.1.1. Scenario 1: Comparing a Questioned Document with an Original Document

In this scenario, 12 samples were printed using 12 different printers (listed in Table 1), which were either laser printers, inkjet printers, or photocopiers. For every printer/photocopier considered, three boxes (5 cm × 5 cm) filled with black ink were printed on white A4 office paper. The types of papers used in this work are also listed in Table 2.
The printed samples are then compared pairwise, considering one of them an original document (DO) and the other a questioned document (DQ). The forgery detection strategy in this work was determined by the number of clusters retrieved from the created networking systems after applying some clustering algorithms. If the ink spectra of the original and DQ appear in one cluster, the DQ is considered original, as it means they have the same physical features and were produced using the same printer and materials. On the other hand, if they appear in two separate clusters (each document’s spectra in an isolated cluster), the DQ is considered forged as they were produced using different printers. In this context, the decision of forgery detection in this research depends on examining the printing ink in the documents. Algorithm 1 demonstrates the general workflow of the proposed framework. Various steps of the algorithm are described in more detail in the following sections.
Algorithm 1: General workflow of the proposed approach.
Input: two documents: Original (DO) and Questioned (DQ)
Output: Whether the DQ is forged
START
Step1: SET                     LIBS configurations
Step2: ACQUIRE                   5 LIBS spectra for each DO and DQ
Step3: CREATE      the Correlation Matrix (CM) among the acquired spectra
Step4: CONVERT                 the CM into Adjacency Matrix (AM)
Step5: FORMALIZE     AM into a dataset of nodes and edges and create the network in Cytoscape software
Step6: APPLY               Clustering algorithms
Step7: IF                       # of Clusters =1
  THEN                 DQ is Original
     ELSE                      DQ is Forged
END

3.1.2. Scenario 2: Detecting Partially Forged Documents

In this scenario, a document was assumed to be original; however, some part(s) of the document is of questioned originality. A very similar approach to the above can be applied to a single document and detect whether it was forged in some parts. However, the LIBS spectra in this scenario were obtained from the original as well as the questioned parts of the same document. If all spectra appeared in one cluster, the whole document was considered original. Otherwise, the document was considered partially forged.

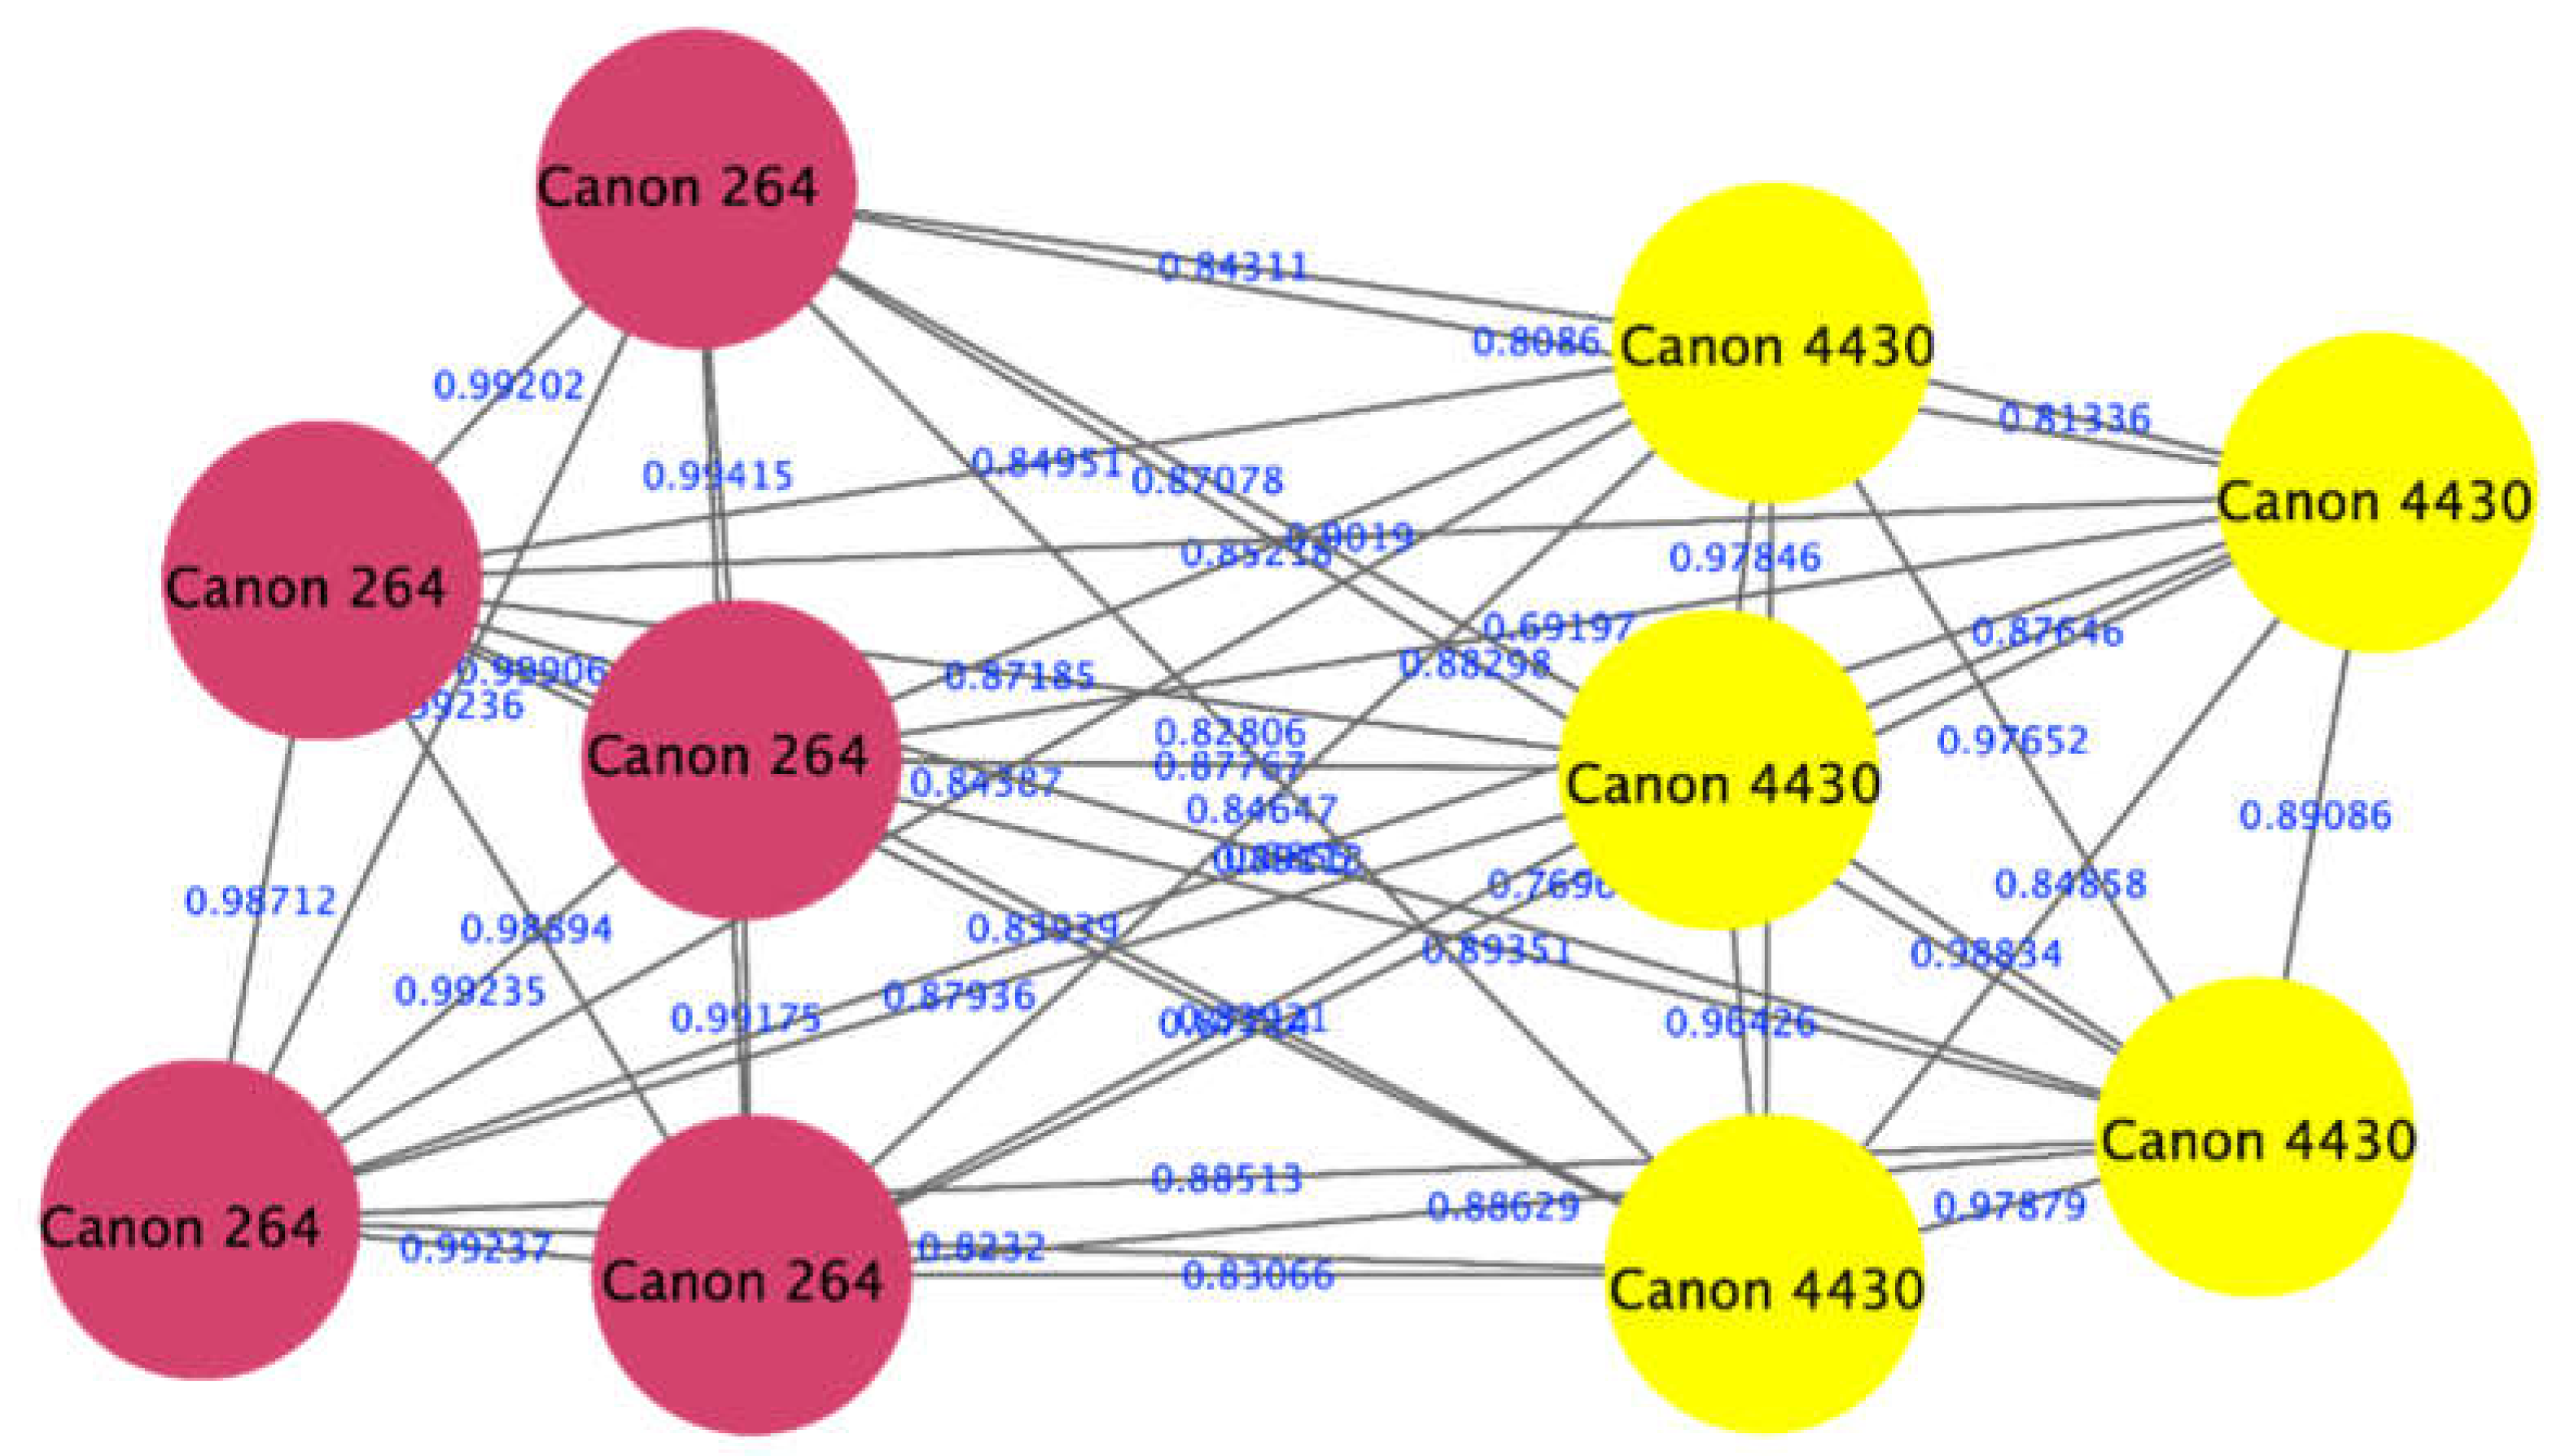
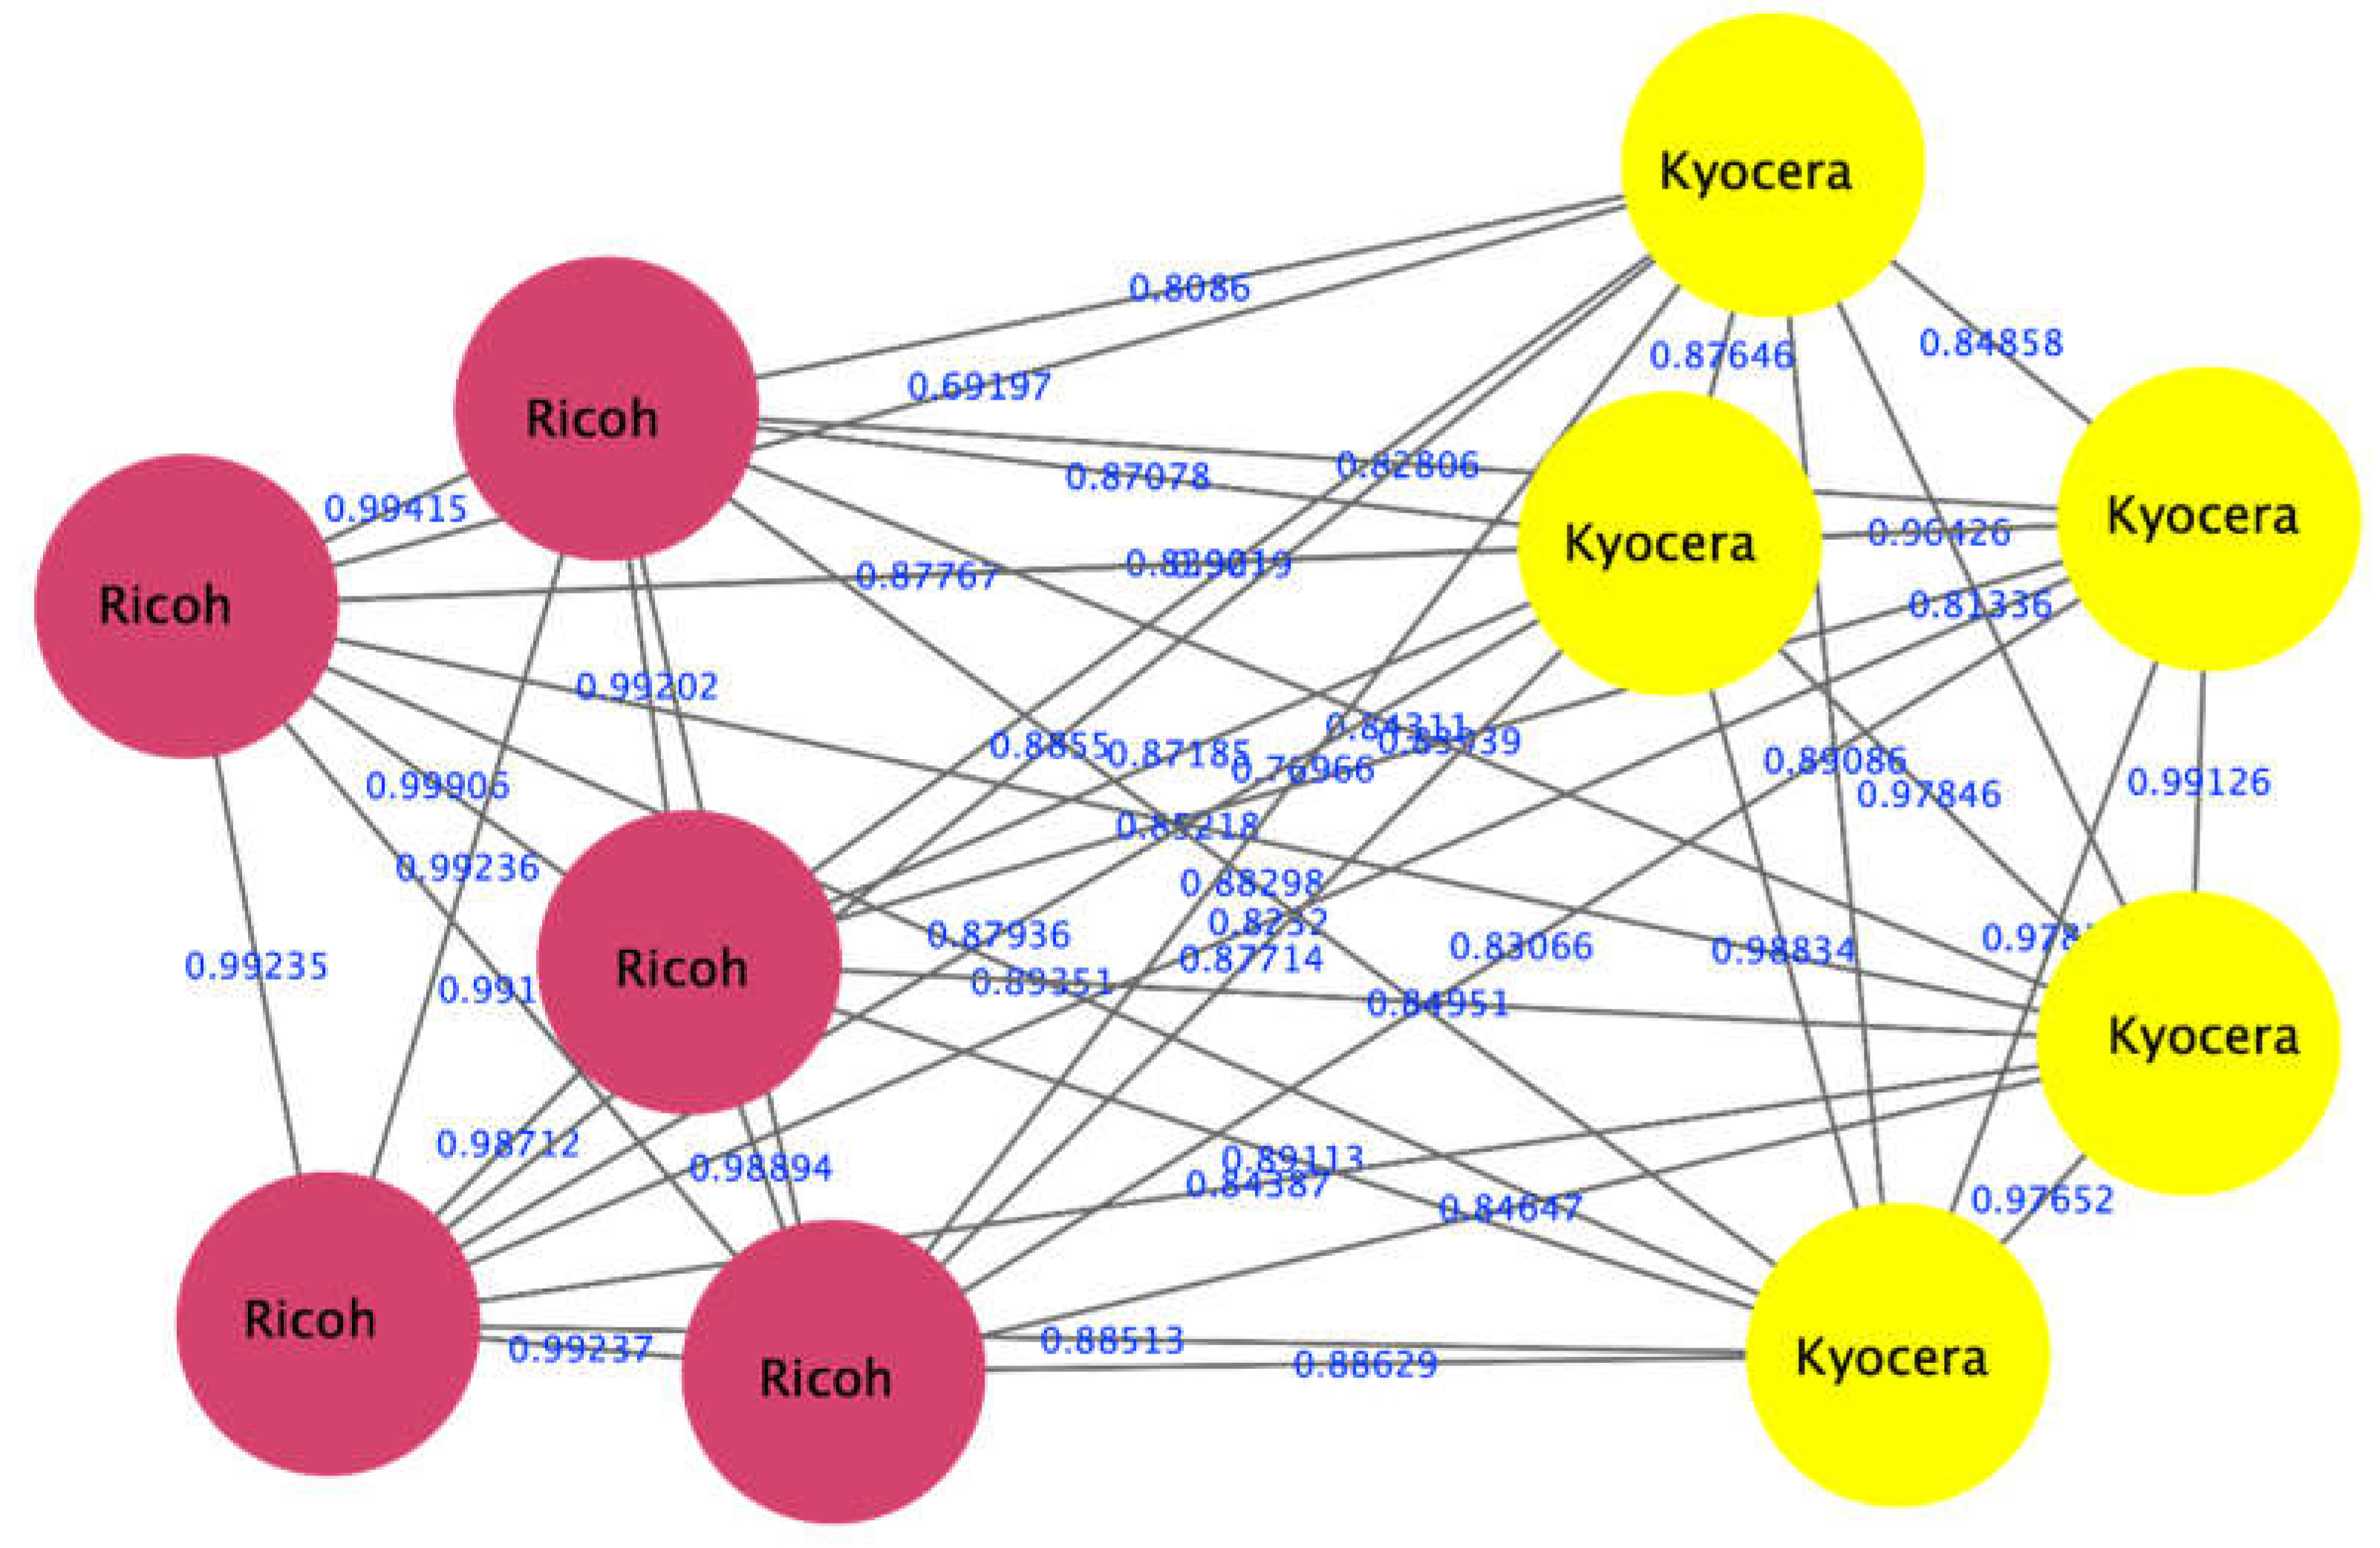
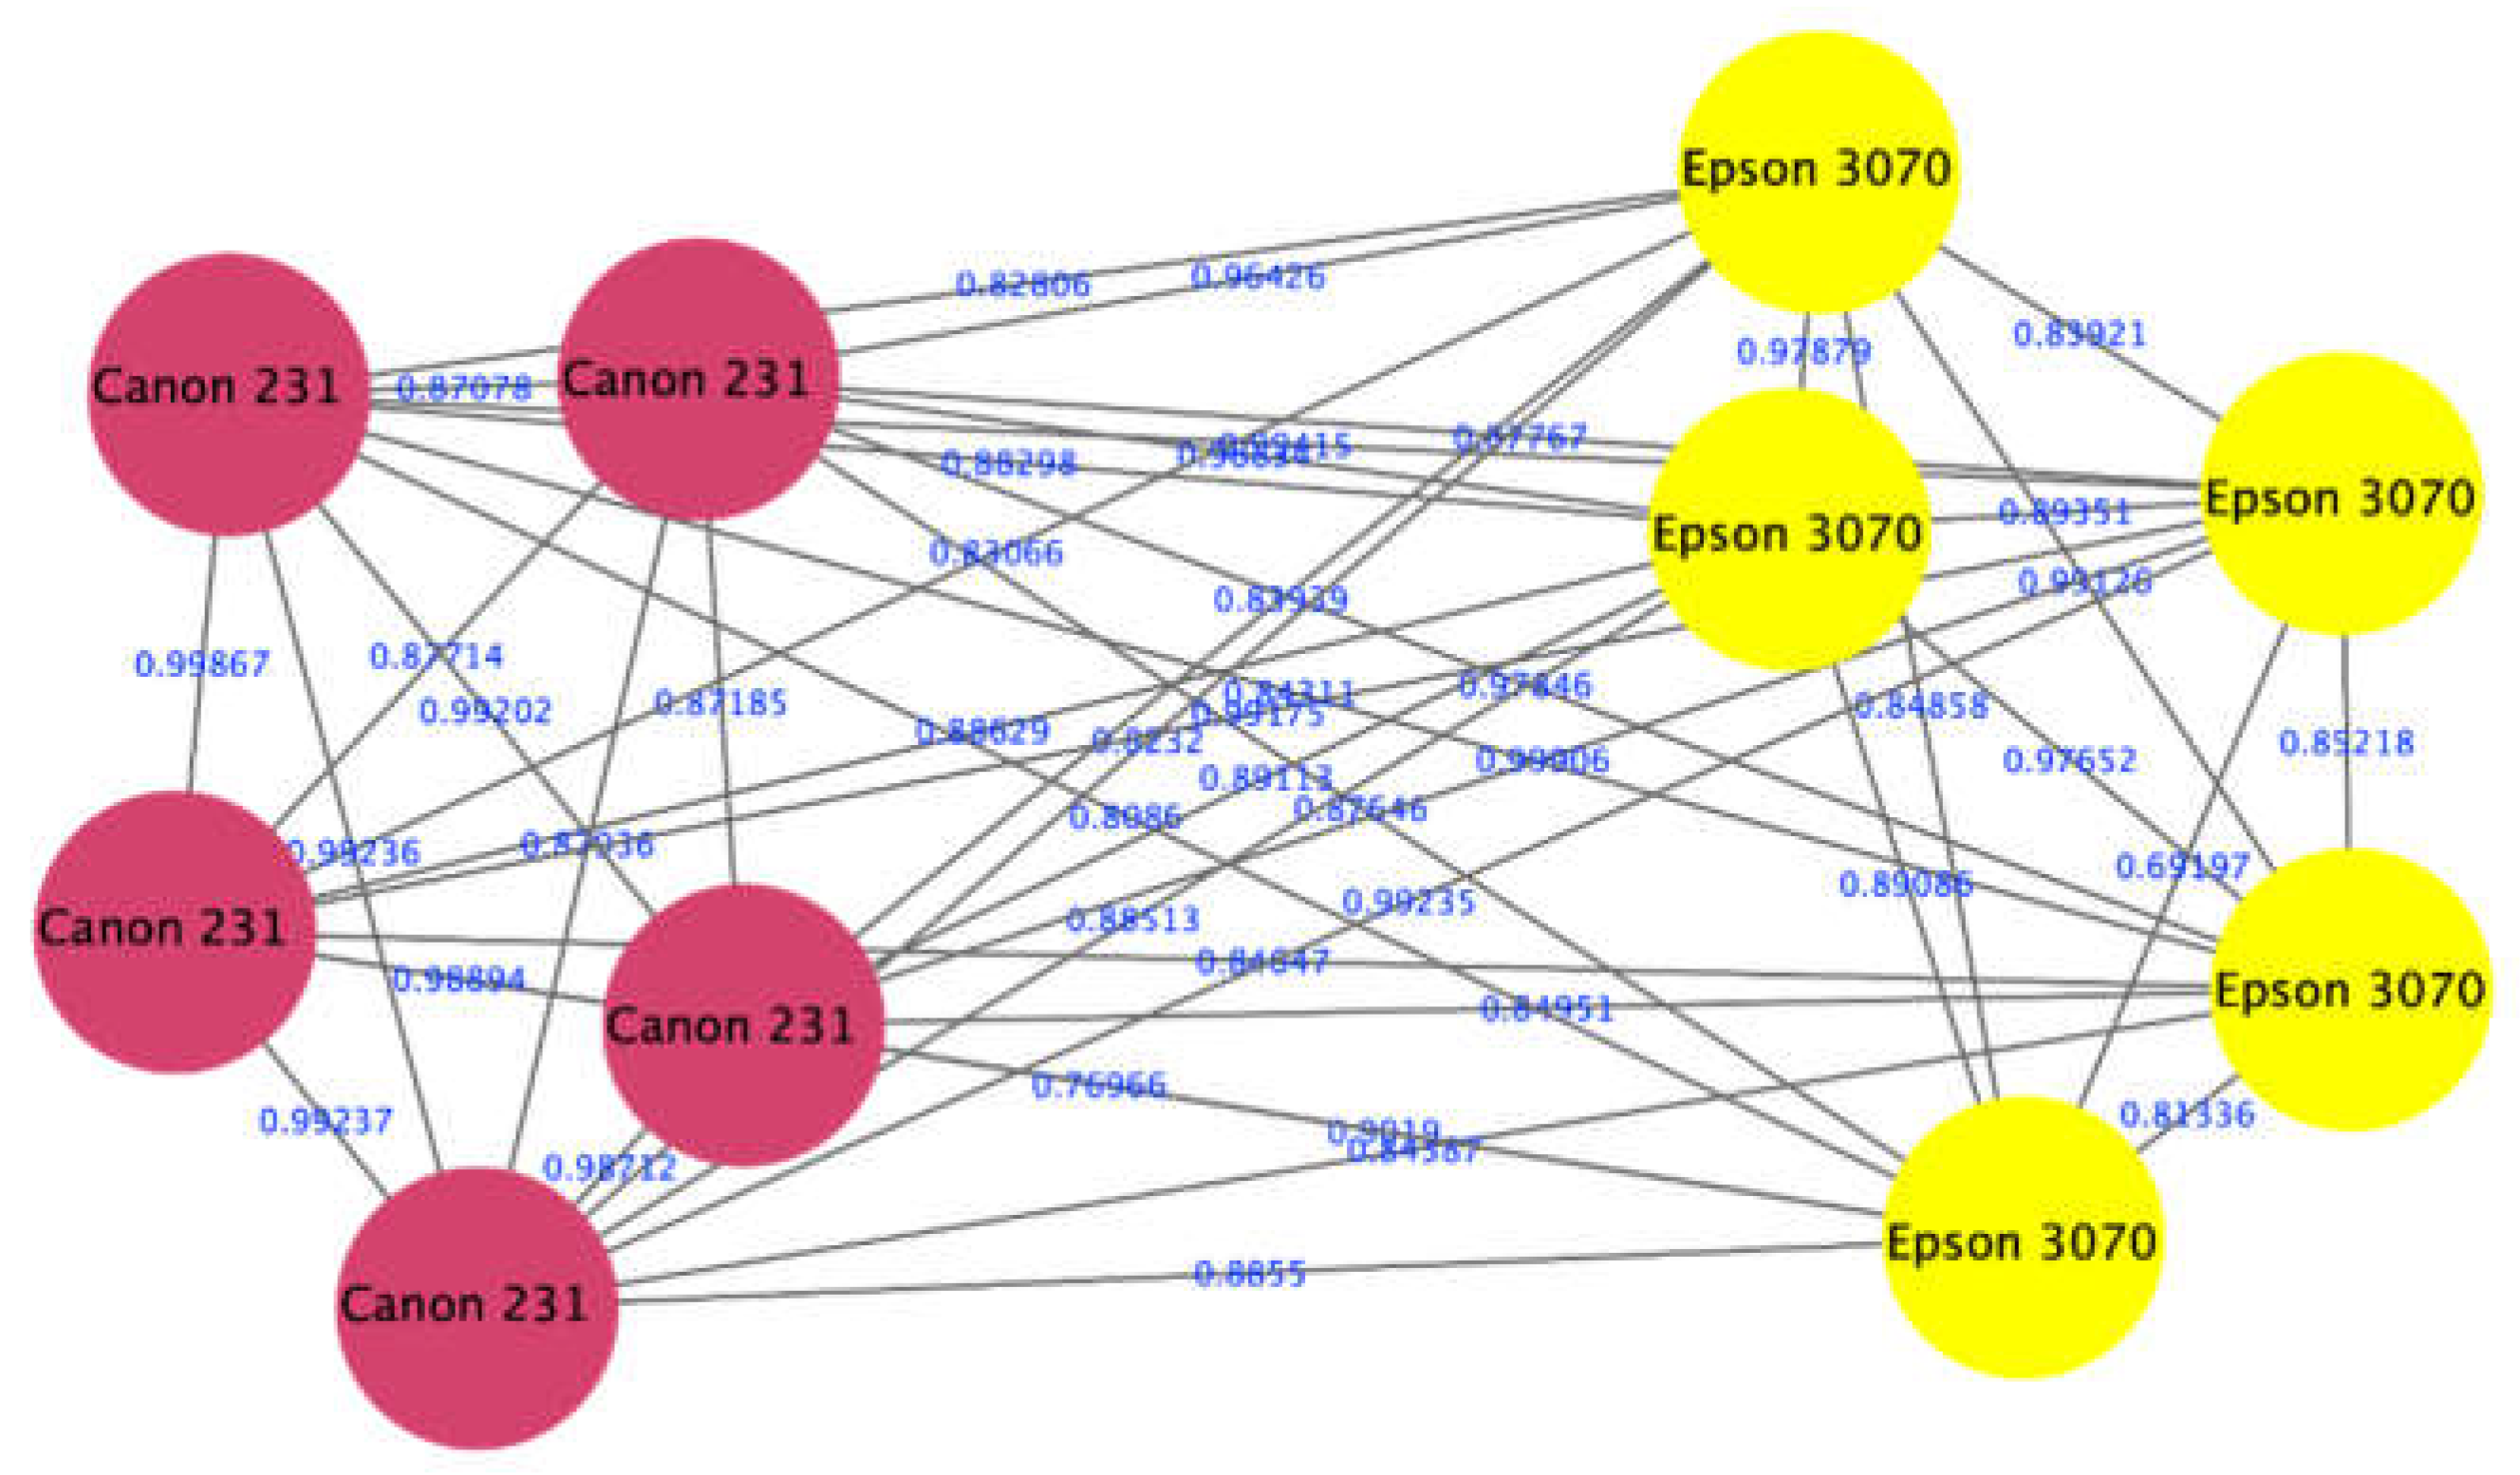
3.1.3. Scenario 3: Identification of Printer Type

Identification of the type of printer used in printing a DQ can provide important forensic evidence. The proposed approach was tested for its ability to distinguish laser printers from inkjet printers. This was done by clustering the spectra of inks for several laser and inkjet printers and then adding the spectra of the DQ the re-clustering again. The cluster within which the spectra of the DQ appears then identifies the type of printer used to print it. That is to say, if the spectra of the DQ appear in the cluster of the laser printers, then the DQ was printed using a laser printer, and vice versa. This scenario has been tested on the whole DQ, as well as parts of the DQ, for detecting the printer type used for printing partially forged documents.

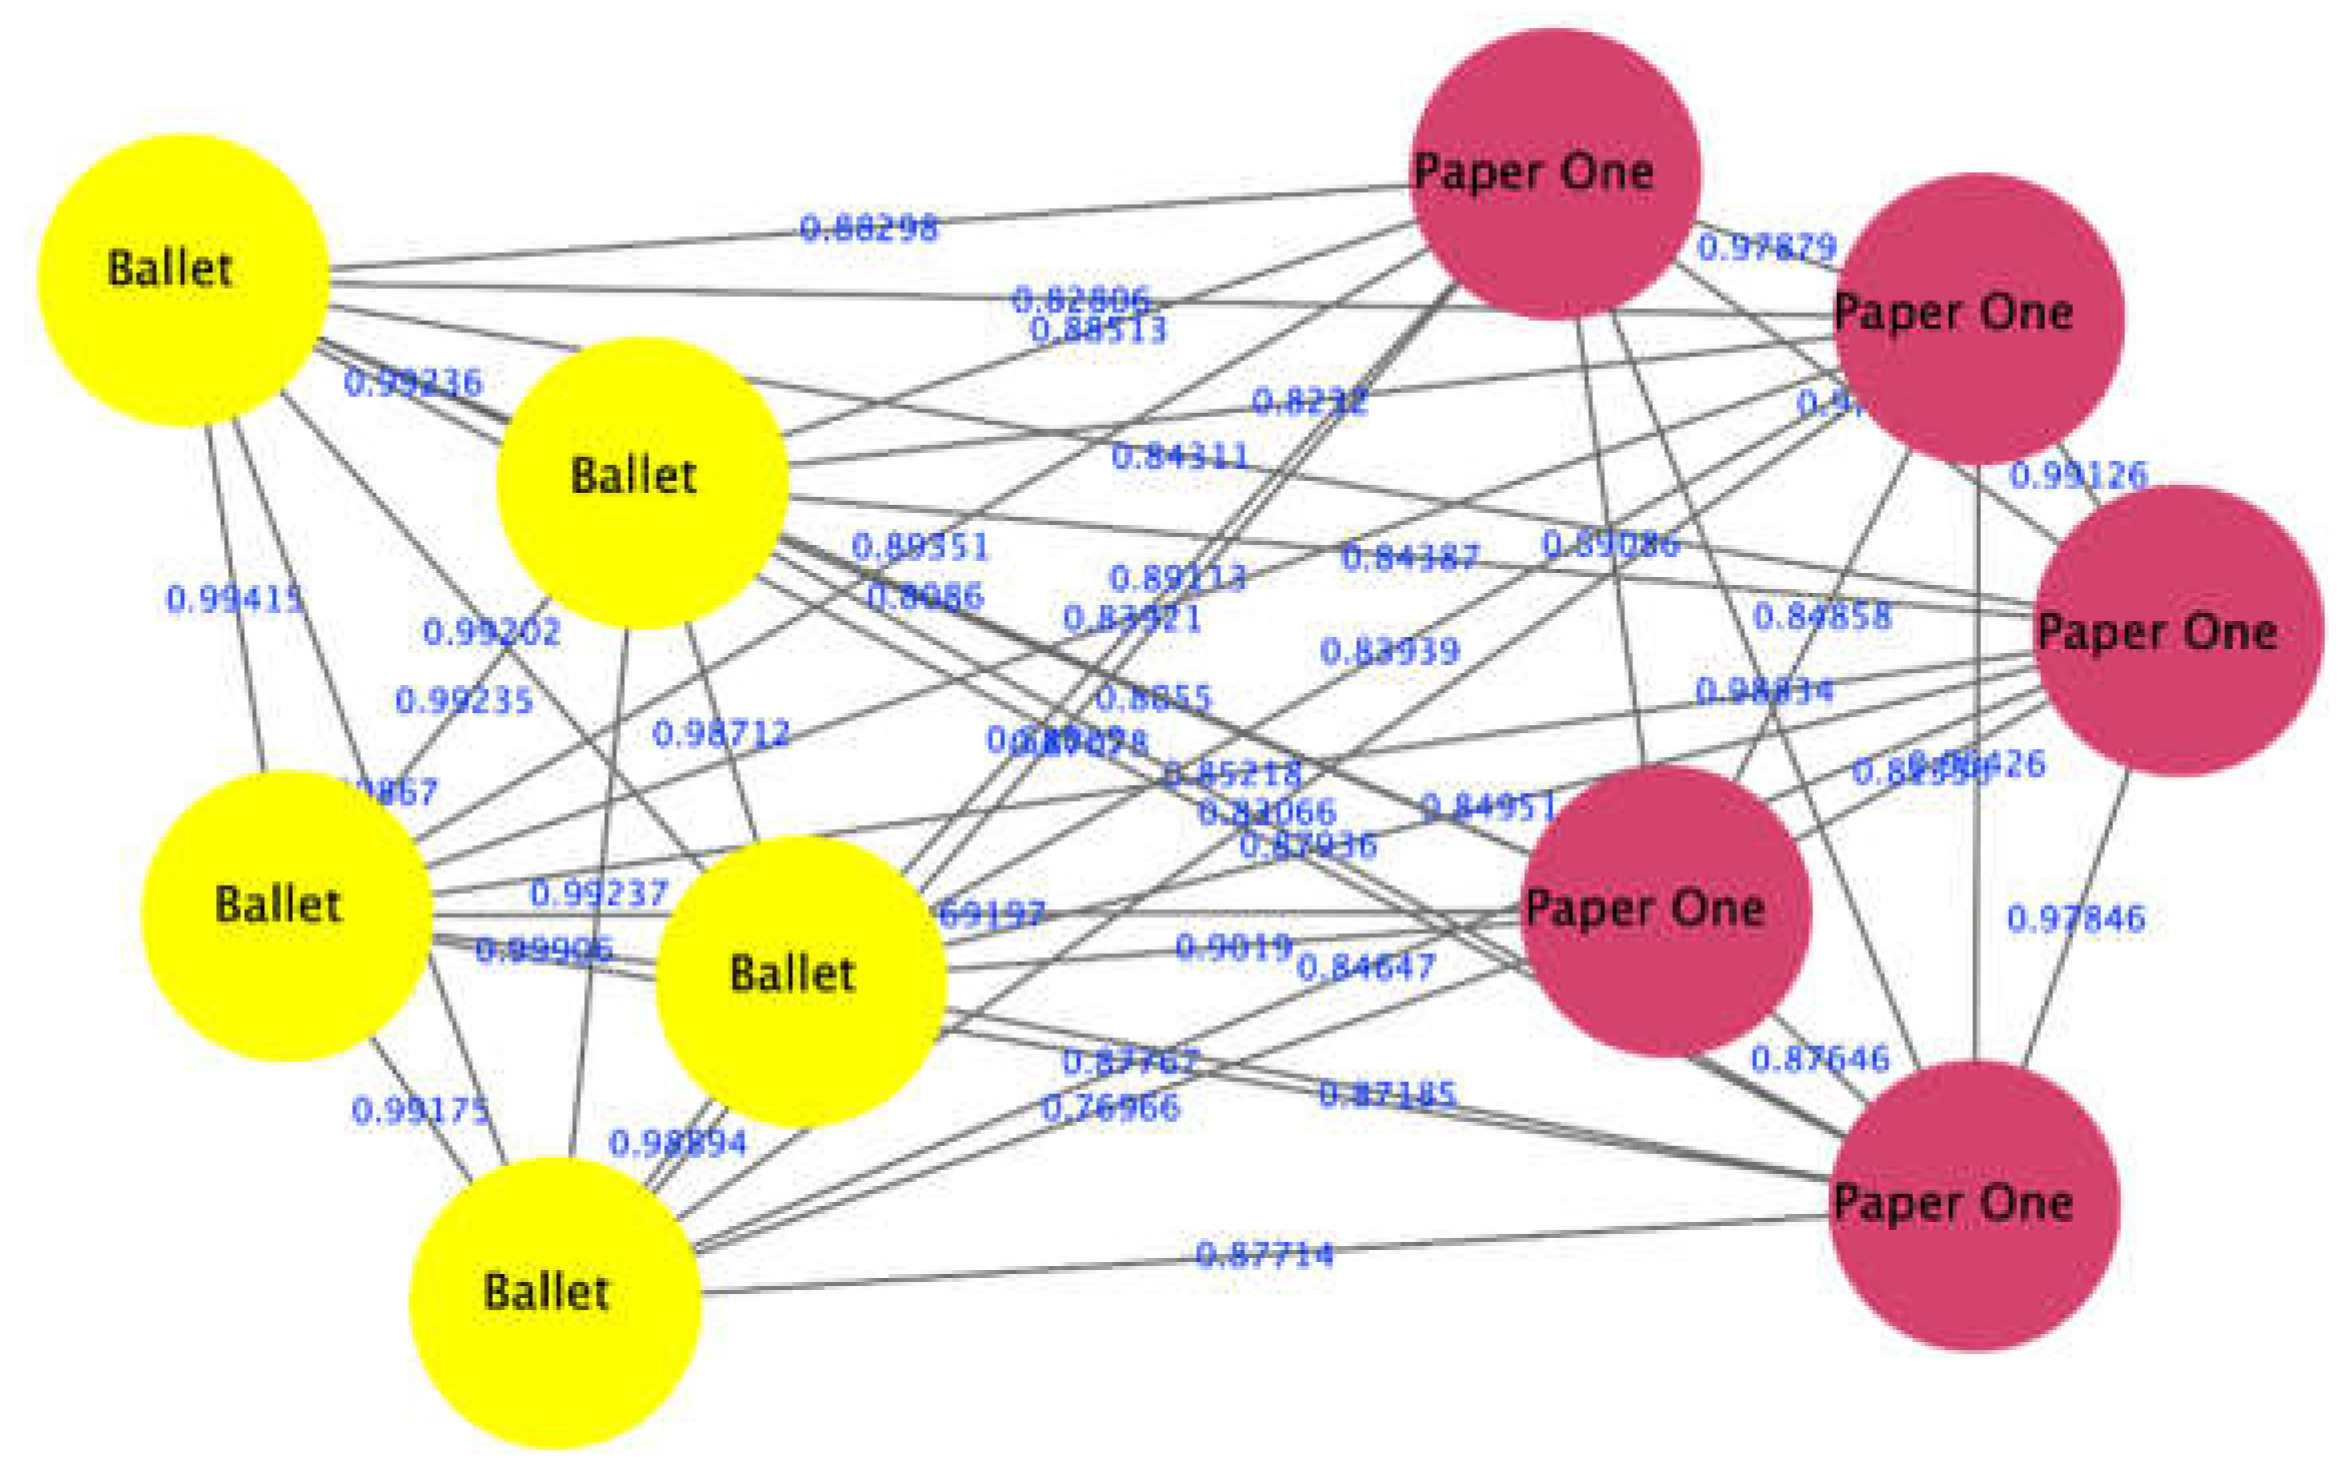
3.1.4. Scenario 4: Identification of Paper Types

Identification of the type of paper on which a DQ was printed can provide important forensic evidence. The proposed approach was tested for its ability to differentiate plain papers (no printing) from different brands. This was done by clustering the spectra obtained from different paper brands in the same way as scenario 3, however, with plain papers instead. Ten different combinations of paper brands listed in Table 2 were used to test the ability of the proposed approach to differentiate between them.

3.1.5. Scenario 5: Comparing Different Clustering Algorithms

The proposed approach under our framework was compared in terms of accuracy on various select cases against other clustering algorithms, namely, Louvain, K-Medoids, and farthest first traversal (FFT) algorithm. The benchmarking algorithms were adjusted to fit the purpose of this work.

3.2. LIBS Setup and Spectroscopy of Samples

Before starting to collect the spectroscopy of the samples, the LIBS system has to be calibrated. The LIBS system’s calibration process was carried out to be suitable and fit the proposed approach in terms of the documents’ spectrum’s physical properties. To this end, copper (Cu) metal was tested, and the emission spectrum lines were extracted for it and compared with the emission lines of the standard ranges of the National Institute of Standards and Technology database (NIST). The emission lines were identical, which confirmed the accuracy of the LIBS system used.
A series of experiments were performed to determine the optimal settings and configurations for our intended purpose. The optimal settings determined were as follows:
  • The plasma was produced using a Q-switch Nd: YAG laser generating 1064 nm with a pulse length of 10 ns;
  • The measurements were made using a laser pulse energy of 120 mJ;
  • The laser beam was focused onto the sample surface using a converging lens with a focal length of 100 mm;
  • The target was put in the sampling stand, with a separation of 10 cm between the focusing lens and the sample;
  • The optical fiber was set at a 45° angle, with the beam axis 5 cm away from the sample;
  • The light emitted from the laser-induced plasma was gathered and focused on the optical fiber apertures, diameter (200 m/0.22 NA) by a collimator lens (perfectly matched with the optical fiber entry);
  • A spectrum analyzer (Model Spectra View 2100) with a grating and charge-coupled device (CCD) was used to receive and disperse the emitted spectrum of the target by fiber optical cable and record it in terms of intensity against wavelength;
  • For recording the spectrum in the PC, the LIBS was supplemented by Visual Spectra 2.1 software. The wavelength was captured between the wavelengths of 173.0 and 956.0 nm.
It should be mentioned that the LIBS configurations were accurately determined after several experiments. Therefore, changing these configurations may not work in the proposed approach. More precisely, the characteristics of the documents’ network in terms of the correlations among nodes are based on the physical features of the retrieved spectra. Any change in the LIBS configurations may reflect different values of the spectra and eventually lead to different correlations. This work makes it easier for future considerations of the other investigators in this field.
Five independent LIBS spectra were acquired for each sample. Each independent spectrum represented a fresh spot in the sample and was composed of 2048 spectral points, corresponding to absorbances at various wavelengths between 173 and 956 nm
The LIBS device that was used in acquiring the spectra of the samples was kindly provided by the University of Babylon/Department of Laser Physics, for which the principal investigator had obtained authorization to use.

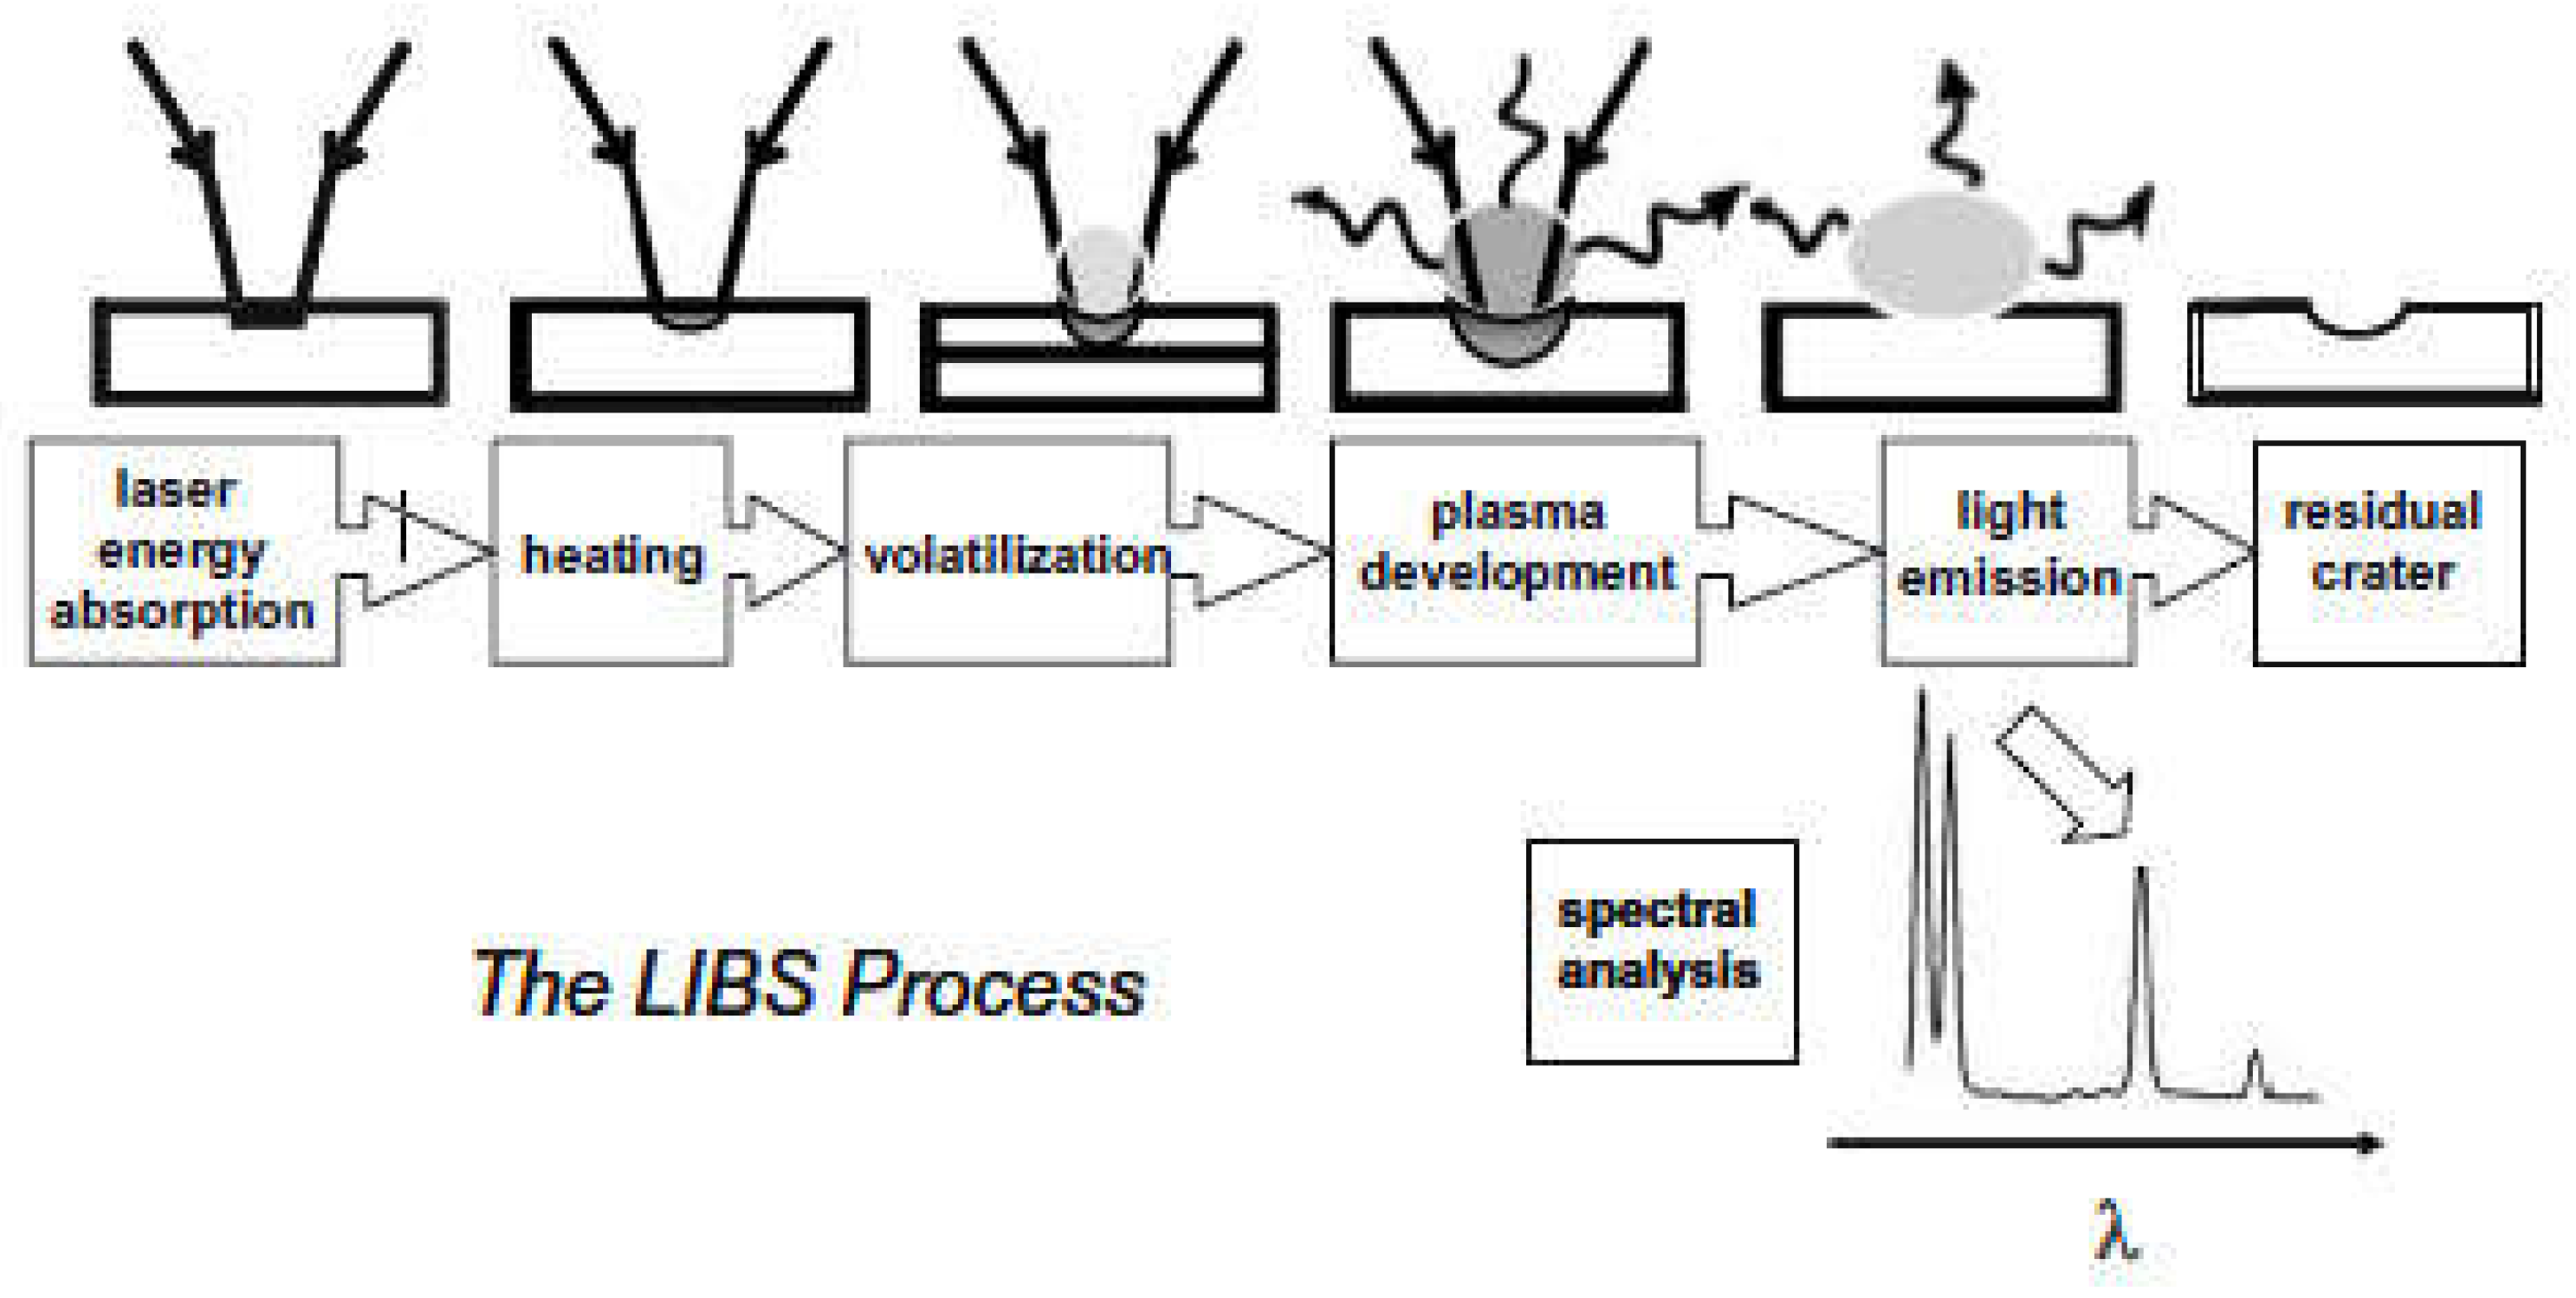
3.3. Data Processing and Network Construction

Calculating the Correlation Matrix

A correlation matrix is a table that shows the correlation coefficients between the various LIBS spectra acquired in an experiment.
The correlation coefficients (r) were calculated using the following equation:
r = i = 1 n a i b i i = 1 n a i 2 i = 1 n b i 2  
where a and b are n-dimensional vectors representing two LIBS spectra, n is the number of spectral points per spectrum (2048 in our experiments), ai and bi are the ith spectral points in a and b.
Each entry in the correlation matrix reflected the correlation value of two spectra. The correlation matrix that resulted was symmetric. This signifies that the correlation values above and below the diagonal are the same (i.e., the correlation between two spectra a and b is the same as the one between b and a). In addition, the diagonal values for the resulting correlation matrix are always equal to one (as those represent the correlation between a spectrum and itself, which leads to a value of 1). The dimensions of the resulting matrix in this work were m × m, where m is the number of spectra acquired through the experiment.

3.4. Network Construction

The correlation matrix of the acquired LIBS spectra was then transformed into a weighted adjacency matrix based on the concepts of graph theory. Individual LIBS spectra indicated the graph’s vertices (V), while the correlation between the two spectra indicated the weight (w) of the edge (E) connecting the two corresponding vertices. Computation of the correlation and adjacency matrices were both done in MATLAB (MATLAB (R2019b). The MathWorks Inc., Natick, MA, USA). The adjacency matrix was then converted into two “.csv” files in a format that can be easily imported by Cytoscape® software, which was used to cluster and visualize the networks.
After being imported into Cytoscape, the spectra were represented as nodes and edges to generate the network, as shown in Figure 2.

3.5. Network Clustering

This work proposes an unsupervised clustering algorithm and is benchmarked using three different unsupervised clustering algorithms. We describe them here and refer to literature for those who are interested in delving deeper into these algorithms.

3.6. Louvain Algorithm

It is an unsupervised clustering algorithm that was described in detail elsewhere [29,30]. The algorithm uses a greedy multi-level approach for detecting communities in a weighted network based on the optimization of modularity. The Louvain algorithm has the significant advantage of being simple, fast, intuitive, and easy to implement. However, the original algorithm has issues that are “related to the resolution limit of the modularity, which may lead to gathering the smaller groups in one big community” [31]. Alternatively, the algorithm can be used to optimize quality functions other than the modularity, for example, the constant Potts model (CPM) function [32,33]. CPM is a resolution limit-free method, which can overcome the limitations in modularity and can be defined as follows:
H = c [ e c γ ( n c 2 ) ]
where c denotes a community with nC nodes. γ is the resolution parameter, which is pretty simple. The density of communities has to be at a minimum, but the density between communities has to be less than y. Lower resolutions lead to fewer communities and vice versa. In this work, the updated version of the Louvain (with CPM) was used as the sole clustering algorithm in all the scenarios mentioned above.
However, the updated version of the Louvain clustering algorithm struggled with the issue of the resolution parameter. We performed preliminary experiments to test different values for the resolution parameter. The value of the resolution parameter that provided the optimal results in clustering the spectra can be formalized by dividing the sum of the weights of the edges by the number of edges, as follows:
r e s o l u t i o n = i = j = 1 i = n , j = m W i j N k
where Wij is the weight between the nodes i and j, N is the total number of edges in the network, and k is a constant number equal to 0.005.

3.7. K-Medoids Algorithm

K-medoids is an unsupervised clustering algorithm that splits the data set of n objects into k clusters by “first arbitrarily finding a representative object (the Medoids) for each cluster” [34]. “The basis of the approach of the k-medoids algorithm is to implement the partition operation within the principle of minimizing the differences between each object and its corresponding reference point. Rather than using the mean value of the items in each cluster, the K-Medoids method employs sample objects as reference points. K-medoid considers more robust to outliers and noise as compared to k-means” and can be applied using the following steps [34,35].
  • Initialization: select k random points from n data as medoids m;
  • Correspond each data point to the nearest medoid using one of the distance metric methods;
  • For each medoid m, while the cost is reduced for each data point p:
    • Swap p and m, then correspond each data point to the nearest medoid and recalculate the cost;
    • If the cost is higher than the previous step, undo the swap.

3.8. Farthest First Traversal Algorithm (FFT)

The farthest first traversal algorithm is a greedy and fast algorithm introduced by Hochbaum and Shmoys in 1985, and it follows the same procedure as k-Means. In the FFT algorithm, k points are first selected as cluster centers. “The first center is selected at random. The second center is greedily selected as the point furthest from the first. Each remaining center is determined by greedily selecting the point farthest from the set of already chosen centers, and the remaining points are added to the cluster whose center is the closest” [36,37].
The input of the FFT algorithms is a set of P of N points from a metric space (M, d). The output is k-clustering C = (C1, C2, Ck) of P. Then, the steps are as shown in Algorithm 2:
Algorithm 2: The steps of FTT algorithm.
START
INPUT: P and N points ∈ (M, d)
OUTPUT: k-clustering (C)
Step 1: SET S←Φ
Step 2: For i from 1 to k
                    Find ciP-S that maximizes d(ci,S)
                    SET SS ∪ {ci}
Step 3: Return Partition(P,S); where d(ci,S) represents the minimum distance of ci from a point of S:
                    SET D(ci,S) = min {cS: d(ci,c)}; The assignment of points to clusters is achieved by detecting the center in the first loop.
END

3.9. The Proposed Clustering Algorithm

In this work, an unsupervised clustering algorithm is suggested. The proposed algorithm is inspired by the DBSCAN algorithm [38]. The same steps were followed but with a different approach. Therefore, the algorithm proposed is considered a mutated DBSCAN that fits the nature of the generated network. Because for each test, there is a network model, the distance between every two nodes in the network is fixed that is because the network is fully connected, and there is an edge between every pair of nodes, which leads to fixed distances among nodes. In addition, the network model used is weighted and undirected. Network weights represent the base of the proposed algorithms. This means the network models do not have variable distances among nodes. Therefore, we propose that the weights of network pairs are collected and then converted into distances. In the collected dataset, network weights are listed in a table for each pair. Now, to convert the weights to distances, we suggest the following formula:
D i s t a n c e i j = ( ( W e i g h t i j × f ) + f )
where Distanceij is the distance between nodes i and j, Weightij is the edge weight of the pair (i, j), and f is a constant factor that equals 10,000. The reason behind this exact value is that the weights have a range that is below 1, and network weights have very close values. For instance, if the weight between A and B is 0.99607, then the distance is equal to 39.3. As another example, assume the weight between C and D is 0.99059; then, the distance equals 94.1. This means the higher the weight between two nodes, the shorter the distance between the two nodes. This procedure helps us in defining the distances among network nodes.
The next step is to use the mutated dbscan to cluster our network models. It should be mentioned that one of the main purposes of this work is to distinguish between original and questioned documents. This means we either have one or two clusters. If the result of the clustering process distinguishes one cluster, that means the document is original; otherwise, the tested document is forged. Now, we have to define the parameters of the clustering algorithm. The first parameter is called NP, which is tuned using the k-distance graph. The reason behind this tuning process is that when selecting NP, it might generate one giant cluster if the NP is very large, while most of the nodes might be considered outliers if the NP is selected too small. Therefore, the tuning process is crucial at this stage of the clustering process. The other parameter used is called MP, which represents the minimum number of neighbors within the NP radius. The next step is to define two types of nodes based on the two mentioned parameters (NP and MP). The first type of node is called the core node; its value is higher than the MP within the NP radius. The other type of node is called a border node, and its neighbor nodes are core nodes.
According to the aforementioned preparations, the following steps clarify the procedure for creating the clusters are as follows:
Step 1: Find all the neighbor nodes within NP and identify the core points (core node).
Step 2: Assign the core node to a new cluster if it does not belong to one.
Step 3: Recursively find connected nodes and assign them to clusters.
Step 4: Repeat the process for the unvisited nodes and assign them to clusters using the same as the previous core nodes.
The result of this process is a network that is visualized and then analyzed and evaluated visually. The network model has created gradually node by node. It should be mentioned that our approach is supposed to be easy and does not consume time as well as the results can be distinguished by a non-professional user. This means we do not have to involve experts to evaluate the result. The visualization can tell users how many clusters are generated. The number of clusters determines whether a document is forged.

4. Results and Discussions

Based on the mentioned scenarios, we performed our tests using the proposed algorithm under the proposed framework. We then benchmark the total performance of the proposed algorithm against the benchmarking ones.

4.1. Laser vs. Laser Printers

The proposed approach was successful in distinguishing samples printed as a DQ from those printed as original ones using pairs of samples printed with different printer/paper types. To illustrate the interpretation of the output of the algorithm, an example of the outputs of an experiment comparing two samples is given here. The experiment compared the spectra of a sample printed with the laser printer Canon mf264 with those of a sample printed with a laser printer Canon 4430. The visualization of the clustering results of the spectra of the two samples is shown in Figure 3. Here, we can see that the spectra of the two samples were clustered into two groups (red and yellow), which means that the DQ was printed with a different printer than the original document, i.e., forged. Figure 4 also shows that our approach can distinguish between different printers (red nodes of the Ricoh printer and the Kyocera printer of yellow nodes).

4.2. Partially Forged Documents

The proposed approach has shown the ability to identify documents that were partially manipulated by printing additional parts to the document using a different printer. An example is shown in Figure 5, where a document was printed using a laser printer Canon mf264 (red nodes), and a questioned part was printed using an inkjet printer HP 577 (yellow node), representing the forged part of the document. We can see that the forged part of the same document appeared in a separate cluster, i.e., forged.

4.3. Different Paper Types

The proposed approach successfully distinguished 9 out of 10 combinations of brands of papers tested in this work. The only combination that appeared in a single cluster was Copy laser and PaperLine brands. This indicates that the initial composition of these two brands of paper is probably quite similar, resulting in very highly correlated LIBS spectra that cannot be distinguished using our approach. Figure 6 shows an example of the output of the proposed approach to differentiate between PaperONe (red nodes) and Ballet brands (yellow nodes).

4.4. Laser vs. Inkjet Printers

The proposed approach showed the ability to correctly identify the printer type used to print different parts of a partially forged DQ. This experiment was done using spectra of two DQ that were comprised of spectra from a laser printer Canon 231 (representing the original part of the document) and spectra from an inkjet printer Epson 3070 (representing the questioned part of the document) as shown in Figure 7. The figure shows red nodes that represent the spectra of Canon 231 and the yellow color of Epson 3070. This result indicates that our approach was able to correctly classify each of the spectra of a partially forged document into the respective cluster (laser vs. inkjet clusters).

4.5. Benchmarking

Considering all the cases tested in this work that include 40 cases of 10 nodes and 11 cases of 5 nodes, the total number of nodes tested was 455 representing all the spectra obtained from the tested documents. We benchmark the performance of the proposed algorithm against the benchmarking under our proposed framework. The results in terms of the number of successfully distinguished nodes that failed to distinguish nodes and accuracy are presented in Table 3. We found that our proposed algorithm outperformed the other algorithms. However, the difference between our proposed algorithm and the Louvain algorithm is not too significant, but the difference with the other algorithms was significant. In addition, the execution time of the proposed algorithm outperformed the benchmarking with less difference with Louvain and a significant difference with the other two algorithms.

4.6. Discussion

The results of testing the proposed framework under different algorithms, including a newly proposed one, have shown that it was able to reliably detect forged as well as partially forged documents. In addition, the proposed algorithm can be used to identify printer type and even the printer’s brand by comparing its spectra to a database of spectra obtained from different brands and models. The proposed algorithm is naturally cheap, easy to implement, non-destructive, and visually interpretable. Being non-destructive means that samples used in this approach are kept intact, which can be used again and again as forensic evidence, which is a very valuable feature to have for any forensic investigation technique. Additionally, visual interpretability makes it easy for human non-experts to interpret the results giving them more credibility and value when used as evidence in courts of law.
Feature selection chooses the optimum group of features to maximize classification. Continuous and stable bands with the highest discriminating data are chosen and used for ink combination categorization. Figure 8a,b illustrate the significant improvement in accuracy after using feature selection. FCM achieved an overall accuracy of 67%, which is higher than the prior approaches proposed in earlier research on the same dataset. Following the incorporation of feature selection into the suggested approach, an accuracy level of 77% was observed, demonstrating the usefulness of the proposed method for ink incompatibility detection. Blue inks performed better than black inks because their spectrum responses are easily separated in the dataset. We can see that the bulk of the ink pixels is successfully grouped, and feature selection has been demonstrated to be a highly useful stage in ink pixel clustering. In comparison to previous approaches, the suggested method provides superior differentiation between inks in questioned papers. The experiments were carried out using a system with an Intel Core i5 @ 2.50 GHz processor and 8.00 GB RAM. Each hyperspectral document image took 3.9 s to execute.
The technique described in this paper was motivated by complex network principles. A network based on the ink spectra of each sample test evaluated in this paper was constructed. The nodes in all of the produced networks were the spectra of the documents retrieved using LIBS tech. The edges indicated the spectral associations. The strategy was determined by the number of clusters produced inside the networking system using the suggested unsupervised method and other clustering algorithms. The results indicated that the proposed approach provides 92.08% of accuracy in distinguishing samples using the proposed clustering algorithm.
However, despite the excellent performance of the proposed approach in detecting forged documents, there are a few limitations that should be taken into consideration by digital forensics when adopting such an approach. These limitations include:
  • The configuration of the LIBS device should be as described in the methods section. Changing these settings, according to the experiments, will alter the accuracy of the suggested technique;
  • The laser used in the LIBS system must have high stability so that it must have an even distribution of energy in each pulse.
According to the limitations of the forgery detection literature presented in Section 1, we successfully overcome these limitations in the proposed algorithm since it shows the following:
-
Low level of complexity compared to the benchmarking (see the execution times in Table 3);
-
High efficiency and detection rates, which was 92.08%;
-
Easy to use, and the results can be interpreted by non-experts through visualization;
-
Low adoption costs since it needs only LIBS scans and some semi-automated steps.

5. Conclusions

The approach proposed in this work provides a novel but simple tool for forgery detection in printed official documents. Additionally, the results can be visually interpreted since the output of the proposed approach is visually represented as clustered networks that are easily interpretable by forensic investigators. The following are potential future work that can be done to enhance and improve the capabilities of our proposed approach:
  • To test the proposed approach in detecting forgery on writing inks, signatures, seals, and banknotes;
  • To test the proposed approach in cases of overlaying different inks;
  • To build a large database for various printer types, brands, and models that allows conducting analyses and clustering operations on future questioned documents to identify the printer used to print them.
We anticipate that the results of this work will stimulate the use of multispectral image analysis in conjunction with cutting-edge clustering and classification algorithms in document analysis, especially for automated questioned document examination. As for the limitations of this paper, we had limited access to the newest resources about this topic, so we had to utilize some of the older ones. Nevertheless, advanced drawing tools were extremely costly, which resulted in a bit of unclearness in the figures that show the visualization processes. The other limitation of this work is the LIBS configuration that should be mentioned in this article; otherwise, the accuracy of the method will be inconsistent. Therefore, the method seems to work more consistently with the configurations used. It should be mentioned that the optimal configurations of this work came after a series of experiments. Finally, the other limitation can be the cost of the LIBS device.

Author Contributions

Validation, B.M.; Supervision, B.C.; Project administration, M.A.A.A.-A. All authors have read and agreed to the published version of the manuscript.

Funding

The authors received no financial support for the research, authorship, or publication of this paper.

Institutional Review Board Statement

Not applicable.

Informed Consent Statement

Not applicable.

Data Availability Statement

Not applicable.

Conflicts of Interest

The authors declare no conflict of interest.

References

  1. Khan, R.A.; Lone, S.A. A comprehensive study of document security system, open issues and challenges. Multimed. Tools Appl. 2020, 80, 7039–7061. [Google Scholar] [CrossRef]
  2. Dyer, A.G.; Found, B.; Rogers, D. An Insight into Forensic Document Examiner Expertise for Discriminating Between Forged and Disguised Signatures. J. Forensic Sci. 2008, 53, 1154–1159. [Google Scholar] [CrossRef] [PubMed]
  3. Parkinson, A.; Colella, M.; Evans, T. The Development and Evaluation of Radiological Decontamination Procedures for Documents, Document Inks, and Latent Fingermarks on Porous Surfaces. J. Forensic Sci. 2010, 55, 728–734. [Google Scholar] [CrossRef] [PubMed]
  4. Warif, N.B.A.; Wahab, A.W.A.; Idris, M.Y.I.; Ramli, R.; Salleh, R.; Shamshirband, S.; Choo, K.-K.R. Copy-move forgery detection: Survey, challenges, and future directions. J. Netw. Comput. Appl. 2016, 75, 259–278. [Google Scholar] [CrossRef]
  5. Muthukrishnan, R.; Radha, M. Edge detection techniques for image segmentation. Int. J. Comput. Sci. Inf. Technol. 2011, 3, 259. [Google Scholar] [CrossRef]
  6. Alshayeji, M.H.; Al-Rousan, M. Detection Method for Counterfeit Currency Based on Bit-Plane Slicing Technique. Int. J. Multimed. Ubiquitous Eng. 2015, 10, 225–242. [Google Scholar] [CrossRef]
  7. Lamsal, S. Counterfeit Paper Banknote Identification Based on Color and Texture; Pulchowk Campus: Dharan, Nepal, 2015. [Google Scholar]
  8. Gorai, A.; Pal, R.; Gupta, P. Document fraud detection by ink analysis using texture features and histogram matching. In Proceedings of the 2016 International Joint Conference on Neural Networks (IJCNN), Vancouver, BC, Canada, 24–29 July 2016. [Google Scholar]
  9. Valderrama, L.; Março, P.H.; Valderrama, P. Model precision in partial least squares with discriminant analysis: A case study in document forgery through crossing lines. J. Chemom. 2020, 34, e3265. [Google Scholar] [CrossRef]
  10. Niu, P.; Wang, C.; Chen, W.; Yang, H.; Wang, X. Fast and effective Keypoint-based image copy-move forgery detection using complex-valued moment invariants. J. Vis. Commun. Image Represent. 2021, 77, 103068. [Google Scholar] [CrossRef]
  11. Markiewicz-Keszycka, M.; Cama-Moncunill, X.; Casado-Gavalda, M.P.; Dixit, Y.; Cama-Moncunill, R.; Cullen, P.J.; Sullivan, C. Laser-induced breakdown spectroscopy (LIBS) for food analysis: A review. Trends Food Sci. Technol. 2017, 65, 80–93. [Google Scholar] [CrossRef]
  12. Elsherbiny, N.; Nassef, O.A. Wavelength dependence of laser induced breakdown spectroscopy (LIBS) on questioned document investigation. Sci. Justice 2015, 55, 254–263. [Google Scholar] [CrossRef] [PubMed]
  13. Laserna, J.; Vadillo, J.M.; Purohit, P. Laser-Induced Breakdown Spectroscopy (LIBS): Fast, Effective, and Agile Leading Edge Analytical Technology. Appl. Spectrosc. 2018, 72, 35–50. [Google Scholar] [CrossRef]
  14. Zięba-Palus, J.; Kunicki, M. Application of the micro-FTIR spectroscopy, Raman spectroscopy and XRF method examination of inks. Forensic Sci. Int. 2006, 158, 164–172. [Google Scholar] [CrossRef] [PubMed]
  15. Gál, L.; Belovičová, M.; Oravec, M.; Palkova, M.; Ceppan, M. Analysis of Laser and Inkjet Prints Using Spectroscopic Methods for Forensic Identification of Questioned Documents; XIth Symposium on Graphic Arts; University of Pardubice: Pardubice, Czech Republic, 2013. [Google Scholar]
  16. Ameh, P.O.; Ozovehe, M.S. Forensic examination of inks exracted from printed documents using Fourier transform in-frared spectroscopy. Edelweiss Appl. Sci. Technol. 2018, 2, 10–17. [Google Scholar] [CrossRef]
  17. Fortes, F.J.; Moros, J.; Lucena, P.; Cabalín, L.M.; Laserna, J.J. Laser-induced breakdown spectroscopy. Anal. Chem. 2013, 85, 640–669. [Google Scholar] [CrossRef]
  18. Kim, S.J.; Deng, F.; Brown, M.S. Visual enhancement of old documents with hyperspectral imaging. Pattern Recognit. 2011, 44, 1461–1469. [Google Scholar] [CrossRef]
  19. Balas, C.; Papadakis, V.; Papadakis, N.; Papadakis, A.; Vazgiouraki, E.; Themelis, G. A novel hyper-spectral imaging apparatus for the non-destructive analysis of objects of artistic and historic value. J. Cult. Heritage 2003, 4, 330–337. [Google Scholar] [CrossRef]
  20. Melessanaki, K.; Papadakis, V.; Balas, C.; Anglos, D. Laser-induced breakdown spectroscopy and hyper-spectral imaging analysis of pigments on an illu-minated manuscript. Spectrochim. Acta Part B At. Spectrosc. 2001, 56, 2337–2346. [Google Scholar] [CrossRef]
  21. Cicconi, F.; Lazic, V.; Palucci, A.; Assis, A.A.; Romolo, F.S. Forensic Analysis of Commercial Inks by Laser-Induced Breakdown Spectroscopy (LIBS). Sensors 2020, 20, 3744. [Google Scholar] [CrossRef]
  22. Pokrajac, D.D.; Sivakumar, P.; Markushin, Y.; Milovic, D.; Holness, G.; Liu, J.; Melikechi, N.; Rana, M. Modeling of laser-induced breakdown spectroscopic data analysis by an automatic classifier. Int. J. Data Sci. Anal. 2019, 8, 213–220. [Google Scholar] [CrossRef] [Green Version]
  23. Cremers, D.A.; Yueh, F.Y.; Singh, J.P.; Zhang, H. Laser-induced breakdown spectroscopy, elemental analysis. In Encyclopedia of Analytical Chemistry: Applications, Theory, and Instrumentation; John Wiley & Sons: New York, NY, USA, 2006. [Google Scholar]
  24. Harmon, R.S.; Remus, J.; McMillan, N.J.; McManus, C.; Collins, L.; Gottfried, J.L.; DeLucia, F.C.; Miziolek, A.W. LIBS analysis of geomaterials: Geochemical fingerprinting for the rapid analysis and discrimination of minerals. Appl. Geochem. 2009, 24, 1125–1141. [Google Scholar] [CrossRef]
  25. Caridi, F. Laser-induced breakdown spectroscopy: Theory and applications, edited by Sergio Musazzi and Umberto Perini. Contemp. Phys. 2017, 58, 273. [Google Scholar] [CrossRef]
  26. Martin, M.Z.; Labbé, N.; André, N.; Harris, R.; Ebinger, M.; Wullschleger, S.D.; Vass, A.A. High resolution applications of laser-induced breakdown spectroscopy for environmental and forensic applications. Spectrochim. Acta Part B: At. Spectrosc. 2007, 62, 1426–1432. [Google Scholar] [CrossRef]
  27. Sakka, T. Introduction to Laser-induced Breakdown Spectroscopy. J. Inst. Electr. Eng. Jpn. 2022, 142, 69–72. [Google Scholar] [CrossRef]
  28. Jaswal, B.B.S.; Singh, V.K. Analytical assessments of gallstones and urinary stones: A comprehensive review of the devel-opment from laser to LIBS. Appl. Spectrosc. Rev. 2015, 50, 473–498. [Google Scholar] [CrossRef]
  29. Chen, M.; Kuzmin, K.; Szymanski, B.K. Community Detection via Maximization of Modularity and Its Variants. IEEE Trans. Comput. Soc. Syst. 2014, 1, 46–65. [Google Scholar] [CrossRef] [Green Version]
  30. Orman, G.K.; Labatut, V.; Cherifi, H. Comparative evaluation of community detection algorithms: A topological approach. J. Stat. Mech. Theory Exp. 2012, 2012, P08001. [Google Scholar] [CrossRef]
  31. Lancichinetti, A.; Fortunato, S. Community detection algorithms: A comparative analysis. Phys. Rev. E 2009, 80, 056117. [Google Scholar] [CrossRef] [Green Version]
  32. Traag, V.A.; Van Dooren, P.; Nesterov, Y. Narrow scope for resolution-limit-free community detection. Phys. Rev. E 2011, 84, 016114. [Google Scholar] [CrossRef] [PubMed] [Green Version]
  33. Traag, V.A.; Waltman, L.; Van Eck, N.J. From Louvain to Leiden: Guaranteeing well-connected communities. Sci. Rep. 2019, 9, 5233. [Google Scholar] [CrossRef] [Green Version]
  34. Velmurugan, T.; Santhanam, T. Computational complexity between K-means and K-medoids clustering algorithms for normal and uniform distributions of data points. J. Comput. Sci. 2010, 6, 363. [Google Scholar] [CrossRef]
  35. Madhulatha, T.S. Comparison between k-means and k-medoids clustering algorithms. In Proceedings of the International Conference on Ad-vances in Computing and Information Technology, Chennai, India, 14–17 July 2011; Springer: Berlin, Germany, 2011. [Google Scholar]
  36. Dharmarajan, A.; Velmurugan, T. Lung Cancer Data Analysis by k-means and Farthest First Clustering Algorithms. Indian J. Sci. Technol. 2015, 8, 974–6846. [Google Scholar] [CrossRef] [Green Version]
  37. Kumar, M. An optimized farthest first clustering algorithm. In Proceedings of the 2013 Nirma University International Conference on Engineering (NUiCONE), Ahmedabad, India, 28–30 November 2013. [Google Scholar]
  38. Schubert, E.; Sander, J.; Ester, M.; Kriegel, H.P.; Xu, X. DBSCAN revisited, revisited: Why and how you should (still) use DBSCAN. ACM Trans. Database Syst. (TODS) 2017, 42, 1–21. [Google Scholar] [CrossRef]
Figure 1. The six steps of the LIBS process [24].
Electronics 11 04036 g001
Figure 2. Network of spectra for a single document. Each line connecting two spectra represents a correlation coefficient of the two spectra. The different colors of edges are used to distinguish between different edges among nodes. The colors of the edges are used to distinguish the relations among the spectrums.
Electronics 11 04036 g002
Figure 3. Visualization of the ink spectrum of the source and questioned papers printed on two separate printers: the Canon mf264 laser printer (red nodes) and the Canon 4430 laser printer (yellow nodes).
Electronics 11 04036 g003
Figure 4. Visualizing a network consisting of two clusters, the first containing ink spectra of a Ricoh laser printer (red nodes). The second includes the ink spectra of a Kyocera laser printer (yellow nodes).
Electronics 11 04036 g004
Figure 5. Visualization of a network consisting of five nodes, four of them representing spectra from the laser printer Canon mf264 (red nodes), while the fifth one represents a spectrum from the Inkjet printer HP 577 (yellow node).
Electronics 11 04036 g005
Figure 6. The proposed approach distinguished between two types of papers: PaperOne (red nodes) and Ballet (yellow nodes), which appeared in two separate clusters.
Electronics 11 04036 g006
Figure 7. Visualization of spectra from a laser printer Canon 231 appeared in a laser printers cluster (red nodes), and spectra from an inkjet printer Epson 3070 appeared in an inkjet printers cluster (yellow nodes).
Electronics 11 04036 g007
Figure 8. FCM and feature selection obtained segmentation accuracy on (a) black ink combinations and (b) blue ink combinations with varying mixing ratios.
Electronics 11 04036 g008
Table 1. Description of printed samples that represent printers’ references.
Printer TypeBrandModel (Reference)Ink TypePaper Brand
LaserCanoni-SENSYS (MF231)AR CRG 737Copy laser
LaserCanoni-SENSYS (MF4010)AR FX 10Copy laser
LaserCanoni-SENSYS (LBP6000)AR CRG725Copy laser
LaserCanonImage CLASS (MF264)CRG 51Copy laser
LaserCanoni-SENSYS (MF4430)728Copy laser
LaserCanoni-SENSYS (MF4730)128Golden plus
LaserRicohAficio (MP4001)Toner black mp c4500Copy laser
LaserKyoceraAficio (MPC2051)Toner black mp c2051cCopy laser
InkjetEpsonEcoTank (ITSL3070)Any color ink refillCopy laser
InkjetCanonPixma (TS6020)Vivid ink refillCopy laser
InkjetHPPage Wide Pro (577dw)YOUSIF UV dye inkCopy laser
Table 2. Paper types used in the preparation of test samples.
Paper BrandOrigin
Copy laserIndonesia
Ballet UniversalChina
PAPEROneIndia
PaperlineIndonesia
localChina
Table 3. The performance of the proposed algorithm against the benchmarking.
AlgorithmTotal Nodes TestedSuccessfully DistinguishedFailed to DistinguishAccuracyAverage Time Execution for Every 10 Nodes (s)
Proposed4554193692.08%0.039
Louvain4554134290.7%0.043
FFT4553649180%0.7
K-Medoid45534810776.48%0.1
Publisher’s Note: MDPI stays neutral with regard to jurisdictional claims in published maps and institutional affiliations.

