1. Introduction
Smart households are the future of new cities. The modernization of households involves the use of different Internet of Things (IoT) systems that allow monitoring and controlling the equipment installed in the households. These households generate a large amount of valuable data from the intelligent devices and appliances connected to an IoT system. The ability to use these data in real time makes it possible to analyse diverse information that has a significant impact on safety, the environment, and the economy of our society. Reports obtained from data in real time or stored over periods of time (days, weeks, months, and years) make it possible to study the behaviour of the household electricity demand.
Another consequence of this analysis is the adjustment of the term of power contracted with the supply company, which offers a significant reduction in the electricity bill. This leads to a more constant energy demand in the household. To achieve this feature, a priority system must be performed that in real time connects only those that do not exceed the contracted power limit, leaving on standby less priority equipment that would be connected when they are finished and have been assigned a higher priority.
To achieve these objectives, this study created a website with data from measurements obtained in different monitored households. In this sense, the main contributions provided in this paper are the following:
Develop a new prototype SMH for monitoring electrical variables, upload data to cloud using wireless network;
Design of a web platform that allows to analyse the different electrical magnitudes of the monitored houses through data that are measured by a smart meter (SM), developed, and sent to the cloud. The design of the system permits for the massive processing of multiple sets of household data, which enables studying the information obtained by applying different algorithms;
The design components of the platform architecture were created. Specifically, the study of the data structure obtained from the households is developed, minimizing the communication overload with the cloud, and the design of the website where the data obtained appears for use by the research community;
The necessary technology to obtain data in real time as well as process and store data in the cloud for integrating into the control panels was developed; this shows user data in graphic form and allows downloading the data.
We designated a smart grid (SG) as a smart electricity distribution network. This is a two-way network capable of transmitting electricity in both directions, which allows households and different businesses to become small producers of electricity and not just consumers, as has been the case traditionally. Since SGs are combined with modern information technologies, they can provide data to both electricity distribution companies and consumers. One of the main tasks of SGs is the management and analysis of large amounts of generated information, known as big data.
The rest of the paper is organized as follows:
Section 2 describes the related work;
Section 3 shows the architecture of the system proposed;
Section 4 and
Section 5 show the integration of the system and final screenshots, and finally our conclusions and future work are presented in
Section 6.
2. Related Work
The study of information technologies (ICT) applied to Smart Cities and therefore, to smart grids and housing, is fundamental for the development of these paradigms.
IoT, cloud computing, and information analysis must use the optimal and highest speed ICT to achieve real-time data availability. In this respect Usman et al. [
1] analysed the existing ICT adopted in SGs and their development over time. In this study, they analysed technologies such as Power Line Communication, Wireless Fidelity (Wi-Fi), Zigbee, Worldwide Interoperability for Microwave Access, Global System for Mobile General Packet Radio Service and DASH7.
2.1. Smart Grids and Meter Data
Numerous studies have integrated the use of SMs in SGs to monitor the behaviour of the different agents included within the network. Within this line of research, Munshi et al. [
2] developed components based on big data for applications with SGs and the results obtained are transferred to a cloud computing platform. Kabalci [
3] studied communication technologies and their security in data collection networks. Tanyali et al. [
4] implemented a method for encrypting data taken by SMs since there is a risk of information theft when they are exposed on the network as well as finding out the user’s habits. Khan et al. [
5] dealt with the problem of integrating IoT sensors installed in households that have different communication protocols and technologies. To do this, they defined a standard in which all the sensors installed in the household were integrated (biometrics, security, electrical, etc.).
As for the cloud computing standards for SGs, Yigit et al. [
6] defined the necessary architecture for cloud computing in SGs by using structures, methods, protocols, and algorithms. Al-Turjman et al. [
7] reviewed the state-of-the-art in SGs, analysing the viability of using SGs to study and improve the quality and reliability of power. Al-Turjman et al. [
8] studied the impact and efficiency of SMs, critical design factors, modifying and comparing parameters with real cases, and are categorized within this area. W. L. Rodrigues et al. [
9] carried out a study on signal quality using a SM by means of cloud computing (fog computing). Recently, several studies have proposed systems and frameworks for the analysis of IoT data using various architectures related to cloud computing.
In this section, we discuss these studies, especially those that are representative of the state-of-the-art and similar to our work. It is important to note that a platform with cloud computing offers efficient resource processing of large IoT data in real time while providing information and processed data to the cloud for further processing and analysis. This integration design makes it easier for us to address cloud system latency issues that can have a significant impact on time-sensitive applications. The integration of SMs into IoT networks is another important part of the research related to SGs. Cano-Ortega et al. [
10] developed equipment for power factor compensation using a TLBO optimization algorithm through a cloud data storage, control, and monitoring system. Cano-Ortega et al. [
11] monitored the efficiency and the operating conditions of induction motors through an SM based on a LoRa LPWAN network. Sánchez-Sutil et al. [
12] designed a measurement and control system for public lighting integrated in a LoRa LPWAN communication network. Asghari et al. [
13] performed the current research techniques on IoT application approaches to analytically and statistically categorize this type of network. A. A. Mazhar Rathore, et al. [
14] developed a combined system based on IoT for the development of Smart Cities using big data analysis. They used a complete system with several types of sensor deployment to make an SG. Naik et al. [
15] designed an intelligent home management system based on IoT that uses sensors, actuators, smart phones, web services, and microcontrollers. This IoT platform and hardware are available through a mobile application. Pau et al. [
16] made an intelligent metering infrastructure to automate and manage the distribution networks. The proposed architecture was based on a cloud solution, which allows communication with SMs and provides the necessary interfaces for the distribution of network services. Sánchez-Sutil et al. [
17] developed and calibrated a low-cost SM to measure the electrical variables in homes supplied by photovoltaic solar energy. Moreover, in Ref. [
18] the authors developed a smart plug to monitor and control electric load in a household with LoRaWAN network. Different web portals were analysed considering the electrical consumption measurements of households in different countries. As can be seen in
Table 1, the measurements of the electrical variables have granularity varying between 1 s and 10 min; later, aggregations were made that can be used in different time horizons. Almost no time series below 1 s was used due to the large amount of data produced for each variable measured.
The websites shown in
Table 1 store the recorded data and do not work in real time, the measurements of the electrical variables have a granularity that varies between 1 s and 10 min; the granularity times of the websites are less than 1 s [
19,
20,
21], 1 s [
19,
20,
22,
23,
24,
25,
26,
27], between 1s and 1 min [
19,
22,
28,
29], and 10 min. Some allow downloading of the stored data for free and others for a fee. The websites do not display the data of all the monitored variables in real time. Only [
22] can display data from the previous day, but this is paid. They do not allow comparisons between different households.
The SMs used in the websites are commercial devices where the measured data are sent every 1 s [
20,
22,
23,
24,
25,
27,
28], every 1 min [
29,
30], and every 10 min. The websites do not indicate the costs associated with commercial SMs.
Table 1.
Open access datasets of household power.
Table 1.
Open access datasets of household power.
| Web Site | Electrical Variables | Time Resolution | Number Houses | Country |
|---|
| PECANSTREET [22] | v, i, p, q | 1 s–1 min | 1115 | USA |
| ACS-F1 and ACS-F2 [28] | v, i, p, q, f, PF | 10 s (0.1 Hz) | 225 | Switzerland |
| AMPds [29] | v, i, f, pf, p, q, s, e | 1 min | 1 | CANADA |
| BLUED [19] | v, i | 8.33 × 10⁻⁵ s (12 kHz) | 1 | USA |
| DRED [20] | p | 1 s (1 Hz) | 1 | Netherlands |
| ECO [23] | v, i, p, q, PF | 1 s (1 Hz) | 6 | SUIZA |
| GREEND [24] | p | 1 s (1 Hz) | | Austria and Italy |
| ERC | p | 10 min | 255 | UK |
| iAWE [25] | v, i, f, p, q, s, e, PF | 1 s | 1 | India |
| REDD [26] | v, p | 6.66 × 10⁻⁵ s | 2 | USA |
| REFIT [31] | p | 8 s | 20 | UK |
| Smart [30] | v, f, p, s | 1 min | 400 | USA |
| Tracebase [27] | p | 1 s | 15 | Germany |
| UK-DALE [21] | v, i, p, s | 6.25 × 10⁻⁵ s, 1 s, 6 s | 3 | UK |
2.2. Meter Data Analytics
Data mining is the extraction of implicit information from other data. It can also be defined as the exploration and analysis, by automatic or semi-automatic means, of large amounts of data in order to discover meaningful patterns. Data mining techniques can be of two types: (i) descriptive, looking for interpretable patterns to describe data; (ii) predictive, using variables to predict future or unknown values of other variables.
The literature related to data mining, SGs, and SMs is varied. In this sense, Lui et al. [
32], developed a big data system for data acquisition, processing, and analysis to create a database.
Other authors have studied big data applied to SGs [
33] and performed a literature review on big data applied to electrical systems, defining the characteristics and future challenges. In addition, they analysed the characteristics of the SMs integrated into big data systems. Wilcox et al. [
34], implemented a big data hardware/software system for the data analysis of household information stored in the cloud and with access to the data through a web portal. Yassine et al. [
35] developed a big data analysis system based on an IoT network for measuring electricity consumption in households. Diamantoilakis et al. [
36] applied big data-based methods for the real-time processing of data obtained by SMs. Tu et al. [
37] proposed standards to be met by future big data systems applied to SGs.
In other investigations, the load profiles of households were analysed by applying big data-based techniques. Shyam et al. [
38] studied data management techniques in the generation, transmission, distribution, and consumption of electrical energy. Saleh et al. [
39] used measured data to obtain load predictions by applying filters for analysis. Guerrero et al. [
40] developed a data mining algorithm to obtain an integrated database that reflects the consumption and load profiles of a household. Cano-Ortega et al. [
41] developed a system for measuring electrical quantities to determine the load profiles of dwellings with a LoRa wireless network using an ABC optimization algorithm.
2.3. Big Data Architecture and Cloud Computing
Numerous studies have been carried out on SMs and big data. Lui et al. [
32] applied a new development to ICT that allows reducing the data measured by SMs by utilizing analytical techniques. They developed a web portal and a scalable platform to process the measured data. Munshi et al. [
2] implemented a platform of 6000 SMs with different data visualization and cloud computing scenarios. Yildiz et al. [
42] performed methods for forecasting, clustering, classifying, and estimating the demand for electricity in households to optimize energy consumption. The paper by Funde et al. [
43] was based on the unique combination of the symbolic aggregate approach (SAX), the discovery of temporal motifs, and the association mining rules to detect expected and unexpected patterns. The experimental data set obtained from the installed SMs supports the model developed in this research. Andreadou et al. [
44] analysed parameters such as size, message transmission frequency, total transmission time, and buffer capacity and showed their effect on data obtained from medium voltage networks.
Meloni et al. [
45] developed an architectural solution based on the Cloud-IoT for state estimation in SGs by combining cloud computing and the latest computer developments together with virtualization techniques for data processing. Razavi et al. [
46] trained and developed genetic algorithms to predict the occupation status of households not only in the present but also in the future with a high degree of accuracy. Sial et al. [
47] used heuristic techniques applied to data obtained with SMs to predict abnormal power consumption in campus residential buildings.
Araujo et al. [
48] evaluated the performance of cloud storage systems. Yassine et al. [
4] developed a platform for acquiring data from smart households using fog nodes and cloud computing to obtain the processing, analysis, and storage of the data measured. Forcan et al. [
49] developed two communication models, cloud computing and fog nodes, to be used for estimating electricity losses in SGs and monitoring the voltage profile of a simulated IEEE system.
2.4. Big Data Applied to Smart Grids
Munshi et al. [
2] presented innovative research for advancing smart grids through big data. They implemented a secure cloud-based platform. Tu et al. [
37] conducted a state-of-the-art review of big data applied to smart grid integration. They reviewed big data applications for smart grids, focusing on the latest applications with the latest big data technologies. Kumar et al. [
50] designed a circuit to help users take control of power consumption in their homes, improving energy savings through an intelligent method. The measured information from the monitored homes is stored in a big data server. Wang [
51] proposed a localization oscillation scheme based on the theory and support of a vector machine, phase difference oscillation, and forced phase difference oscillation. Zang [
52] improved the data analysis and data mining tool in energy control and improved the service quality of the electricity market through the computerization of power systems. Mostafa et al. [
53] developed a framework for implementing big data analytics for smart grids and renewable energy, and implemented a five-step method to predict the stability of smart grids using five different machine learning methods.
2.5. Novel Contribution
Due to the existing limitations of the website that stores the data on the variables of electrical consumption homes, this research realizes a platform that allows to visualize the different electrical variables v, i, p, q, s and PF in real time with data upload every 0.5 s from the SMs installed in the different homes. In addition, each user has an app that allows to visualize the data in real time. Since the measured time series are below 1s, a large amount of data is produced for each of the measured variables, so they must be treated by NoSQL data management system and structured storage, which reduces the processing time. Included in the platform is the comparison between different households, which allows to analyse all the households that have been monitored since 2018.
The design of the measurement equipment and data upload to cloud are other advantages this research provides/achieved. The data uploads to the cloud every 5 s, and the data storage in both the cloud and measurement equipment have a data limit of one year. The SM was designed with a cost of EUR 46.28, considered as a low-cost equipment. Being an open-source equipment, it can be programmed according to the needs at any time and for each user.
After analysing the different existing platforms, this work adds the following innovations.
Integration and storage of data from multiple sources. Traditional data usually deals with data from a single domain, it is essential to find a fusion method for the data set from multiple sources, which has different modalities, formats, and representations. In terms of big data storage, although some of the systems such as Hadoop (HDFS) seem to be feasible, it needs to be adapted and modified to fit the big data power grid;
Real-time data processing technology for applications such as electricity consumption measurement with resolutions below 0.5 s demand estimation studies, residential occupancy, etc. Although the cloud system is able to provide a fast calculation service, the network congestion, the complicated algorithm, combined with the massive amount of data, results in latency;
Big data visualization technology. Graph and chart visualization can present operators with granular and explicit changes in electrical variables. However, how to effectively find and represent correlations or trends among data from multiple sources is a major challenge;
Data privacy and security. Data security is provided by 64-bit key encryption. Each user has their own account which makes them independent from others. On the other hand, a user with administrator role manages the system.
3. System Architecture
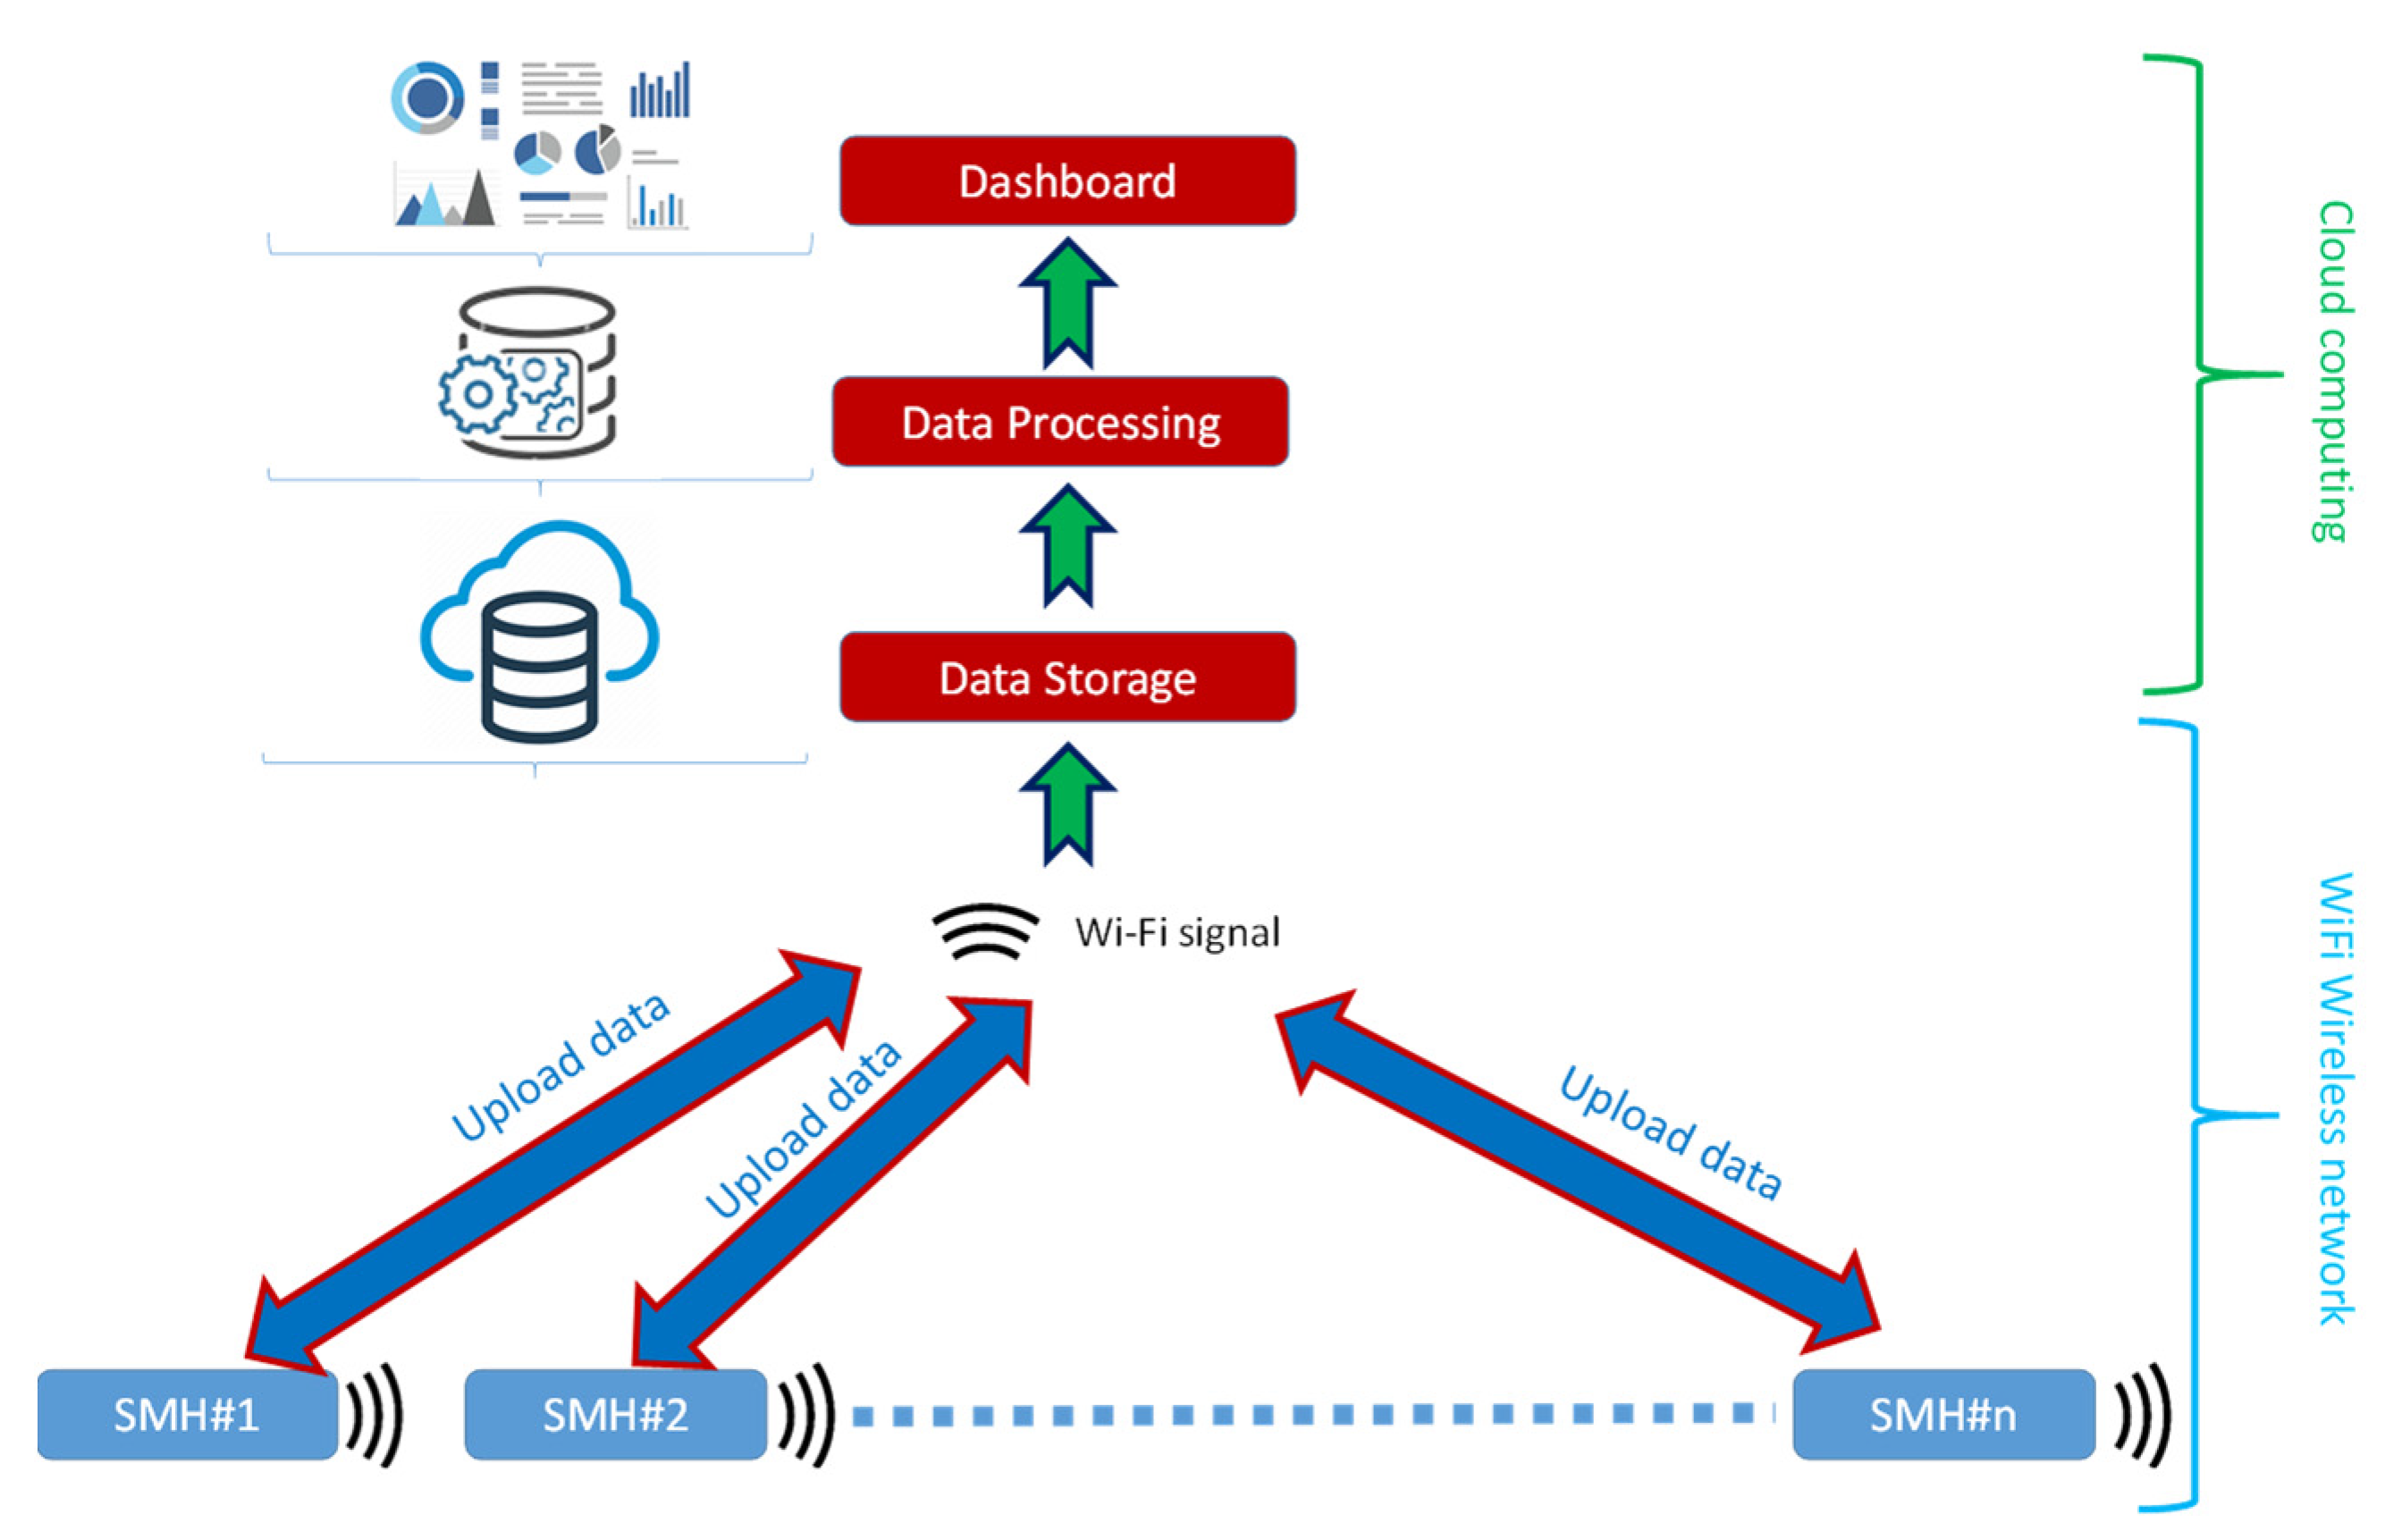
The SMH consists of a first data acquisition module that automatically collects data on electrical variables (voltage, current, power factor, active power, and reactive power) every half second. This information is dumped directly into a data storage system, allowing processing without performance problems, and can be performed by several devices at once. Subsequently, this large amount of data is processed asynchronously for analysis and selection. Interesting data for the different control panels (dashboards) are then loaded in a web portal so that any user can study, analyse, or even download them. Each of these system modules is detailed below.
Figure 1 shows the system architecture.
3.1. Data Acquisition
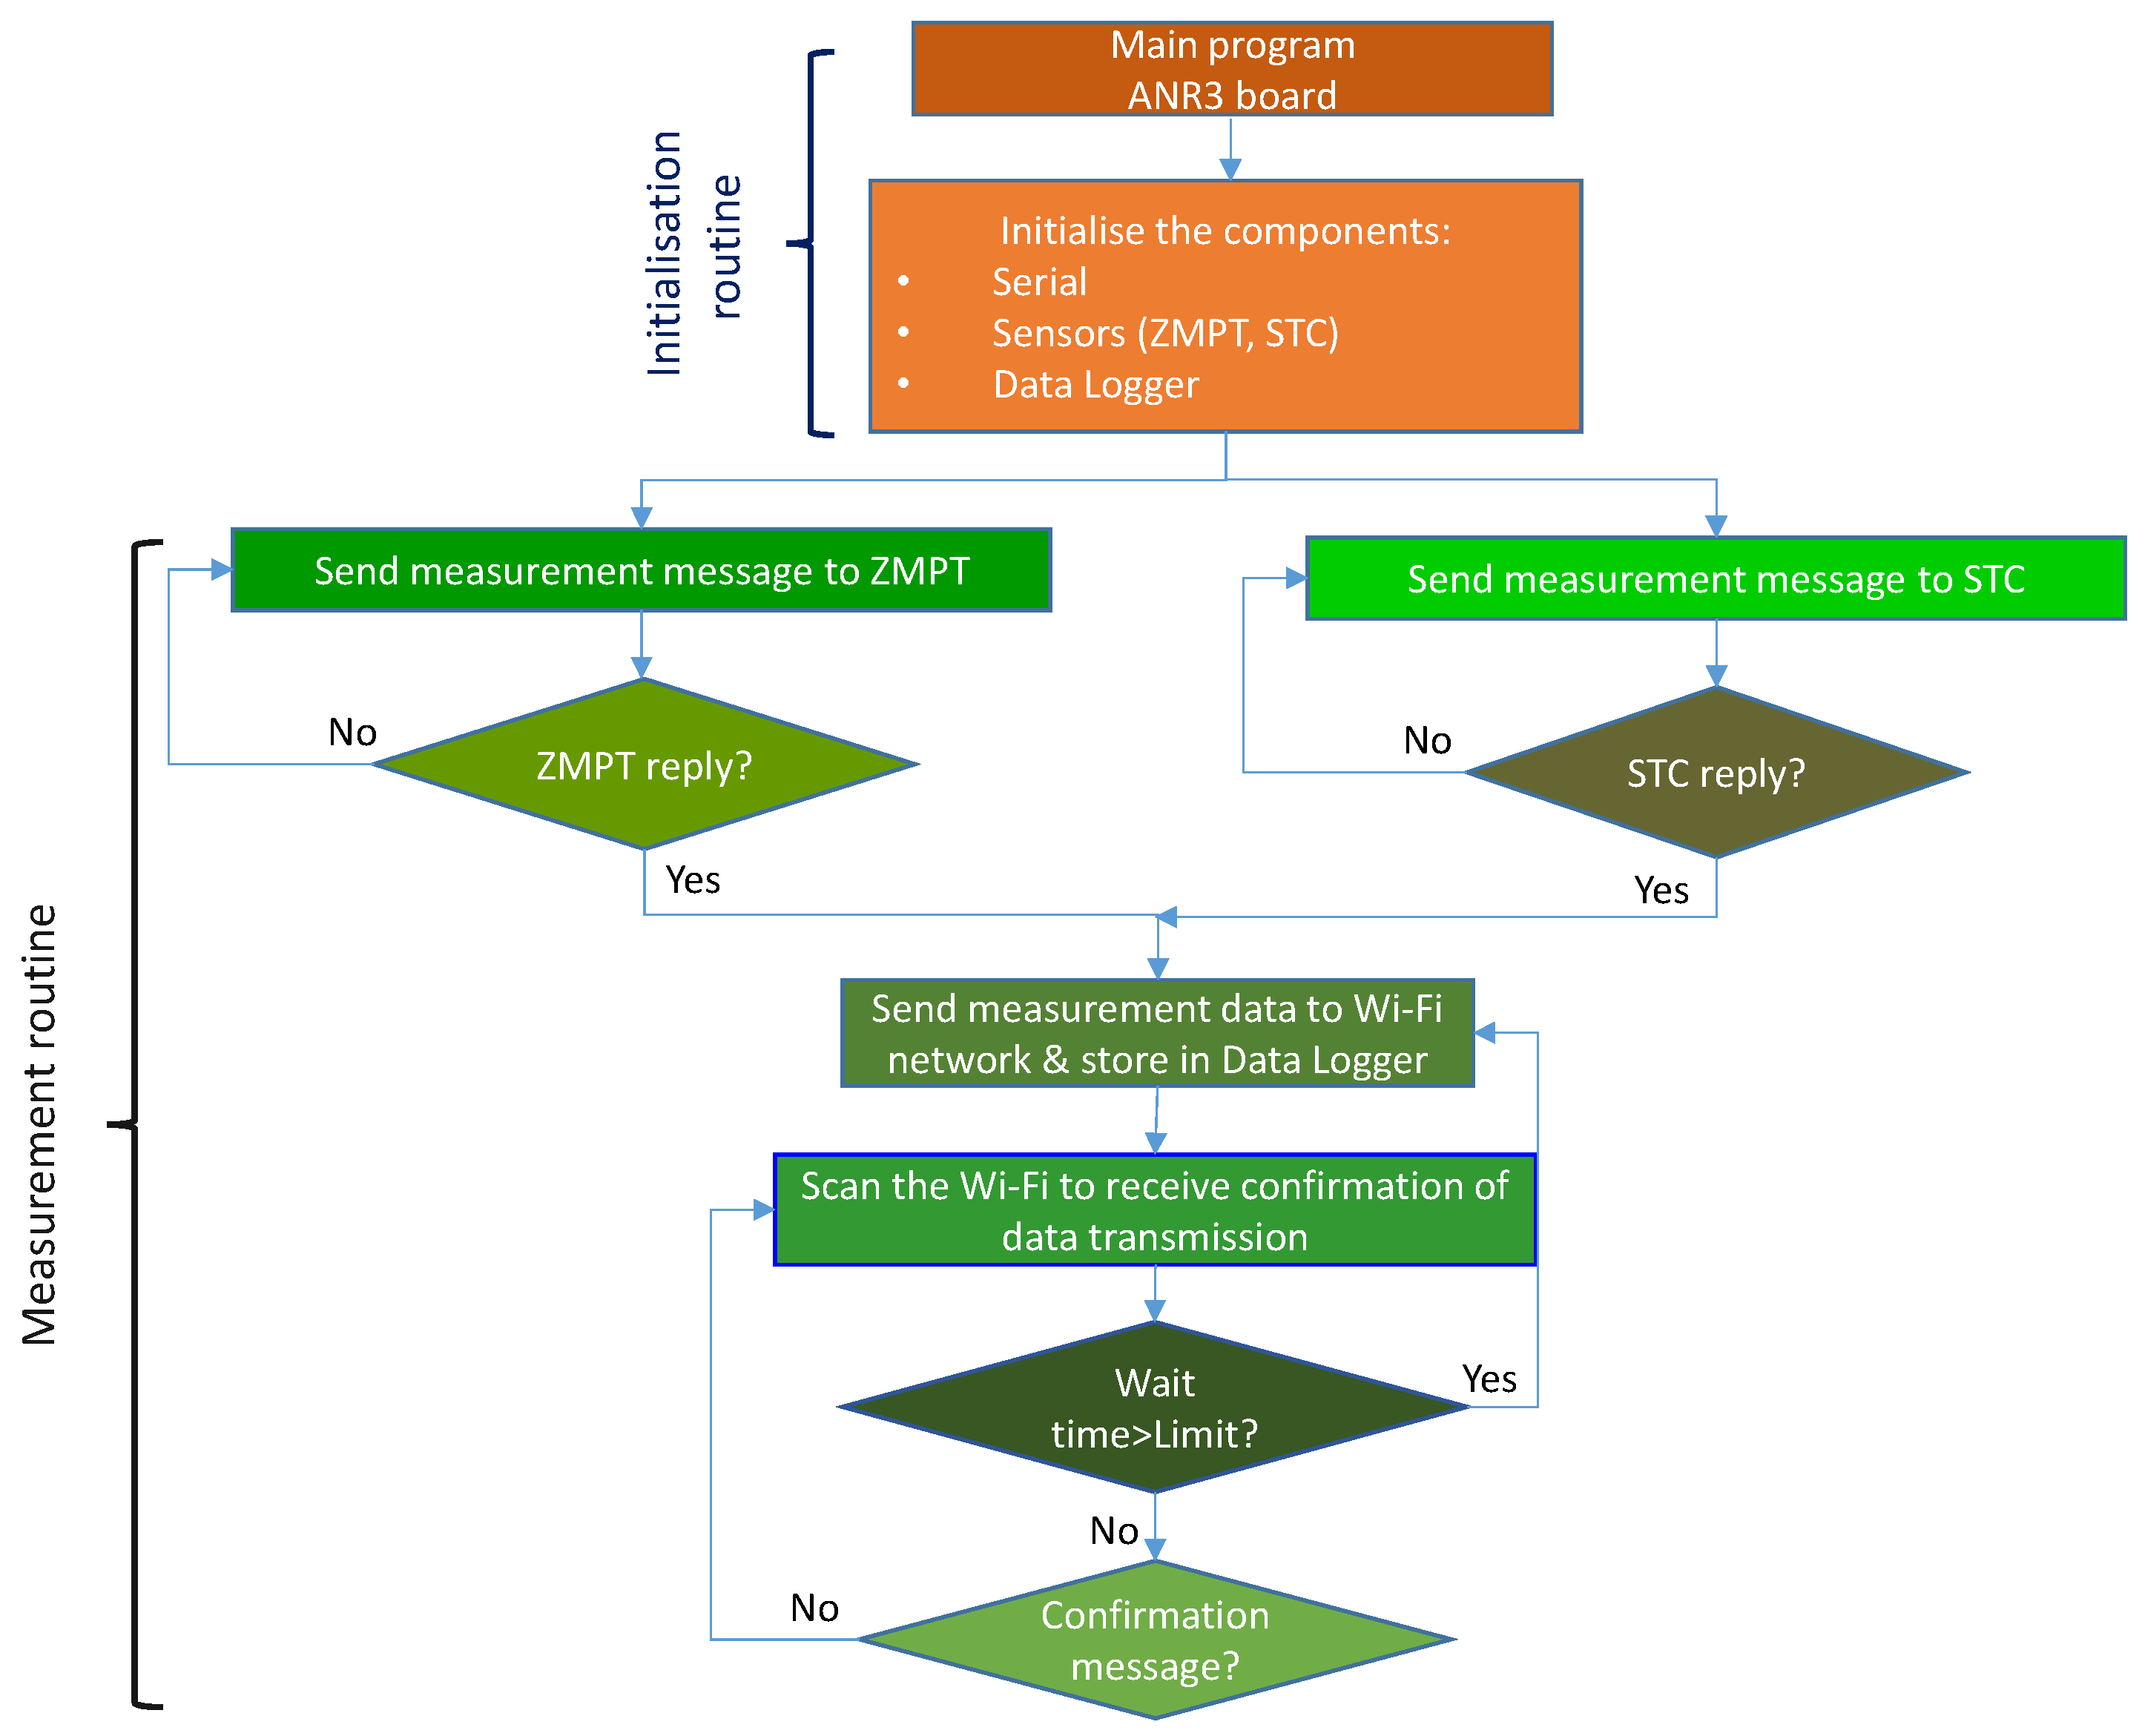
The flow chart in
Figure 2 shows the data acquisition performed with the SMH by the Arduino Nano Rev3 (ANR3) microcontroller. The first task is the initialization of the system. Then the continuous measurement of the fundamental electrical variables (
v,
i) is performed using the analogue inputs A0 (
v), A4, and A5 (
i). Once the variables are processed, they are sent through the serial port to the Arduino Wemos D1 mini (WD1m) microcontroller and a backup copy is made to the SD memory card.
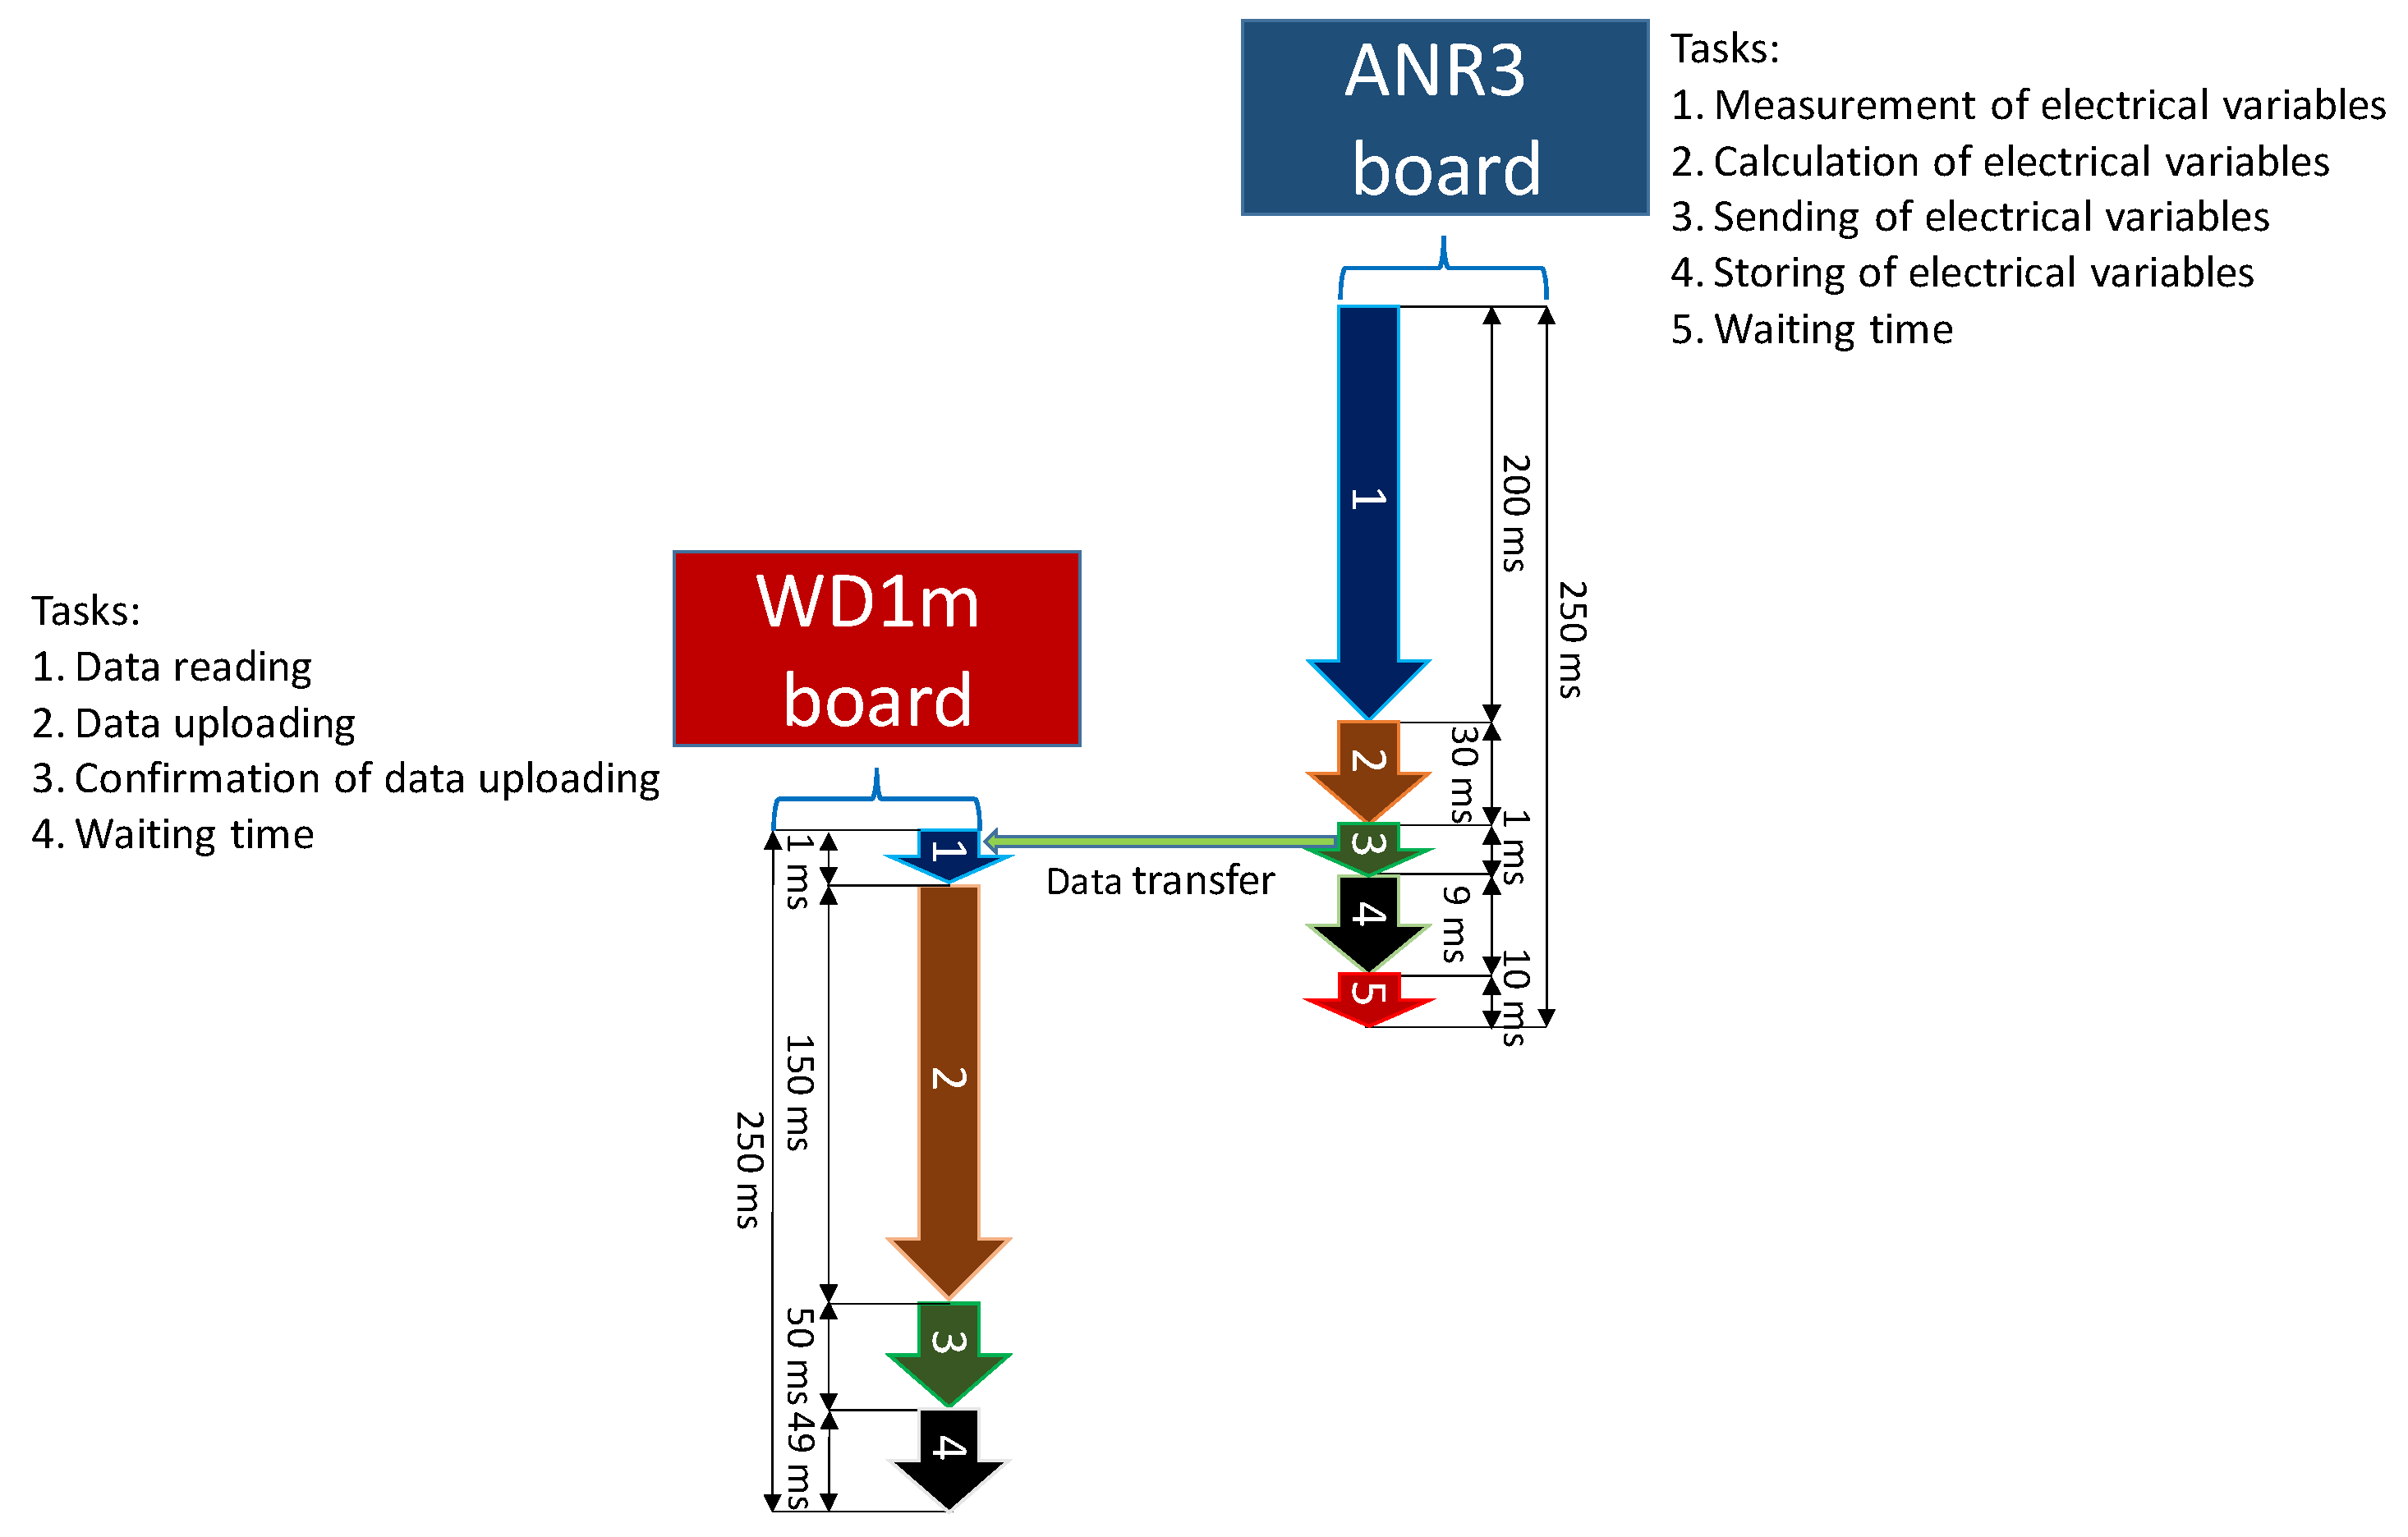
Each of the tasks to be performed requires a processing time: (i) 10 cycle measurement of the input signals (200 ms); (ii) obtaining the fundamental and derived variables (30 ms); (iii) sending data to ANR3 (1 ms); (iv) storing data on the SD card (9 ms); and (v) waiting time until the next measurement (10 ms). The chosen sampling frequency is 1 kHz (1 ms). Since the measurement time is 200 ms, 200 samples are obtained in ten cycles of the measured signal. The timeline for the measurement process is shown in
Figure 3. In the first part of the process, ANR3 obtains the fundamental and derived electrical variables. Then, they are sent to WD1m and finally, the data are saved on the card. In parallel, WD1m receives the data from ANR3 and uploads them to the cloud using the Wi-Fi connection.
Due to the data acquisition time (0.5 s), rise times of 0.25 s are required. The free version of Firebase offers storage times that meet the above requirements, with storage times of 0.1 s.
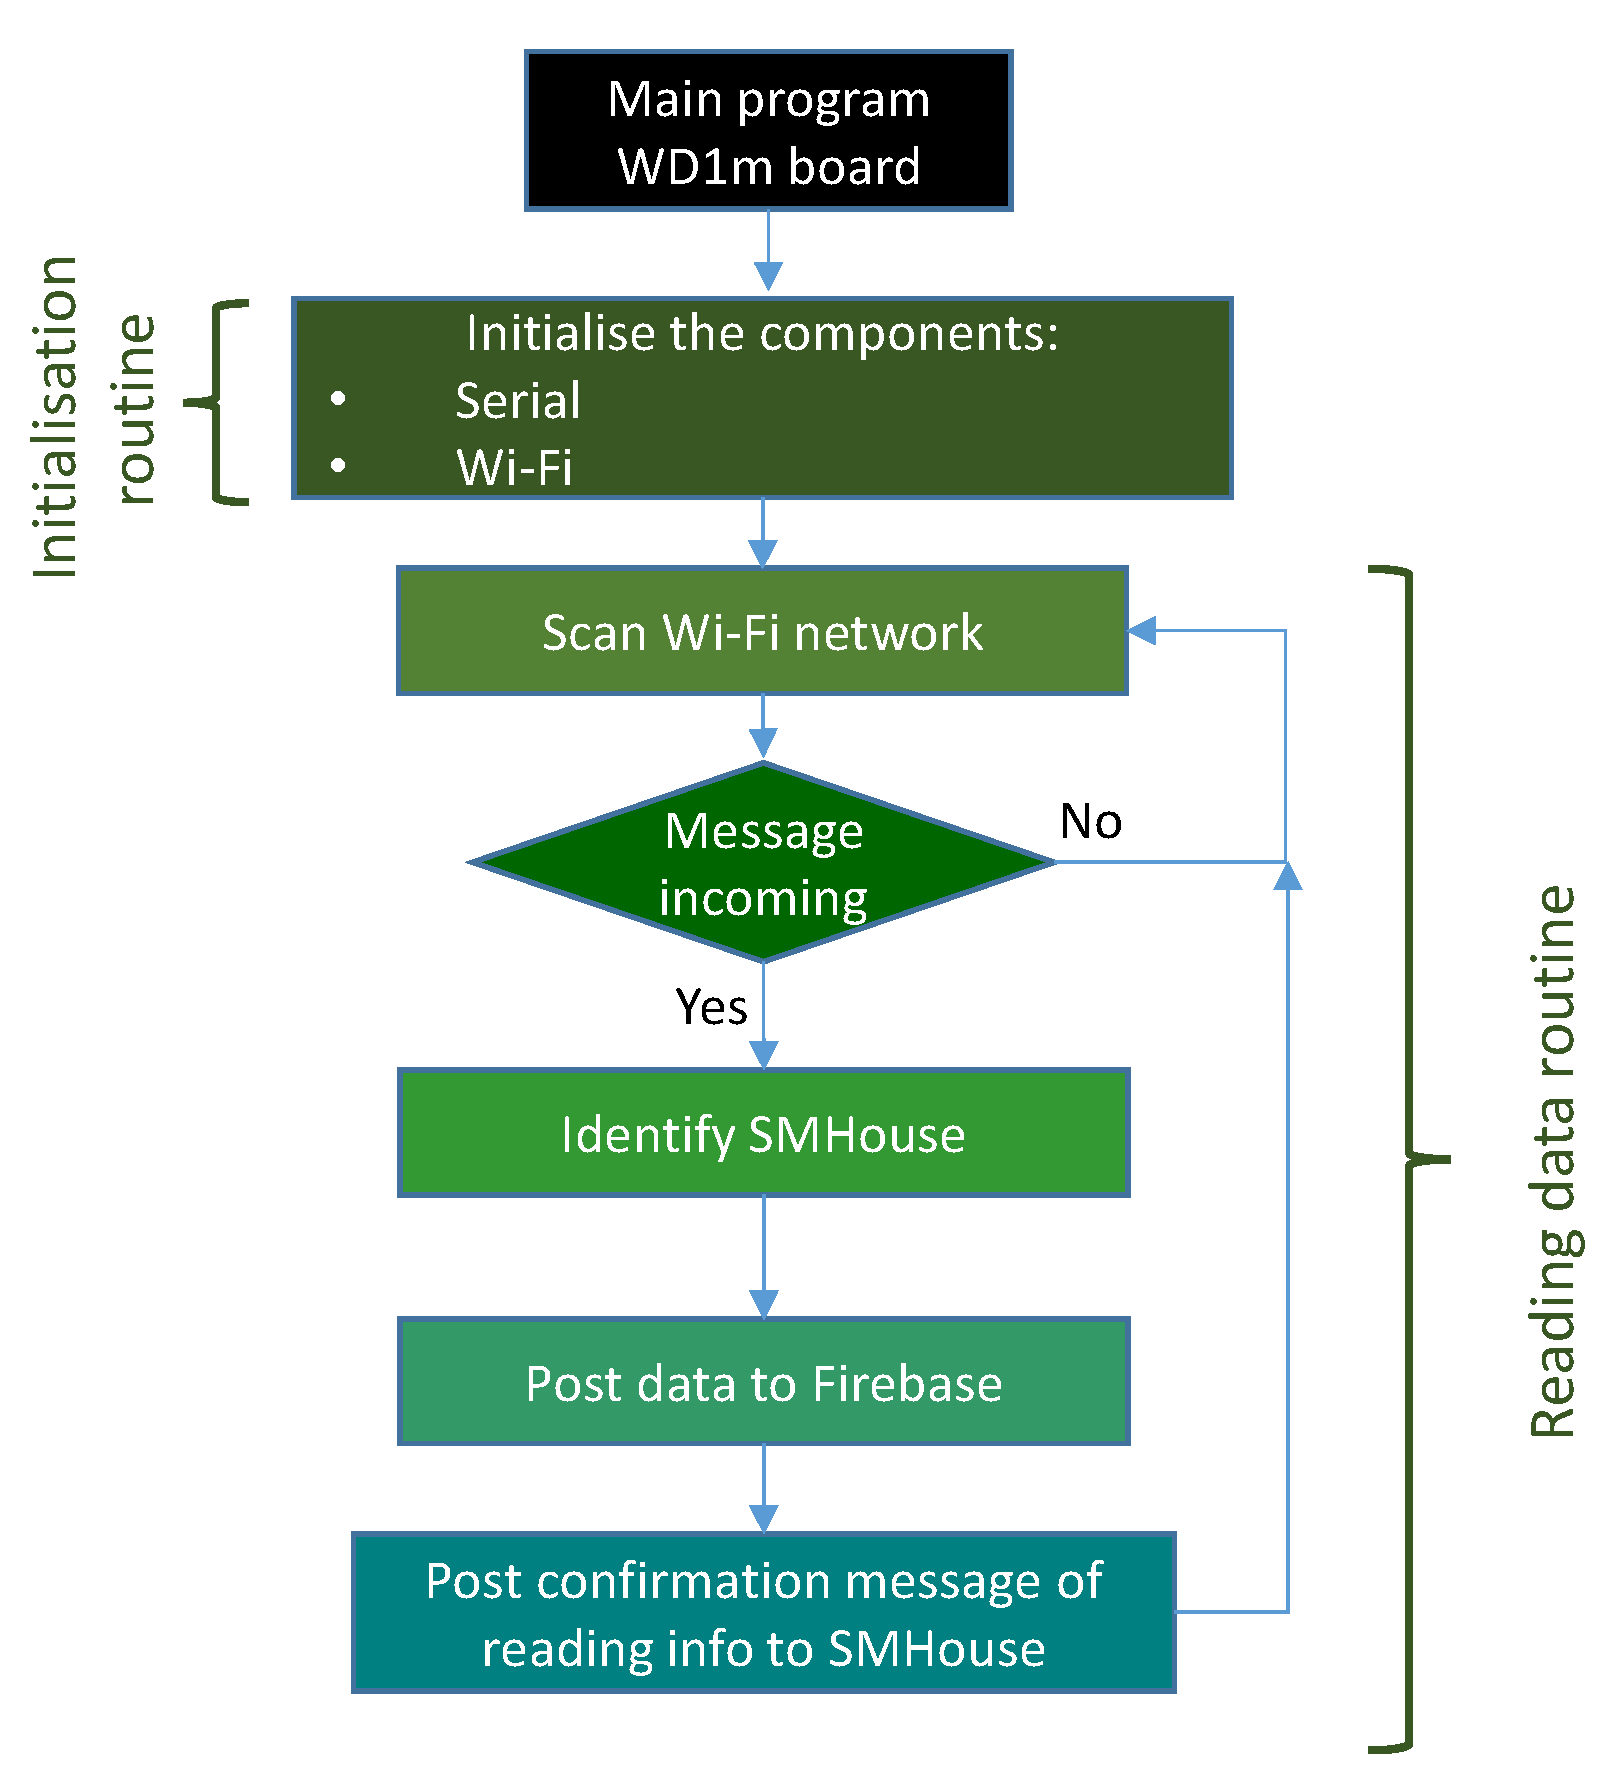
Figure 4 shows the flow chart of data uploading to the cloud. The process is performed continuously by WD1m with the following steps: (i) system initialization; (ii) reading of the serial port; (iii) uploading to the cloud; (iv) and confirmation of the data upload.
The timeline for the process developed by WD1m is shown in
Figure 3. The execution times are: (i) serial port data reading (1 ms); (ii) data upload to the cloud (150 ms); (iii) data upload confirmation (50 ms); (iv) and timeout (49 ms).
3.2. Data Processing
Huge amounts of data are generated every millisecond from thousands upon thousands of connected devices. This data, which constantly appears in the cloud, contains potentially great business value. For this reason, we need to perform effective data processing. In our system, once the data are obtained and stored in a “Not Only SQL” (NoSQL) database, it must be analysed and processed to obtain the maximum information possible. NoSQL is to talk about structures that allow us to store information in situations where relational databases generate certain problems. These issues are mainly due to the scalability and performance problems of relational databases, where thousands of concurrent users log on and millions of queries per day occur.
At this point, and when dealing with an information system that stores a huge amount of data, one of the first doubts is whether the data and information are all the same? Let us start by defining data as a symbolic representation of some situation or event, without any semantic sense, describing a concrete fact. However, we define information as a set of data that are properly processed so that they can provide a message that contributes to decision making when solving a problem or facing a situation in which any kind of decision making is required.
The main objective of this module is to move from that large amount of data obtained from the sensors of the data acquisition module to information that the end user can understand and process and that is oriented to decision making, among other things. The presented system automatically extracts and from time to time configures the data stored in the NoSQL system; it processes, filters, and loads them into the data system of the visualization platform described below.
3.3. Dashboard Design
The last module of the system, which serves the end user in visualizing aggregated information in various ways, is a set of dashboards with different purposes.
Dashboarding is a dynamic and purpose-based visual interface needed to display one-to-many database linkages so that the information can be presented for a single time period or dynamically monitored over time. This allows a user to quickly define focus areas of interest for their analysis.
Two dashboards were designed: a general dashboard and a device comparison dashboard. The purpose of the general dashboard is to analyse and display information about the load profiles in each household electrical vehicle (EV) consumption. This information can be used in studies related to consumption habits, load forecasts, and demand estimates. The purpose of the device comparison dashboard is to determine consumption patterns in different inhabited areas, analyse the different loads used, and offer studies for the development and planning of electrical networks.
4. System Integration
The technologies used in each module of the system and their integration are described below.
4.1. Automatic Data Collection
The SMH used is based on the Arduino ANR3 and WD1m boards with local and cloud storage. The data capture is performed with voltage sensors
v and current
i, which send data through the analogue inputs of ANR3. Subsequently, the active power variables
p, reactive
q, and power factor
PF are calculated. The data are then uploaded by WD1m to the cloud.
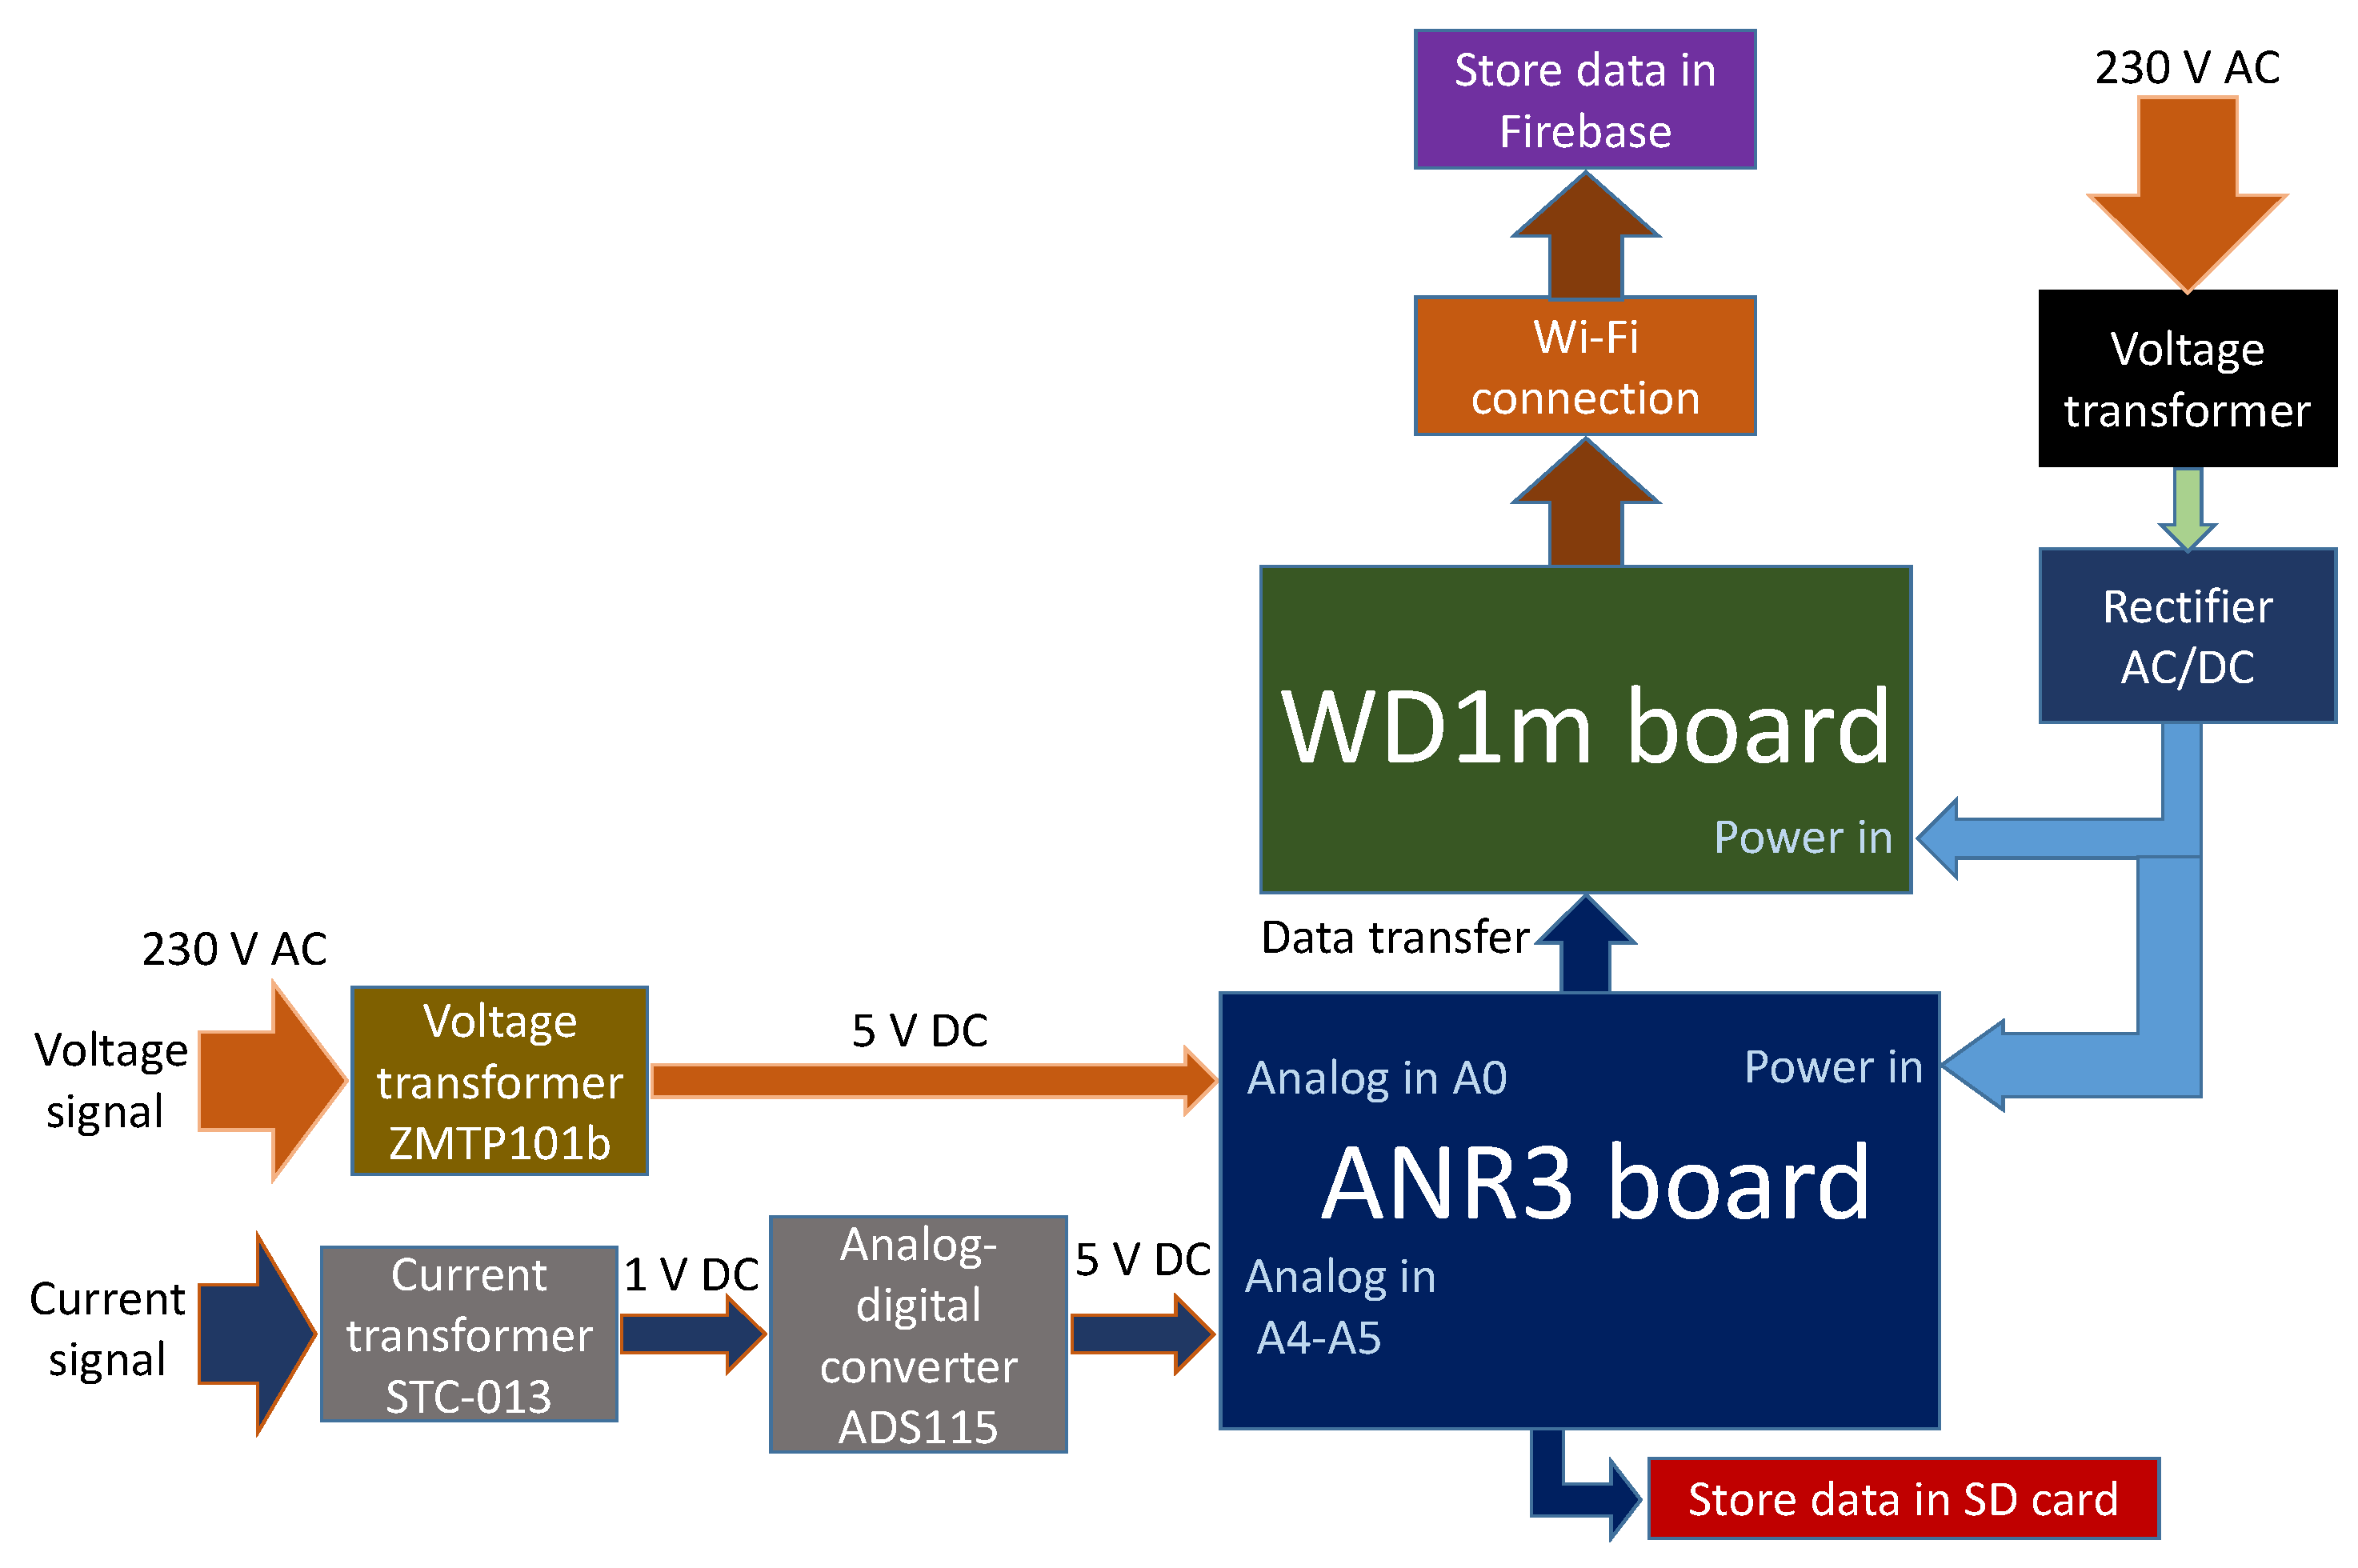
Figure 5 shows the SMH block diagram.
The SMH is powered from the mains using a dual 12 V output transformer. The supply signal is rectified to 12 V DC, which is within the range of the supply voltages (range 7–12 V DC) supported by ANR3 and WD1m. The voltage sensor ZMTP101b is connected to the 230 V mains and has an output of 5 V DC, which is supported by the analogue input of ANR3. The current sensor used, STC-013, has a measuring range of 30 A, which translates to 1 V DC. Since the analogue input of Arduino is 5 V, the voltage is increased from 1 V to 5 V DC by means of the digital/analogue converter ADS1115, the voltage is increased from 1 V to 5 V DC.
Microcontroller: ANR3 is developed on the basis of the ATmega328P microcontroller as an open-source platform for prototype development. It has a clock speed of 16 MHz, which allows measurements in very short time intervals (0.25 s).
Wireless communication WD1m uses the ESP8266 platform for Wi-Fi communication access, which works with the 802.11 b/g/n wireless system standard. This board ensures upload times to the cloud of less than 0.15 s, being less than the expected 0.25 s.
Current sensor: The current sensor (STC-013) used in this research is of the non-invasive type. This means that it does not modify the monitored electrical installation. The 30 A version was chosen, which can be used in households up to 6600 W. For higher currents, there is a 100 A version with a maximum power of 23,000 W. To increase the 1 V DC output of the current sensor to the 5 V analogue input of ANR3, an ADS1115 digital/analogue converter is used.
Voltage sensor: The voltage sensor used is the ZMPT101b voltage transformer. It switches from 230 V AC from the mains to 5 V DC from the analogue input of ANR3, directly obtaining the reading without the need for any intermediate equipment.
Datalogger shield: Due to the loss of data through the Internet connection, an SD card mounted on a datalogger shield is used as a backup, ensuring storage without loss of data. In this case, an 8 GB SD card was used, which allows data storage for 3.76 years.
Storage: From time to time, configured in the Arduino device, the data are sent to the central data system. This massive data storage system is Firebase, a platform for the development of web and mobile applications created by Google in 2014.
Specifically, the Firebase Realtime Database is a NoSQL database hosted in the cloud that provides great performance for this type of connection. For the volume of data produced by these models, SQL-based data queries are not efficient.
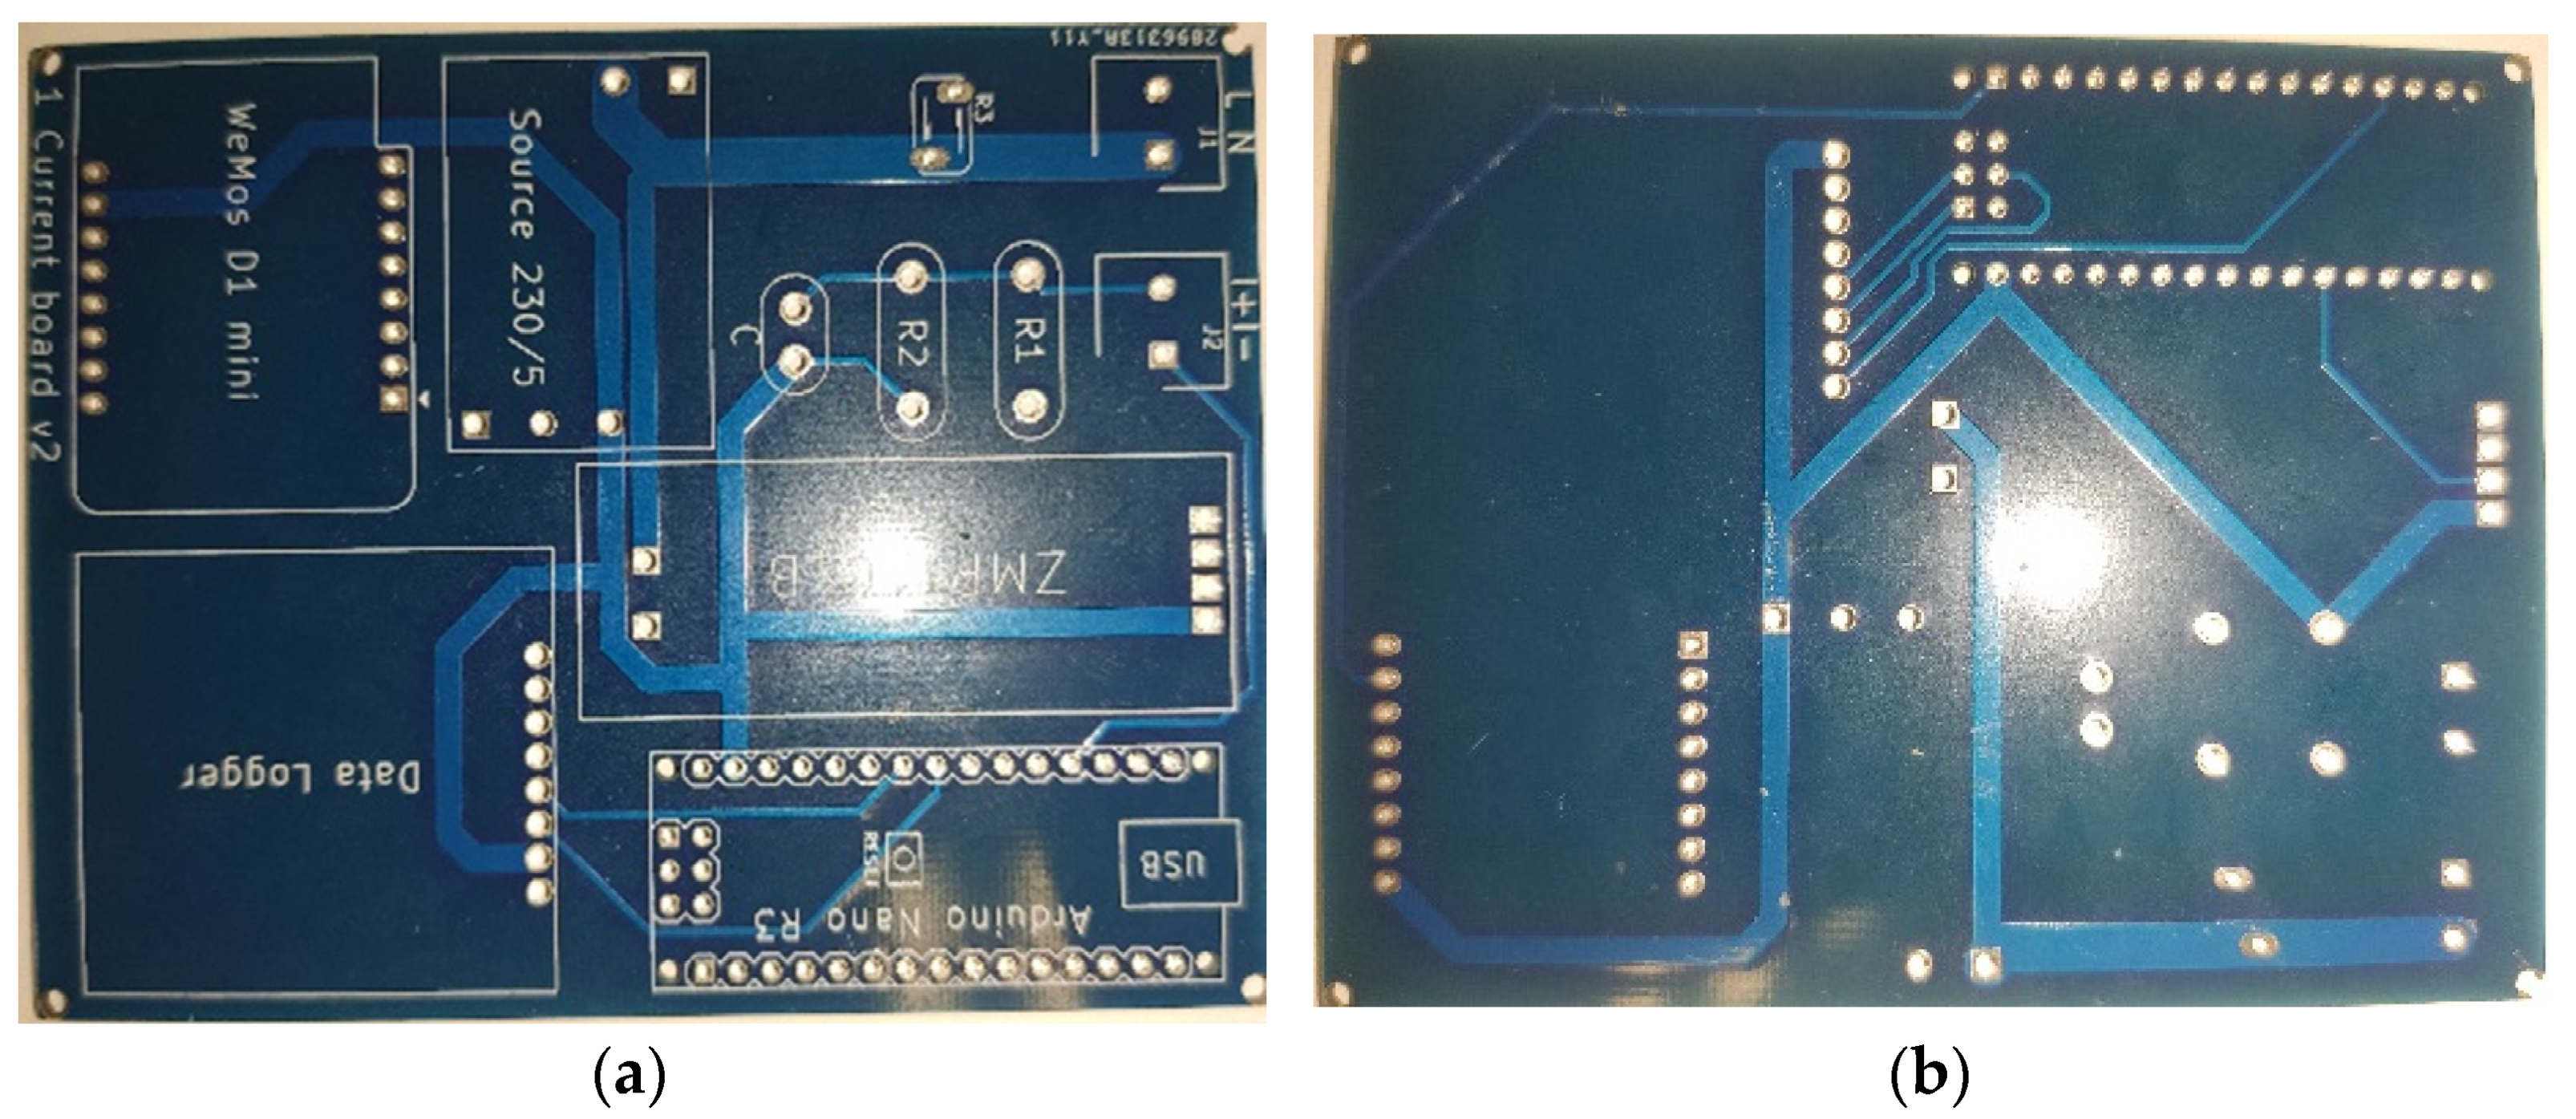
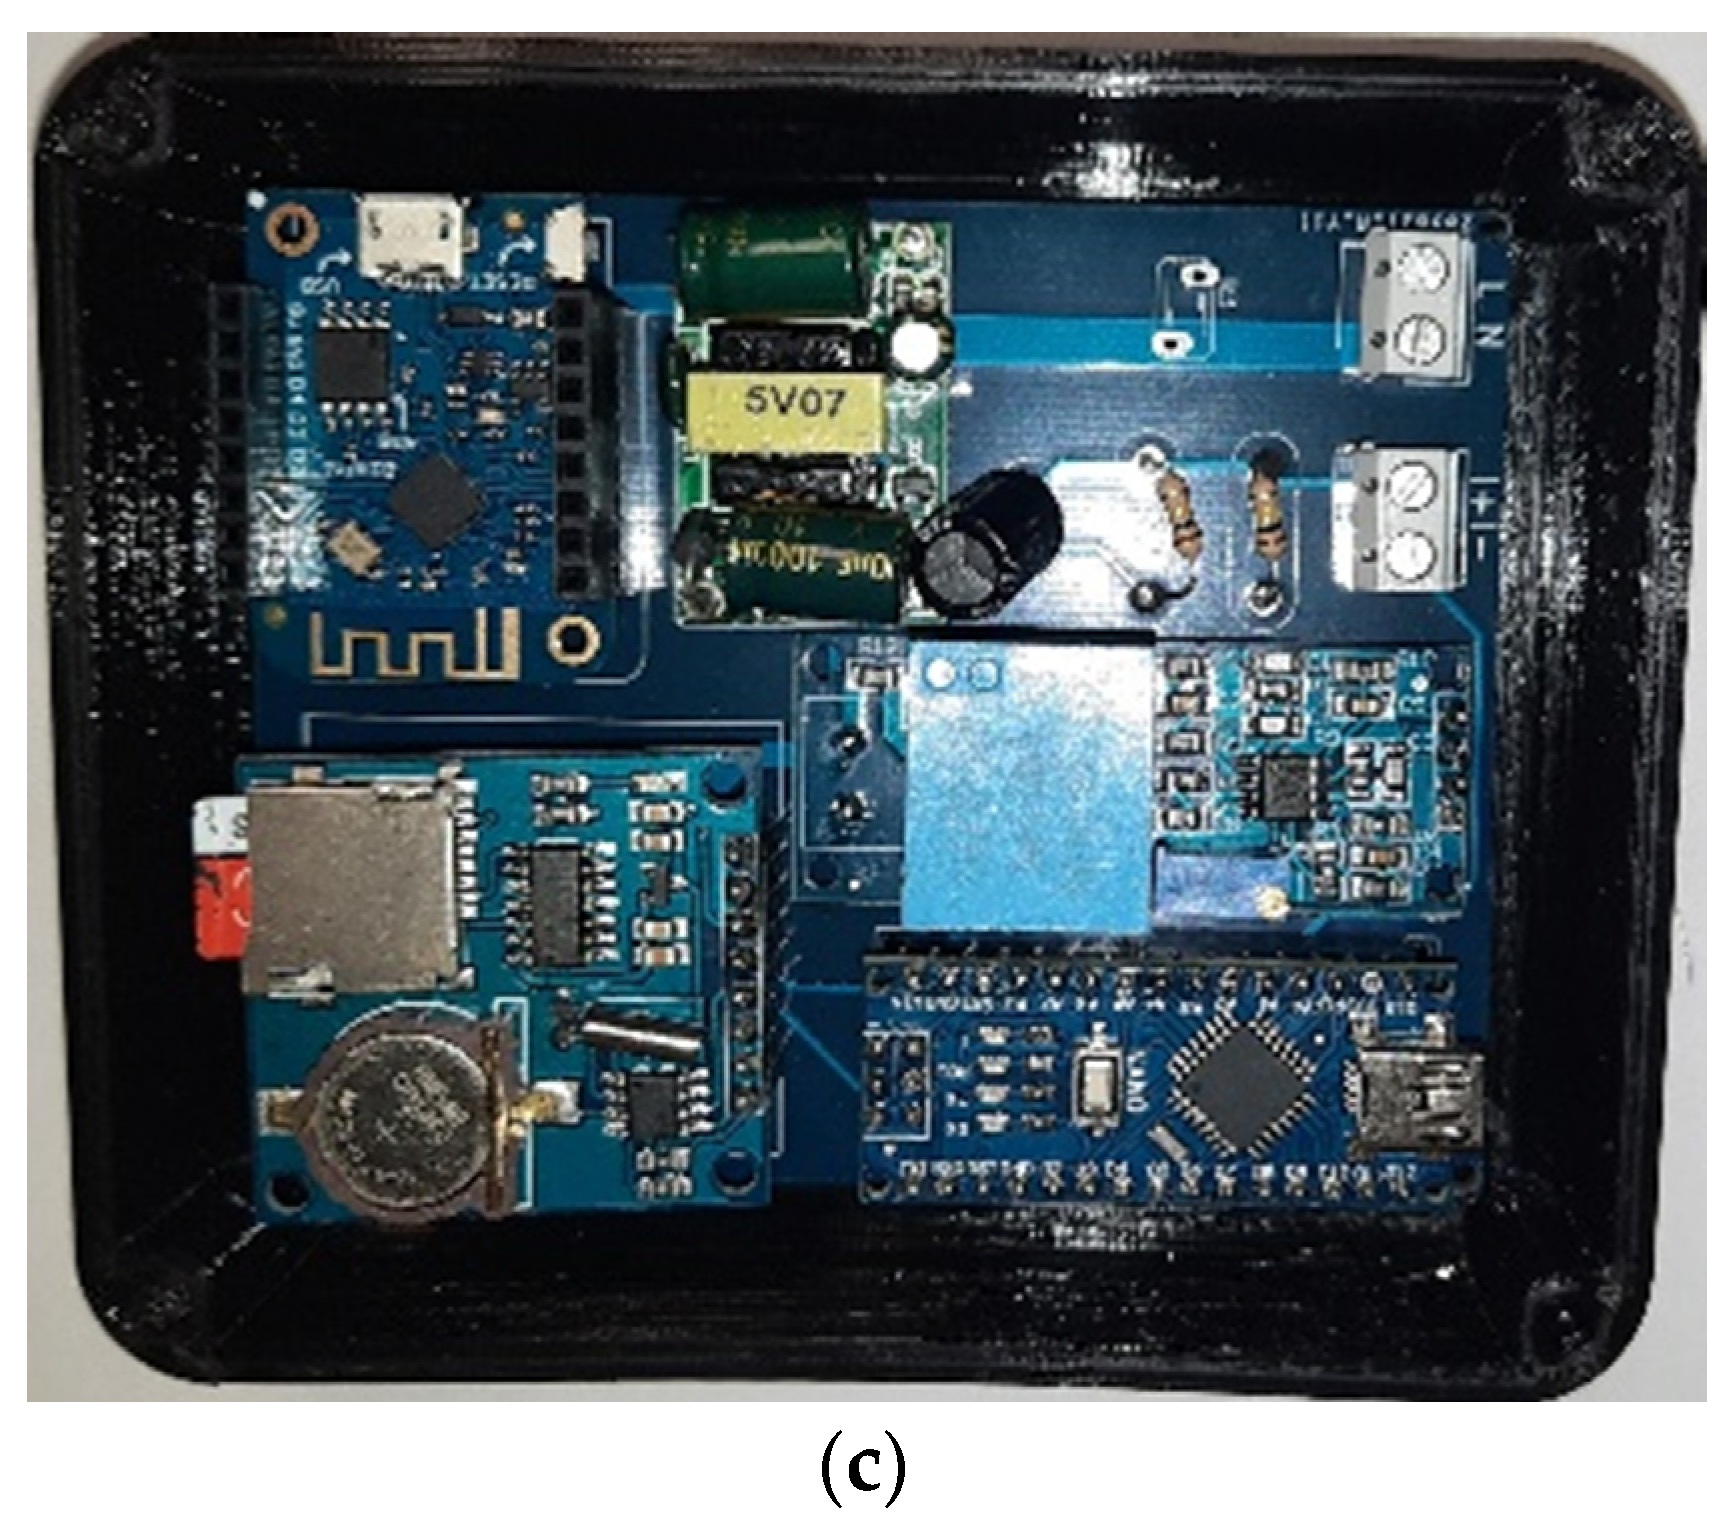
The PCB board for the SMH was designed and built. The board allows the connection of all the components used, which are soldered and therefore a solid and resistant final system. The dimensions of the PCB board are 88 mm × 75 mm.
Figure 6 shows the design of the PCB board front side and assembled with components of the SMH.
In order to know whether the SMH is capable of mass production, it is necessary to make an economic assessment of the cost of the materials used. The budget also serves to validate the low-cost objective proposed earlier. The prices shown are from the manufacturers’ official shops. As these are open-source components, compatible components can be found to further reduce the price.
Table 2 shows the cost of the different components used.
4.2. Characteristics of Big Data
Volume: Big data systems are associated with large volumes of data. Thus, data are created by machines, networks, and social media. This means that the volume of data to be processed is high;
Variety: It is related to data formats and the different sources that generate them. Thus, the data format can be structured, semi-structured and unstructured. Since data are generated in formats such as photos, videos, logs, sensor devices, etc., this implies facing challenges in terms of data storage, mining and analysis;
Velocity: Refers to the pace of data generation and arrival. This section should include the processing and interpretation time of the data received to improve decision making;
Accuracy: It is essential that the data be reliable and of high quality. To this end, the tools that manage data truthfulness within big data systems must eliminate noise and abnormal data, which are modified to reliable and trustworthy data.
4.3. Big Data Framework for Households
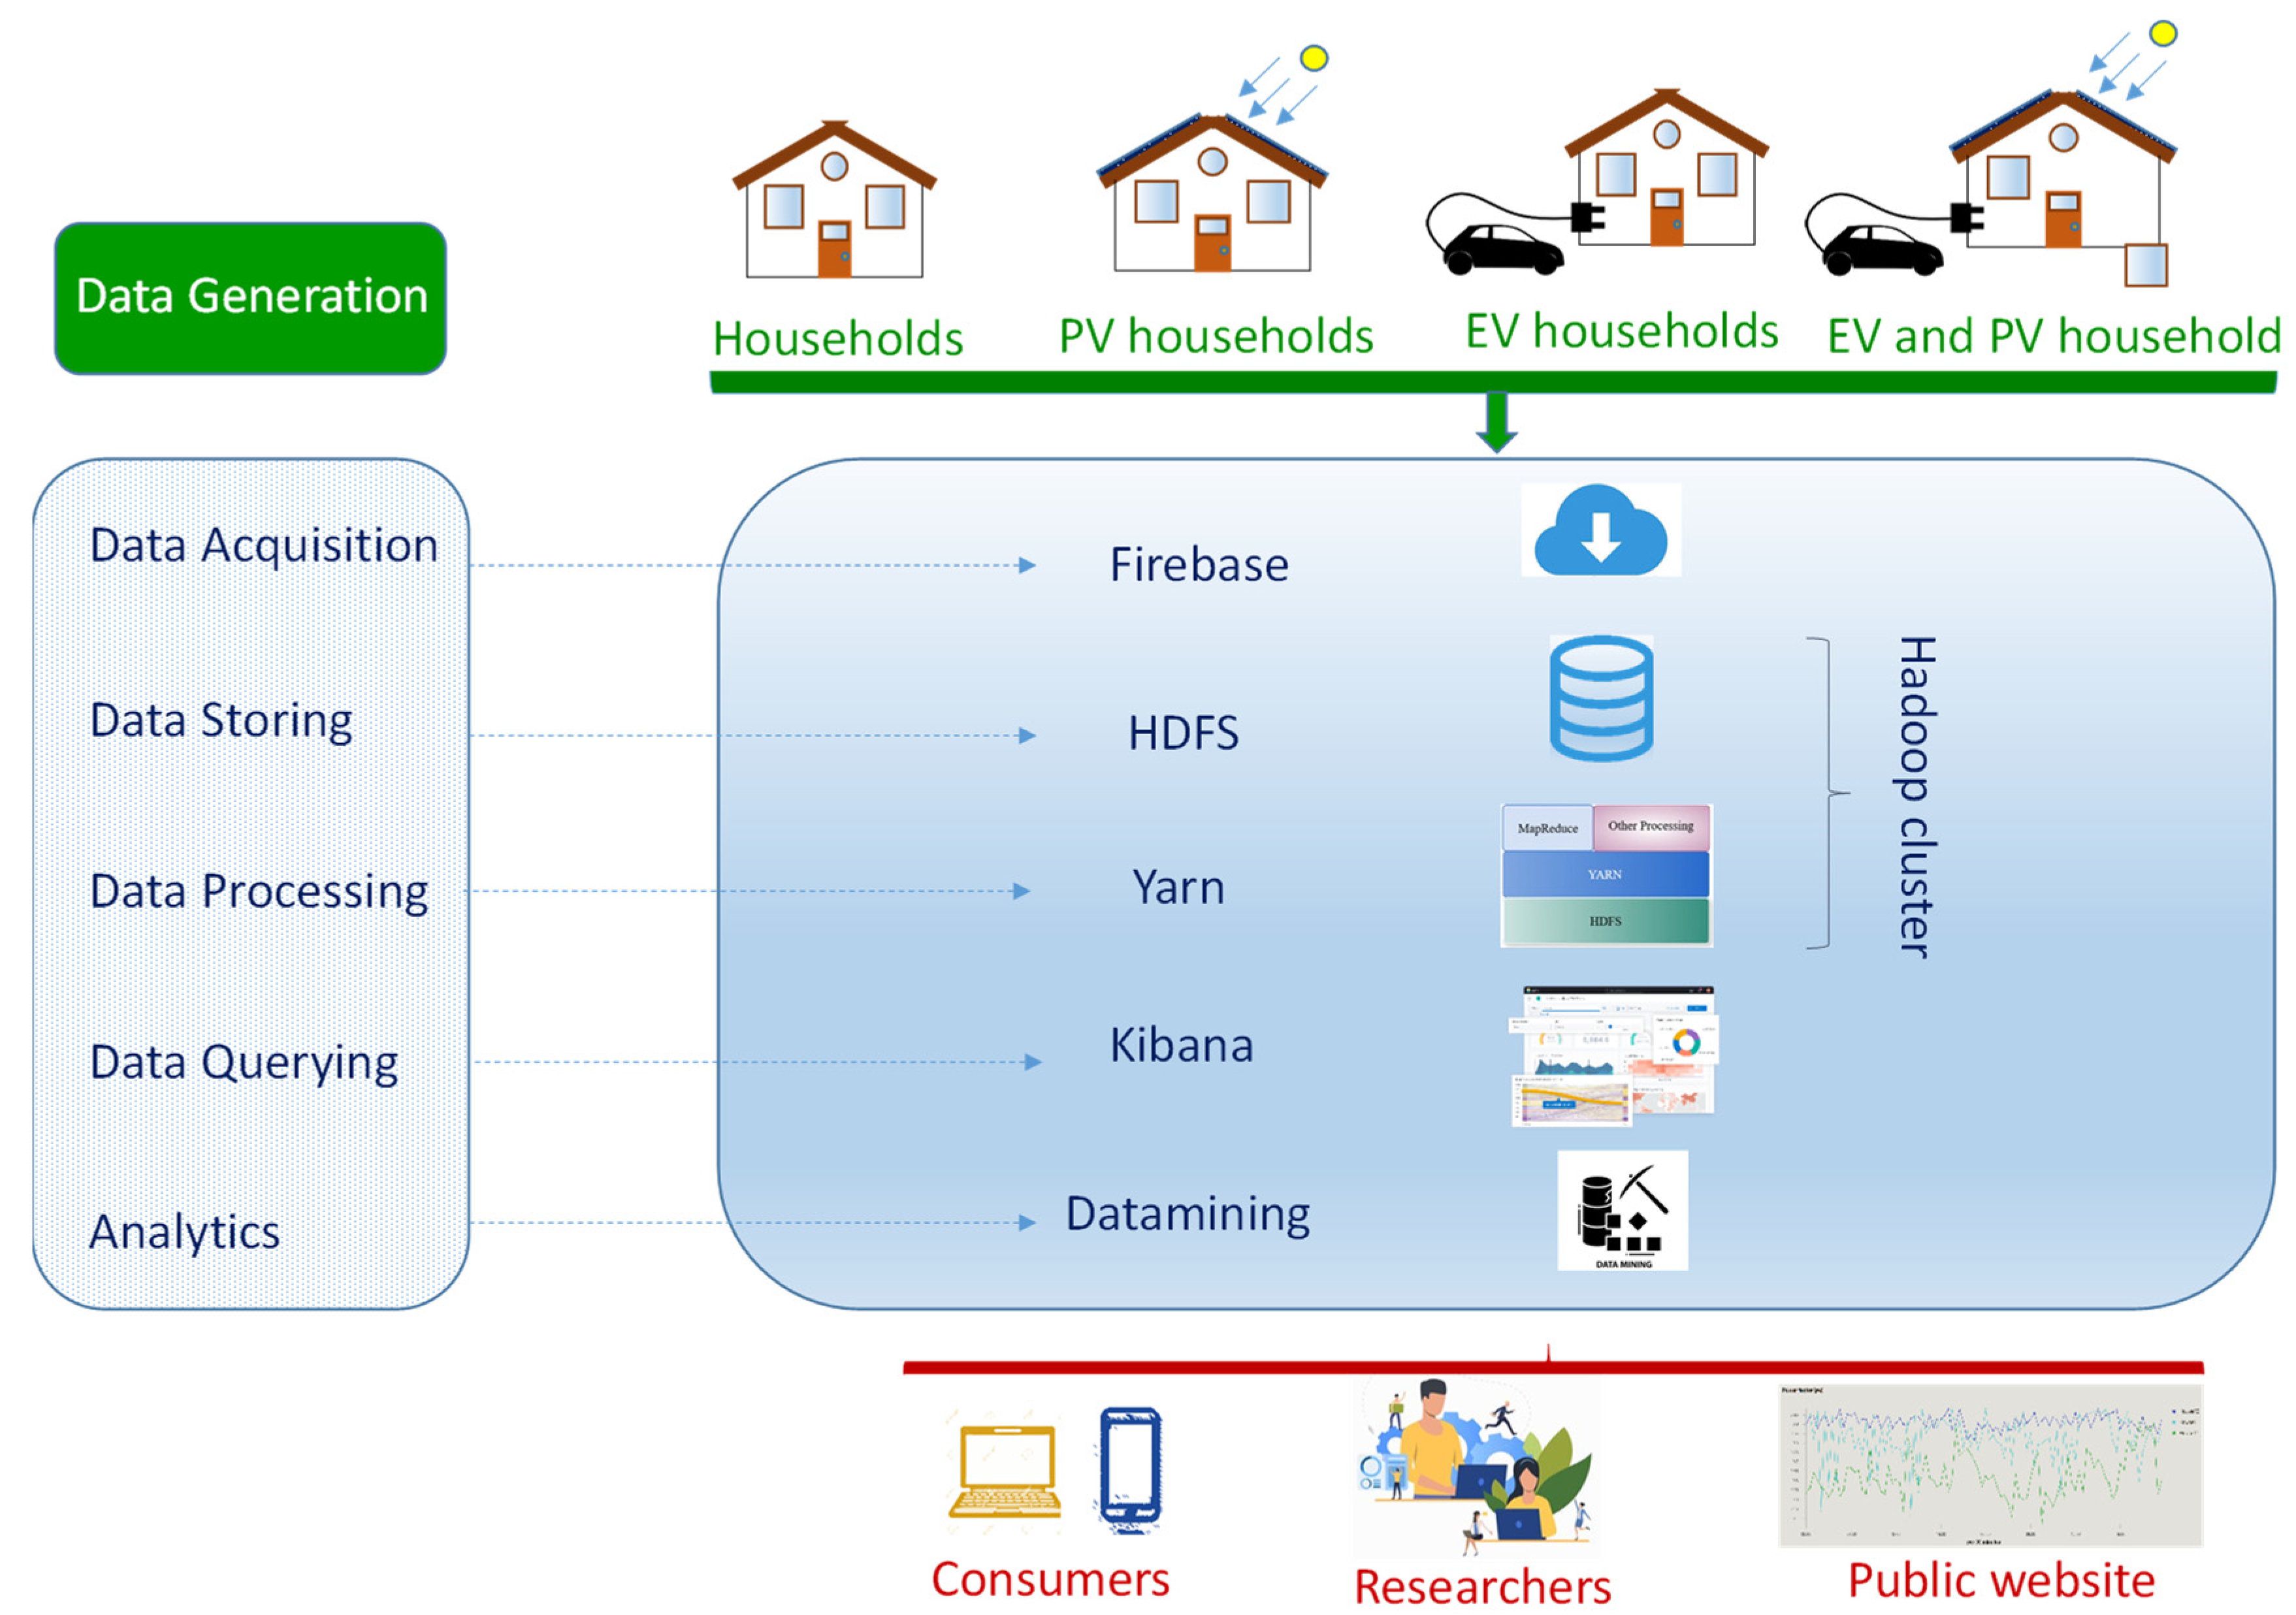
The framework presented comprises the data life cycle of the proposed network. It can be seen from the data generation phase to the analysis phase.
Figure 7 shows the framework that serves as the basis for dealing with the big data of the proposed network.
An integrated architecture based on big data and cloud computing is proposed. The system contains the following parts: the cloud environment, the big data tools and the database.
Figure 1 shows the architecture of the proposed system.
4.3.1. Data Generation
The generated data stream comes from SMs installed in houses and PV installations, measured every 0.5 s. The location of the monitored data is diverse (house, houses with PV, house with PV and EV, and houses with EV). It is possible to add the information of electrical variables generated with sensors that record meteorological variables. In addition, of the application to houses, commercial buildings, factories, and other renewable sources, etc., can be included.
4.3.2. Data Acquisition
The data acquisition of the designed platform has in three tasks: data collection, data transmission and data pre-processing. The generated data were explained in the previous point that are collected by the developed SM.
The transmission of the collected data is performed through one or more master nodes that are part of the Hadoop cluster. The collected data are sent to the data storage system where it is processed in the following phases.
Data integration uses techniques that aim to combine data from different SMs in order to unify the information. The files can be transferred in different formats, such as csv files, json files, etc.
The information generated by the SMs contains the time stamp, the ID of each house, voltage, current, active power, apparent power, and PF. In the data pre-processing phase, erroneous information is modified or removed to improve data quality.
The data acquisition system must fulfil the collection function. In this sense, it must collect, aggregate, and send large volumes of data from the SMs to the Hadoop master node. The data are stored in files within an HDFS repository in the formats used.
4.3.3. Data Storage and Processing
HDFS performs the function of storing data for further processing. HDFS clusters consist of a NameNode with the responsibility of controlling the file system metadata. DataNode lists are used to store the actual data. Hadoop Yarn is the resource manager for data analysis. Yarn runs in conjunction with HDFS on the same node list. This allows processing of nodes with data that are part of the system.
4.3.4. Data Query
Once the data are stored in Firebase, a Python script is developed, which is executed from time to time in an automatic and configurable way, by extracting, processing, and filtering all the information. This information is necessary for the next module, the system analysis, and visualization of the information. Subsequently, the information is uploaded to HDFS and the data can be consulted from Kibana.
4.3.5. Data Analysis
The data of each home is sent to each of the users of the home, who can view it through the web and App. They can also be consulted anonymously by the researchers to analyse load profiles, estimate electricity demand, optimize electricity consumption, etc.
The main objectives of this phase are the improvement and stability of the system. The role of the consumers is fundamental in the system. The data visualization is performed with a dashboard, and the information can be accessed through the app and web portal.
4.4. Dashboard
A dashboard is a type of graphical user interface which often provides at-a-glance views of key performance indicators (KPIs) relevant to a particular objective or business process. In a dashboard, which summarizes the information to be shown to the user according to one or several objectives, we usually find three types of elements:
Timeline. A timeline provides a visual representation of events that help you better understand history, a story, a process, or any other form of an event sequence arranged in chronological order and displayed along a line (usually drawn left to right or top to bottom);
KPIs. A key performance indicator is a measurable value that demonstrates the effectiveness of a company in achieving its key business objectives. The proposed KPI model plays a key role in this work on monitoring residential electricity consumption. The idea is to monitor the electrical variables of homes. Based on our experience in the implementation and creation of SM projects, we defined the most relevant characteristics to know the performance of this type of systems. The proposed KPI allows to measure the quality of the measurements made, the power and energy consumption of the house;
Data tables. It is very common to find this element within a dashboard, which serves to analyse specific data and usually to download the set of data being displayed. The data table feature allows tabular representation of a database query to be displayed. It also allows you and consumers to manipulate the display of the data in the able while in the dashboard. For example, users can resize, sort, and change the order of columns.
Different methods were tested for information visualization, including systems developed from scratch, some commercial systems such as Microsoft Power Bi 3, a data analysis software solution with predefined graphs, etc. Finally, it was decided to use Elastic’s ELK stack 4. Elastic Search is a NoSQL search engine built on top of Apache Lucene, a free and open-source information retrieval software library. Aligned with the Elastic Search project is the open-source visualization and analysis system, Kibana, which we utilized for custom stakeholder dashboarding. The dashboards create a visualization the stakeholder selected analysis and can be extended to recommend robust strategies to support decision making. All these tools were integrated to work together to create a complete SG system.
5. Results
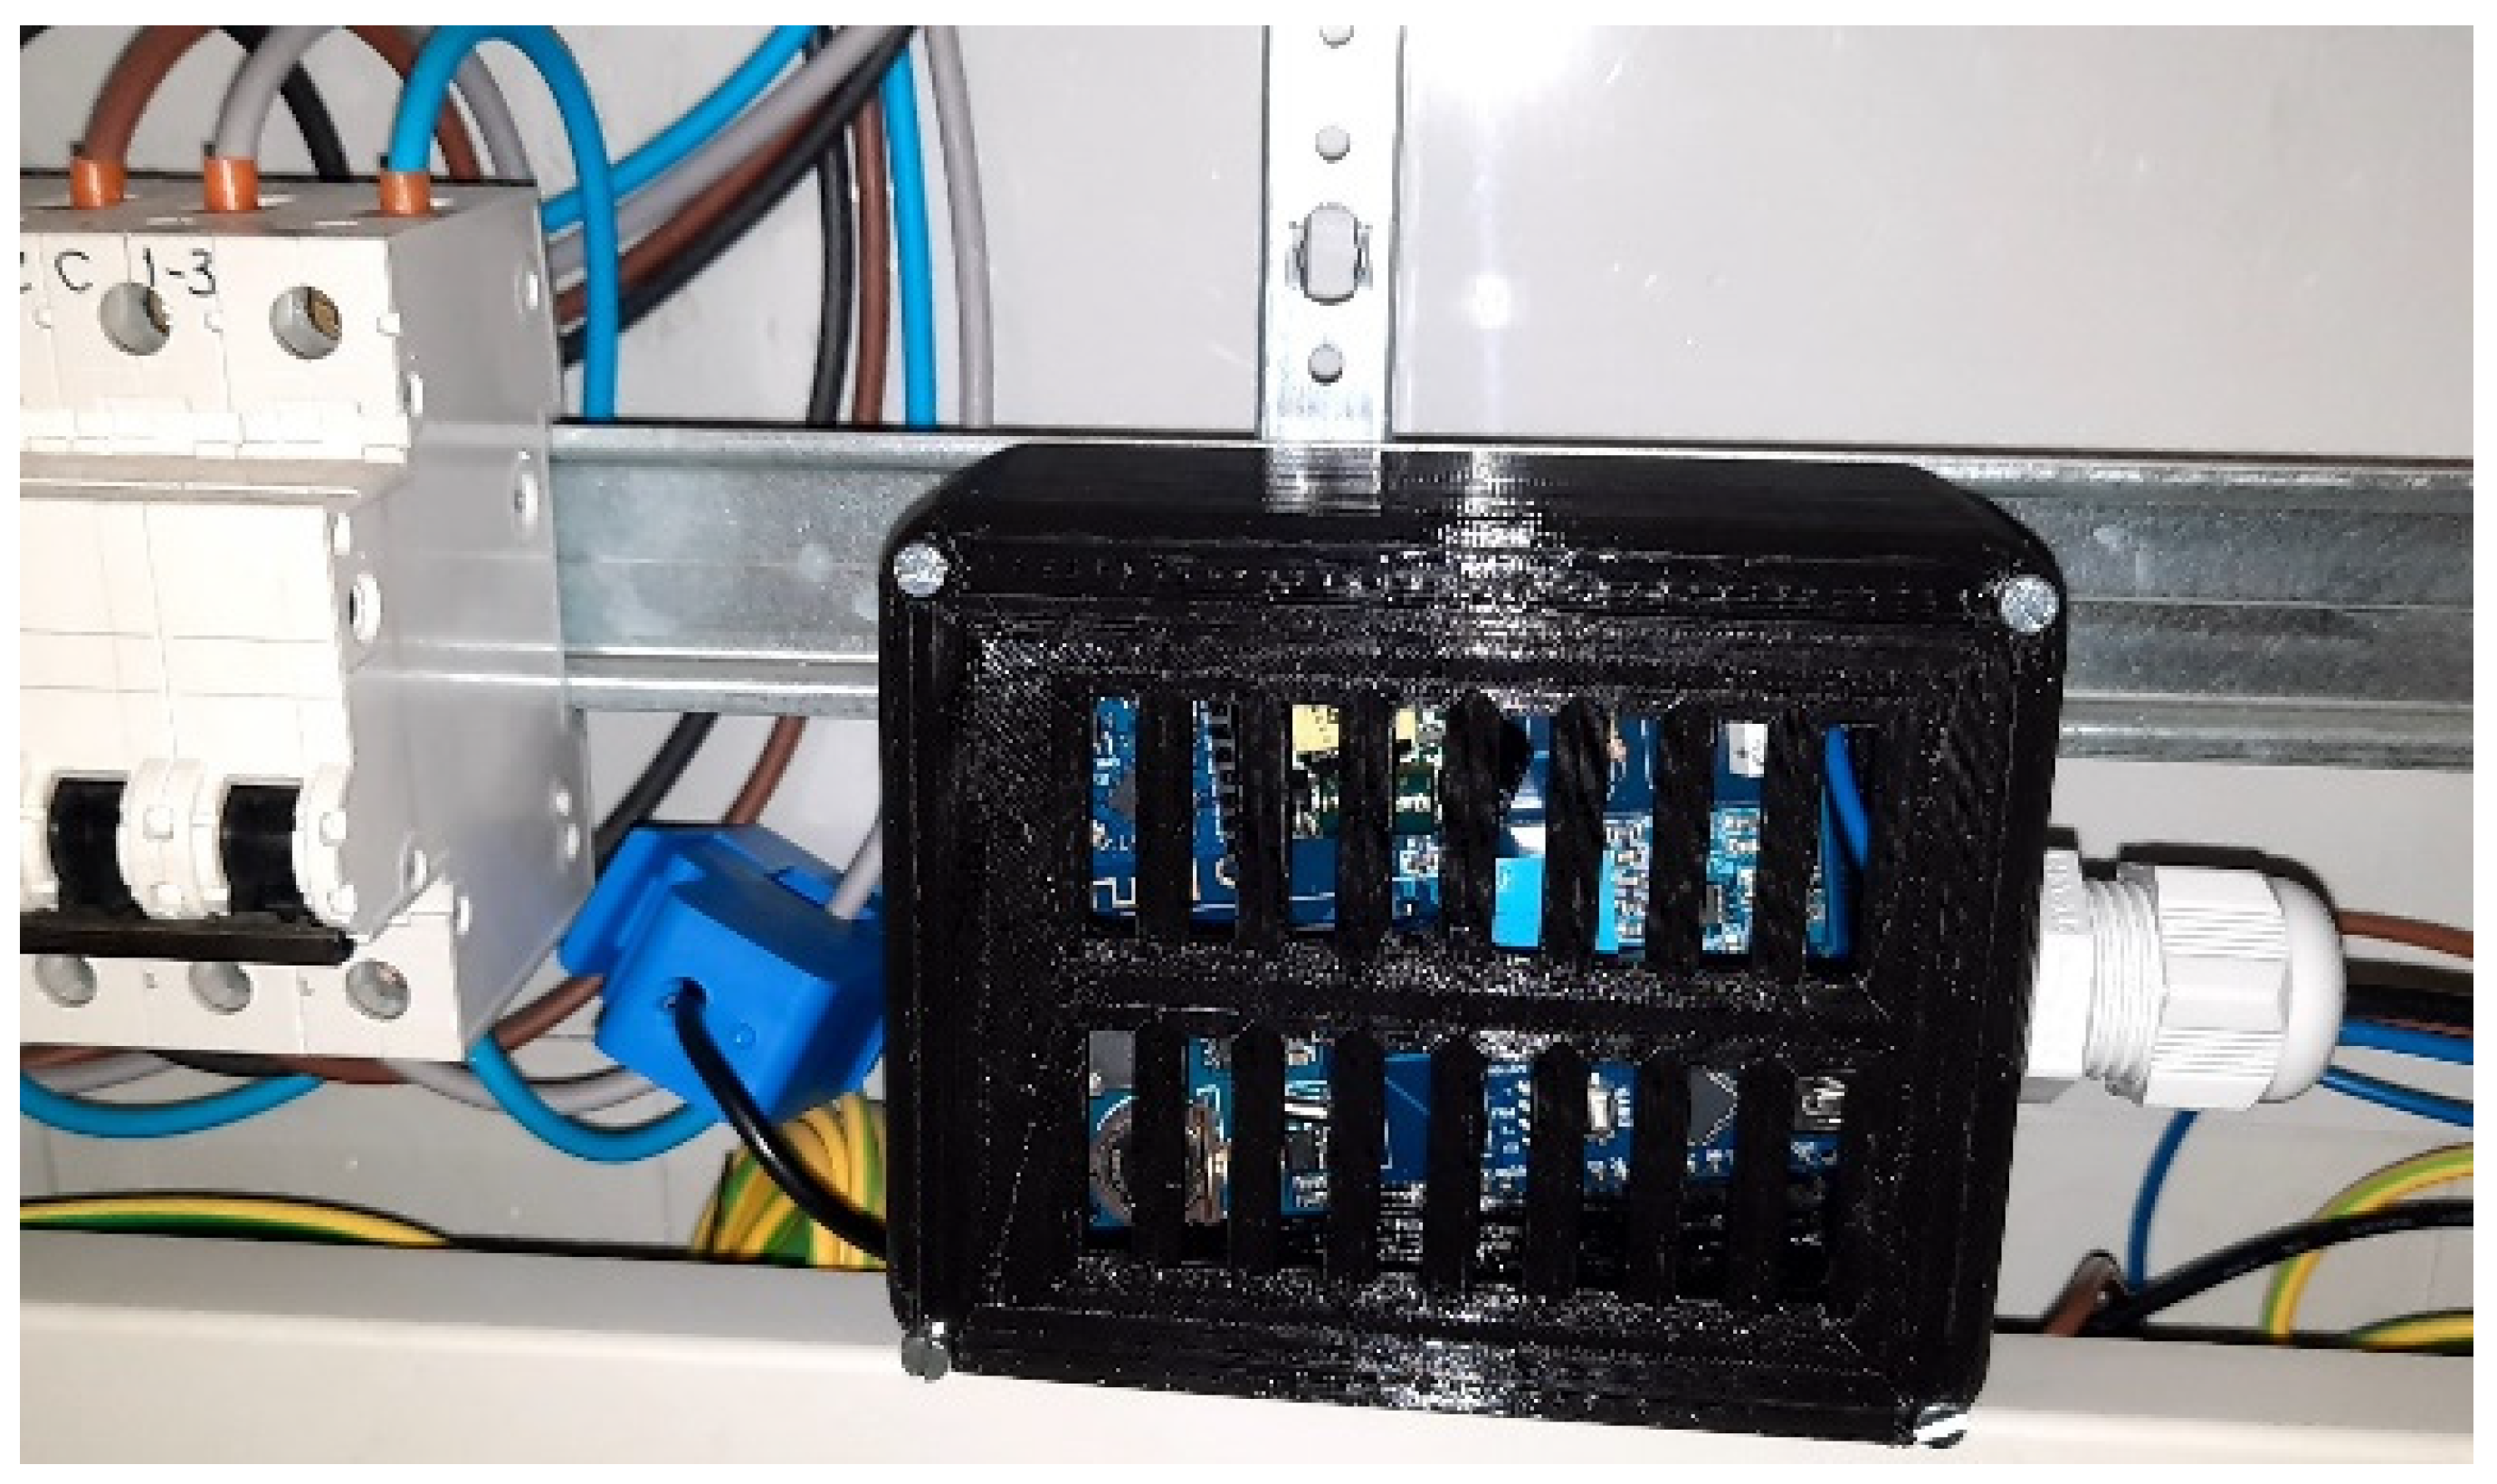
This section shows the tests carried out with the SMH. For this purpose, data were collected from several households located in Jaén, Andalusia, Spain. The houses have different characteristics, such as EV electric vehicles, PV solar photovoltaic generation, etc. In each of them, the load profiles were monitored for comparison. The tests shown operation for two days in the year 2022.
Figure 8 shows the device connected in the house.
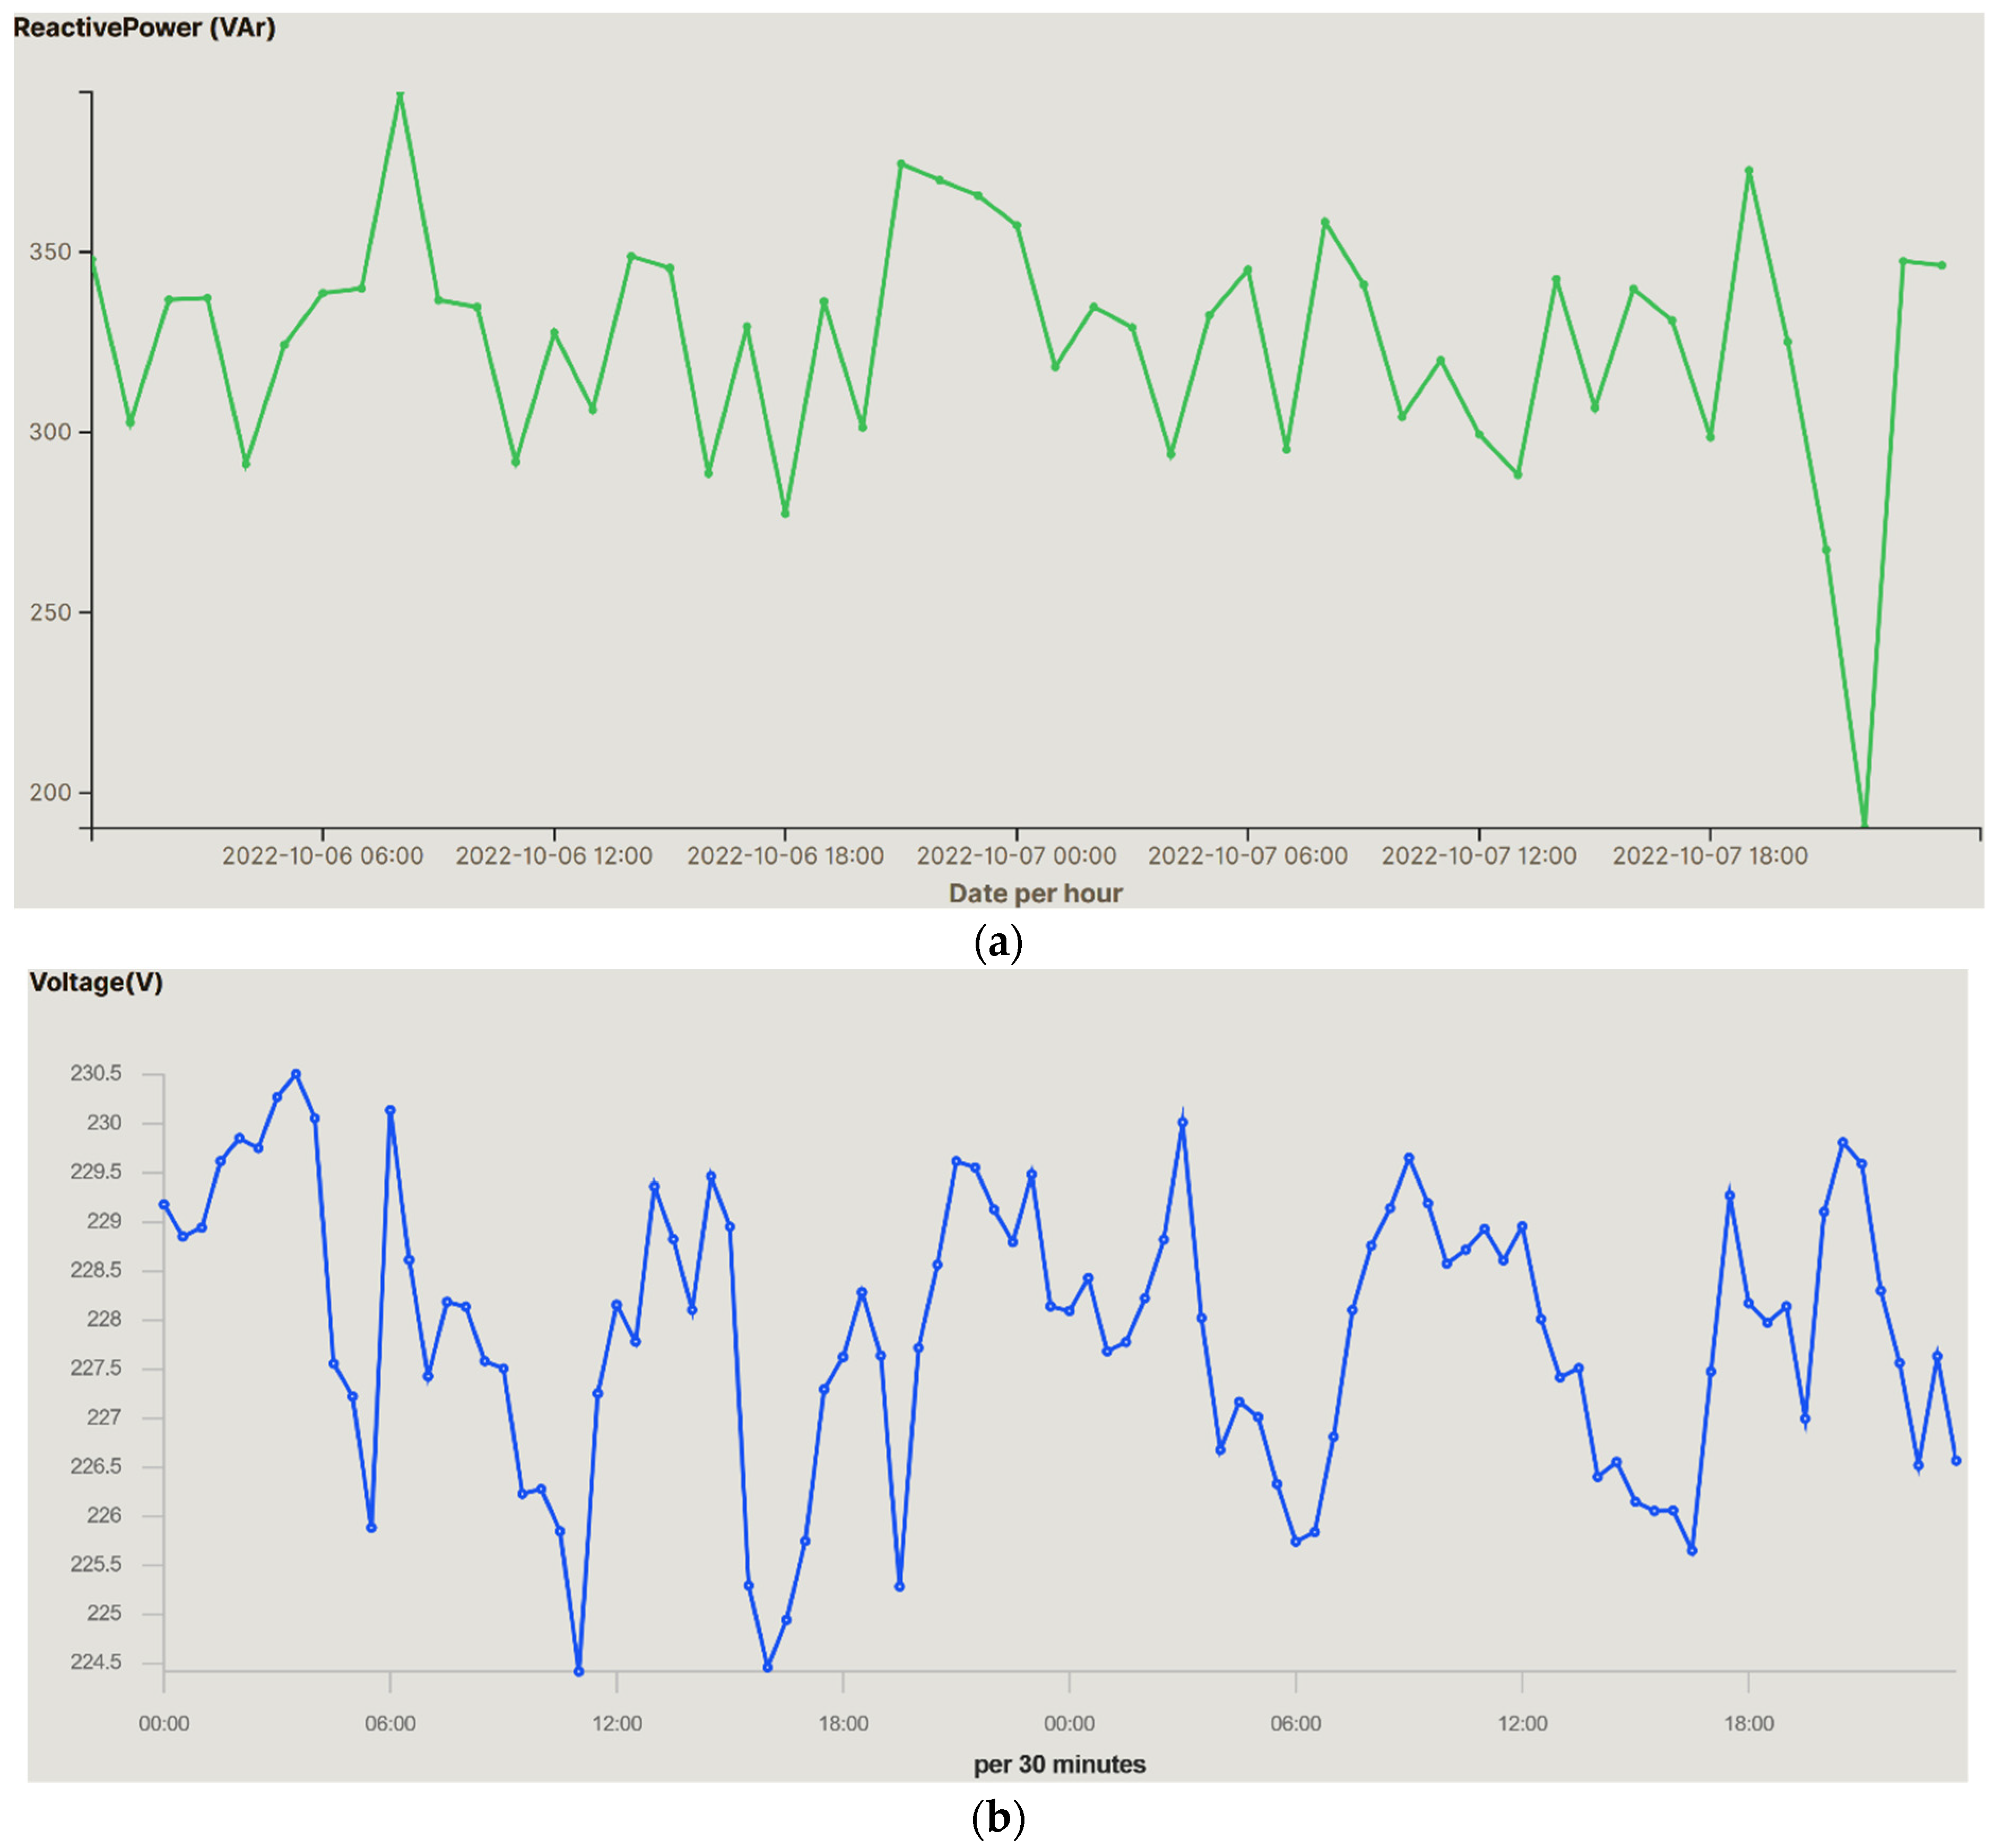
The graphs show the average value of the electrical variable displayed (v, i, p, s, PF, and q). The aggregation is performed on the data taken by the meter every 0.5 s. The system automatically aggregates the data according to the time slice chosen for the display. This helps to understand the temporal evolution of the measurement in the shown time slice. As for the graphs on the left, the data are aggregated in an automated way according to the chosen time slice. The data representation corresponds to 6 and 7 October 2022, for a single-family house with four inhabitants.
The results of the entire system can be seen in the following screenshots.
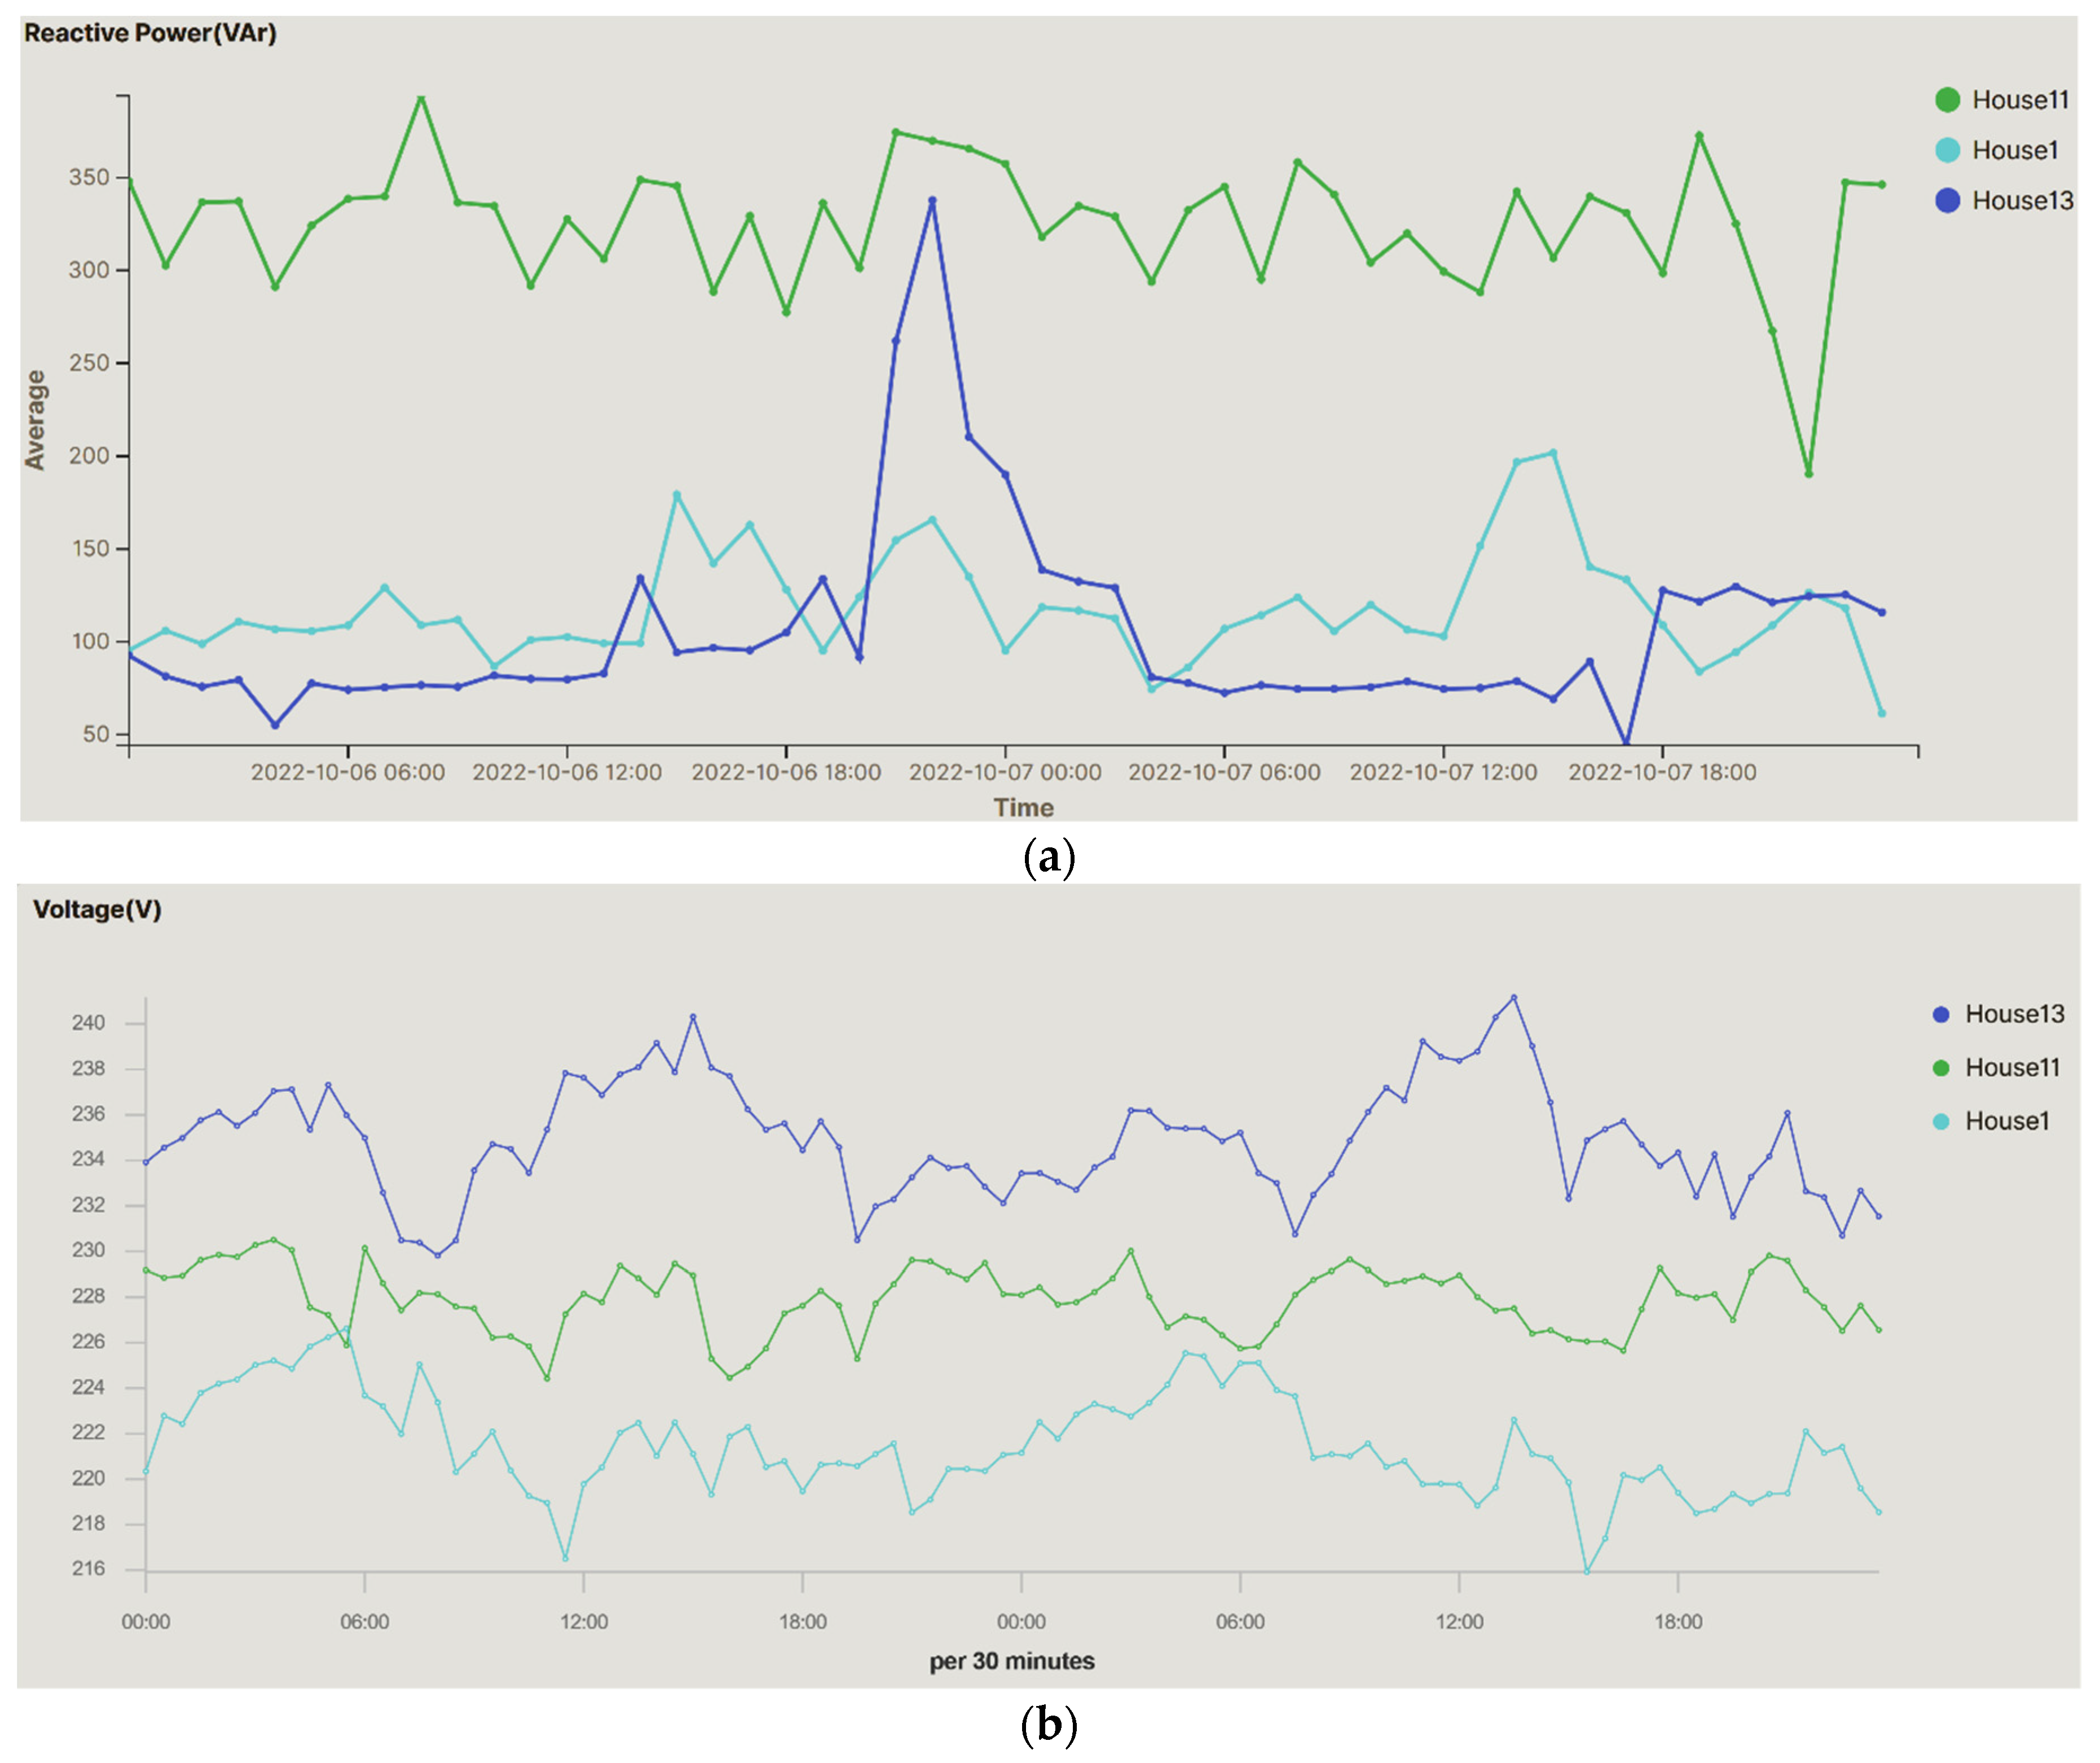
Figure 9 shows the first dashboard, specifically the general dashboard, where we can see a timeline with the values of reactive power
q and voltage
v.
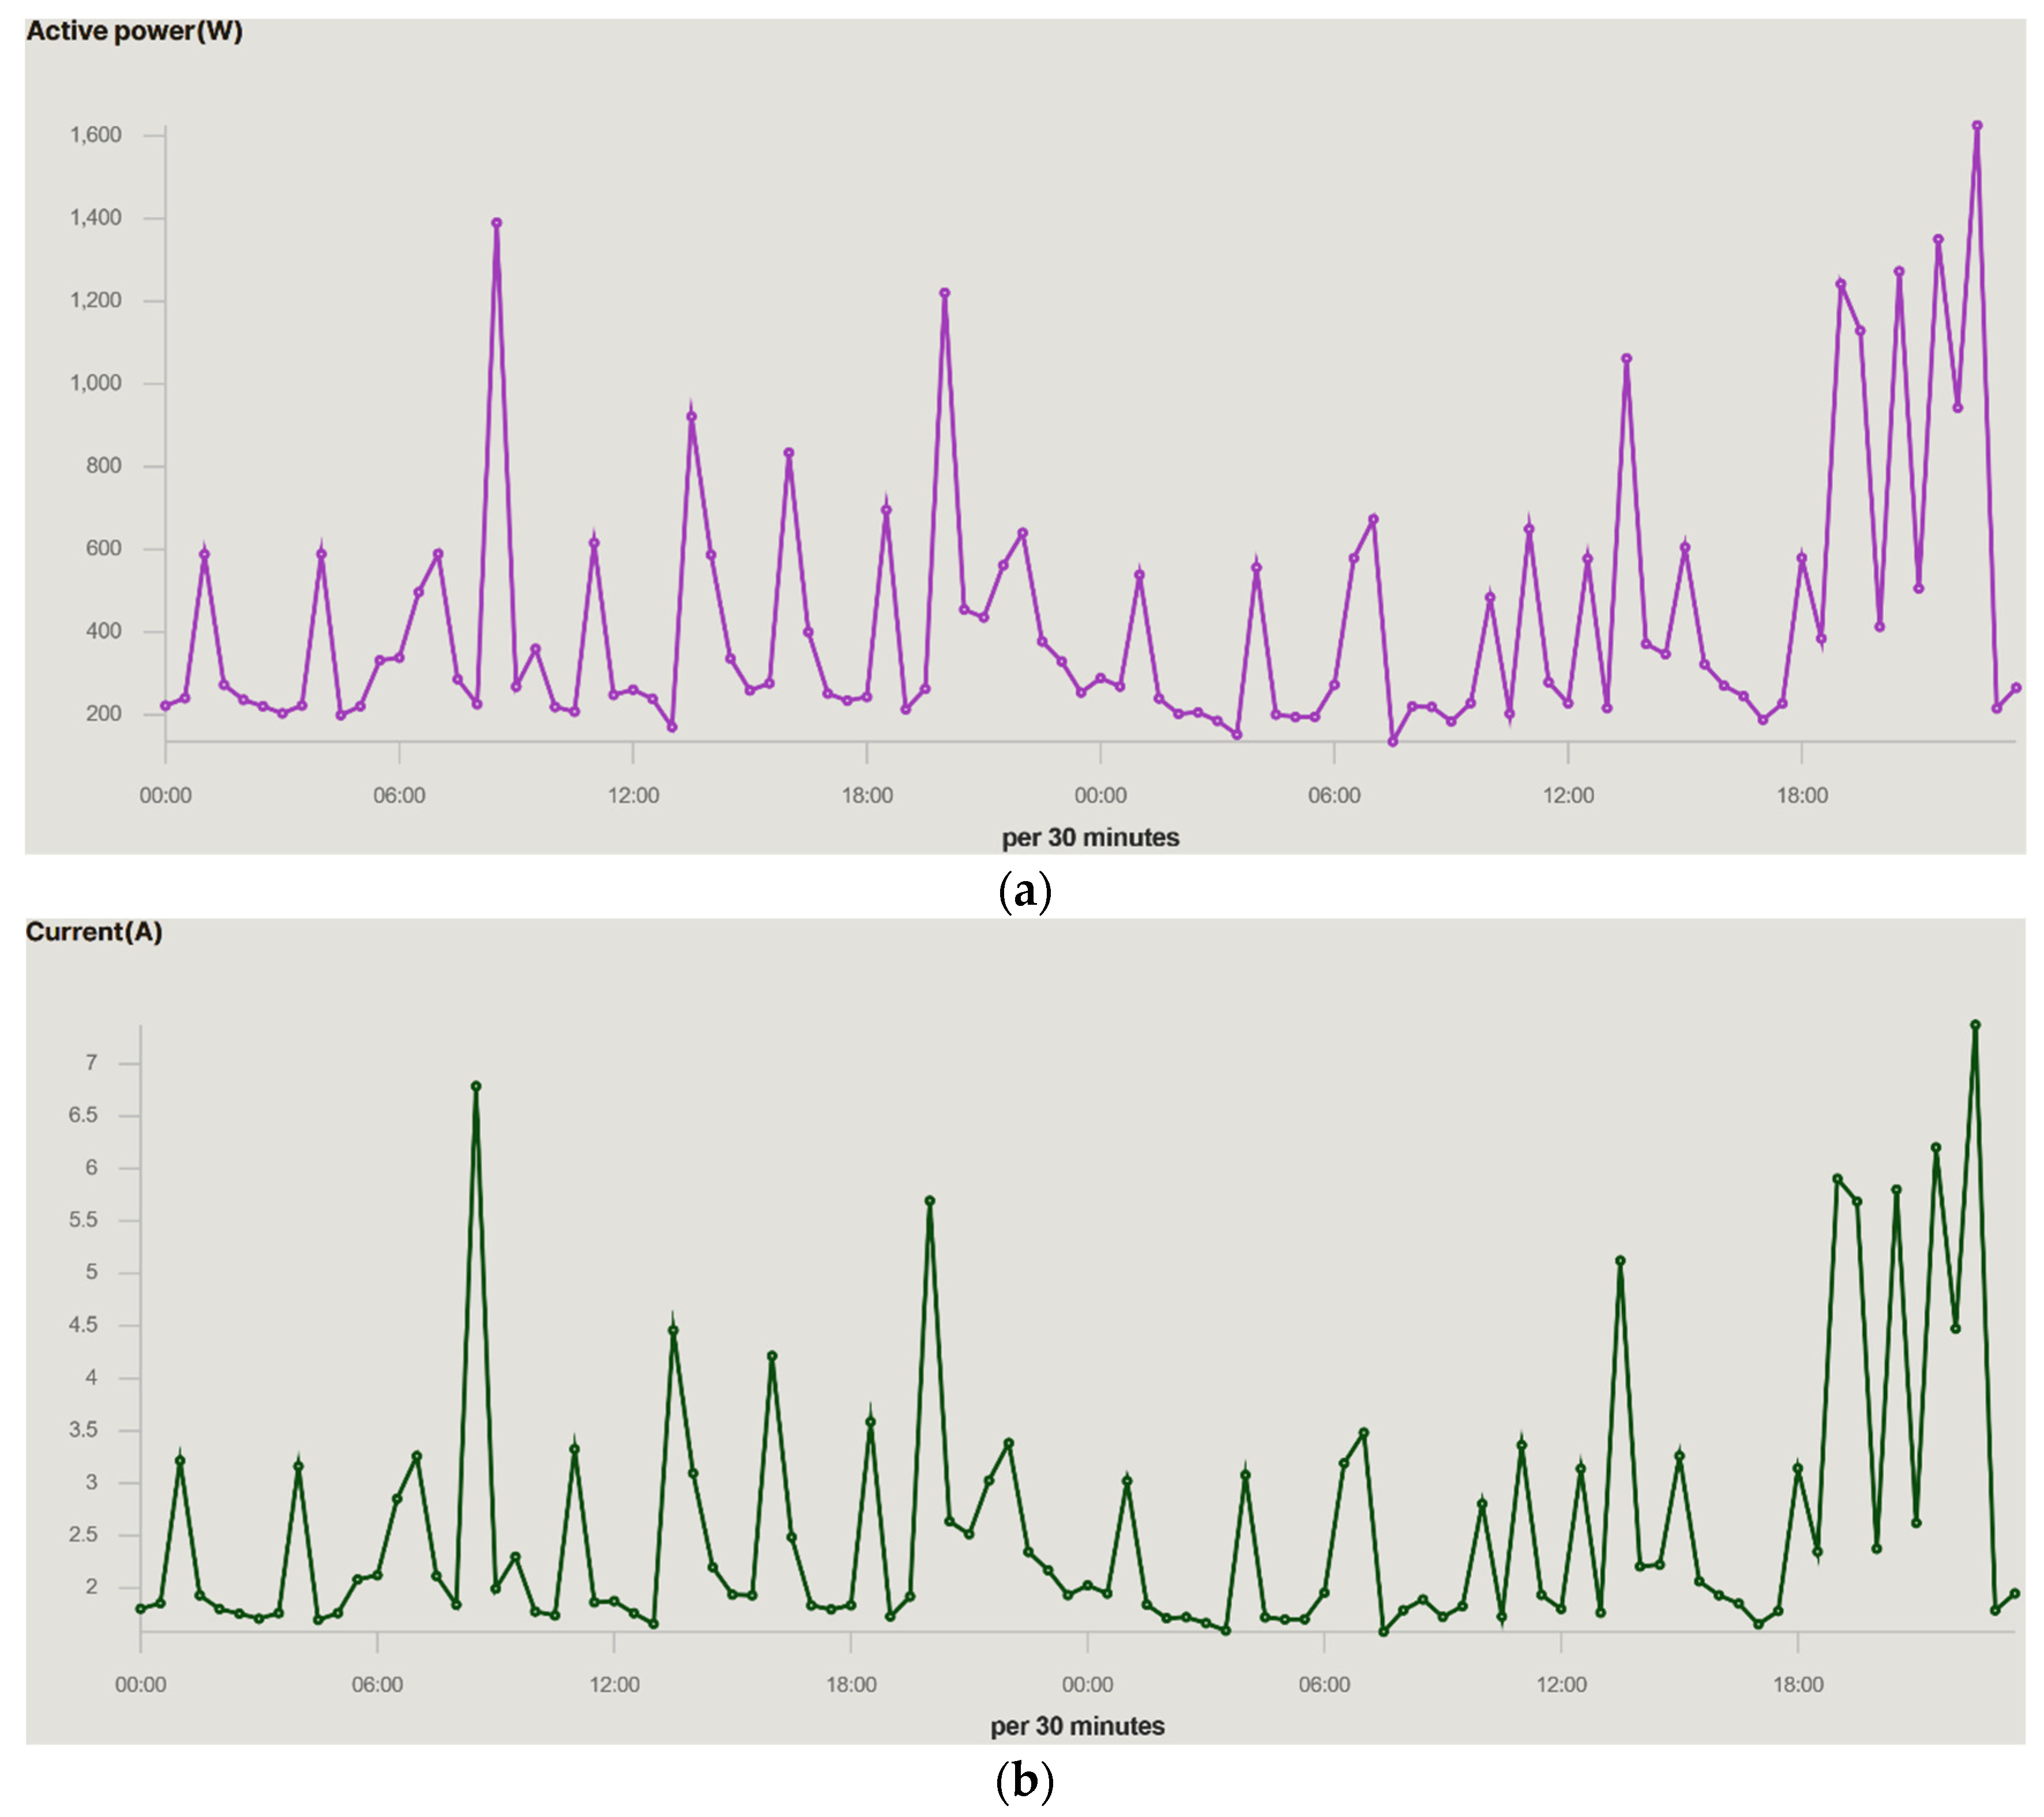
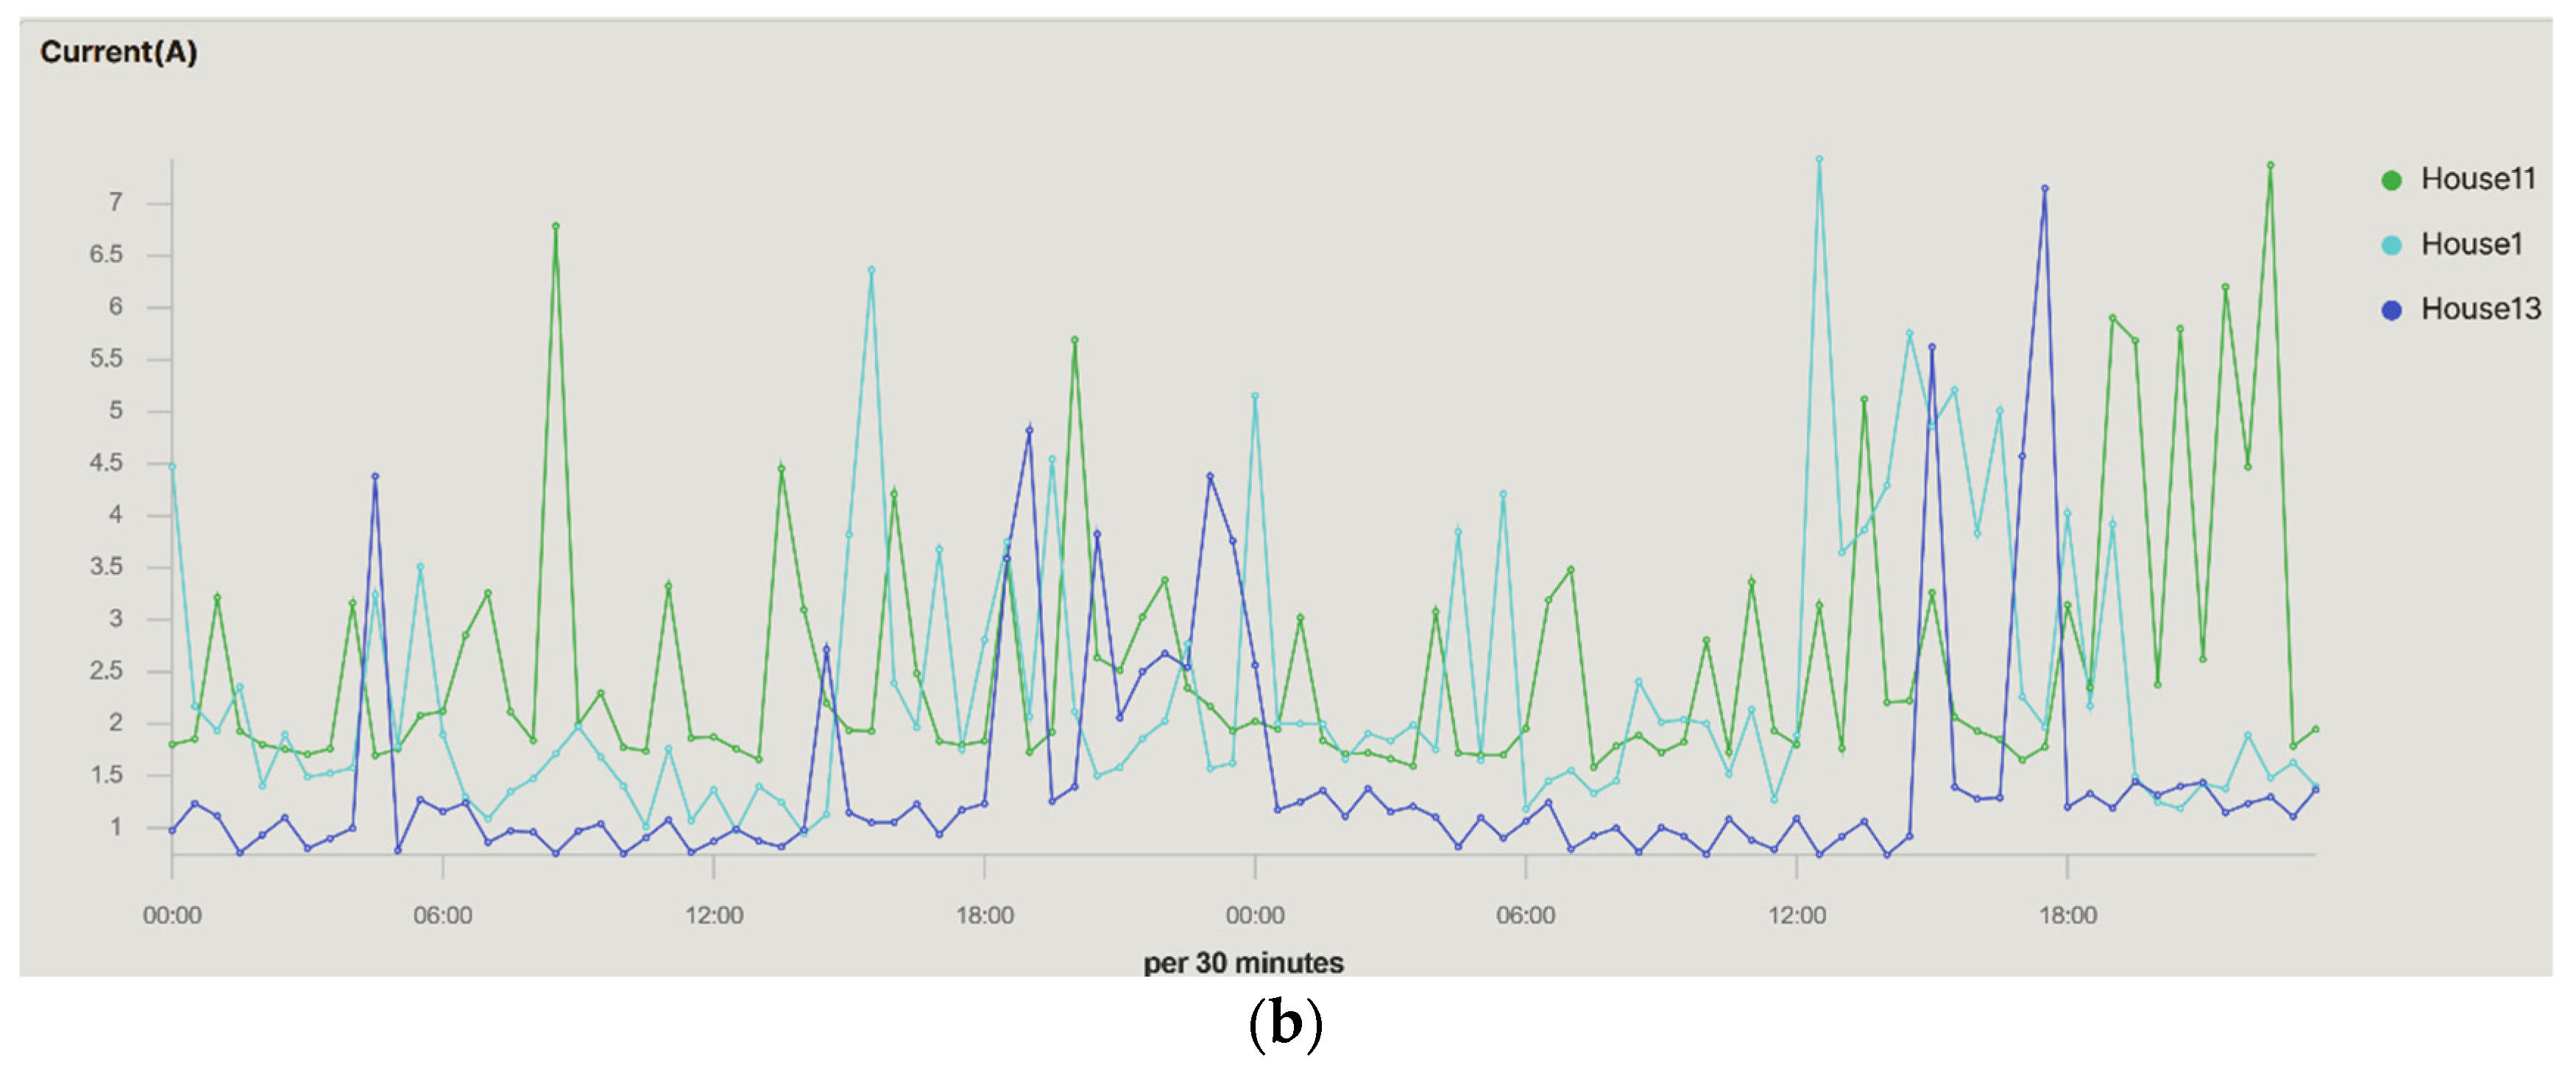
Figure 10 shows the second dashboard, specifically the general dashboard, where we can see a timeline with the values of apparent power
p and current
i. In
Figure 10 it appears that
i and
p evolve with graphs that have similar shapes. This is because
v varies in very narrow margins and remains almost constant within the time slice shown. It can be observed in
Figure 9 that the voltage is very stable; this is due to the consistency provided by the electrical network. As a consequence, it has little influence on the variability of power. The user can observe that the maximum consumption peaks occur between 08 and 10, 14 and 16, and 20 and 22 h which correspond to the hours of maximum occupation in the household. These hours coincide with breakfast, lunch, dinner, and rest time for viewing TV. The behaviour is similar in the two days shown.
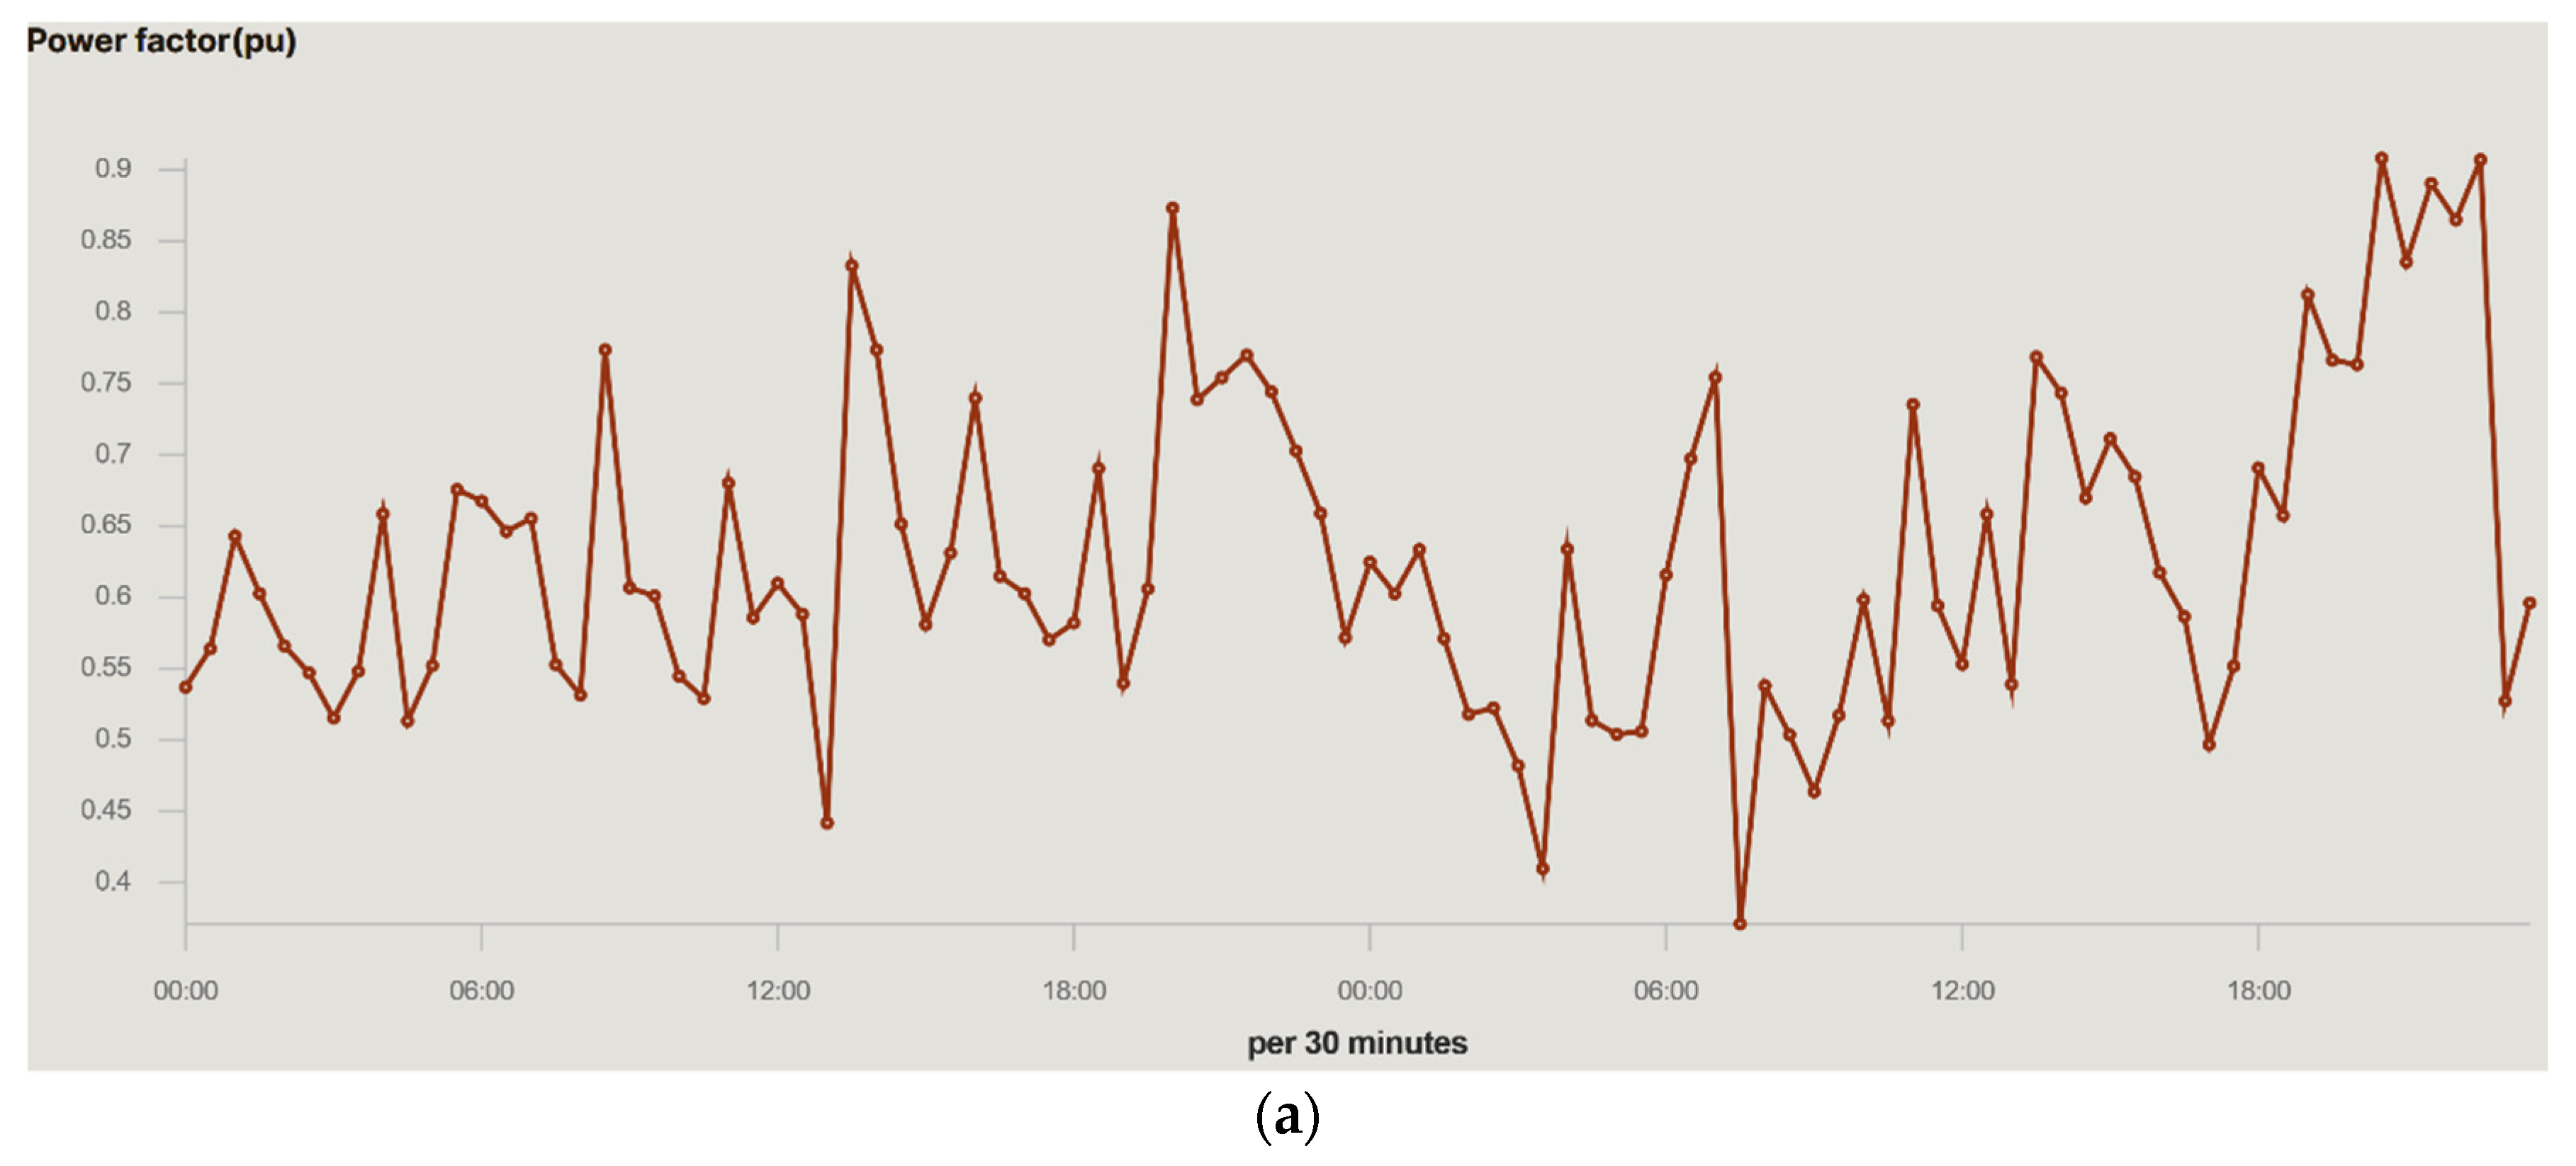
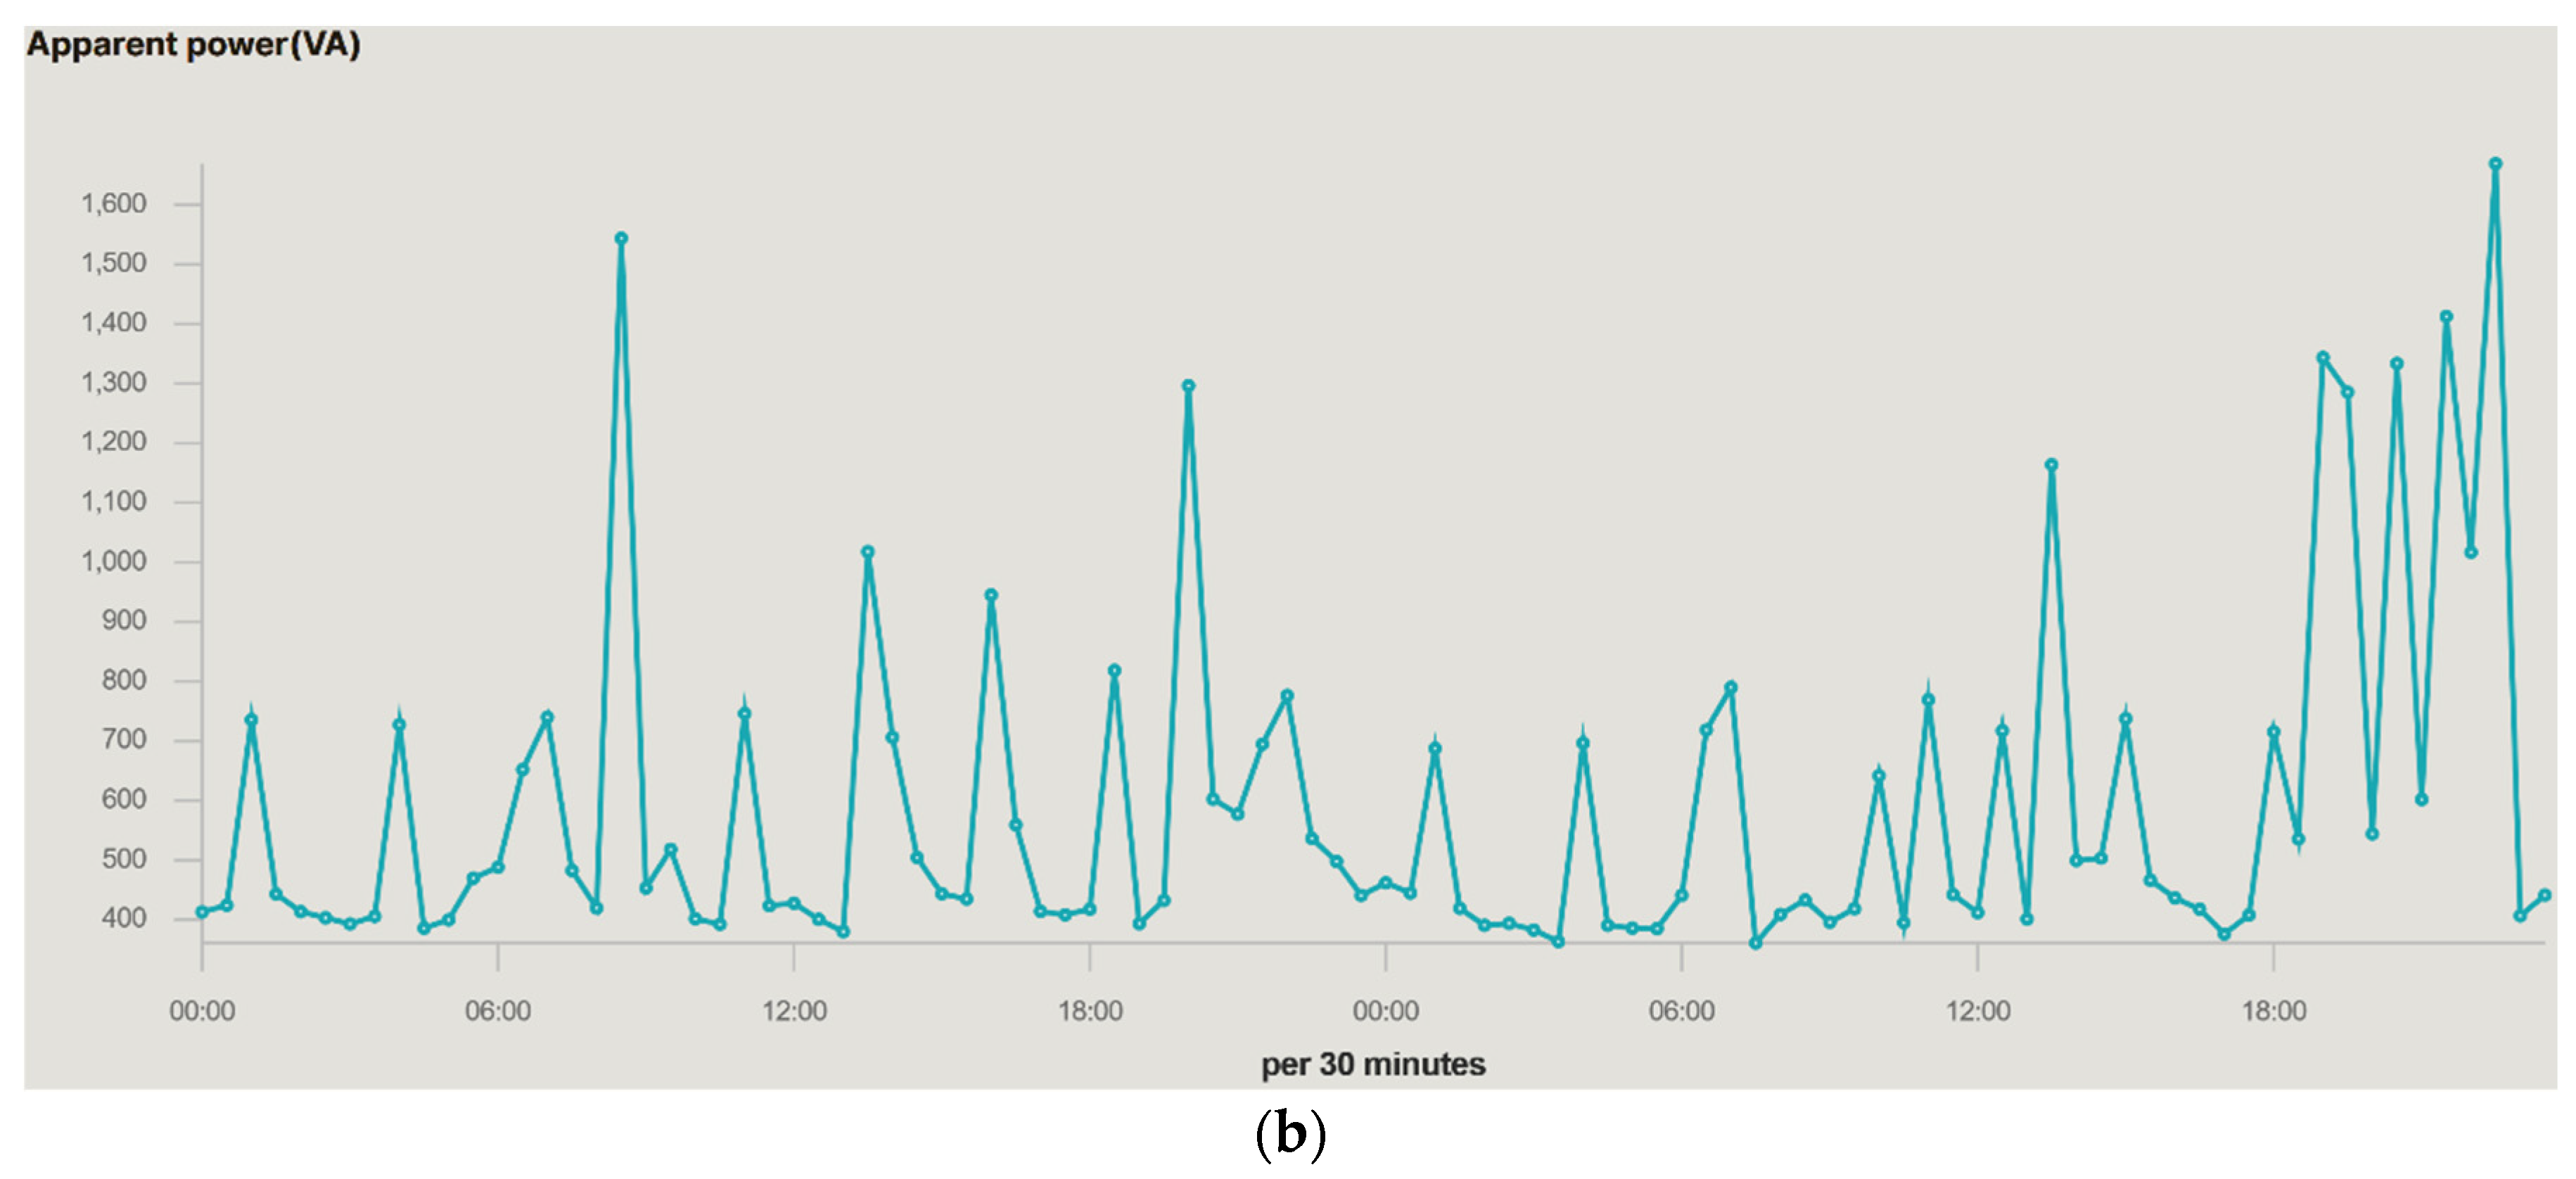
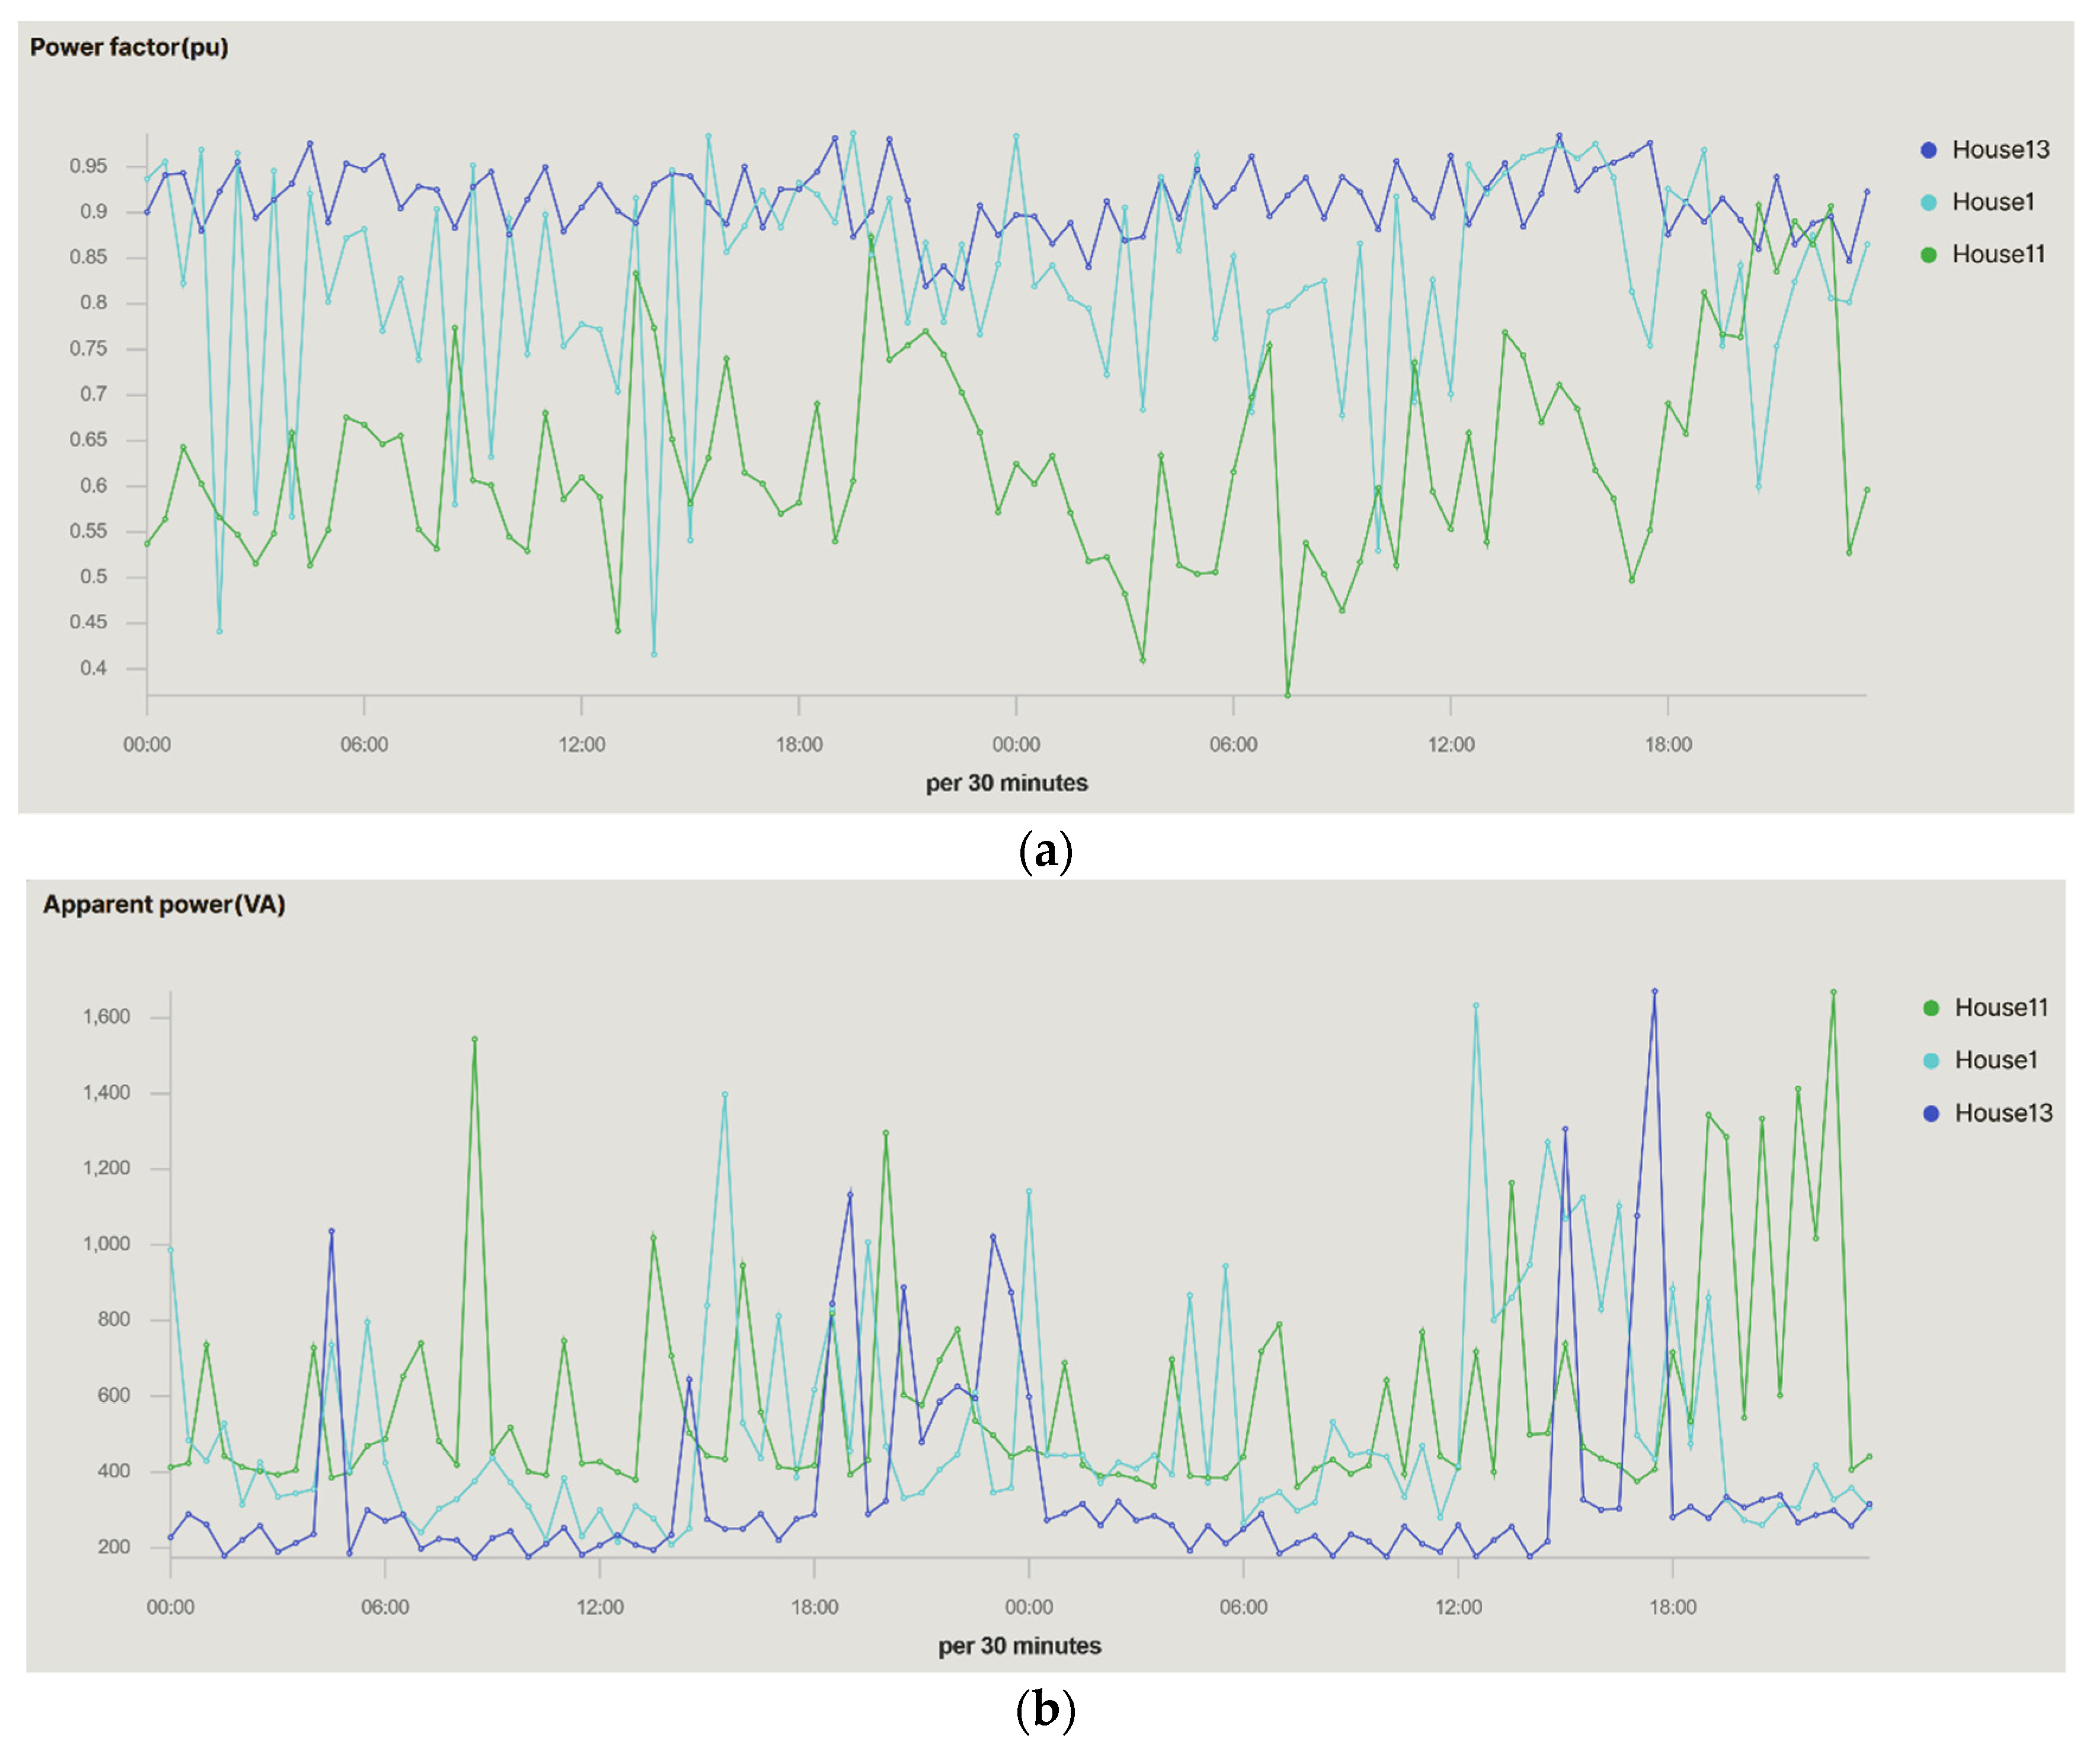
Figure 11 shows the power factor
PF and apparent power
s values. In all cases, the two graphs on the right show the average values that are being reached in the selected and configurable time period. The apparent power
s is influenced by the variability of the electrical current consumed in the household due to the stability of the voltage as shows
Figure 11.
Figure 11 shows the behaviour of the
PF on the two days shown. The
PF is quite high and has values close to the unit during the study period, which implies a high performance of the receivers connected in the house and low losses. This is due to the use of class A+++ electrical appliances and an aerothermal air conditioning system.
In addition to the graphs of the electrical variables, the values are used for data visualization and can be downloaded in CSV format. This feature is highly interesting for homeowners or researchers because it enables studying the energy behaviour of the household, photovoltaic (PV), and vehicle (EV). The CSV format was chosen because it is accepted by most software used for analysis, such as MATLAB, Excel, and most statistical suites.
By default, the dashboard loads the data from all the devices and shows these charts for the average and accumulated values of the devices. It was also designed so that filtering a component affects the rest of the displayed data. This allows filtering all the components at the same time, including the data table. This data table allows sorting and filtering each of the columns shown as well as downloading the data being displayed in CSV format.
Since everything is configurable, the platform allows different types of filtering for almost every one of the data fields. The most frequent filtering types are the following:
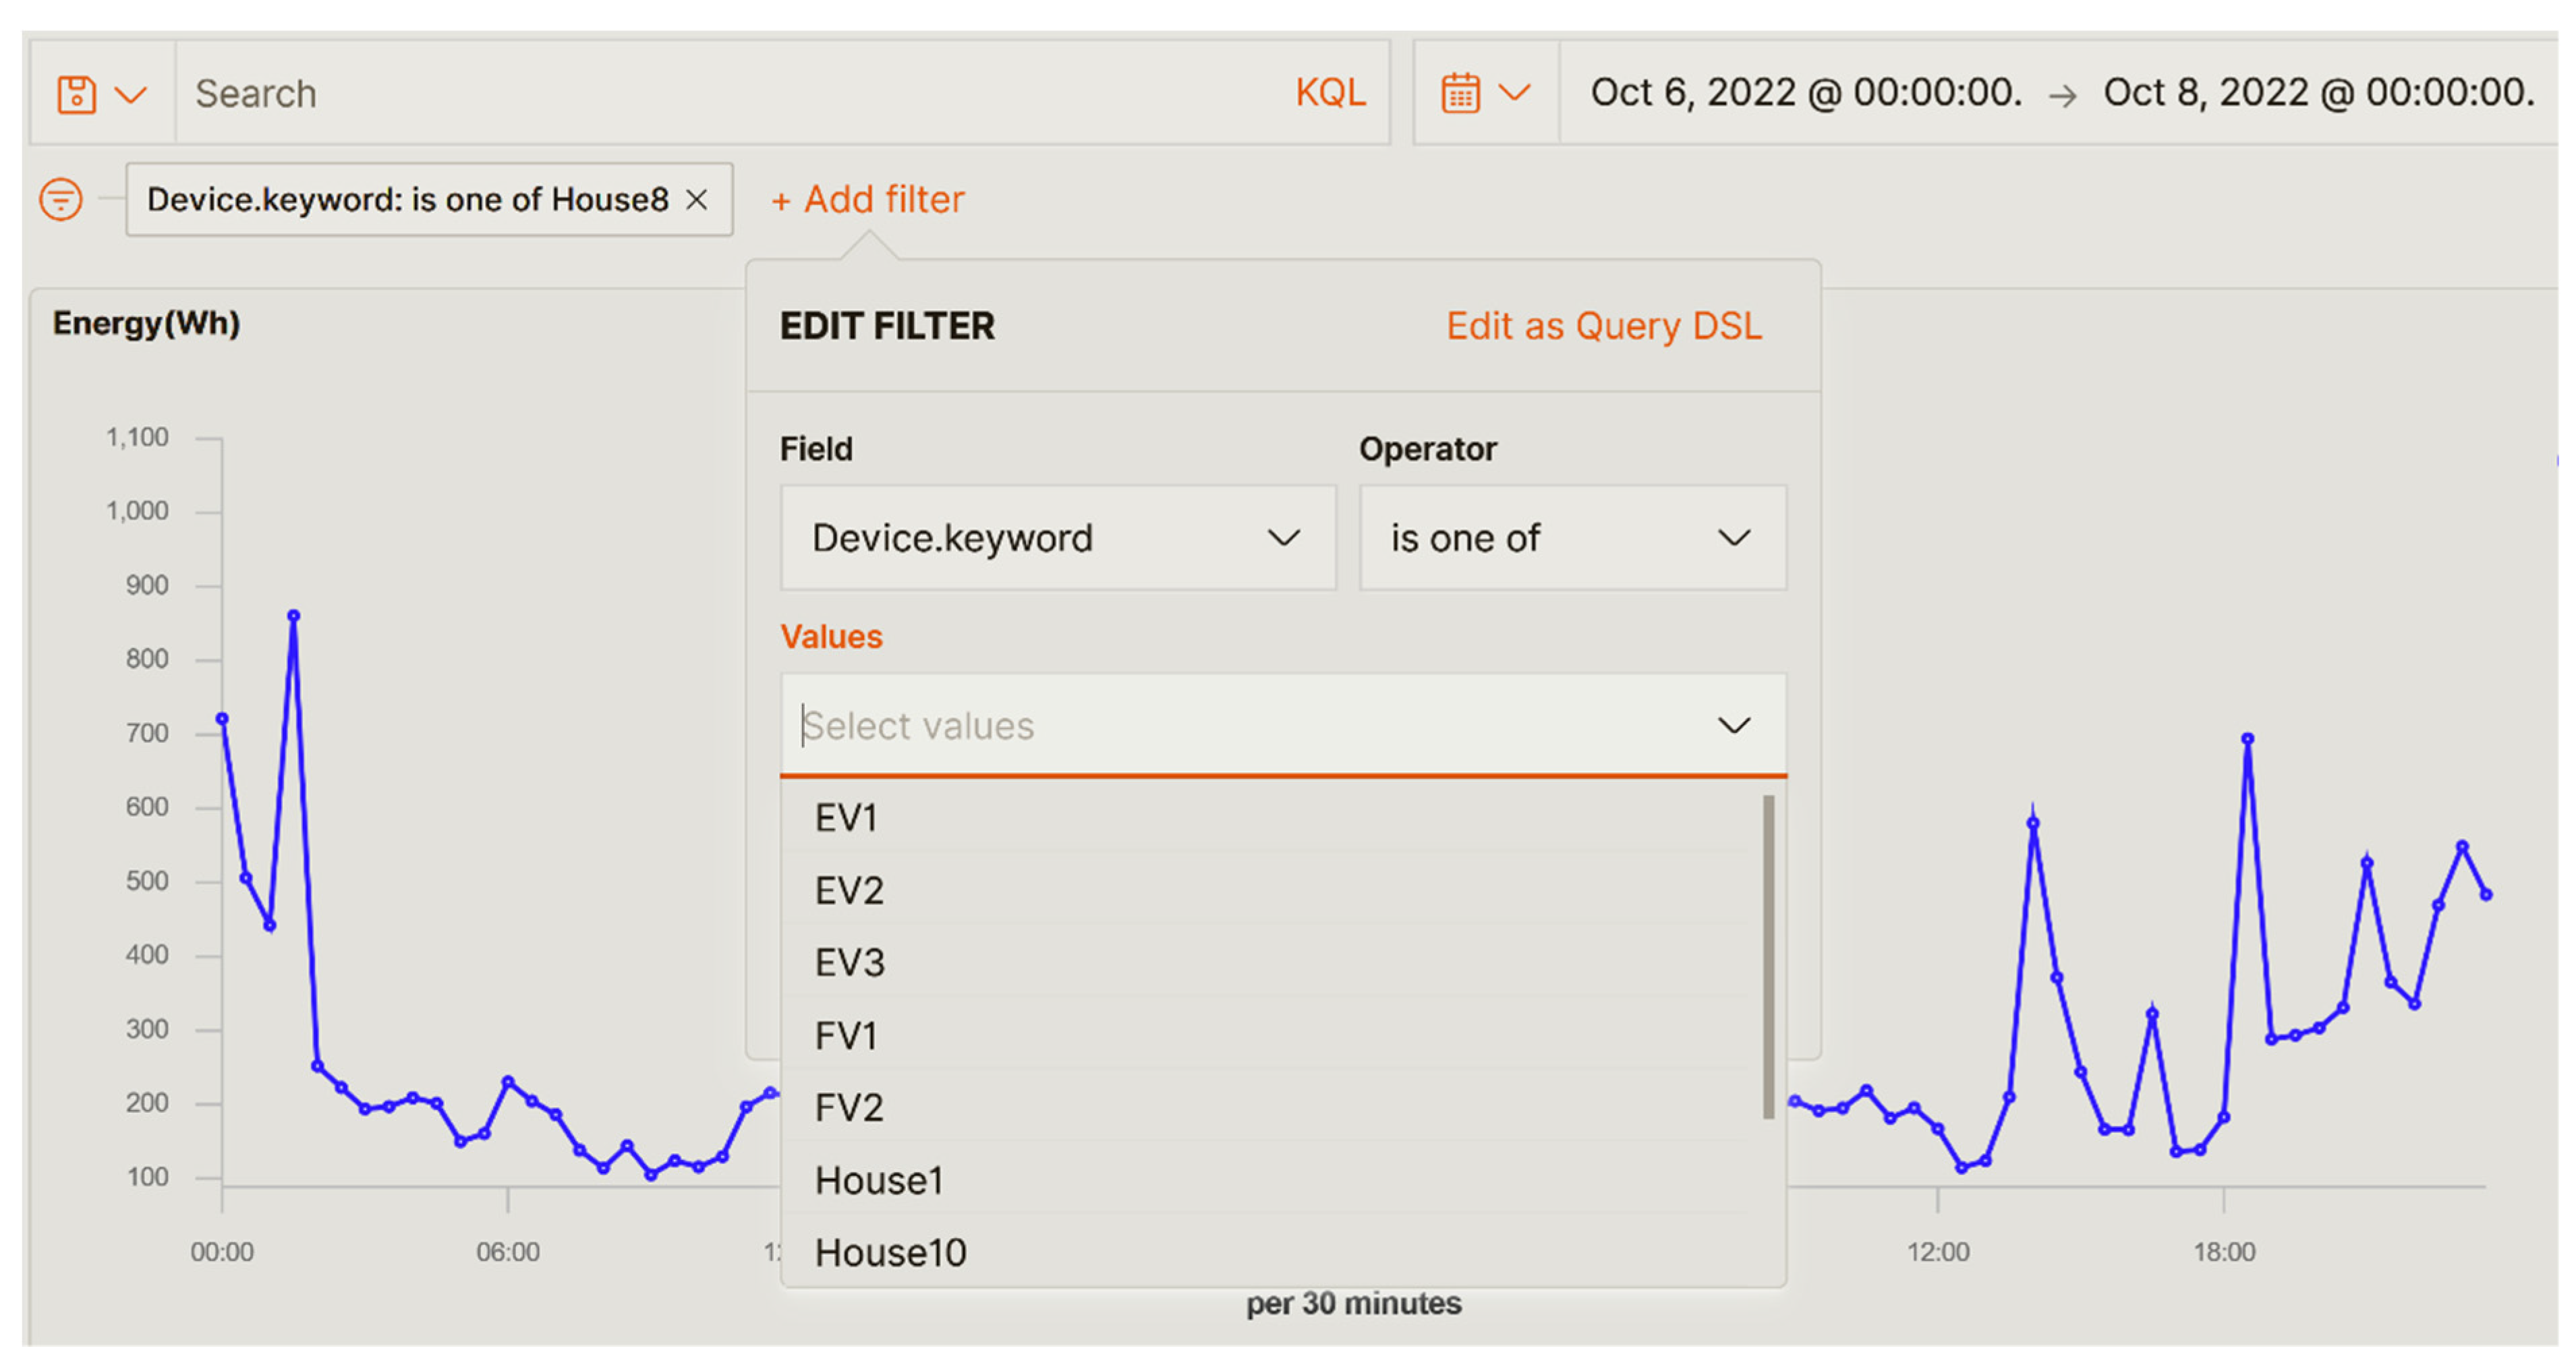
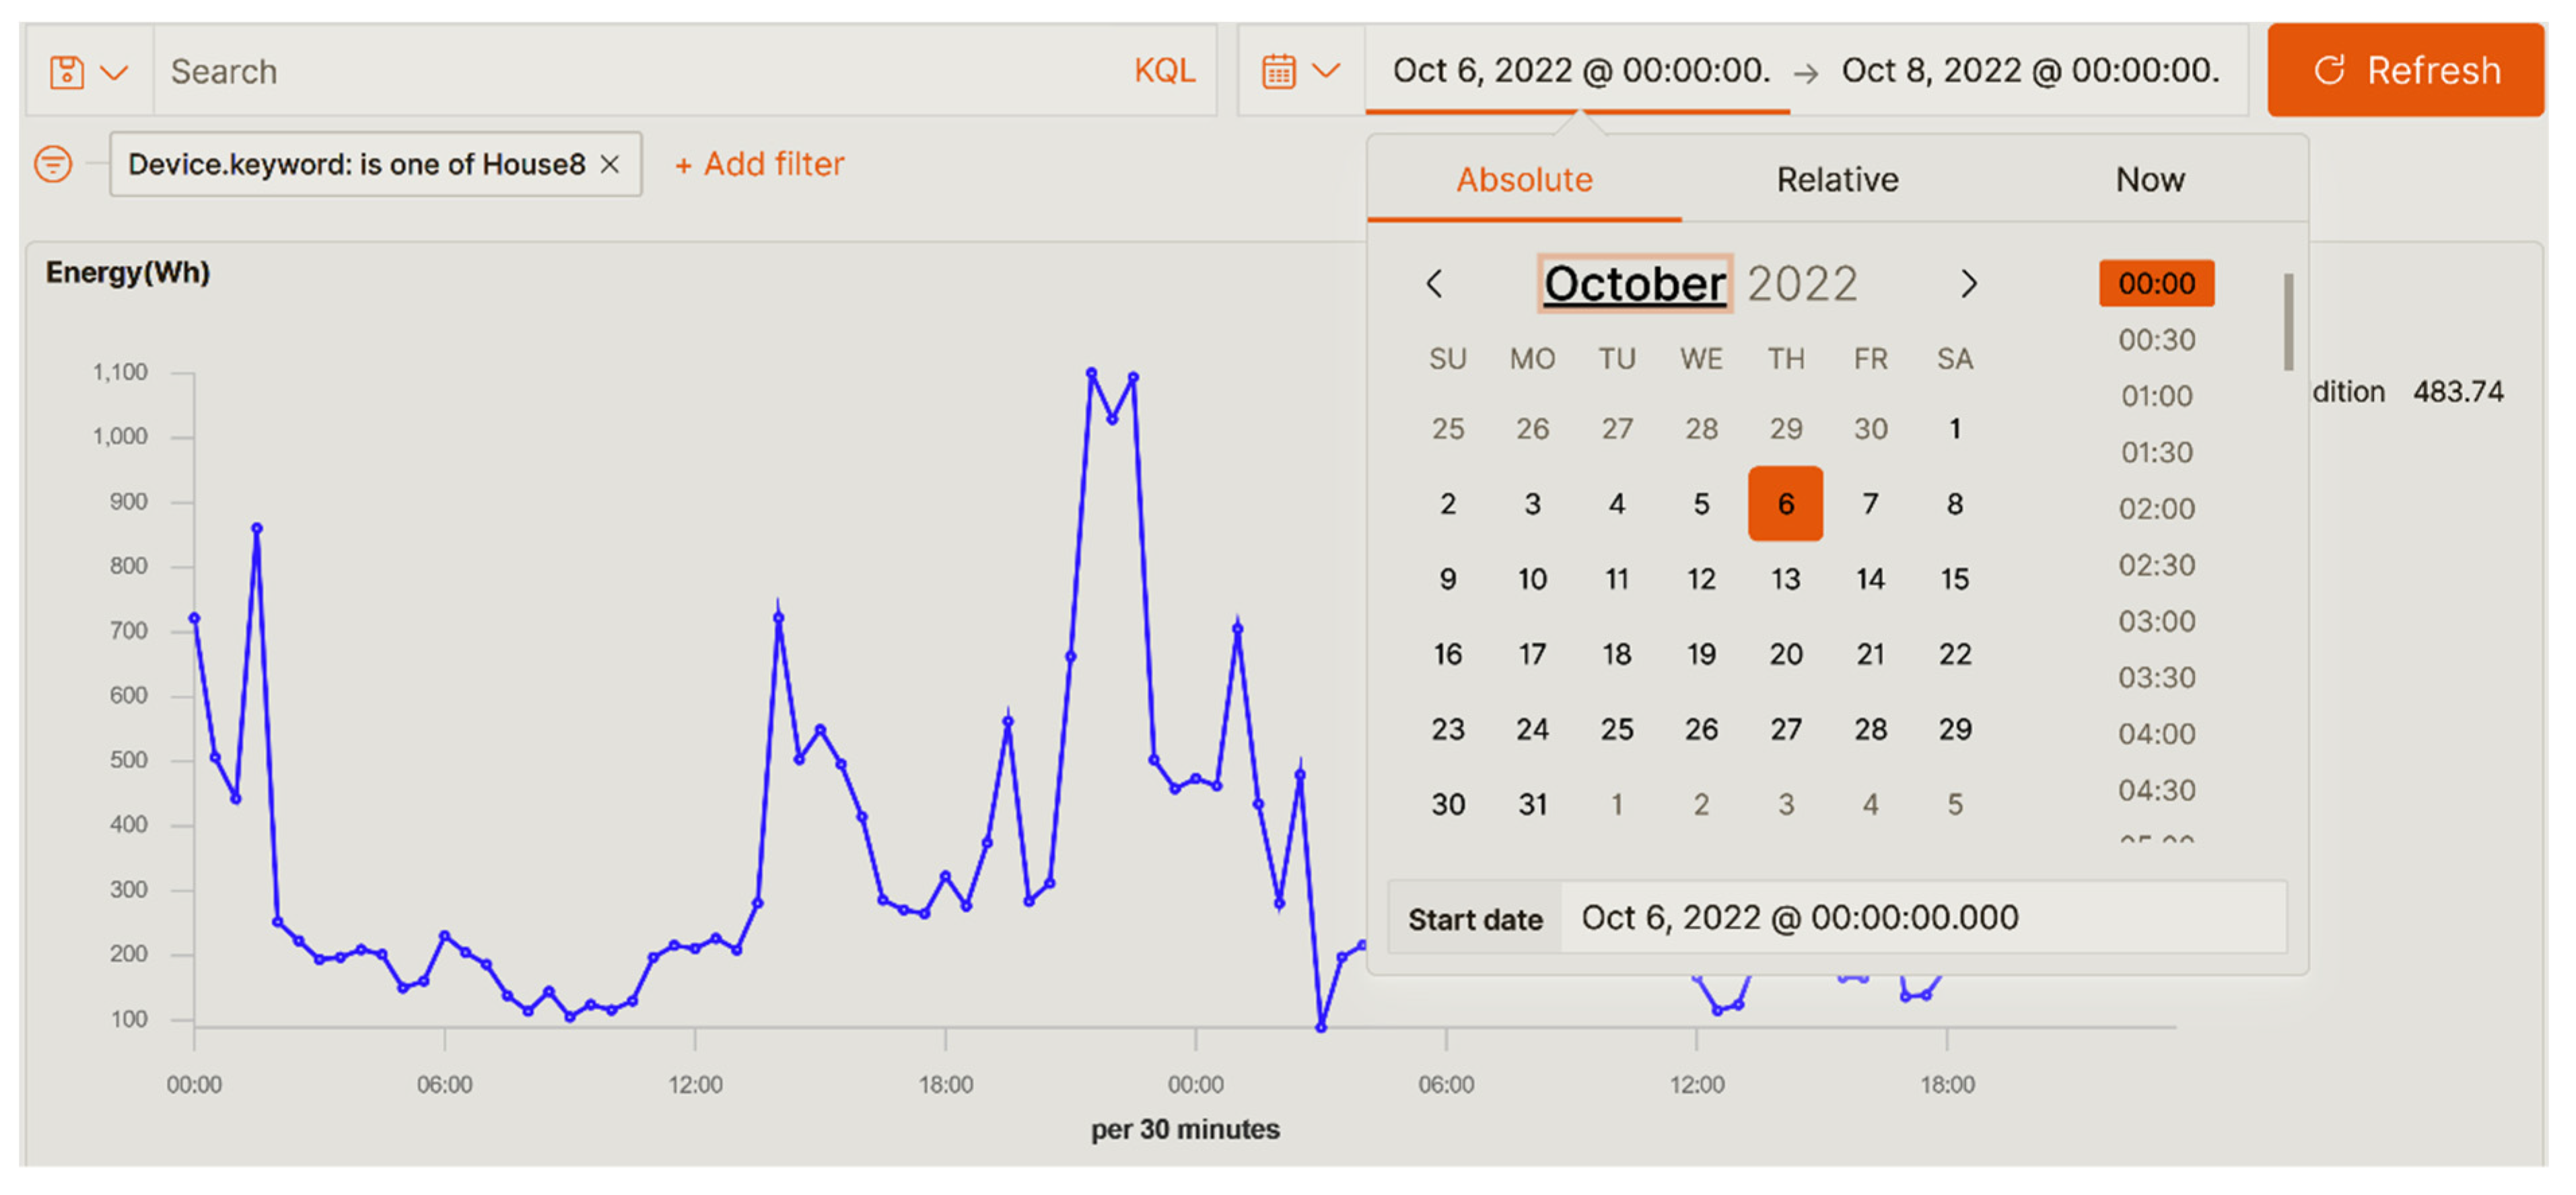
Filtering by date range: This filter can be applied in the platform in different ways. The most common is to use the date control that appears in the upper right corner, see
Figure 12. Another option to filter by dates is to select, with the computer mouse, a specific area in the timeline charts. Automatically this range is selected and all the information and charts are updated.
Filtering by device: We can use a filter control that the dashboard has in the upper left corner to filter by one or several devices. All the data and graphs of the dashboard are automatically updated. This filter control can be seen in the
Figure 13.
The following designed and developed dashboard shows timeline-type graphs that visually compare all the devices loaded in the data with all the established measurements. From a visual point of view, it is interesting to see a great amount of information in very little space.
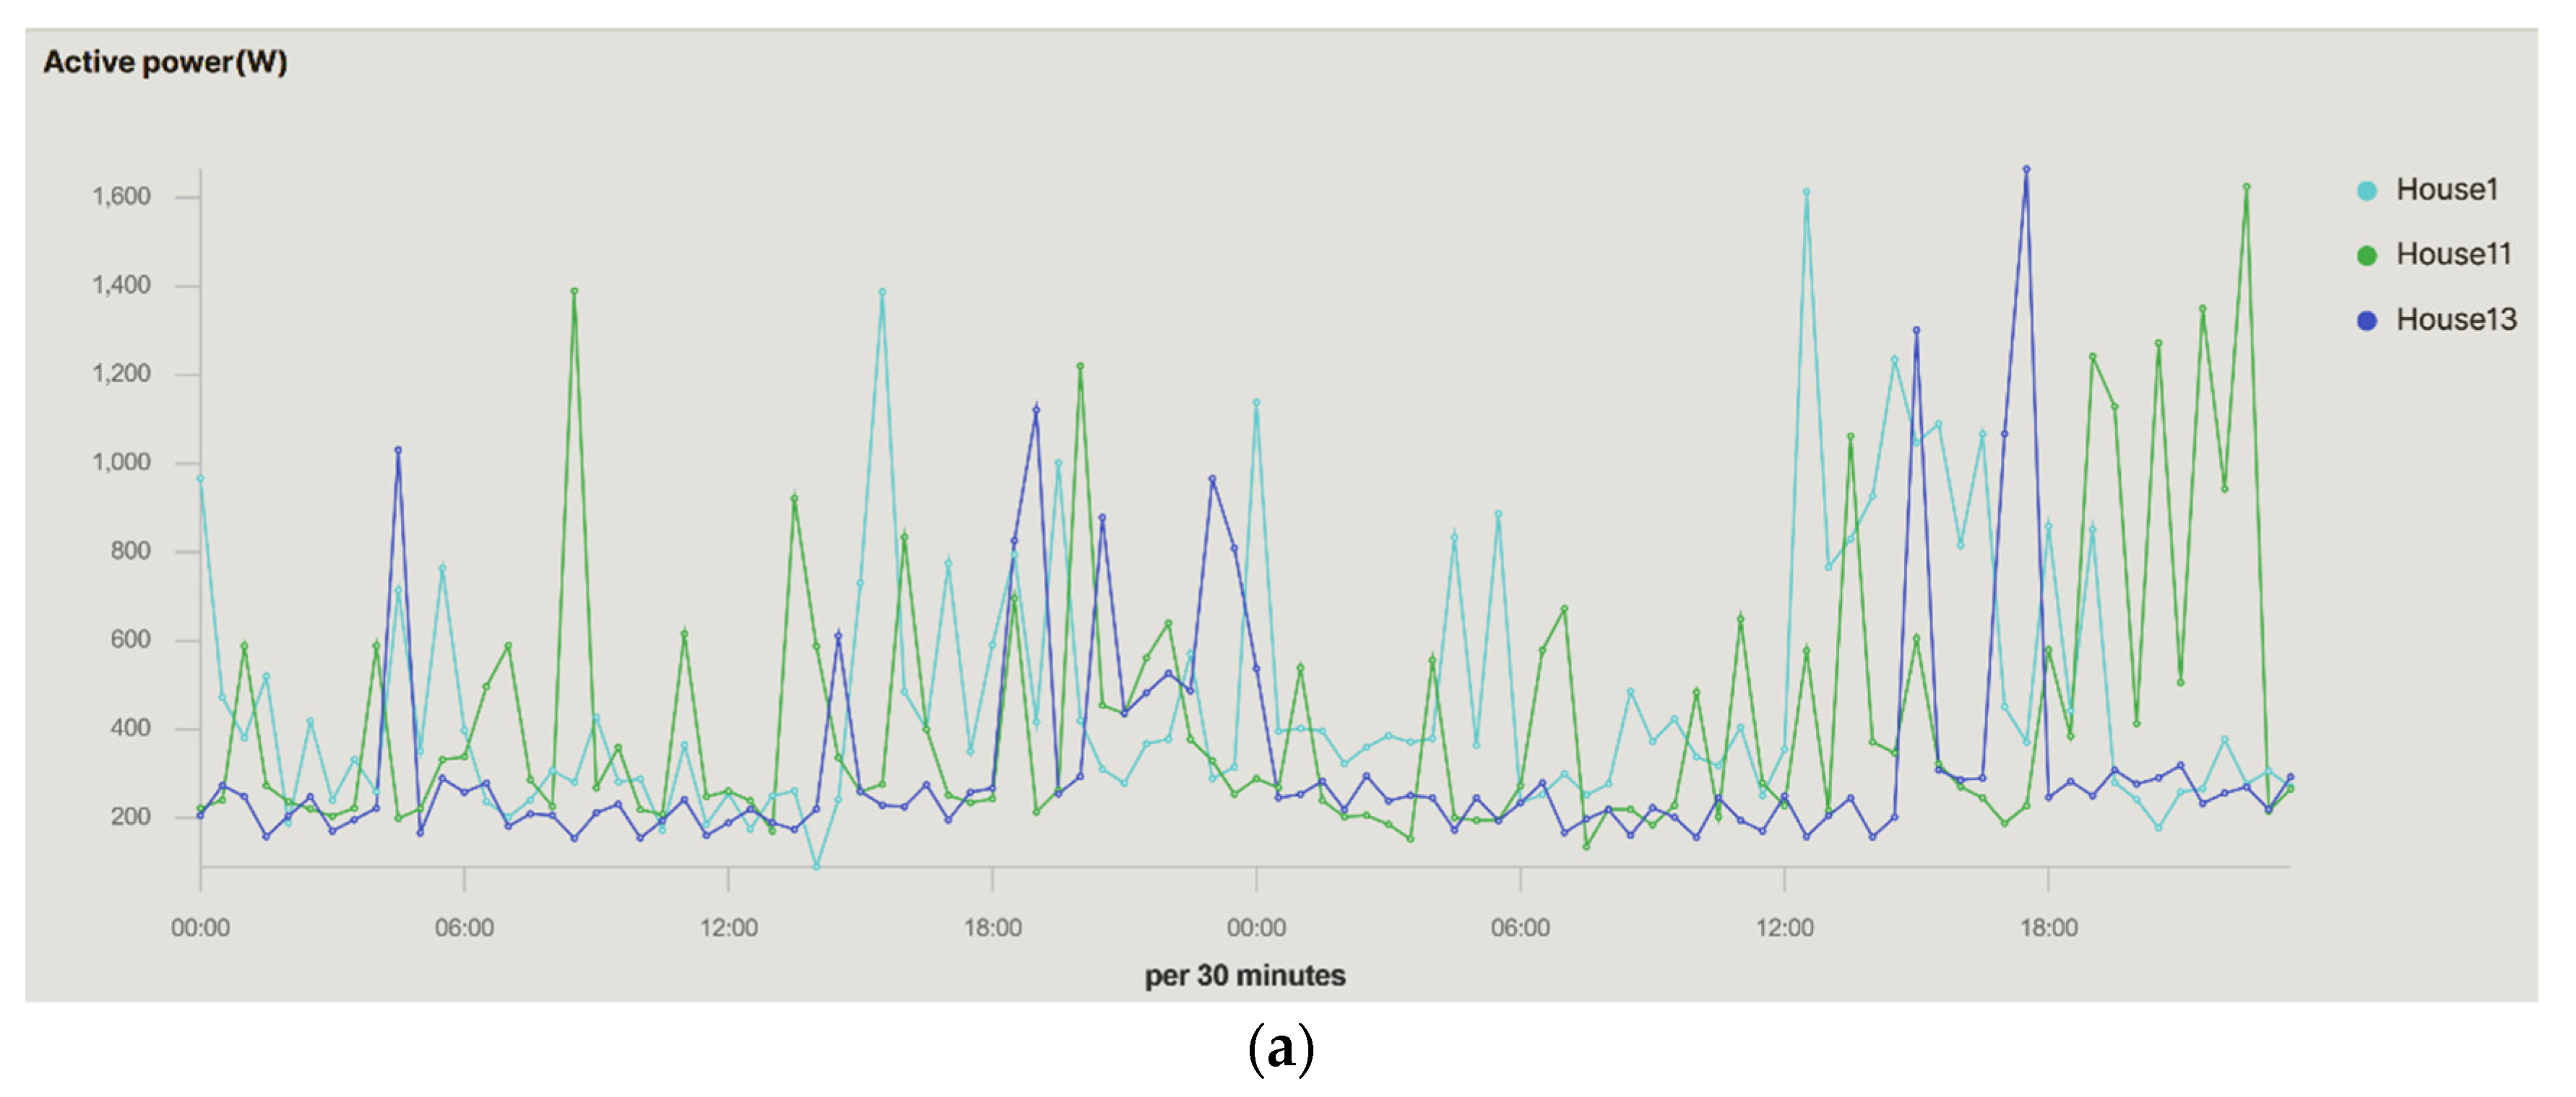
Figure 14 and
Figure 15 compare three households. The evolution of the three houses can be observed. One was analysed in previous figures and the other is a single-family household with two and three inhabitants in house#11 and house#1, respectively. As opposed to the house#13, in the second one the inhabitants are out of the house all day because of work, returning home after 9.30 pm when a higher consumption is observed. House#11 and house#1 are occupied almost all day with consumption peaks in the middle of the day, in the afternoon, and at dinner time. The use of these comparative graphs allows researchers to obtain analyses from which they can deduce conducts applicable to obtaining load profiles, demand estimates, energy study of the household, reduction in the electricity tariff, etc.
Figure 16 shows the PF for the households, with EV and PV. House#13 and house#1 vary with respect to the PV, the work performed by the inverter for the grid connection, which maintains the PF at 1 for almost the entire generation time, is clearly noticeable. The EV, which is connected to the grid through a DC/AC converter, also maintains the PF at values above 0.95 during most of the charging process, making it very efficient. The different equipment installed in the households, especially the electrical appliances, make the first household present a much higher value of PF, above 0.9, making it very efficient. On the contrary, house#11 has equipment that reduces the average value of the PF to 0.65, thus presenting a less efficient behaviour.
App for Non-Expert Users
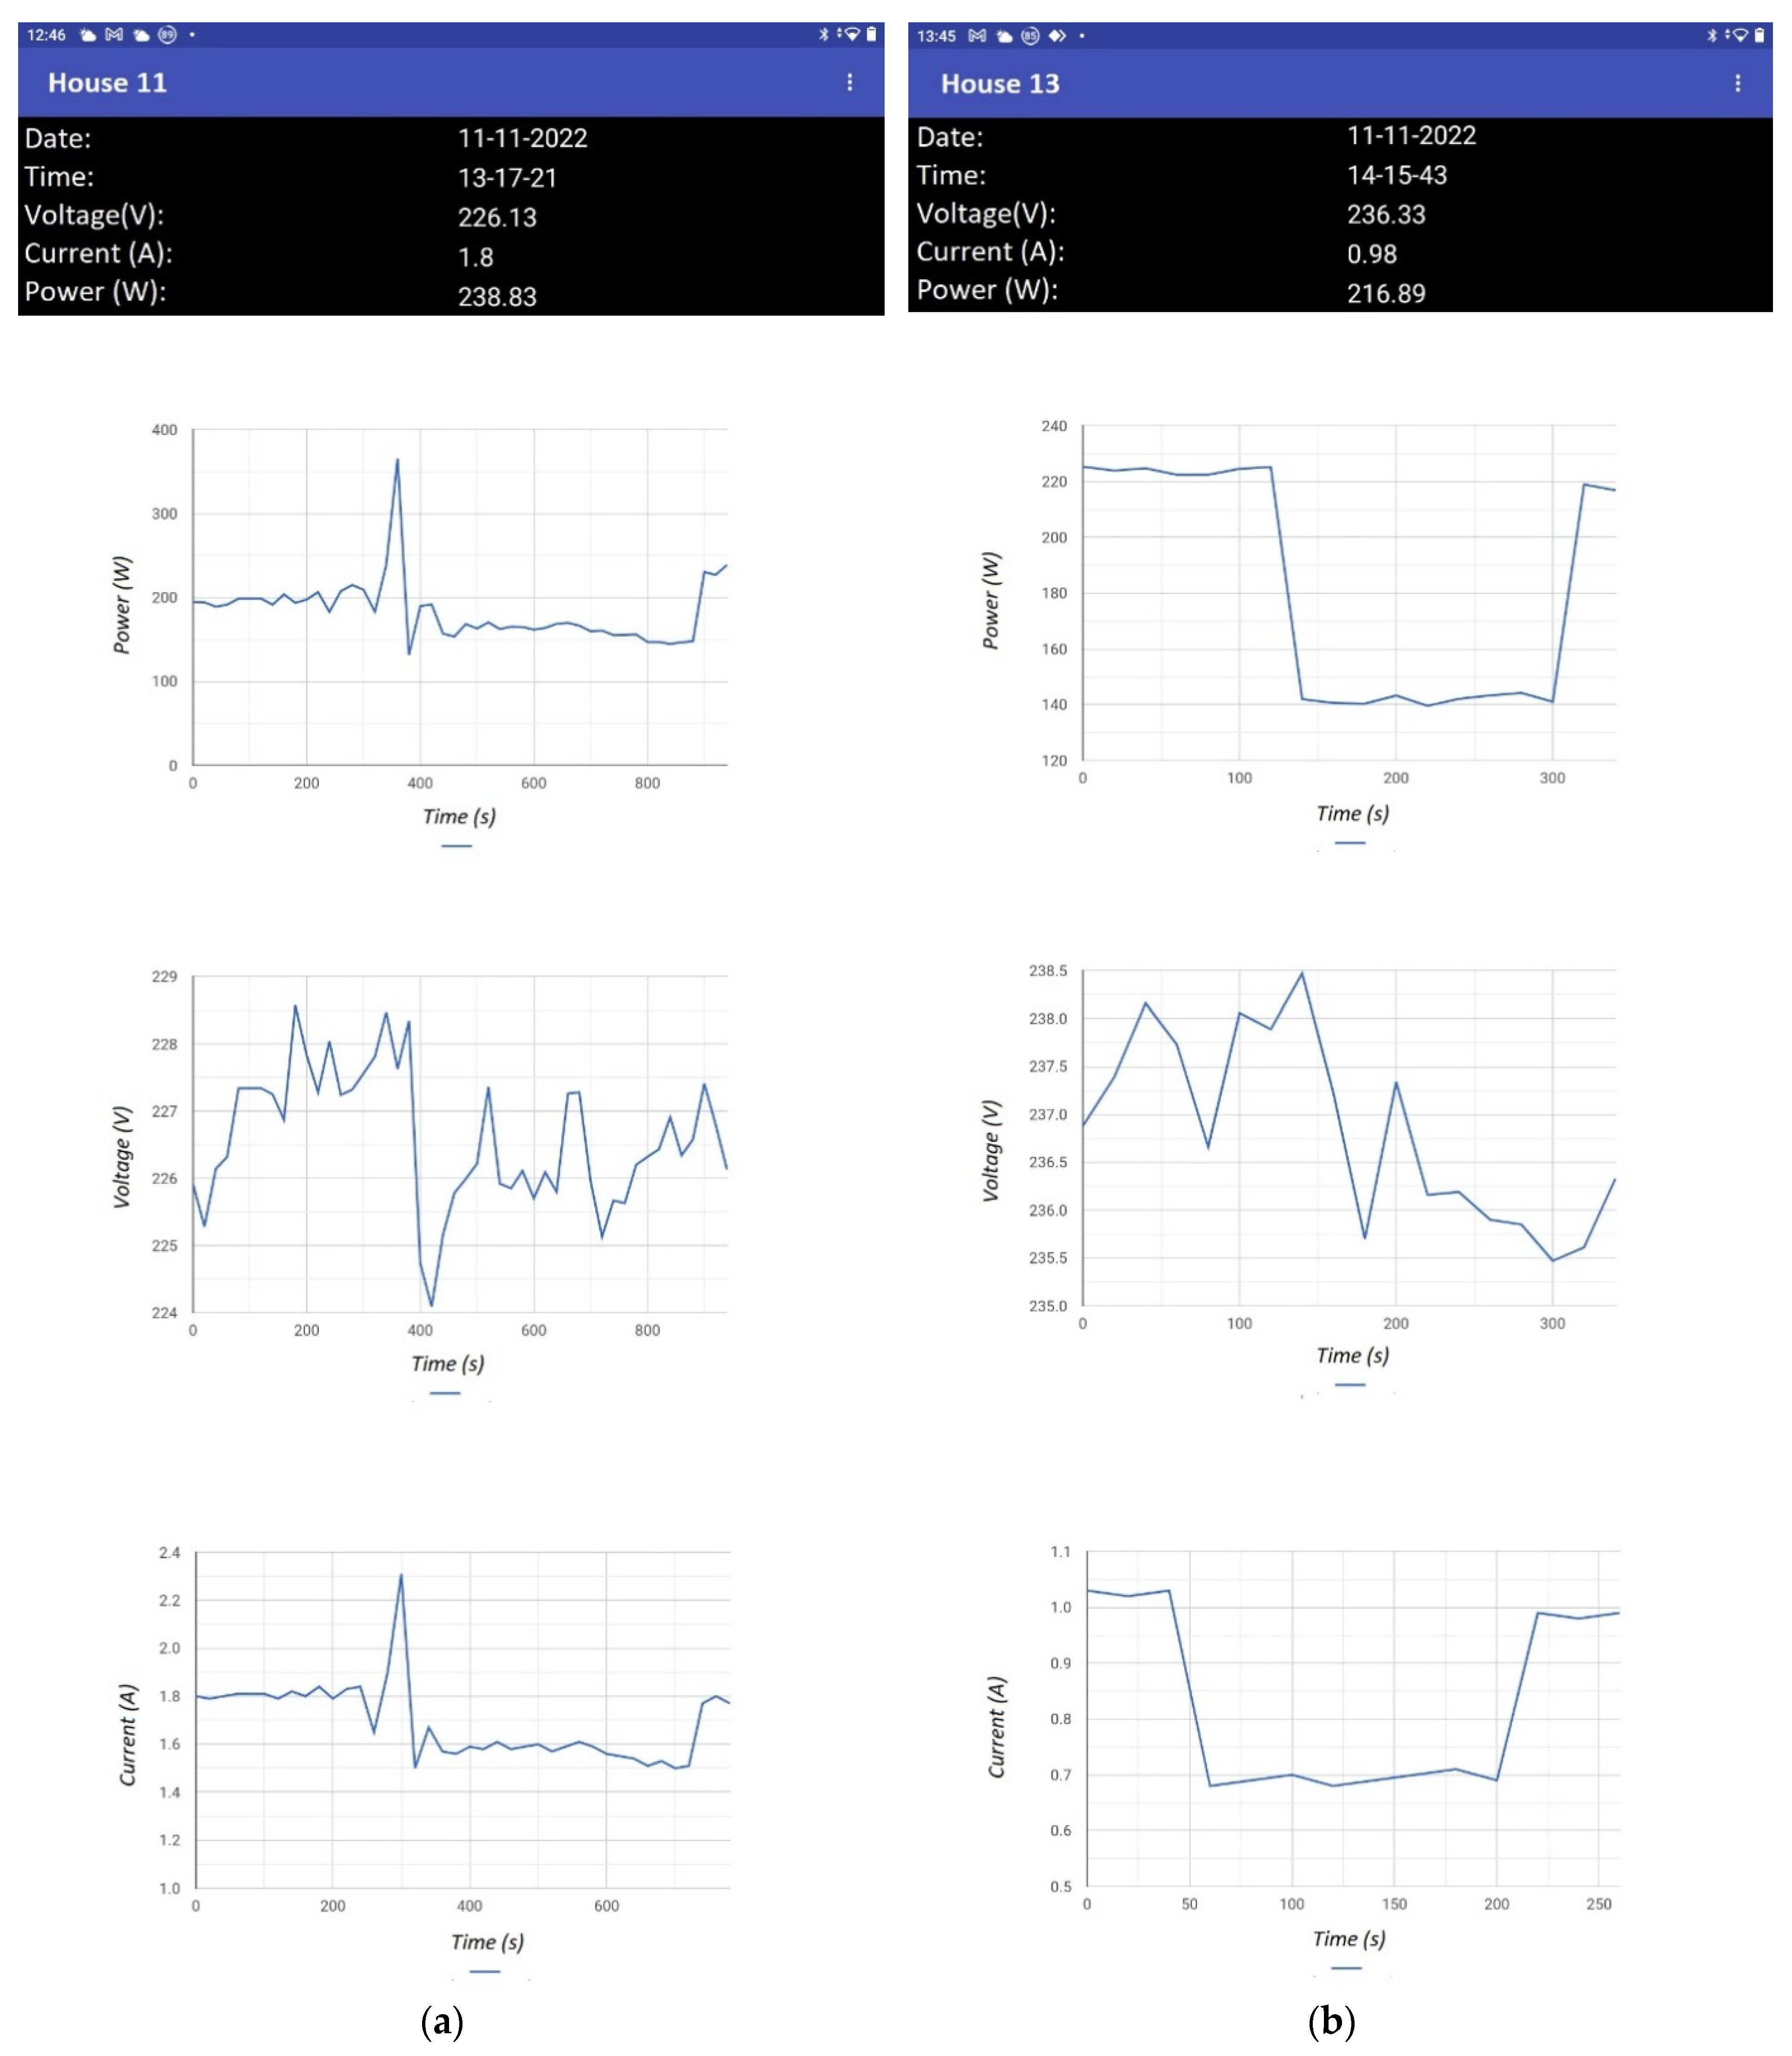
For less experienced users who have difficulties in using the dashboards created, an app was created that allows real-time monitoring in a simpler and more interpretable way. Each user can only see their own home in their app, leaving the comparison and visualisation of other data to the dashboards. The App is personalised for each user and only the user can use it.
The app displays real-time data with a timestamp of voltage, current, and power. In addition, graphs of these three variables can be displayed, allowing the user to observe the evolution of the recorded values over time.
Figure 17 shows the apps for houses 11 and 13.
6. Conclusions and Future Works
This research study successfully developed a prototype SMH for monitoring electrical variables and uploading data to cloud using a wireless connection. This SMH was based on the Arduino open-source electronic platform and input data were collected with a set of sensors. The data are uploaded to the cloud each 0.5 s.
In addition, this study presents a web platform based on a cloud system that allows an innovative analysis of data captured in the Internet of Things data from smart homes, photovoltaics, and electrical vehicles in real time. Each user can download the data from their SM and view them in the developed app. The data are also available for query and download for the scientific community.
After the analysis of several solutions, we choose a cloud storage service for the subsequent and automatic processing of the data and the visualization, going from data to information. To validate the platform and present significant results, a case study was presented using the data acquired. The results of the experiments clearly show the benefit and feasibility of the proposed platform. We provided a detailed requirement analysis and illustration of the platform components.
The authors refined the platform component and it was tested with datasets from different electrical devices, such as household appliances. This approach is crucial to validate the platform’s applicability and robustness in dealing with all types of IoT data measurements. This research uses datasets with extensive temporal data and with different types of households, allowing for comparisons of load profiles, electrical variables, etc.
Future lines of research would include adding datasets from different electrical devices, such as household appliances. In addition, future research would include developing a demand–response algorithm to be included in the SM to work in conjunction with the proposed methodology. Another possible line is aggregated information derived from measurements with application of artificial intelligence algorithms, e.g., automatic prediction systems and development of tools to perform a multidimensional analysis of the data.


 ,
, 


