Abstract
Electromyography is a diagnostic medical procedure used to assess the state of a muscle and its related nerves. Electromyography signals are monitored to detect neuromuscular abnormalities and diseases but can also prove useful in decoding movement-related signals. This information is vital to controlling prosthetics in a more natural way. To this end, a novel analog integrated voting classifier is proposed as a hand gesture recognition system. The voting classifiers utilize 3 separate centroid-based classifiers, each one attached to a different electromyographic electrode and a voting circuit. The main building blocks of the architecture are bump and winner-take-all circuits. To confirm the proper operation of the proposed classifier, its post-layout classification results (91.2% accuracy) are compared to a software-based implementation (93.8% accuracy) of the same voting classifier. A TSMC 90 nm CMOS process in the Cadence IC Suite was used to design and simulate the following circuits and architectures.
1. Introduction
A new generation of devices, based on the development of circuits and systems that enable real-time health monitoring, prevention, and personalized medicine for a variety of chronic and acute diseases, has generated a high amount of interest in wearable technology [1]. Such devices provide relevant information and analyses directly to users, enabling real-time feedback. To this end, wearable biosensors have evolved to the point that they can be considered ready for clinical application [2,3,4]. In the next few years, wearable systems will be a part of clinical evaluations, mostly in cases involving continuous patient monitoring over extended periods of time [5]. In addition, these biosensors allow healthcare providers to monitor the physiological traits of patients and prevent high-risk sudden acute events.
The progress in wearable technology has resulted in the creation of compact, low-cost, energy-efficient, and real-time integrated circuits (ICs) [6]. More specifically, at a system-level analysis, these new advancements are combined with new computing paradigms and machine learning (ML) techniques to provide smart wearable biosensors [7,8,9]. This can be a promising alternative for both clinical patient monitoring and disease detection. There are different examples of measuring biopotentials, such as an electrocardiogram (ECG), electroencephalogram (EEG), electromyogram (EMG), or electrooculogram (EOG) [10]. In the case of an EMG, muscle response or electrical activity in response to a nerve’s stimulation of the muscle can be measured [11]. Pairs of electrodes are used on a specific muscle and a separate location is used as a reference for EMG measurements. This continuous activity can detect neuromuscular abnormalities. However, besides measuring biopotentials, there are other sensors to monitor human gestures, such as optical sensors [12], piezoelectric sensors [13], skin-friendly soft elastic material sensors [14], and biochemical sensors [15].
Recently, there are cases in which health monitoring is necessary for an extensive period of time while away from a hospital [16]. Smart, battery-dependent, area-efficient wearable devices can help patients maintain normal lives. New computing methods have been provided as promising alternatives to power-hungry–high latency biosensors. These methods are based on a combination of two basic paradigms; edge computing and analog computing [7,8]. With distributed computing, the processing and monitoring are achieved as close to the originating sources as possible. Moreover, in analog computing, by incorporating application-specific mathematical approaches and sub-threshold region techniques, both area and power efficiency are provided [17].
We were motivated by the need for low-power biosensors [18,19]; thus, we combined sub-threshold-based analog computing techniques with ML ones [17]. To this end, in this work, a low-voltage ( V), low-power (31.5 ) voting classifier analog is introduced as a hand gesture recognition circuit. It is based on the mathematical modeling of the software-based classifier using two main circuits. An ultra-low power Gaussian function circuit [20] and an argmax operator circuit [21] were employed as building blocks. The classifier was trained and tested on a real-world hand gesture recognition dataset [22]. Post-layout simulation results were conducted on a TSMC 90 nm CMOS process using the Cadence IC suite; results were compared with a software-based implementation. Moreover, the Monte Carlo analysis confirmed the proper sensitivity of the implemented architecture [23].
The remainder of this paper is organized as follows. Section 2 refers to the background of this work. More specifically, the fundamentals of EMG and related applications as well as the mathematical model of the voting and the centroid-based classifier are explained. The basic building blocks and the proposed high-level architecture of the analog classifier are presented in Section 3. The proper operation of the implemented classifier was confirmed via a real-world hand gesture recognition dataset, as discussed in Section 4. A performance summary regarding analog classifiers is provided in Section 5. Our concluding remarks are presented in Section 6.
2. Background
2.1. Electromyography and Applications
An EMG refers to the technique of detecting and measuring muscular movements from the electrical activity of the nerves. By using specialized probes, called electrodes, the signal is detected, amplified, and visualized at an oscilloscope. Generally, the detection is achieved by intramuscular detectors, which are injected under the skin, or with surface detectors, where the signal is also called surface EMG (sEMG) [11]. Depending on the method, the EMG signal ranges from to 10 mV and 50 to 150 Hz [24]. After the detection, analog pre-processing circuits are vital in order to amplify the signal’s voltage range and filter it in various denoised sub-signals. This procedure increases the quality of the extracted EMG.
The detection of the EMG signal has numerous clinical applications, including diagnosing muscular disorders (e.g., Parkinson’s disease) or controlling prosthetic parts [25,26]. The latter is especially important in the development of dynamic prosthetic limbs, such as arms, legs, and fully functioning hands. The most common approach for this pursuit involves the installation of intramuscular electrodes. Multiple filtering stages, beginning with a low pass filter, such as the fourth order Butterworth, a high pass, and a notch filter, are paramount. After that, the EMG signals become smooth, amplified, convert to pulses, and pass in the servo motors, which move the artificial parts [24,27,28].
In the literature, ML is a highly researched technique used for decomposing and decoding EMG signals [29]. Typical neural networks (NNs) have been utilized in diagnoses and human–computer interaction (HCI) methods. For instance, the recognition of various neuropathies can be automated by monitoring EMG signals [30]. Alternatively, biosignals can be decoded and then inserted as commands into a prosthetic machine. There are also hardware implementations that aim to analyze EMG signals. Specified circuitry, such as system-on-chips capable of performing classification by implementing a support vector machine (SVM) and neuromorphic spiking NN are paramount for low-power, fast-response classification systems aiming for wearable or portable biomedical devices [31,32].
2.2. Mathematical Modeling of Centroid-Based Classifications
A voting classifier is composed of multiple sub-classifiers that manage the predictions In essence, the prediction of each sub-classifier is a vote toward a specific class. The voting classifier counts each vote and indicates the class with the most votes. In this work, all votes are equal and all sub-classifiers are identical but they receive data from different EMG electrodes. This, however, is not necessary for a voting classifier and one may introduce weights on each vote as well as different designs and ML models for each sub-classifier. The classifiers used in this work are built on a classical, centroid-based, ML procedure, i.e., the nearest class with a multi-centroid classification scheme. With the usage of multiple, strategically selected, sub-classes per class, this algorithm is generally more capable than a more naive form of centroid-based classification, the nearest class mean classifier. The training of this ML model includes the first unsupervised clustering part along with a supervised labeling one.
The clustering of the dataset is performed by the K-means algorithm. The K-means is a simple hierarchical-based clustering technique that attempts to group objects without directly specifying the relation between them. Instead, the clustering is performed with a reference centroid object c that does not necessarily belong in the dataset. The usually represents the mean value of every object of cluster j. Therefore, the number of is also the number of clusters that the algorithm attempts to derive. Given the number of clusters, the calculation of the means is performed by a gradient descent type procedure [33,34].
After the optimization with the K-means algorithm, every class is represented by a number of vectors where i is the class index and j is the subclass index referring to the class [35,36]. The classification is then performed by the nearest class mean classifier, which compares the data points of the dataset with all the sub-class mean vectors. As a result, the classifier’s predictions are given by:
where is the label of the data point q, is the number of centroids assigned to class i, and is a similarity function. In this work, is chosen as the multivariate Gaussian function:
where each sub-class is the vector representing the chosen centroid and is the singular matrix.
3. Proposed Architecture
The proposed voting classifier is composed of a centroid-based classifier and a simple voting circuit, aimed at 4-class and 10-feature classification problems. However, the same design methodology can be applied to any classification problem with different numbers of classes or input features [37]. Another tunable hyperparameter is the number of sub-classes, which was optimized using the K-means algorithm [35] at 6, 6, 4, and 3 for each class, respectively. This optimization also considered the complexity of the model, since in an application-specific classifier, power and area efficiency are paramount. Both architectures utilized bump (Gaussian function) [37] and WTA [21] circuits as their main building blocks. The power supply rails are set as and, hence, all transistors operate in the sub-threshold region.
3.1. Centroid-Based Classifier
Bump circuits are used as compact ways to implement Gaussian functions [20,38]. In this work, a fully electronically tunable bump circuit, proposed in [37], is utilized and shown in Figure 1. To achieve a higher quality in the produced Gaussian curve, shown in Figure 2, an increase in the dimensions of the differential block transistors was applied. This modification affects the linearity of the differential pair’s sigmoidal output current, at the cost of the chip-area [39]. As shown in Figure 1, this aspect ratio is set to 7 and the transistor dimensions are summarized in Table 1.
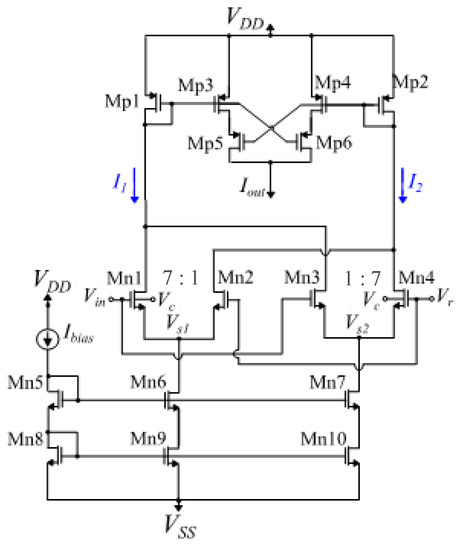
Figure 1.
The utilized bump circuit. The parameter voltages , , and the bias current control the Gaussian function’s mean value, variance, and peak value, respectively.
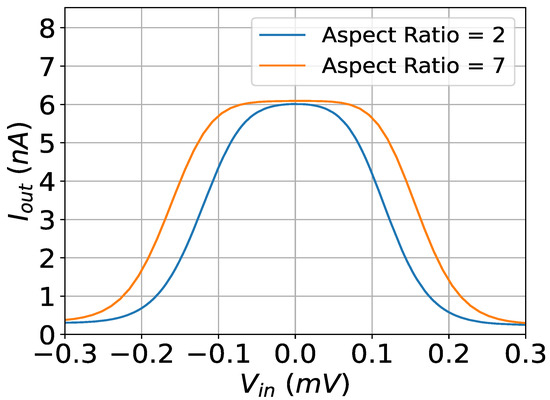
Figure 2.
The output current of the modified (orange) and the baseline (blue) bump circuits. The controlling parameters for both circuits are set to V, mV, and nA.

Table 1.
MOS Transistor Dimensions (Figure 1).
In the literature, multivariate Gaussian function curves are produced by expanding the simple bump circuit [37,40]. In particular, by connecting N bump circuits sequentially, the output current of the last bump circuit represents an N-D Gaussian function, as shown in Figure 3. In this configuration, the parameters of each bump cell are tuned independently of each other and from other calls. Specifically, each parameter voltage equals the Gaussian function’s mean value of its respective cell. Similarly, the bias current sets its peak value. Lastly, the parameter voltage controls the variance without affecting the peak value of the Gaussian function.
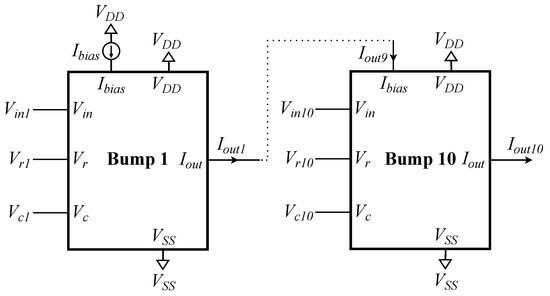
Figure 3.
By connecting 10 simple bump circuits sequentially, the output of the last one is equivalent to a 10-D Gaussian function. Each bump circuit’s parameters (, , ) are tuned independently.
A simple N input WTA circuit is composed of N neuron cells that share a single bias current [21], both shown in Figure 4. For an NMOS-based neuron, all transistor dimensions are set to . In the literature, the WTA is used to implement the operator [21]. However, a common problem with a WTA circuit is its wide linear region, due to which, multiple winners may occur and, hence, undermine the predictions of the classifier [37]. To counter this effect, two solutions are utilized. The first one is related to a previous work [37], in which more than 1 WTA was connected in a cascaded format. In this work, a new area-efficient idea is proposed, to be used independently or complementary to the aforementioned one. By adding a diode-connected transistor () beneath the input transistor of each neuron, as shown in Figure 4, the linear region of the WTA circuit is decreased. This is demonstrated in Figure 5.
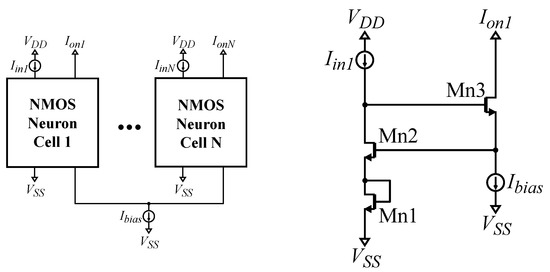
Figure 4.
Left: A N neuron NMOS-based Lazzaro WTA circuit. Right: a modified NMOS-based Lazzaro WTA neuron. The PMOS-based variants for both circuits are built accordingly.
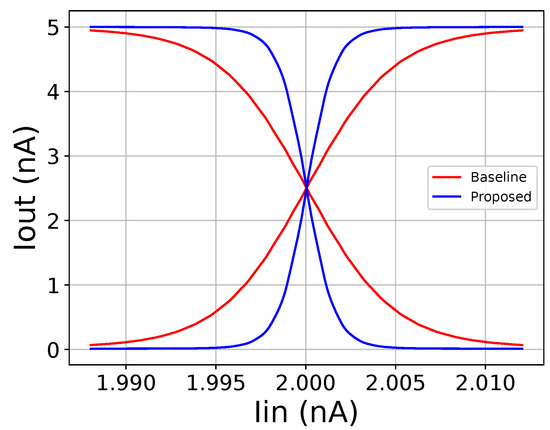
Figure 5.
Comparison between the baseline cascaded WTA and the proposed cascaded WTA circuits with the added diode-connected transistor.
In this work, the utilized WTA block is composed of 2 simple WTA circuits, shown in Figure 6. The first one receives 19 inputs (, one for each sub-class) and its outputs are added to account for 4 output currents (one for each class), given by:
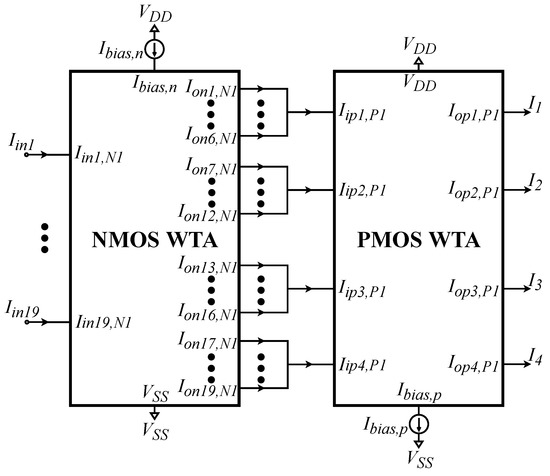
Figure 6.
The utilized WTA circuit is composed of a 19-neuron WTA and a 4-neuron WTA circuit connected sequentially. The output currents of the first WTA circuit that correspond to the sub-classes of each class are summed and then inserted into the second WTA.
This summation increases the aforementioned defect of the WTA circuit; therefore, a second 4-input WTA circuit is required. The output currents of this circuit correspond to the predictions of the classifier, shown in Figure 7; the one indicating the winning class has a high value whereas the rest have values close to zero.
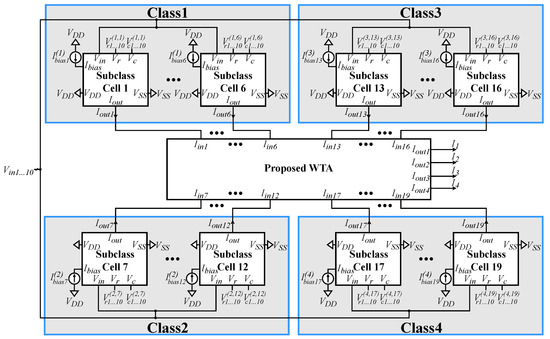
Figure 7.
The implementation of the analog centroid-based classifier. The output currents of each multivariate bump circuit representing each sub-class are inserted into the WTA circuit to indicate the winning class.
3.2. Voting Circuit
In the tackled application, the data from 3 electrodes are inserted on 3 separate centroid-based classifiers. In practice, these classifiers can operate independently and accurately predict the winning class. However, by combining the predictions, the overall accuracy can be significantly increased. The voting circuit, shown in Figure 8, manages the output currents of these classifiers. In particular, each current mirror adder (CMA), receives all output currents that are related to a specific class, and calculates the summation. Since the input currents of the CMAs are in a binary format, they essentially operate as a vote counter. Then, a final 4-input WTA circuit compares the added currents (that represent the counted votes) to indicate the winning class.
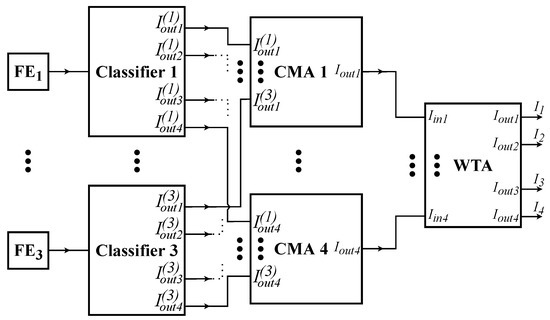
Figure 8.
The system-level implementation of the proposed voting classifier is composed of 3 processing parts: (center) analog feature extraction (FE) (middle), analog classifiers (right), and analog voting circuit.
4. Application Example and Simulation Results
The proposed classifier was validated on a real-world gesture identification dataset constructed from one of Kaggle’s EMG datasets [22], which consists of EMG signals for 7 different hand gestures. In particular, in this work, the classifier was trained to identify 4 different gestures: a resting position, victory gesture, and movements from the middle or ring finger. The EMG stimulations, of the constructed dataset, were captured from 3 surface electrodes situated on the subject’s arm. These 3 particular electrode positions had the biggest precisions regarding the four chosen gestures. As a result, the model performed better at classifying this combination. To maximize the system’s performance, the voting classifier is composed of 3 centroid-based classifiers, each one attached to a single electrode. Each classifier operates with 10 time domain features provided from the dataset: the standard deviation, the root mean square, the minimum, the maximum, the zero crossings, the average amplitude change, the amplitude first burst, the mean absolute value, the waveform length, and the Willison amplitude [22]. Most of these features can be extracted from preprocessed EMG signals using analog feature extraction techniques [41,42,43,44]. In that case, a fully analog classification system, such as the one shown in Figure 9, utilized in smart sensor applications can be designed. In particular, the entire processing stream from the acquisition of the biosignal to the decision of the classifier is performed with analog circuits.

Figure 9.
Top-level concept architecture for a fully analog hand gesture recognition system. It receives an EMG signal using a biosensor, which is then processed to enable the extraction of the classification features. Lastly, the final decision (in a digital format) is achieved via an analog classifier without the need for typical analog-to-digital converters.
In order to design and simulate the proposed architecture, the Cadence IC suite tool was used in a TSMC 90 nm CMOS process. The layout, shown in Figure 10, is designed based on the common-centroid technique to achieve better matching between the transistors [45] and, therefore, extra dummy transistors were added. In the complete layout, the appropriate guard rings and input–output pads were added The following simulation results were extracted using the designed layout (post-layout simulations).
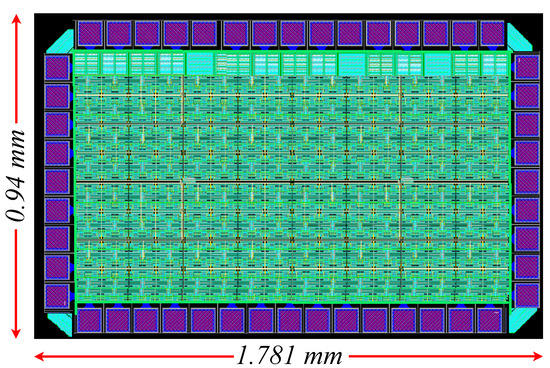
Figure 10.
Layout of the proposed voting classifier, including the 3 centroid-based classifiers and the voting circuit.
To account for random behaviors and confirm the robustness of both the centroid-based and voting classifiers, 2 tests were conducted. In both tests, the analog classifiers were also compared with identical software-based ones in terms of classification accuracy. The first one measures the variation of the classification’s accuracy over 20 different training iterations. The results are depicted in the classification’s histogram, shown in Figure 11, and summarized in Table 2. For reference, the classification’s histograms for the centroid-based classifiers attached to each electrode (classifiers 1, 2, 3) are depicted in Figure 12, Figure 13 and Figure 14. It is evident that the voting classifier that is composed of 3 single classifiers outperforms them. The second test is a Monte Carlo sensitivity analysis for points. This analysis depicts the effects of process, voltage, temperature, and mismatch variations, at the circuit level, in the classifier’s accuracy. The Monte Carlo histograms for the voting classifier and classifier 1 are presented in Figure 15 and Figure 16, respectively, and their characteristics are summarized in Table 3. Here, the voting classifier has more robust sensitivity results than its counterparts.
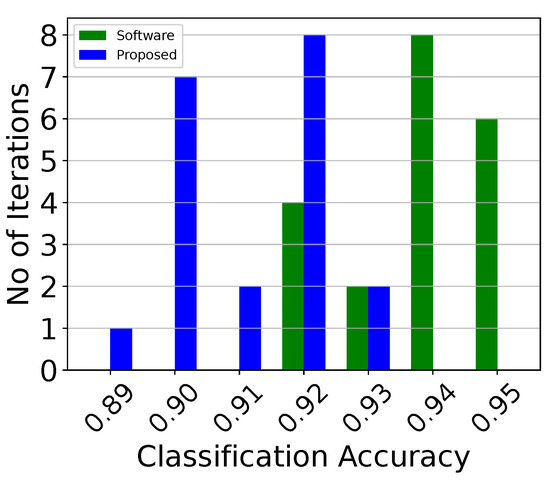
Figure 11.
Classification accuracy histogram of the analog voting classifier over 20 iterations.
Table 2.
Classification accuracies (over 20 iterations).
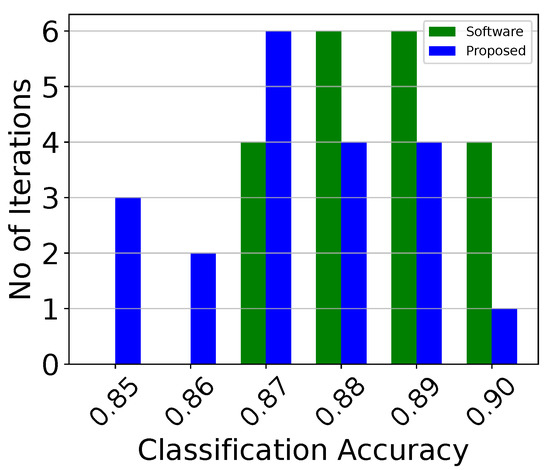
Figure 12.
Classification accuracy histogram of the analog centroid-based classifier attached to the first electrode (classifier 1) over 20 iterations.
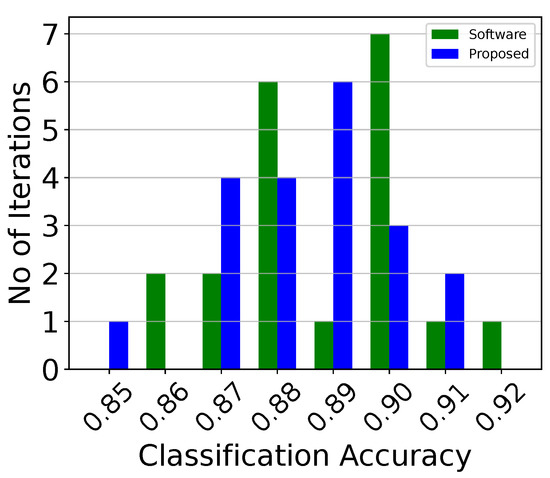
Figure 13.
Classification accuracy histogram of the analog centroid-based classifier attached to the second electrode (classifier 2), over 20 iterations.
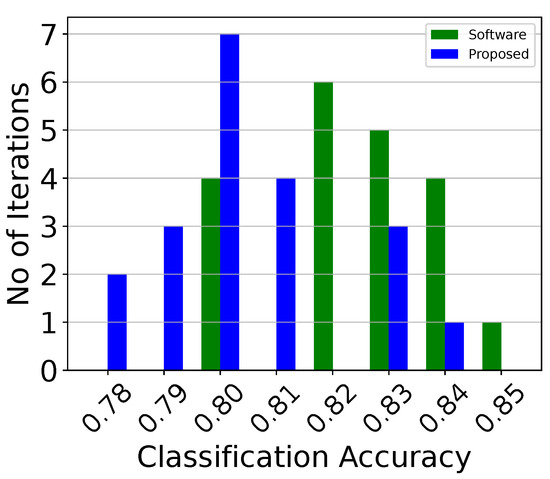
Figure 14.
Classification accuracy histogram of the analog centroid-based classifier attached to the third electrode (classifier 3) over 20 iterations.
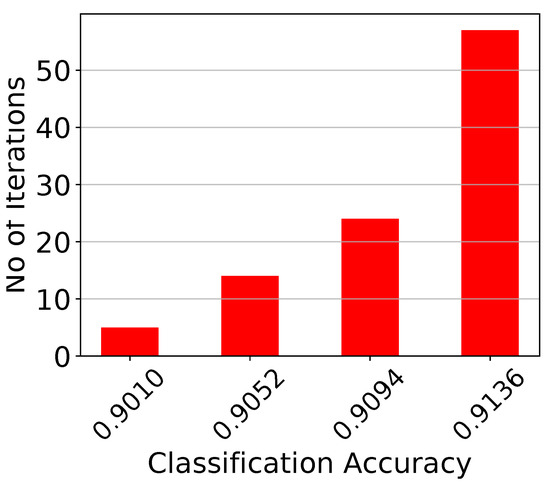
Figure 15.
Monte Carlo histogram on the voting classifier’s accuracy for points.
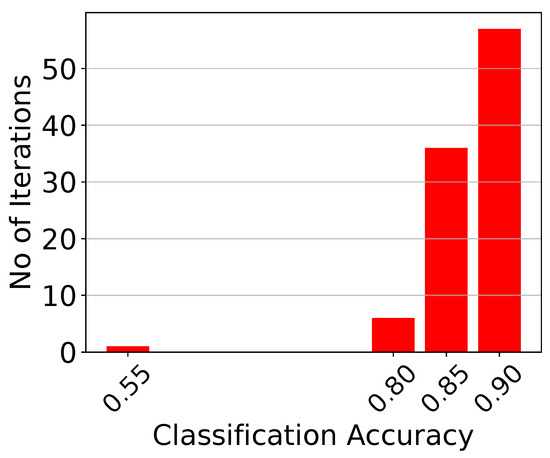
Figure 16.
Monte Carlo histogram of the analog centroid-based classifier attached to the first electrode for points.
Table 3.
Monte Carlo Analysis, classification accuracy.
5. Performance Summary and Discussion
In this section, a discussion related to the pure analog classifiers is summarized in Table 4. Since most analog classifiers are application-specific, an unbiased comparison is unavoidable and, therefore, the aim of Table 4 is not to compare but to provide a reference point for the performance of the proposed work. However, voting classifiers present strong advantages over typical architectures, because they extract data from multiple different sources (in our case, from 3 electrodes) and, hence, increase the robustness of the architecture. Additionally, while in this work, a simple centroid-based classifier is used as the basic building block of the voting classifier, all architectures provided in Table 4 can replace it to design a different voting classifier. These include a support vector machine (SVM) [46,47,48], radial basis function (RBF), neural network (NN) [49], Gaussian RBF network (GRBFN) [50], Gaussian mixture model (GMM) [37], or Bayesian [51] and K-means-based [52] classifiers.
Table 4.
Analog ML algorithm summary.
In this application, the dataset contains information from multiple sources. Instead of combining them into a single classifier, the data are separated into 3 individual architectures, which in turn comprise the voting classifier. By doing so, the complexity of the overall design is significantly decreased; for instance, a 30-D bump circuit provides a low quality Gaussian function that cannot be used in a classifier. However, three parallel 10-D bump circuits operate adequately. The main trade-off is the increase in the chip area and power consumption from the utilization of the voting circuit and the auxiliary circuits of each classifier. As a result, reductions in power and area efficiency provide more reliable and accurate architectures.
6. Conclusions
In this work, an analog-integrated voting classifier built around 3 analog centroid-based classifiers was introduced. The latter were designed using bump and WTA circuits as their main building blocks, whereas the voting classifier also required multiple current adders and a simple WTA circuit. A real-world hand gesture recognition dataset was used to validate the proper operation of the implemented classification system. Specifically, 2 tests were conducted on the layout. One test involved classification accuracy and a Monte Carlo analysis to validate the circuit’s sensitivity to variations and mismatches. The error in the achieved accuracy () compared to a software implementation of an identical ML model () was minimal. A TSMC 90 nm technology was used to design and simulate all implemented architectures.
Author Contributions
Investigation, V.A., V.M., and G.G.; writing—original draft, V.A., V.M., and G.G.; writing—review and editing, V.A., V.M., G.G., E.T., C.D. and P.P.S. All authors have read and agreed to the published version of the manuscript.
Funding
This research received no external funding.
Data Availability Statement
The data used in this study are openly available in the Starter: Electromyography (EMG) Dataset 533d170a-8 at https://www.kaggle.com/code/kerneler/starter-electromyography-emg-dataset-533d170a-8/notebook (accessed on 5 October 2022), reference number [22].
Conflicts of Interest
The authors declare no conflict of interest.
References
- Iqbal, M.H.; Aydin, A.; Brunckhorst, O.; Dasgupta, P.; Ahmed, K. A review of wearable technology in medicine. J. R. Soc. Med. 2016, 109, 372–380. [Google Scholar] [CrossRef]
- Kim, J.; Campbell, A.S.; de Ávila, B.E.F.; Wang, J. Wearable biosensors for healthcare monitoring. Nat. Biotechnol. 2019, 37, 389–406. [Google Scholar] [CrossRef] [PubMed]
- Sharma, A.; Badea, M.; Tiwari, S.; Marty, J.L. Wearable biosensors: An alternative and practical approach in healthcare and disease monitoring. Molecules 2021, 26, 748. [Google Scholar] [CrossRef]
- Bonato, P. Advances in wearable technology and its medical applications. In Proceedings of the IEEE 2010 Annual International Conference of the IEEE Engineering in Medicine and Biology, Buenos Aires, Argentina, 31 August–4 September 2010; pp. 2021–2024. [Google Scholar]
- Chan, M.; Estève, D.; Fourniols, J.Y.; Escriba, C.; Campo, E. Smart wearable systems: Current status and future challenges. Artif. Intell. Med. 2012, 56, 137–156. [Google Scholar] [CrossRef] [PubMed]
- Li, Y.; Poon, C.C.; Zhang, Y.T. Analog integrated circuits design for processing physiological signals. IEEE Rev. Biomed. Eng. 2010, 3, 93–105. [Google Scholar] [CrossRef] [PubMed]
- Shi, W.; Dustdar, S. The promise of edge computing. Computer 2016, 49, 78–81. [Google Scholar] [CrossRef]
- Haensch, W.; Gokmen, T.; Puri, R. The next generation of deep learning hardware: Analog computing. Proc. IEEE 2018, 107, 108–122. [Google Scholar] [CrossRef]
- Özdemir, A.T.; Barshan, B. Detecting falls with wearable sensors using machine learning techniques. Sensors 2014, 14, 10691–10708. [Google Scholar] [CrossRef] [PubMed]
- Ehrmann, G.; Blachowicz, T.; Homburg, S.V.; Ehrmann, A. Measuring biosignals with single circuit boards. Bioengineering 2022, 9, 84. [Google Scholar] [CrossRef] [PubMed]
- Farina, D.; Merletti, R.; Enoka, R.M. The extraction of neural strategies from the surface EMG. J. Appl. Physiol. 2004, 96, 1486–1495. [Google Scholar] [CrossRef] [PubMed]
- Lo Presti, D.; Carnevale, A.; D’Abbraccio, J.; Massari, L.; Massaroni, C.; Sabbadini, R.; Schena, E. A multi-parametric wearable system to monitor neck movements and respiratory frequency of computer workers. Sensors 2020, 20, 536. [Google Scholar] [CrossRef] [PubMed]
- Hong, Y.; Wang, B.; Lin, W.; Jin, L.; Liu, S.; Luo, X.; Yang, Z. Highly anisotropic and flexible piezoceramic kirigami for preventing joint disorders. Sci. Adv. 2021, 7, eabf0795. [Google Scholar] [CrossRef] [PubMed]
- Gu, Y.; Zhang, T.; Chen, H.; Wang, F.; Pu, Y.; Gao, C.; Li, S. Mini review on flexible and wearable electronics for monitoring human health information. Nanoscale Res. Lett. 2019, 14, 1–15. [Google Scholar] [CrossRef] [PubMed]
- Nasiri, S.; Khosravani, M.R. Progress and challenges in fabrication of wearable sensors for health monitoring. Sens. Actuators A Phys. 2020, 312, 112105. [Google Scholar] [CrossRef]
- Kakria, P.; Tripathi, N.K.; Kitipawang, P. A real-time health monitoring system for remote cardiac patients using smartphone and wearable sensors. Int. J. Telemed. Appl. 2015, 2015, 8. [Google Scholar] [CrossRef]
- Wang, A.; Calhoun, B.H.; Chandrakasan, A.P. Sub-Threshold Design for Ultra Low-Power Systems (Volume 95); Springer: New York, NY, USA, 2006. [Google Scholar]
- Reid, R.C.; Mahbub, I. Wearable self-powered biosensors. Curr. Opin. Electrochem. 2020, 19, 55–62. [Google Scholar] [CrossRef]
- Grattieri, M.; Minteer, S.D. Self-powered biosensors. ACS Sens. 2018, 3, 44–53. [Google Scholar] [CrossRef]
- Alimisis, V.; Gourdouparis, M.; Gennis, G.; Dimas, C.; Sotiriadis, P.P. Analog Gaussian Function Circuit: Architectures, Operating Principles and Applications. Electronics 2021, 10, 2530. [Google Scholar] [CrossRef]
- Lazzaro, J.; Ryckebusch, S.; Mahowald, M.A.; Mead, C.A. Winner-take-all networks of O (n) complexity. Adv. Neural Inf. Process. Syst. 1988, 1, 703. [Google Scholar]
- Starter: Electromyography(EMG) Dataset 533d170a-8. Available online: https://www.kaggle.com/code/kerneler/starter-electromyography-emg-dataset-533d170a-8/notebook (accessed on 29 October 2022).
- Hung, H.; Adzic, V. Monte carlo simulation of device variations and mismatch in analog integrated circuits. Proc. NCUR 2006, 2006, 1–8. [Google Scholar]
- Martinek, R.; Ladrova, M.; Sidikova, M.; Jaros, R.; Behbehani, K.; Kahankova, R.; Kawala-Sterniuk, A. Advanced Bioelectrical Signal Processing Methods: Past, Present, and Future Approach—Part III: Other Biosignals. Sensors 2021, 21, 6064. [Google Scholar] [CrossRef]
- Reaz, M.B.I.; Hussain, M.S.; Mohd-Yasin, F. Techniques of EMG signal analysis: Detection, processing, classification and applications. Biol. Proced. Online 2006, 8, 11–35. [Google Scholar] [CrossRef] [PubMed]
- Hogrel, J.Y. Clinical applications of surface electromyography in neuromuscular disorders. Neurophysiol. Clin. Neurophysiol. 2005, 35, 59–71. [Google Scholar] [CrossRef] [PubMed]
- Sudarsan, S.; Sekaran, E.C. Design and development of EMG controlled prosthetics limb. Procedia Eng. 2012, 38, 3547–3551. [Google Scholar] [CrossRef]
- Castellini, C.; Van Der Smagt, P. Surface EMG in advanced hand prosthetics. Biol. Cybern. 2009, 100, 35–47. [Google Scholar] [CrossRef] [PubMed]
- Yousefi, J.; Hamilton-Wright, A. Characterizing EMG data using machine-learning tools. Comput. Biol. Med. 2014, 51, 1–13. [Google Scholar] [CrossRef] [PubMed]
- Saridis, G.N.; Gootee, T.P. EMG pattern analysis and classification for a prosthetic arm. IEEE Trans. Biomed. Eng. 1982, 6, 403–412. [Google Scholar] [CrossRef] [PubMed]
- Sadikoglu, F.; Kavalcioglu, C.; Dagman, B. Electromyogram (EMG) signal detection, classification of EMG signals and diagnosis of neuropathy muscle disease. Procedia Comput. Sci. 2017, 120, 422–429. [Google Scholar] [CrossRef]
- Benatti, S.; Rovere, G.; Bösser, J.; Montagna, F.; Farella, E.; Glaser, H.; Benini, L. A sub-10mW real-time implementation for EMG hand gesture recognition based on a multi-core biomedical SoC. In Proceedings of the 2017 7th IEEE International Workshop on Advances in Sensors and Interfaces (IWASI), Vieste, Italy, 15–16 June 2017; pp. 139–144. [Google Scholar]
- Vitale, A.; Donati, E.; Germann, R.; Magno, M. Neuromorphic Edge Computing for biomedical applications: Gesture Classification using EMG Signals. IEEE Sens. J. 2022, 22, 19490–19499. [Google Scholar] [CrossRef]
- Bottou, L.; Bengio, Y. Convergence properties of the K-means algorithms. Adv. Neural Inf. Process. Syst. 1994, 7, 585. [Google Scholar]
- Kodinariya, T.M.; Makwana, P.R. Review on determining number of Cluster in K-Means Clustering. Int. J. 2013, 1, 90–95. [Google Scholar]
- Quackenbush, J. Computational analysis of microarray data. Nat. Rev. Genet. 2001, 2, 418–427. [Google Scholar] [CrossRef] [PubMed]
- Alimisis, V.; Gennis, G.; Touloupas, K.; Dimas, C.; Gourdouparis, M.; Sotiriadis, P.P. Gaussian Mixture Model classifier analog integrated low-power implementation with applications in fault management detection. Microelectron. J. 2022, 126, 105510. [Google Scholar] [CrossRef]
- Delbrueck, T.; Mead, C. Bump circuits. In Proceedings of the International Joint Conference on Neural Networks, Nagoya, Japan, 25–29 October 1993; Volume 1, pp. 475–479. [Google Scholar]
- Gourdouparis, M.; Alimisis, V.; Dimas, C.; Sotiriadis, P.P. An ultra-low power,±0.3 V supply, fully-tunable Gaussian function circuit architecture for radial-basis functions analog hardware implementation. AEU-Int. J. Electron. Commun. 2021, 136, 153755. [Google Scholar] [CrossRef]
- Alimisis, V.; Gourdouparis, M.; Dimas, C.; Sotiriadis, P.P. A 0.6 V, 3.3 nW, Adjustable Gaussian Circuit for Tunable Kernel Functions. In Proceedings of the 2021 34th SBC/SBMicro/IEEE/ACM Symposium on Integrated Circuits and Systems Design (SBCCI), Campinas, Brazil, 23–27 August 2021; pp. 1–6. [Google Scholar]
- Villamizar, D.A.; Muratore, D.G.; Wieser, J.B.; Murmann, B. An 800 nW Switched-Capacitor Feature Extraction Filterbank for Sound Classification. IEEE Trans. Circuits Syst. I Regul. Pap. 2021, 68, 1578–1588. [Google Scholar] [CrossRef]
- Zhang, Y.; Mirchandani, N.; Onabajo, M.; Shrivastava, A. RSSI Amplifier Design for a Feature Extraction Technique to Detect Seizures with Analog Computing. In Proceedings of the 2020 IEEE International Symposium on Circuits and Systems (ISCAS), Seville, Spain, 12–14 October 2020; pp. 1–5. [Google Scholar]
- Yang, M.; Liu, H.; Shan, W.; Zhang, J.; Kiselev, I.; Kim, S.J.; Enz, C.; Seok, M. Nanowatt acoustic inference sensing exploiting nonlinear analog feature extraction. IEEE J. Solid-State Circuits 2021, 56, 3123–3133. [Google Scholar] [CrossRef]
- Yoo, J.; Yan, L.; El-Damak, D.; Altaf, M.A.B.; Shoeb, A.H.; Chandrakasan, A.P. An 8-cannel scalable EEG acquisition SoC with patient-specific seizure classification and recording processor. IEEE J. Solid-State Circuits 2012, 48, 214–228. [Google Scholar] [CrossRef]
- Sharma, A.K.; Madhusudan, M.; Burns, S.M.; Mukherjee, P.; Yaldiz, S.; Harjani, R.; Sapatnekar, S.S. Common-centroid layouts for analog circuits: Advantages and limitations. In Proceedings of the IEEE 2021 Design, Automation & Test in Europe Conference & Exhibition (DATE), Grenoble, France, 1–5 February 2021; pp. 1224–1229. [Google Scholar]
- Kang, K.; Shibata, T. An on-chip-trainable Gaussian-kernel analog support vector machine. IEEE Trans. Circuits Syst. I Regul. Pap. 2009, 57, 1513–1524. [Google Scholar] [CrossRef]
- Chakrabartty, S.; Cauwenberghs, G. Sub-microwatt analog VLSI trainable pattern classifier. IEEE J. Solid-State Circuits 2007, 42, 1169–1179. [Google Scholar] [CrossRef]
- Genov, R.; Cauwenberghs, G. Kerneltron: Support vector “machine” in silicon. IEEE Trans. Neural Netw. 2003, 14, 1426–1434. [Google Scholar] [CrossRef]
- Peng, S.Y.; Hasler, P.E.; Anderson, D. An analog programmable multi-dimensional radial basis function based classifier. In Proceedings of the IEEE 2007 IFIP International Conference on Very Large Scale Integration, Atlanta, GA, USA, 15–17 October 2007; pp. 13–18. [Google Scholar]
- Alimisis, V.; Gennis, G.; Dimas, C.; Gourdouparis, M.; Sotiriadis, P.P. An ultra low power analog integrated radial basis function classifier for smart IoT systems. Analog. Integr. Circuits Signal Process. 2022, 1–12. [Google Scholar] [CrossRef]
- Alimisis, V.; Gennis, G.; Dimas, C.; Sotiriadis, P.P. An Analog Bayesian Classifier Implementation, for Thyroid Disease Detection, based on a Low-Power, Current-Mode Gaussian Function Circuit. In Proceedings of the IEEE 2021 International Conference on Microelectronics (ICM), New Cairo City, Egypt, 19–22 December 2021; pp. 153–156. [Google Scholar]
- Zhang, R.; Shibata, T. An analog on-line-learning K-means processor employing fully parallel self-converging circuitry. Analog Integr. Circuits Signal Process. 2013, 75, 267–277. [Google Scholar] [CrossRef]
Publisher’s Note: MDPI stays neutral with regard to jurisdictional claims in published maps and institutional affiliations. |
© 2022 by the authors. Licensee MDPI, Basel, Switzerland. This article is an open access article distributed under the terms and conditions of the Creative Commons Attribution (CC BY) license (https://creativecommons.org/licenses/by/4.0/).