Article

Methodology for the Identification of Dust Accumulation Levels in Photovoltaic Panels Based in Heuristic-Statistical Techniques

by
Eduardo Perez-Anaya
1,
David A. Elvira-Ortiz
1,
Roque A. Osornio-Rios
1 and
Jose A. Antonino-Daviu
2,*
1
HSPdigital–CA Mecatronica, Facultad de Ingenieria, Universidad Autonoma de Queretaro, Campus San Juan del Rio, Rio Moctezuma 249, San Juan del Rio 76807, Mexico
2
Instituto Tecnológico de la Energía, Universitat Politècnica de València (UPV), Camino de Vera s/n, 46022 Valencia, Spain
*
Author to whom correspondence should be addressed.
Electronics 2022, 11(21), 3503; https://doi.org/10.3390/electronics11213503
Submission received: 5 October 2022 / Revised: 25 October 2022 / Accepted: 26 October 2022 / Published: 28 October 2022
(This article belongs to the Special Issue Feature Papers in Industrial Electronics)

Abstract

:
The use of renewable energies is increasing around the world in order to deal with the environmental and economic problems related with conventional generation. In this sense, photovoltaic generation is one of the most promising technologies because of the high availability of sunlight, the easiness of maintenance, and the reduction in the costs of installation and production. However, photovoltaic panels are elements that must be located outside in order to receive the sun radiation and transform it into electricity. Therefore, they are exposed to the weather conditions and many environmental factors that can negatively affect the output delivered by the system. One of the most common issues related to the outside location is the dust accumulation in the surface of the panels. The dust particles obstruct the passage of the sunlight, reducing the efficiency of the generation process and making the system prone to experimental long-term faults. Thus, it is necessary to develop techniques that allow us to assess the level of dust accumulation in the panel surface in order to schedule a proper maintenance and avoid losses associated with the reduction of the delivered power and unexpected faults. In this work, we propose a methodology that uses a machine learning approach to estimate different levels of dust accumulation in photovoltaic panels. The developed method takes the voltage, current, temperature, and sun radiance as inputs to perform a statistical feature extraction that describes the behavior of the photovoltaic system under different dust conditions. In order to retain only the relevant information, a genetic algorithm works along with the principal component analysis technique to perform an optimal feature selection. Next, the linear discrimination analysis is carried out using the optimized dataset to reduce the problem dimensionality, and a multi-layer perceptron neural network is implemented as a classifier for discriminating among three different conditions: clean surface, slight dust accumulation, and severe dust accumulation. The proposed methodology is implemented using real signals from a photovoltaic installation, proving to be effective not only to determine if a dust accumulation condition is present but also when maintenance actions must be performed. Moreover, the results demonstrate that the accuracy of the proposed method is always above 94%.

1. Introduction

Electricity plays a major role in modern society since it is required to satisfy most of the needs of industrial and residential facilities. According with the International Energy Agency (IEA), the global electricity consumption has exceeded the 25,000 TWh since 2019 [1]; only in 2020 did this value present a reduction of the 4% associated with the restrictions imposed by the COVID-19 pandemic. However, in 2021, with all the actions taken by the nations around the world pursuing an economic recovery, the energy demands that year experienced an increment five times larger than the reduction reached during the pandemic [1]. The main problem with these energy needs relies in the fact that the conventional generation processes are still based in the combustion of fossil fuels, resulting in high levels of greenhouse gas emission. In actuality, the energy market is responsible of around the 80% of the global CO 2 emissions [2]. It is well known that the greenhouse effect has caused, among others, an increment in the annual average temperature of the world [3,4]; moreover, the air pollution due to CO 2 has a negative impact on human health, causing respiratory diseases, lung cancer, and depression, among other conditions [5,6]. To deal with all these undesired effects, important actions are being adopted worldwide, such as the Paris Agreement [7] and the Sustainable Development Goals (SDG) [8] established by the United Nations. What is clear is the need of a reduction in the amount of greenhouse gases emissions, and in this sense, the renewable energy sources (RES) become of great importance to reduce the CO 2 emissions associated with energy generation. RES have been experiencing important growth in recent years, and during 2021, 28.3% of the total world electricity consumption came from RES [9]. Among all the RES, solar photovoltaics (PV) is the one with the highest growth in the last two years, reaching a total installed capacity of 942 GW in 2021 [9]. The amount of energy generated using RES is still far from the amount required in order to reach the compromises made in the Paris Agreement and in the SDG; however, this amount is expected to continue growing, and thus the challenges associated with a new electricity generation paradigm must be faced, and the development of new strategies for the condition monitoring, fault detection, and maintenance in RES will become an essential research topic towards a reliable and robust power grid.
Although the RES are useful in the reduction of environmental and human health problems, their use supposes some drawbacks, with the most important being the dependence of weather conditions that makes the generation variable and unstable. To deal with this situation, the use of load-leveling techniques based in energy storage devices is a common and useful solution [10]. Some of the most common energy storage appliances are the compressed-air energy storage [11], the potential hydro storage [12], the use of super capacitors [13], super magnetic storage systems [14], batteries [15], and thermal energy storage systems [16,17]. All these systems consider that there are some periods over the day where the energy production exceeds the energy consumption; thus, the surplus energy can be stored and used later when the energy production is lower than the energy demand. However, to correctly operate, these technologies need to know the behavior of both the energy demand and the energy generation. Moreover, it is important to detect when the variability in the generation process is due to the action of environmental conditions and when it is due to some other external causes. In this sense, the development of methodologies for assessing and detecting abnormal operating conditions in RES is an important issue to be addressed.
Additionally, the PV panels need to be located outdoors, with the dust particles suspended in the environment tending to accumulate in the surface of the PV panel, creating a layer that reduces the amount of sunlight that reaches the cells and diminishes the efficiency of the production process [18]. The deposition of dust and sand on PV panels always appears in outdoors conditions and it can be different from one system to another, depending on factors such as surface area of the panel, tilt angle, and wind speed [19]. It is important to detect and correct this condition in a timely manner since it can cause a reduction of the 15% per month in the amount of energy delivered by a PV system [20]. Several studies have been developed for determining how the dust accumulation affects the generation process in PV systems [21,22,23]. These works conduct a series of experiments wherein different concentrations of dust are placed on the surface of a PV panel with the only purpose of evaluating the reduction of the output power delivered by the PV system. On their part, the authors in [24] demonstrated that the dust accumulation directly affects the efficiency achieved by a PV panel. Moreover, they trained an artificial neural network (ANN) to predict the level of affection in the PV panel efficiency in terms of the size of the dust particles. Similar studies are presented in [25,26], wherein the authors agree with the fact that the type and characteristics of the dust particles (such as size and composition) affect the process of generation in PV systems, and they conclude that a reduction up to 57% in the efficiency of the PV panels can be caused by the effect of the dust accumulation. All these works state the importance of developing methods and strategies that allow for the determination of the moment when the PV panel must be cleaned to avoid loses and to prevent faults related to the poor efficiency developed by the panels. Therefore, some other works go beyond and try to propose a mathematical model for predicting how the delivered power behaves under different dust levels. For instance, in [27], the authors performed an analysis considering six different types of dust, and they placed different concentrations of them on the surface of a PV panel in order to measure the effect of these pollutants in the system output power. The authors concluded that the smallest particles are more harmful for the generation process, and, as expected, an increase in the amount of dust results in higher output power losses. Additionally, they provided six experimental models (one per dust type) that can predict the losses that appear in the system at a certain irradiance and dust concentration. However, to use this model, it is necessary to have a priori knowledge of the type of dust that is covering the panel, and the models do not consider the possibility of a combination of different types of pollutants that is the most common case in real scenarios. A similar study is presented in [28], wherein different concentrations of dust were placed in the surface of a PV panel, and a model for assessing the efficiency of the panel was developed. Here, it was concluded that dust accumulation causes an increment in the temperature of the surface of the PV panel, as well as a reduction of the short circuit current and open circuit voltage. Moreover, it is mentioned that the most detrimental effects appeared at early stages of the dust deposition. All the aforementioned works provide a good explanation of the effects of dust accumulation in the PV generation process, and they allow for modelling of the behavior of the panel under different levels of dust deposited on the panel surface. Additionally, the works that deal with the identification of different dust accumulation levels mention that it is not sufficient to perform the analysis considering only the electrical variables, due to the dependence of the environmental conditions, and that it is necessary to include at least the sun radiance and the environmental temperature to ensure an accurate estimation. Notwithstanding, these works do not provide a tool for automatically detecting the moment where the dust accumulation is critical and needs to be attended to. This situation is left to the consideration of the user.
In order to offer an alternative that automatically detects when dust levels on the PV panel are high enough to require a maintenance action, some works propose considering the dust accumulation a faulty condition of the PV system. Here, the use of statistical analysis and linear regression models [29,30], image processing techniques [31,32], and artificial intelligence approaches such as ANN [33] and fuzzy logic [34] are common solutions. All these works perform a characterization of different types of faults in PV panels, with dust accumulation being one of them. Every methodology performs a classification of the fault, considering as inputs the electric variables of the system (voltage and current) and some environmental parameters such as sun irradiance and environmental temperature. Although these methodologies are good for identifying when the fault condition appears in the system, they do not allow us to obtain information regarding the amount of dust that has been deposited on the panel surface. To overcome this situation, machine learning approaches have turned out to be effective. For instance, in [35], a methodology is introduced that uses a deep residual neural network (DRNN) along with image processing techniques including nonlinear interpolation, equivalent segmentation, and clustering for detecting specific regions in the PV panel where the dust is being accumulated. Additionally, a model is proposed that allows for the determination of the concentration and distribution of the dust on the PV panel. Another useful solution is presented in [36], where the use of regression models and decision trees for the quantification of dust levels in a PV panel is proposed. There, the authors develop a model that allows for the estimation of a quantity between the 0 g/m2 and the 0.9 g/m2 of dust accumulation. These last two works are able to classify and quantify different levels of dust in the surface of a PV panel; however, they do not provide information regarding when maintenance actions must be performed.
At this point, it must be said that for all the aforementioned techniques to be able to work, they require of a series of parameters that characterize every one of the operating conditions that they address. The selection of the best parameters is not a trivial task; therefore, the use of optimization approaches for parameter selection has gained attention. In this regard, the use of bio-inspired and heuristic techniques has been widely explored in order to solve optimization problems. Genetic algorithms (GA) are a very popular solution for optimization problems [37]—they are inspired in the natural selection process explained by Darwin and they use binary chains to represent various potential solutions. The set of potential solutions is called the population, and using the selection, crossover, and mutation operators, the population evolves to its optimal state, that is, the solution. A variant of the GA is the technique known as differential evolution (DE) [38]—this technique also considers the existence of a population that has to evolve to an optimal state, with the encoding and the combination mechanisms being the main differences between GA and DE. Other optimization techniques try to replicate the behavior of certain natural species—for instance, Harris hawks optimization (HHO), which emulates a hawk hunting a rabbit [39]; particle swarm optimization (PSO), which copies the social interaction of certain individuals within a group such as flocks of birds and schools of fish [40]; and the bat algorithm, which mimics the echolocation used by bats to identify the position of nearby objects [41], among others. All these techniques use a group of potential solutions and confine them within a search space; then, using a model that replicates the natural behavior they try to imitate, they generate new potential solutions that are better than the previous ones until the best solution is found at the end of the algorithm. Although all the optimization techniques reported thus far are efficient and reliable, it has been reported that GA is the simplest solution that delivers rapid and accurate results [37], and that is the reason why it was selected to be implemented here.
In this work, we propose the use of a machine learning approach for the identification and classification of dust accumulation in the surface of a PV generation system. The proposed approach uses a statistical feature extraction for the tracking of the different system conditions combined with the linear discriminant analysis (LDA) for the reduction of the dimensionality of the problem and to perform a clustering that allows for the determination of the dust accumulation level on the PV system. The system considers two types of inputs: the electrical (DC voltage and DC current) and the environmental (the amount of solar radiation that reaches the panel and the environmental temperature). In order to increase the reliability of the method, an optimized feature selection based on a genetic algorithm (GA) and principal component analysis (PCA) was implemented for retaining only the features that provide relevant information and discarding the rest. The methodology proposed here considers three dust accumulation levels: clean panel (CLN), moderate accumulation level (MAL), and high accumulation level (HAL). When the MAL condition is detected, the methodology delivers a message indicating that a maintenance action will be required soon, and when the HAL condition is reached, a message is generated indicating that the maintenance action must be performed immediately. The proposed methodology is tested in a low-power isolated PV system, and the results prove that the methodology delivers an accuracy that is always higher than 94%; therefore, it is an effective tool for tasks of maintenance and prevention of losses in PV generation systems. The main contribution of this work consists of the development of a tool for preventive maintenance in PV systems that allows not only for the determination of whether a dust accumulation condition is present but also when cleaning actions must be performed. This way, it is not necessary to see the panels to evaluate if maintenance is required. Moreover, a visual inspection may lead to subjective conclusions, and to perform or not perform the maintenance actions is a decision left for the operator. With the proposed methodology, the results are objective because they are based in the measurement of physical variables, and the operator does not require being an expert in order to decide the action that must be taken because the proposed methodology delivers as an output what must be done.

2. Theoretical Background

This section introduces the concepts required for the implementation of the proposed methodology.

2.1. Statistical Features

A proper feature selection is critical for the correct operation of any classification strategy. Using only a few features may not provide sufficient information and, consequently, the task cannot be correctly performed. On the other hand, a very high number of features will provide redundant information that may result in a confusion of the algorithm, leading to erroneous results in the classification task. Therefore, it is important to find a balance and to use only the information that results in being relevant for the solution of the problem. Moreover, it is important to mention that in order to accomplish accurate and reliable results in a classification task, the selected features must perform a detailed track of the behavior of the system under the different conditions to be evaluated. In this sense, statistical features have proven to be effective for the detection of trends and for the extraction of information that is merged in signals, even in the presence of noise. They can deliver precise and truthful information in a simple way that results in being relevant for the identification of different operation modes in mechanical and electric systems [42,43]. This feature extraction task can be performed in different domains (time, frequency, time–frequency, etc.); however, the intention of this work was to maintain the implementation as simple as possible in order to be computationally efficient and easy to implement on any digital system. In this sense, for this work, the statistical feature extraction was carried out only in the time domain using the 15 features summarized in Table 1.
The parameters in Table 1 are described as follows: x is the signal under test; n represents the number of samples considered for the calculation of the feature; x k is the k -th sample of the signal under analysis with k = 1 ,   2 ,   3 ,   , n ; and E [   ] represents the expected value or expectation operator.

2.2. Principal Component Analysis (PCA)

PCA is an unsupervised technique whose purpose is reducing the dimensionality of a complex dataset. To accomplish this task, PCA re-defines the original dataset to extract the relevant information, eliminating or at least reducing the redundancy and minimizing the noise. This technique groups the data in a matrix X of dimension m × n , where m represents the different features extracted for a single sample of the dataset and n addresses each sample of the dataset. Then, the covariance of the data is calculated using (16):
S x = X X T
where S x is the covariance matrix. The matrix S x is used to obtain the eigenvalues and eigenvectors to choose the eigenvector with the highest eigenvalues. This way, an orthogonal representation of the original data is obtained, preserving the information of the data dispersion but with a smaller dimensionality. These characteristics make PCA an adequate tool for the proper selection of the relevant features for describing the behavior of a particular system. It must be mentioned that PCA does not maintain the information regarding the existence of different classes; therefore, this technique is usually complimented with another one when a classification task must be performed.

2.3. Linear Discriminant Analysis (LDA)

LDA is a supervised classification method for qualitative variables in which two or more groups are known a priori and new observations are classified into one of them on the basis of their characteristics. As with PCA, the LDA technique allows for the performance of a reduction of the dimensionality of any dataset with the difference that LDA is capable of retaining the information that allows for discrimination among different classes. The main purpose of the LDA consists of maximizing the linear separation among all the classes addressed in a particular problem. This technique considers an original data matrix X with d × n dimensions, as shown in (17)
X = [ x 1 ,   x 2 , , x n ]   R d × n
where x i R d . The intention of the technique is to reduce the high dimensionality using a transformation matrix W   R d × m that will map the elements of the original data in a reduced dimension dataset expressed as shown in (18):
Y = [ y 1 ,   y 2 , , y n ]   R m × n
where it is intended that m d . Thus, the objective function of the LDA technique is presented in (19):
m i n W T S t W = I   T r ( W T S w W )
where I is the identity matrix, T r ( ) is the trace of the matrix, S t is the total covariance matrix that considers the total number of classes, and S w is the autocovariance matrix calculated separately for each class. S t and S w are calculated using Equations (20) and (21), respectively:
S t = j = 1 n ( x j x ¯ ) ( x j x ¯ ) T
S w = i = 1 c j = 1 n i ( x j i x ¯ i ) ( x j i x ¯ i ) T
where n i is the n -th sample of the i -th class, x j i is the j -th sample within the i -th class, x ¯ i is the mean of the i -th class, and x ¯ is the mean of all the data.

2.4. Genetic Algorithms

A GA is a heuristic technique inspired by the mechanics of natural selection looking to evolve an initial population towards to better regions of the search space. Figure 1 shows a flow chart with the process followed for the implementation of a GA.
As can be seen in Figure 1, a GA is implemented considering the following steps:
Step 1: The algorithm always requires of an initial population. Such a population is randomly generated in order to ensure that the individuals are spread within the entire search space.
Step 2: After generating a population, a fitness assessment is performed to determine if any individuals of the population are prone to be the solution of the optimization problem. This assessment is carried out by means of a fitness function f_c that defines a fitness value for each individual in the population.
Step 3: The fitness value found in step 2 is used to perform a hierarchical selection where the individuals are sorted in descending order, so the first element in the resultant array is the individual that shows the best performance in the iteration.
Step 4: Once the hierarchical selection is performed, it must be evaluated as to whether a stop condition is reached. The main stop condition for a GA is met when the algorithm finds a set of parameters that minimize or maximize a fitness function. Otherwise, a maximum number of iterations must be defined, and the GA will continue iterating until the maximum number of iterations is reached. If one of the stop conditions is met, the GA finishes and delivers the best fitted individual of the population as result. The population needs to evolve in order to obtain better potential solutions. In this case the GA goes to step 5.
Step 5: The evolution of the population is carried out through the application of two genetic operations: the crossover and the mutation. Crossover operation is performed to combine the information of two elements within the search space in order to obtain a new value that presents a better fitness value. Since the existence of local minima or maxima is a possibility, the algorithm sometimes may present a stagnation in these values. To avoid this situation and reach the global minimum or maximum, the mutation operation introduces an aleatory variation in the data according to a probability value. Once the new population has been generated, the algorithm continues in step 2, and the process is repeated until one of the stop conditions is achieved. Here, it must be mentioned that the objective of optimization is different from one problem to another. In this work, GA is used with the purpose of finding the set of statistical features that maximizes the data variance when the PCA technique is applied. Therefore, the GA generates different combinations of statistical features and evaluates each one to determine how they affect the variance of the data. Then, the GA continues working until the combination that delivers the maximum data variance in the PCA is found, or until a maximum number of iterations is reached and the solution for the optimization problem is the best set of statistical features.

3. Methodology

The proposed method for the classification of dust accumulation in PV systems was carried out, considering different stages. Figure 2 shows a step-by-step diagram of the process. As can be seen, a total of 5 stages were required to identify the level of dust deposited in the surface of the panel: generation of the dataset, statistical feature extraction, optimized feature selection, dimensionality reduction, and estimation of the dust level.

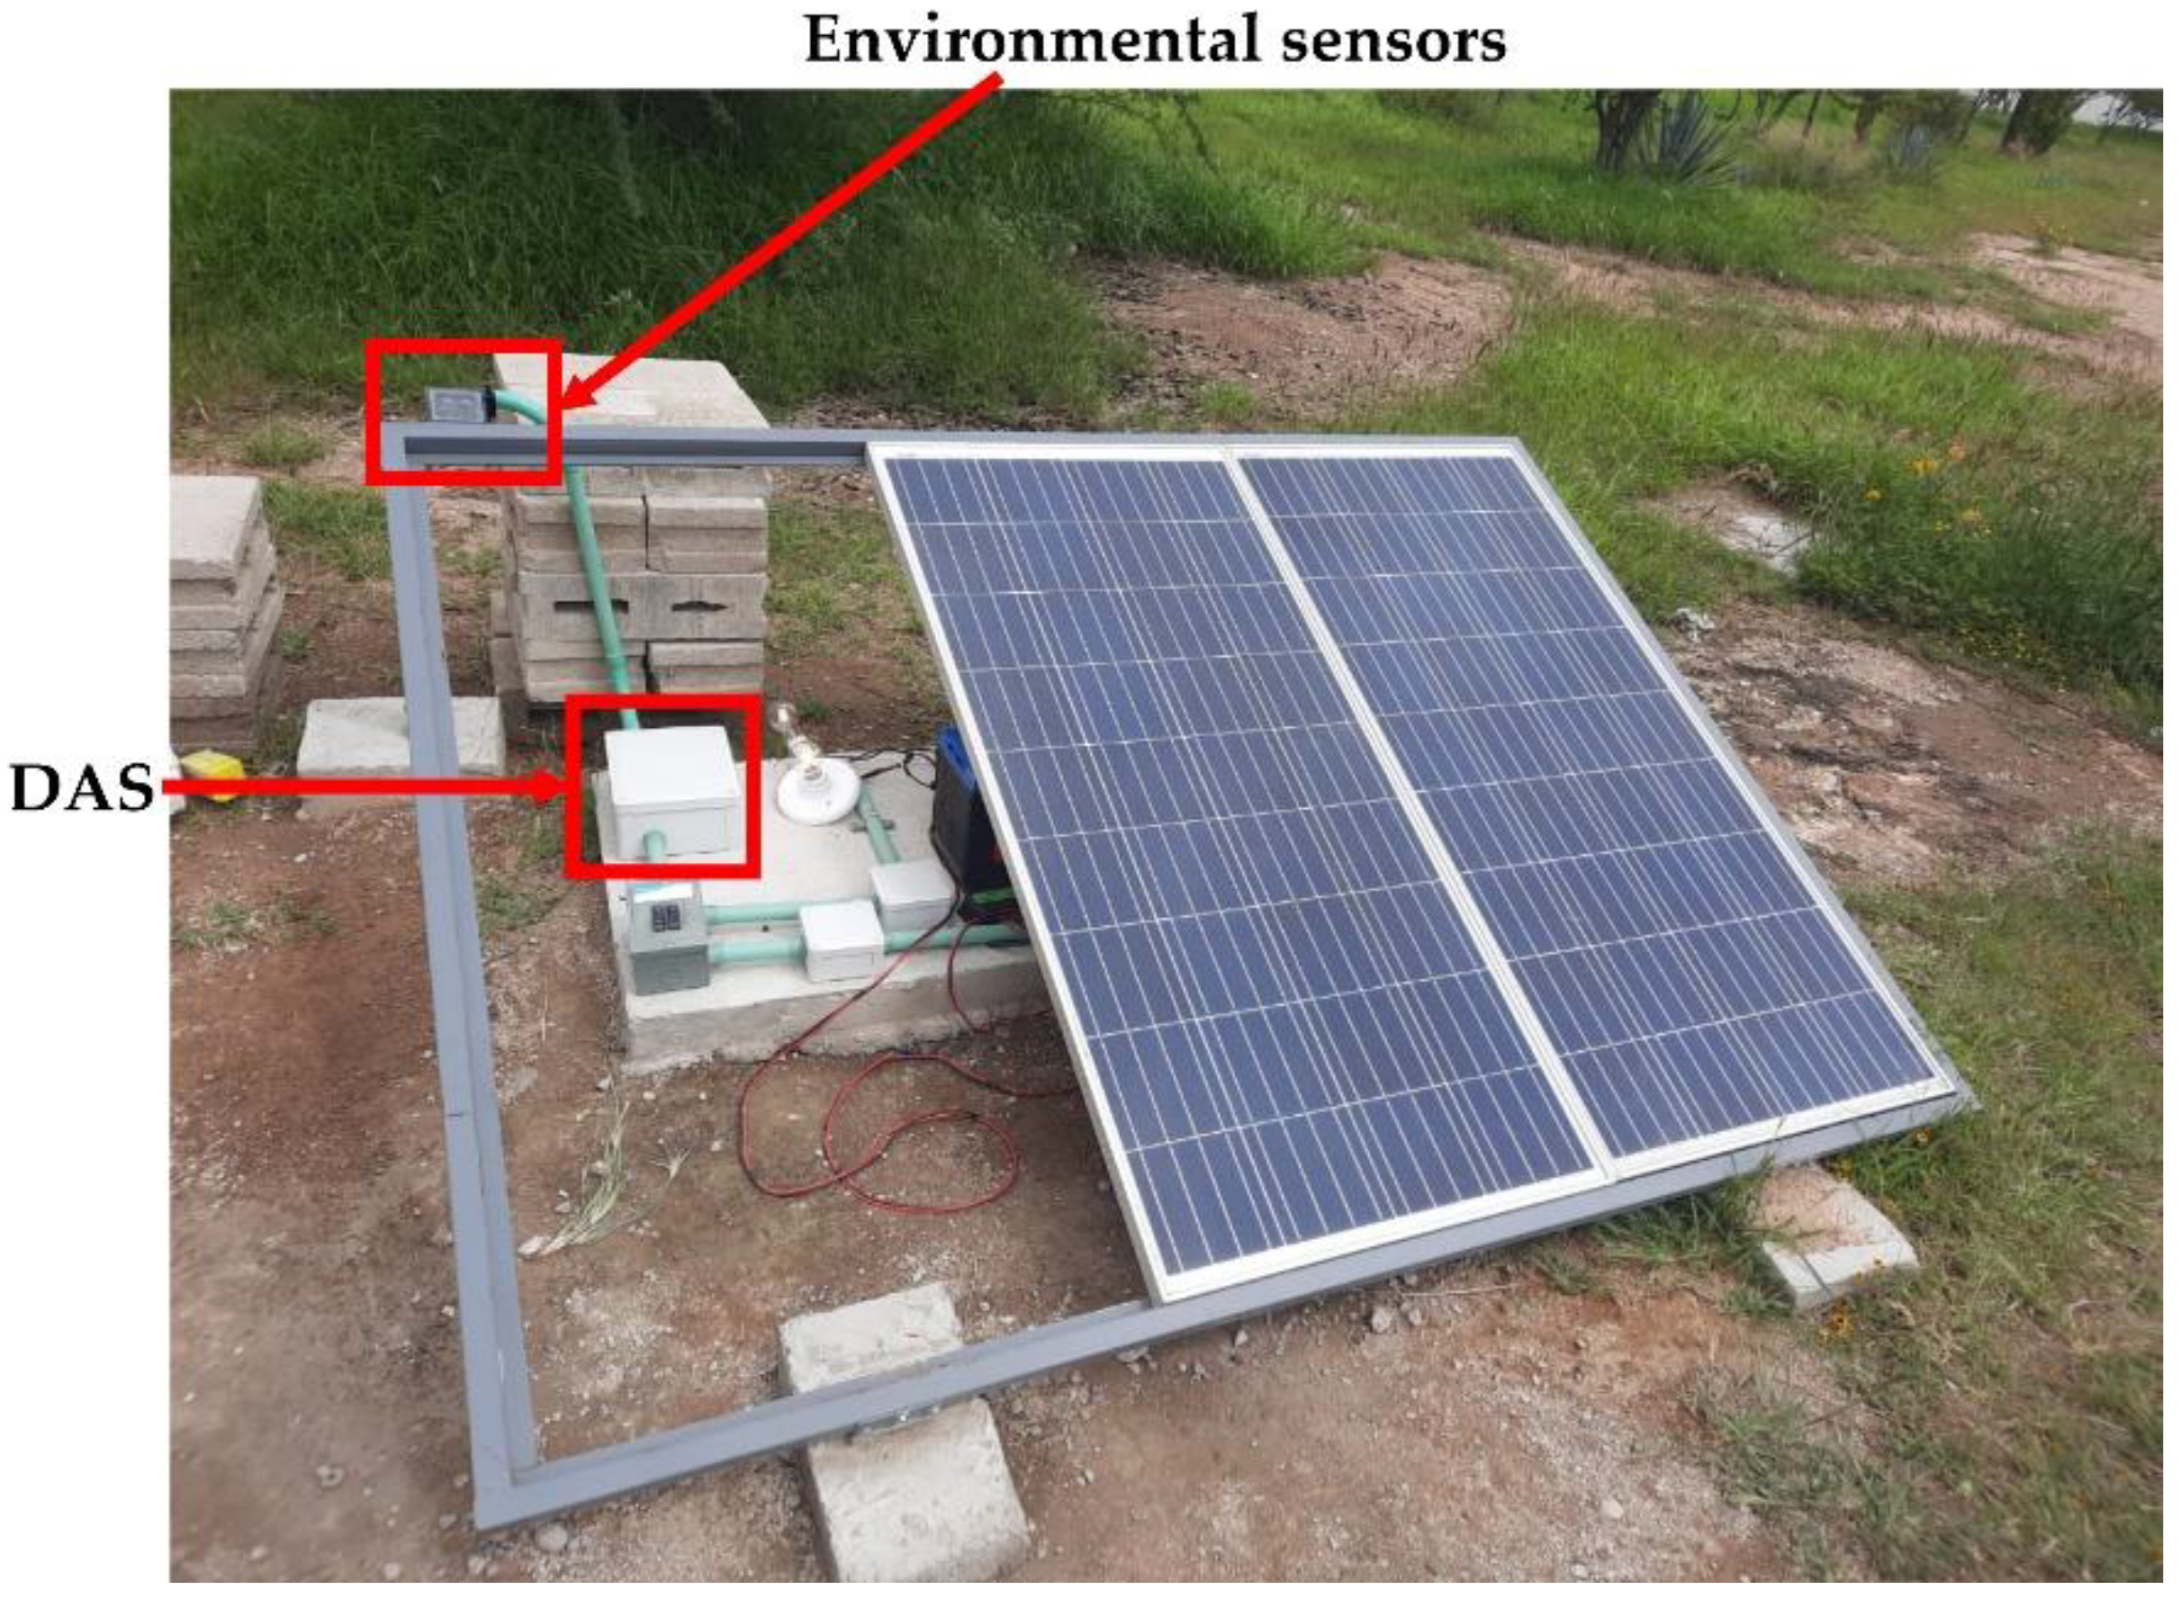
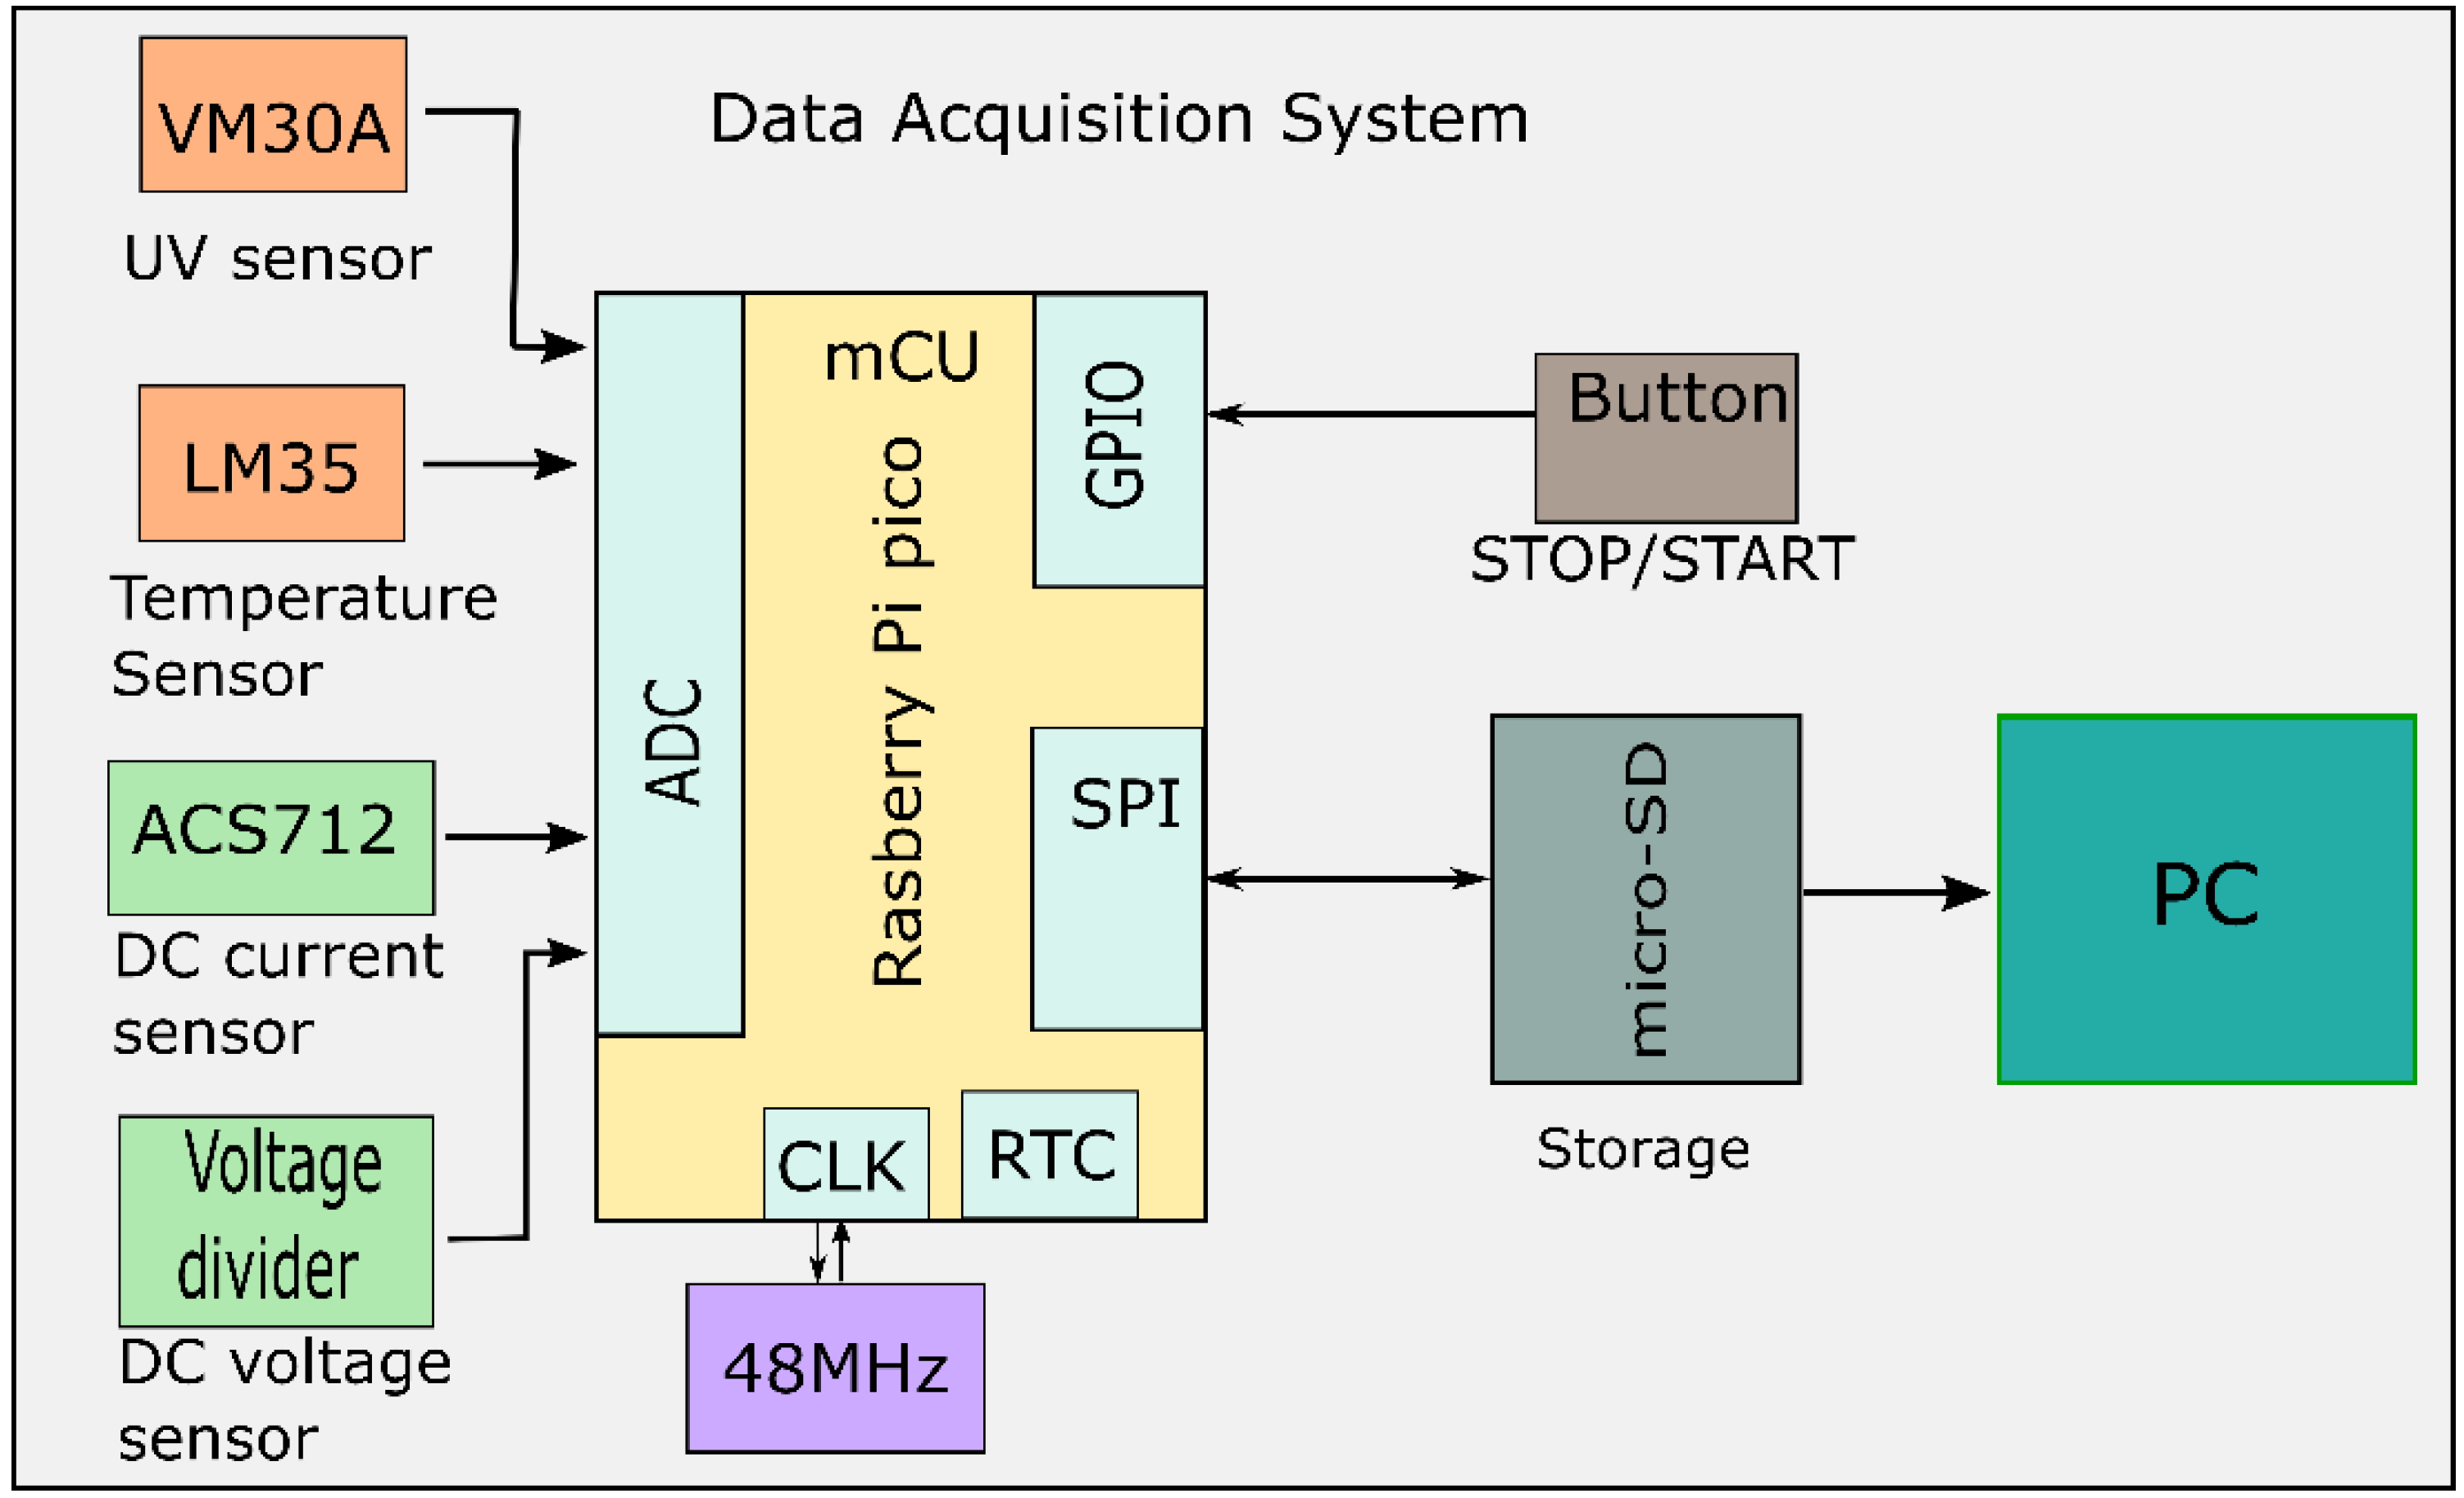
3.1. Data Acquisition

To perform the task of identifying the dust accumulation levels, the proposed methodology requires a set of inputs that must be collected. This particular work considers the acquisition and use of for different physical variables: the electrical variables (DC voltage and DC current) and the environmental variables (sun radiance and environmental temperature). All of these variables are essential to obtain accurate and reliable results. In this regard, the most important variables turned out to be the electrical signals delivered by the PV panel because it has been demonstrated in the revised literature that a dust layer in the surface of the PV panel directly affects the amount of generated power. Notwithstanding, using only electrical variables may not be sufficient for properly dealing with the dust accumulation problem. It is important to mention that dust deposition in the surface of the PV panel causes the same effect as the presence of clouds. Thus, in order to avoid false predictions associated with cloudy days, the sunlight that reaches the PV panel is also acquired and considered in the next stages of the process. Furthermore, it is known that temperature is another environmental factor that affects the amount of power that can be generated by a PV system, thus providing more robustness to the classification process, and therefore the environmental temperature is also considered in this study.

3.2. Statistical Feature Extraction

Before performing the feature extraction, all the signals acquired in the previous stage are pre-processed with an amplitude normalization. This task is carried out using (22):
N s i g = x x ¯ σ
where N s i g is the normalized signal.
As previously mentioned, the statistical features are responsible for detecting specific trends that allow for the distinguishing from one operating condition to another. Therefore, a set of features is obtained by processing each one of the signals acquired in the previous stage and that have been already normalized. At this stage, the 15 statistical features shown in Table 1 are separately computed for the DC voltage, the DC current, the sun radiance, and the environmental temperature. As result, a feature set of dimensionality d = 60 is obtained. This is a considerable number of features, and there is no guarantee that all of them provide relevant information of the dust level on the surface of the PV panel. Hence, the whole set of features is taken to the next stage in order to select only those features that are important for describing each operating condition.

3.3. Optimized Feature Selection

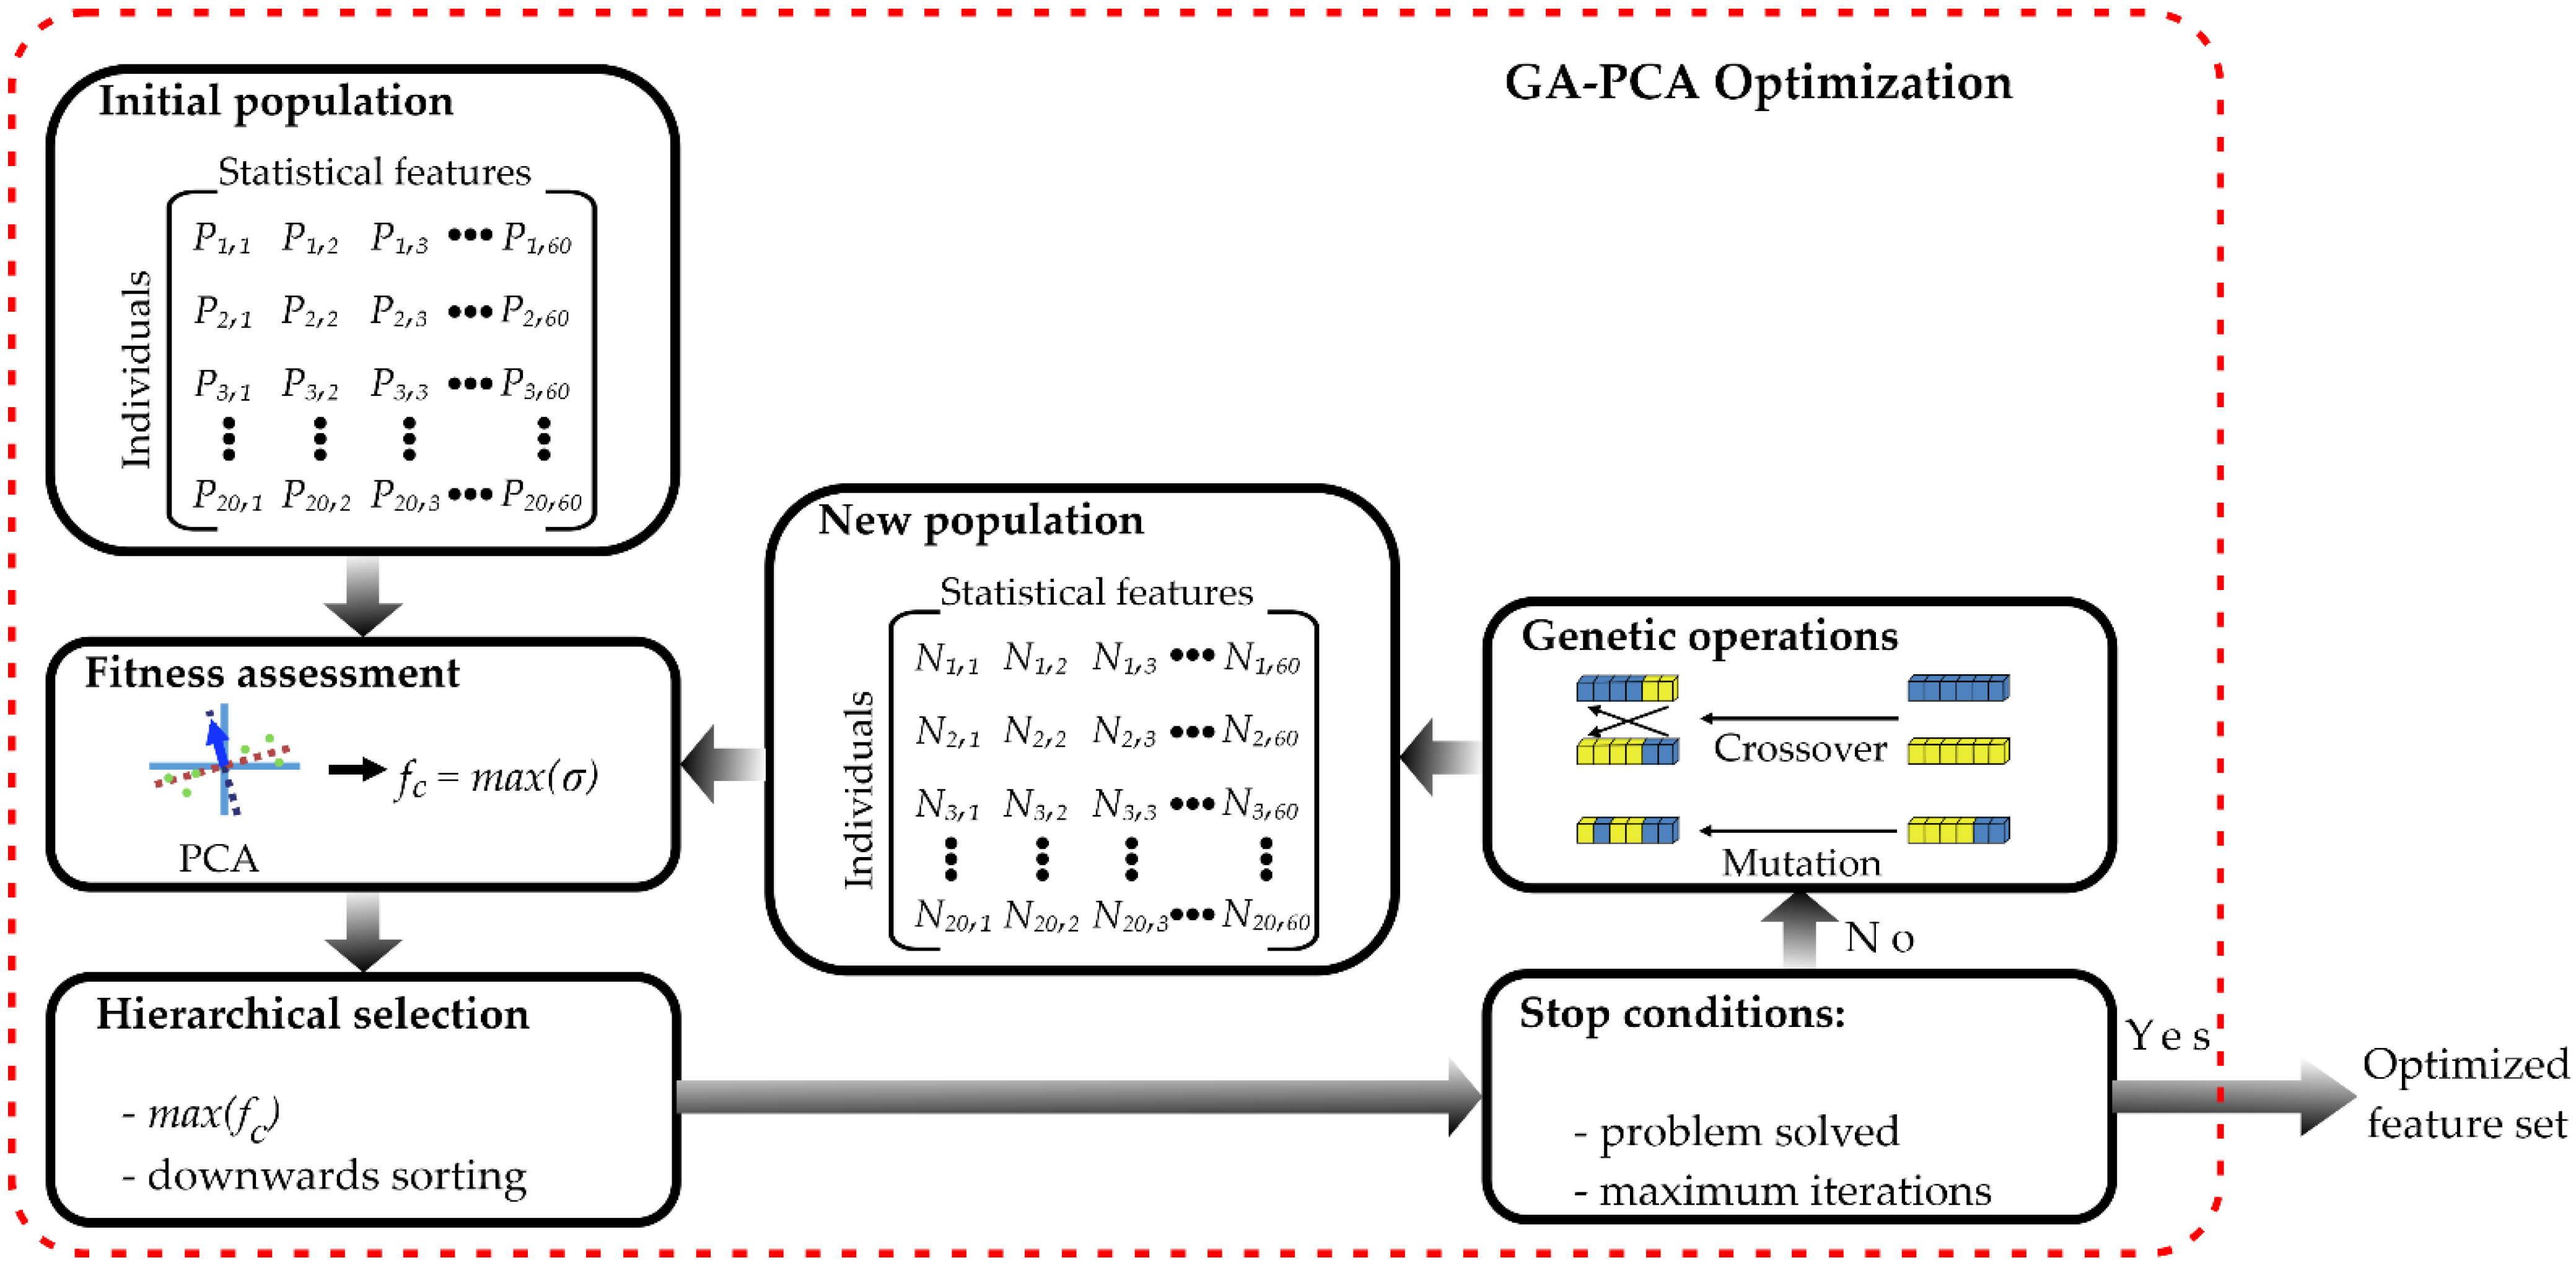
The proper selection of the features that describe the behavior of the system is essential in order to obtain accurate and reliable results. Then, this stage plays a major role towards obtaining a correct classification of the dust accumulation levels. To be able to determine whether a feature is important or not, a combined GA-PCA methodology is implemented. The GA is in charge of selecting different feature combinations that will be sent to the PCA in order to evaluate which set of features is the one that maximizes the data dispersion. Figure 3 depicts the block diagram of the process that is implemented for the optimized feature selection through the GA-PCA methodology.
First, an initial population must be generated. At the setting up of the initial population, a total of 20 individuals are created, and it is considered that every individual is composed of a total of 60 chromosomes, wherein each chromosome corresponds to every one of the statistical features calculated in the previous stage. Thus, the initial population forms a 20 × 60 matrix, where each row is an individual and each row contains a different statistical feature: 15 features per each one of the four input variables. Every individual of the population is represented as P q , r , where q = 1 ,   2 ,   3 , ,   20 is the number of the individual, and r = 1 ,   2 ,   3 , ,   60 states the statistical feature. A chromosome can take only the value of 1 or 0, with 1 representing the fact that the corresponding feature must be taken into account in the next stage and 0 representing the fact that the feature is not used in the following stage. The first generation is randomly generated with the only restriction that at least one chromosome must have the value of 1.
Next, every one of the individuals in the population must be evaluated to determine if it provides a solution to the optimization problem. In this work, this fitness assessment was performed using the PCA technique. This technique has the purpose of reducing the dimensionality of the dataset, preserving the data dispersion as much as possible; therefore, the GA is searching the feature combination that maximizes the cumulative data variance delivered by the PCA and it can be described by (23):
f c = max ( σ )
where f c is the objective function or fitness function. To obtain the data variance, here, the value delivered by the two and the three first principal components is considered.
Continuing with the process, a hierarchical selection is performed. At this step, the values of the data variance achieved by each individual are sorted in descending order, and thus the first element of the array represents the best individual of the generation.
Once the population has been sorted, it must be verified if one of the stop conditions is reached. In this particular case, there are possibilities that will lead the GA to its end. The first one is achieved if the optimization problem is solved, i.e., if the GA finds the combination of features that delivers the highest maximization of the data variance. If this condition is not reached, there is another criterion that can finalize the GA, that is, reaching a maximum number of iterations. If any of these conditions are met, the GA delivers the best individual of the population as the optimized feature set.
If none of the stop criteria are met, a new population is created using the genetic operations of crossover and mutation. This work used the common single-point crossover operator and the roulette wheel selection for generating the new population. For this purpose, it is necessary to take two individuals in the population. Since the population has been previously ordered following an elitist selection, the most suitable individual is always selected as one of the two required in the crossover. The rest of the individuals in the population are then taken one by one to be combined with the best individual of the population. Once the two individuals are selected, they are cut at a randomly selected location called the pivot point. The genetic information to the left of these two individuals is swapped between them in order to obtain two new individuals known as children. Since each combination leads to two different children, the crossover of the original 20 individuals results in a new 40-individual population. This point is where the roulette wheel selection acts. This selection method uses (24) in order to work:
F i t q = f c ( P q ) I = 1 N f c ( P I )
where F i t q is fitness value for the q -th individual and N = 1 ,   2 ,   3 , ,   40 . After applying (24), the individuals are sorted from the highest to the lowest, and only the first 20 are selected to be part of the new population.
Additionally, and to prevent stagnation at a local maximum, the mutation operation is applied, considering a probability of mutation of 30%. The mutation operator is only applied if the probability of mutation is achieved; in this case, a single chromosome of the individual is randomly selected and its value is changed: a 1 is changed by a 0, and vice versa. Each one of the individuals of the new population is addressed as N q , r , where q and r continue having the same meaning described for the initial population. When the new population has been created, the process must be repeated from fitness assessment until one of the stop conditions is reached.

3.4. Dimensionality Reduction

At the end of the optimized feature selection stage, only the statistical features that are relevant for the description of each system condition remain, with the redundant information being previously discarded, reducing the dimensionality of the problem. Notwithstanding, the problem dimensionality still may be relatively high, making it necessary to perform an additional reduction prior to the classification of the dust levels. This task is conducted by the LDA technique. LDA is selected because, in addition to performing the dimensionality reduction, it allows for the maximization of the separation among classes, a situation that allows for the classification stage to be implemented in a simple and effective way. Moreover, LDA delivers a 2D projection with a combination of different weights of the optimized feature set. This 2D projection can be used to obtain a visual representation of the location of every considered condition in order to evaluate whether the separation among classes was effective. Such a 2D representation is possible because, at the end, only two features are selected by the LDA technique. It must be said that in this work, the final dimensionality of the set is selected as being two, and that is why the LDA delivers only two features that represent the coefficients of the linear transformations that are achieved when the LDA is applied. These two features will be the input data for the last stage that is the classifier for the estimation of the dust level.

3.5. Estimation of the Dust Level

All the previous stages are implemented with the purpose of facilitating the estimation of the dust level that is accumulated in the surface of a PV panel. To perform this last task, a classifier that uses a simple perceptron ANN composed of three layers is implemented. A backpropagation strategy is implemented for the training process and the sigmoid function is used as activation function for each neuron. Since the LDA technique delivers two features in the previous stage, the input layer of the classifier contains only two neurons. In the hidden layer, a total of 10 neurons are considered, whereas for the output layer, a neuron for each one of the operating conditions is designed in order to be evaluated that in this work turned out to be three in number: a clean panel (CLN), a moderate accumulation level (MAL), and a high accumulation level (HAL).

4. Experimental Setup

4.1. Photovoltaic System

All the experimentation was performed in a low power isolated PV system. The PV system under test was composed of three PV panels of 150 Wp connected in parallel to accomplish a total power of 450 Wp. The complete information of the PV panels is summarized in Table 2.
Figure 4 shows the PV system where the experimentation was held. The PV panels were south-facing, and they presented a tilt angle of β = 23 ° . Every panel was connected to a battery charge regulator that adjusted the voltage of the system at a value of 12 V. The charge regulators were connected to a battery bank of 200 Ah, and the batteries were connected to a 1500 W pure sine wave inverter. Three incandescent lamp bulbs of 100 W each were used as load. It was observed that one of the PV panels was removed to illustrate the location of the data acquisition system (DAS). A detailed explanation of the DAS and its main characteristics is presented in Section 4.2. The voltage and current sensors were located in the same box that enclosed the DAS, whereas the temperature and sun radiation sensors were placed in the top-left corner of the supporting structure, and they can be seen in Figure 4. To perform the voltage measurement, a resistive voltage divider with a 3/20 gain factor was implemented, and in the case of the current measurement, the ACS712 sensor was used. The environmental variables were measured using an LM35 sensor for the environmental temperature and an ultraviolet UVM-30A sensor for the case of the sun radiation. The technical specifications of the sensors used for the experimentation are summarized in Table 3.

4.2. Data Acquisition System

As it has been previously stated, all the physical variables involved in the experimentation must be collected and stored in order to be processed. Therefore, a microcontroller- based DAS was developed for this purpose. In terms of the DAS, Figure 5 presents a general diagram of the elements that compounded this system. A Raspberry Pi pico microcontroller (mCU) was designated as the central processing unit. This mCU was selected because it includes a 48 MHz quartz oscillator and a 5-channel 12-bit analog to digital converter (ADC). The mCU acquires the signals from the four sensors at a sampling frequency of 100 Hz. This frequency was selected in order to avoid having a huge amount of data, and it was sufficient since all the electrical variables were measured only in the DC side of the system, with the environmental variables not showing any rapid fluctuation. All the data were collected in an 8 Gb micro-SD memory. The data were extracted from the memory latter to be processed in a personal computer (PC) outline.

4.3. Dust Accumulation Severities

The different operating conditions required for the experimentation must be carefully generated in order to guarantee the validity of the results. First of all, it must be mentioned that this work aimed to assess the behavior of the PV system considering the real conditions from its location. Therefore, the dust particles were directly taken from the soil where the system was located. In this sense, the soil of the region was a mixture of phaeozems and vertosols with high concentrations of clay and silt [44]. These types of soils were characterized for being conformed for large particles for which size can vary between 410 and 2400 nm [45]. Notwithstanding, the proposed methodology is able to work in any PV system, regardless of the soil composition. For assessing the CLN condition, the PV panels were cleaned using a damp cloth. To generate the different dust accumulation levels, first a sample of dust from the soil in the vicinity of the PV was taken and weighted using a digital scale (see Figure 6a). The scale was calibrated to measure 0g, wherein the yellow container shown in Figure 6a was on it. Then, the dust was deposited on the surface of the PV panel, as depicted in Figure 6b. Finally, the dust was uniformly spread all over the surface area of the panel (see Figure 6c).
To generate the MAL condition in the PV panels, 4 g of dust was spread on the 1 m2 surface of the PV panel, whereas the HAL condition was reached with a layer 8 g/m2. These values were selected because the authors in [36] established that the worst efficiency in the PV panels occurs when the dust layer is 10 g/m2; therefore, we proposed the cleaning of the panel before reaching this value in order to avoid severe damages or losses in the system. The experiments were carried out for 10 days from 11:00 to 15:00 h. The tests were conducted in lapses of 10 min, followed by 1 min of inactivity. A total of 240 tests were carried out (80 for each one of the studied conditions). Every 10 min test was divided into 208 windows, and the statistical feature estimation was performed for each one of these windows.

5. Results and Discussion

The proposed methodology was implemented in order to perform the detection of the different dust accumulation levels in the PV system. The process starts with the selection of the features that provide relevant information for the description of each condition using the GA-PCA methodology. Table 4 summarizes the statistical features that were encountered as being relevant by the GA-PCA method. Each statistical feature was represented by a number that coincides with its index introduced in Table 1. It was observed that the most important features were kurtosis and crest factor because they were considered in the for signals under test. The less relevant features turned out to be the mean, the variance, and the SRM shape factor since they were considered in only one of the signals under analysis. Thus, from Table 4, it can be inferred that from the 60 original features, only 37 were considered to be relevant for the description of the dust accumulation levels in the PV panels. These 37 features were those that maximized the variance of the dataset under analysis, and they were taken to be used with the LDA technique in order to perform the dimensionality reduction.
Figure 7a depicts the 2D projection achieved by the LDA technique when the reduction of the dimensionality was performed using the optimized feature set. It was easy to identify the existence of three different clusters at first sight (one for each one of the studied conditions). A slight overlap was present between the clean panel condition (CLN) and the moderate dust accumulation level (MAL). On the other hand, the high dust accumulation level was completely separated from the two other conditions. This was an advantage since it meant that it would be easier for the classifier to correctly identify and categorize the dust accumulation levels. Hence, the two features delivered by the LDA with the optimized feature set were used as inputs of the ANN-based classifier. Table 5 shows the confusion matrix for the classification of the dust levels using the whole methodology proposed in this work. It was observed that the classifier produced a few mistakes in distinguishing between the clean panel condition and the moderate dust accumulation. This was a more or less expected situation based on the clustering shown in Figure 7a, where an overlap between the data of these two conditions was observed. This overlap was caused because the MAL condition was not harmful enough to represent significant power losses in the PV system. However, only 96.5% of the CLN cases were correctly classified, whereas the remaining 3.5% was misclassified as the MAL condition. In terms of the MAL condition, only 94.1% of the tests were properly identified, and the missing 5.9% was erroneously identified as the CLN condition. It is worth noticing that the errors in the classification occurred between two classes that did not require fast attention so it will not represent any risk for the system users. Finally, it must be noticed that for the HAL condition, 100% of the tests were correctly classified. This was an important advantage because the worst condition, the one that needs to be attended to immediately, is always correctly identified, allowing actions to be taken at the correct moment in order to avoid damages and severe power losses in the PV system. To show the importance of performing an optimized feature selection, Figure 7b shows the 2D projection obtained by the LDA technique when the complete set of 60 statistical features was used. It can be appreciated that there were three different groups in the representation; however, all of them appeared overlapped among each other over the same straight line. The overlap among the different operating conditions was the result of the redundant information because there were features that present the similar behaviors for all the conditions, making it hard to distinguish which one is occurring. From Figure 7b, it can be inferred that the high overlap among the different conditions would result in misclassifications that would compromise the accuracy of the results.
Finally, the proposed methodology tries to avoid ambiguity in the decision of performing cleaning tasks or not. Therefore, it delivers a message to the operators depending on the condition that is detected in the PV system. When the CLN condition is detected, the message delivered indicates that there is no need to perform any action at the moment (see Figure 8a). When the described method finds a MAL condition, the message that is received by the operator is that maintenance will be required soon (see Figure 8b)—this way it is possible to schedule the maintenance task when it is more convenient for the users. If a HAL condition is detected, it is informed that the maintenance task should be performed immediately in order to avoid severe losses or damages in the PV system (see Figure 8c). Thus, the proposed methodology is helpful in the planning of maintenance tasks since it avoids the need of performing a visual evaluation of the systems and notes that cleaning actions are only required when the dust accumulation is high enough to cause significant power losses that compromise the integrity of the system.

6. Conclusions

Renewable energies shed a light towards meeting the energy needs of humanity with a reduction of the CO 2 and other greenhouse gas emissions. Solar photovoltaics is the renewable energy with the largest amount of growth in the last few years. However, this type of generation is weather dependent and, as PV panels are located outside, they are prone to being affected by the environmental conditions. Dust accumulation is a real problem in PV systems that may lead to severe power losses and to unchain more severe faults due to the increasing of the temperature in the surface of the PV panel. The development of methodologies for the timely detection of different dust accumulation levels results in a significance in terms of providing robustness and reliability to the PV generation systems. This work proposes a methodology that combines statistical analysis and heuristic algorithms for the identification of different dust levels in PV panels. It is demonstrated that the selection of the features to be used is not a trivial task, since a bad feature selection may highly reduce the accuracy of the classification method. The here-implemented GA-PCA methodology for the optimal feature selection has been proven to be effective for eliminating the redundant information of the dataset under test. Moreover, the combination of the optimized feature selection with a dimensionality reduction technique such as LDA facilitates the classification of the different dust levels, even when a simple ANN-based classifier is used. The proposed method aims to be a helpful tool in the development of strategies for the condition monitoring and maintenance of PV systems. It is worth noticing that the proposed methodology is able to correctly classify 100% of the cases of HAL. This is an advantage because it is the most critical condition and the one that requires immediate attention. The proposed method misclassifies some of the cases, but these cases always fall in the CLN and MAL conditions; therefore, they are not serious mistakes since both actions imply that the system can continue operating without problems. Furthermore, the percentage of error in these two conditions is very low since the highest rate of error is 5.9%. Finally, in future research, it is expected that more severities will be added into the dust accumulation levels and also that the use of additional environmental parameters such as wind speed and relative humidity that are also related with the dust accumulation problem will be considered. Moreover, the proposed methodology is expected to work along with a modeling technique that allows for the obtaining of a mathematical expression that could deliver quantitative information instead of only qualitative data, becoming the proposed methodology more useful in the task of grid control and maintenance.

Author Contributions

Conceptualization, D.A.E.-O. and R.A.O.-R.; methodology, E.P.-A., D.A.E.-O. and J.A.A.-D.; validation, E.P.-A. and D.A.E.-O.; formal analysis, D.A.E.-O. and R.A.O.-R.; investigation, E.P.-A. and R.A.O.-R.; resources, J.A.A.-D.; data curation, D.A.E.-O. and E.P.-A.; writing—original draft preparation, E.P.-A. and D.A.E.-O.; writing—review and editing, R.A.O.-R. and J.A.A.-D.; visualization, E.P.-A. and D.A.E.-O.; supervision, R.A.O.-R. and J.A.A.-D.; project administration, R.A.O.-R. and J.A.A.-D.; funding acquisition, J.A.A.-D. All authors have read and agreed to the published version of the manuscript.

Funding

This work was supported in part by the CONACYT scholarship under grant 1078505 and by FONDEC-UAQ 2020 FIN202011 project.

Data Availability Statement

Data available on request.

Conflicts of Interest

The authors declare no conflict of interest.

References

  1. Global Energy Review 2021—Analysis. Available online: https://www.iea.org/reports/global-energy-review-2021 (accessed on 25 September 2022).
  2. Pablo-Romero, M.P.; Sánchez-Braza, A.; González-Jara, D. Economic Growth and Global Warming Effects on Electricity Consumption in Spain: A Sectoral Study. Environ. Sci. Pollut. Res. 2022, 442, 1–17. [Google Scholar] [CrossRef] [PubMed]
  3. Mikhaylov, A.; Moiseev, N.; Aleshin, K.; Burkhardt, T. Global Climate Change and Greenhouse Effect. Entrep. Sustain. Issues 2020, 7, 2897–2913. [Google Scholar] [CrossRef]
  4. Al-Ghussain, L. Global Warming: Review on Driving Forces and Mitigation. Environ. Prog. Sustain. Energy 2019, 38, 13–21. [Google Scholar] [CrossRef] [Green Version]
  5. Sivarethinamohan, R.; Sujatha, S.; Priya, S.; Sankaran; Gafoor, A.; Rahman, Z. Impact of Air Pollution in Health and Socio-Economic Aspects: Review on Future Approach. Mater. Today Proc. 2021, 37, 2725–2729. [Google Scholar] [CrossRef]
  6. Khan, M.T.I.; Yaseen, M.R.; Ali, Q. Nexus between Financial Development, Tourism, Renewable Energy, and Greenhouse Gas Emission in High-Income Countries: A Continent-Wise Analysis. Energy Econ. 2019, 83, 293–310. [Google Scholar] [CrossRef]
  7. Nations, U. The Paris Agreement. Available online: https://www.un.org/en/climatechange/paris-agreement (accessed on 25 September 2022).
  8. United, N. Sustainable Development Goals. Available online: https://www.un.org/sustainabledevelopment/ (accessed on 6 June 2022).
  9. REN21, P.R.S. Renewables 2022 Global Status Report; REN21 Secretariat: Paris, France, 2022; ISBN 978-3-948393-04-5. [Google Scholar]
  10. Afsharpanah, F.; Pakzad, K.; Mousavi Ajarostaghi, S.S.; Arıcı, M. Assessment of the Charging Performance in a Cold Thermal Energy Storage Container with Two Rows of Serpentine Tubes and Extended Surfaces. J. Energy Storage 2022, 51, 104464. [Google Scholar] [CrossRef]
  11. Sadeghi, S.; Askari, I.B. Prefeasibility Techno-Economic Assessment of a Hybrid Power Plant with Photovoltaic, Fuel Cell and Compressed Air Energy Storage (CAES). Energy 2019, 168, 409–424. [Google Scholar] [CrossRef]
  12. Farfan, J.; Breyer, C. Combining Floating Solar Photovoltaic Power Plants and Hydropower Reservoirs: A Virtual Battery of Great Global Potential. Energy Procedia 2018, 155, 403–411. [Google Scholar] [CrossRef]
  13. Cabrane, Z.; Kim, J.; Yoo, K.; Ouassaid, M. HESS-Based Photovoltaic/Batteries/Supercapacitors: Energy Management Strategy and DC Bus Voltage Stabilization. Sol. Energy 2021, 216, 551–563. [Google Scholar] [CrossRef]
  14. Boudia, A.; Messalti, S.; Harrag, A.; Boukhnifer, M. New Hybrid Photovoltaic System Connected to Superconducting Magnetic Energy Storage Controlled by PID-Fuzzy Controller. Energy Convers. Manag. 2021, 244, 114435. [Google Scholar] [CrossRef]
  15. Khezri, R.; Mahmoudi, A.; Aki, H. Optimal Planning of Solar Photovoltaic and Battery Storage Systems for Grid-Connected Residential Sector: Review, Challenges and New Perspectives. Renew. Sustain. Energy Rev. 2022, 153, 111763. [Google Scholar] [CrossRef]
  16. Afsharpanah, F.; Izadi, M.; Hamedani, F.A.; Mousavi Ajarostaghi, S.S.; Yaïci, W. Solidification of Nano-Enhanced PCM-Porous Composites in a Cylindrical Cold Thermal Energy Storage Enclosure. Case Stud. Therm. Eng. 2022, 39, 102421. [Google Scholar] [CrossRef]
  17. Afsharpanah, F.; Mousavi Ajarostaghi, S.S.; Arıcı, M. Parametric Study of Phase Change Time Reduction in a Shell-and-Tube Ice Storage System with Anchor-Type Fin Design. Int. Commun. Heat Mass Transf. 2022, 137, 106281. [Google Scholar] [CrossRef]
  18. Kazem, H.A.; Chaichan, M.T. The Effect of Dust Accumulation and Cleaning Methods on PV Panels’ Outcomes Based on an Experimental Study of Six Locations in Northern Oman. Sol. Energy 2019, 187, 30–38. [Google Scholar] [CrossRef]
  19. Memiche, M.; Bouzian, C.; Benzahia, A.; Moussi, A. Effects of Dust, Soiling, Aging, and Weather Conditions on Photovoltaic System Performances in a Saharan Environment—Case Study in Algeria. Glob. Energy Interconnect. 2020, 3, 60–67. [Google Scholar] [CrossRef]
  20. Jaszczur, M.; Koshti, A.; Nawrot, W.; Sędor, P. An Investigation of the Dust Accumulation on Photovoltaic Panels. Environ. Sci. Pollut. Res. 2020, 27, 2001–2014. [Google Scholar] [CrossRef] [PubMed]
  21. Farahmand, M.Z.; Nazari, M.E.; Shamlou, S.; Shafie-khah, M. The Simultaneous Impacts of Seasonal Weather and Solar Conditions on PV Panels Electrical Characteristics. Energies 2021, 14, 845. [Google Scholar] [CrossRef]
  22. Salimi, H.; Mirabdolah Lavasani, A.; Ahmadi-Danesh-Ashtiani, H.; Fazaeli, R. Effect of Dust Concentration, Wind Speed, and Relative Humidity on the Performance of Photovoltaic Panels in Tehran. Energy Sources Part A Recovery Util. Environ. Eff. 2019, 1, 1–11. [Google Scholar] [CrossRef]
  23. Dida, M.; Boughali, S.; Bechki, D.; Bouguettaia, H. Output Power Loss of Crystalline Silicon Photovoltaic Modules Due to Dust Accumulation in Saharan Environment. Renew. Sustain. Energy Rev. 2020, 124, 109787. [Google Scholar] [CrossRef]
  24. Coşgun, A.E.; Demïr, H. The Experimental Study of Dust Effect on Solar Panel Efficiency. Politeknik. Dergisi. 2022, 25, 1. [Google Scholar] [CrossRef]
  25. Liu, X.; Yue, S.; Lu, L.; Li, J. Investigation of the Dust Scaling Behaviour on Solar Photovoltaic Panels. J. Clean. Prod. 2021, 295, 126391. [Google Scholar] [CrossRef]
  26. Shenouda, R.; Abd-Elhady, M.S.; Kandil, H.A. A Review of Dust Accumulation on PV Panels in the MENA and the Far East Regions. J. Eng. Appl. Sci. 2022, 69, 8. [Google Scholar] [CrossRef]
  27. Fan, S.; Wang, Y.; Cao, S.; Sun, T.; Liu, P. A Novel Method for Analyzing the Effect of Dust Accumulation on Energy Efficiency Loss in Photovoltaic (PV) System. Energy 2021, 234, 121112. [Google Scholar] [CrossRef]
  28. Chen, Y.; Liu, Y.; Tian, Z.; Dong, Y.; Zhou, Y.; Wang, X.; Wang, D. Experimental Study on the Effect of Dust Deposition on Photovoltaic Panels. Energy Procedia 2019, 158, 483–489. [Google Scholar] [CrossRef]
  29. Hammad, B.; Al-Abed, M.; Al-Ghandoor, A.; Al-Sardeah, A.; Al-Bashir, A. Modeling and Analysis of Dust and Temperature Effects on Photovoltaic Systems’ Performance and Optimal Cleaning Frequency: Jordan Case Study. Renew. Sustain. Energy Rev. 2018, 82, 2218–2234. [Google Scholar] [CrossRef]
  30. Murillo-Soto, L.D.; Meza, C. Photovoltaic array fault detection algorithm based on least significant difference test. In Proceedings of the Applied Computer Sciences in Engineering, Bogota, Colombia, 7–9 October 2020; Figueroa-García, J.C., Garay-Rairán, F.S., Hernández-Pérez, G.J., Díaz-Gutierrez, Y., Eds.; Springer International Publishing: Cham, Switzerland, 2020; pp. 501–515. [Google Scholar]
  31. Saquib, D.; Nasser, M.N.; Ramaswamy, S. Image processing based dust detection and prediction of power using ANN in PV systems. In Proceedings of the 2020 Third International Conference on Smart Systems and Inventive Technology (ICSSIT), Tirunelveli, India, 20–22 August 2020; pp. 1286–1292. [Google Scholar]
  32. Wang, Q.; Paynabar, K.; Pacella, M. Online Automatic Anomaly Detection for Photovoltaic Systems Using Thermography Imaging and Low Rank Matrix Decomposition. J. Qual. Technol. 2021, 1, 1–14. [Google Scholar] [CrossRef]
  33. Li, S.; Yang, J.; Wu, F.; Li, R.; Rashed, G.I. Combined Prediction of Photovoltaic Power Based on Sparrow Search Algorithm Optimized Convolution Long and Short-Term Memory Hybrid Neural Network. Electronics 2022, 11, 1654. [Google Scholar] [CrossRef]
  34. Vieira, R.G.; Dhimish, M.; de Araújo, F.M.U.; Guerra, M.I.S. PV Module Fault Detection Using Combined Artificial Neural Network and Sugeno Fuzzy Logic. Electronics 2020, 9, 2150. [Google Scholar] [CrossRef]
  35. Fan, S.; Wang, Y.; Cao, S.; Zhao, B.; Sun, T.; Liu, P. A Deep Residual Neural Network Identification Method for Uneven Dust Accumulation on Photovoltaic (PV) Panels. Energy 2022, 239, 122302. [Google Scholar] [CrossRef]
  36. Shaaban, M.F.; Alarif, A.; Mokhtar, M.; Tariq, U.; Osman, A.H.; Al-Ali, A.R. A New Data-Based Dust Estimation Unit for PV Panels. Energies 2020, 13, 3601. [Google Scholar] [CrossRef]
  37. Akbari, V.; Naghashzadegan, M.; Kouhikamali, R.; Afsharpanah, F.; Yaïci, W. Multi-Objective Optimization of a Small Horizontal-Axis Wind Turbine Blade for Generating the Maximum Startup Torque at Low Wind Speeds. Machines 2022, 10, 785. [Google Scholar] [CrossRef]
  38. Akbari, V.; Naghashzadegan, M.; Kouhikamali, R.; Afsharpanah, F.; Yaïci, W. Multi-Objective Optimization and Optimal Airfoil Blade Selection for a Small Horizontal-Axis Wind Turbine (HAWT) for Application in Regions with Various Wind Potential. Machines 2022, 10, 687. [Google Scholar] [CrossRef]
  39. Solis-Munoz, F.J.; Elvira-Ortiz, D.A.; Jaen-Cuellar, A.Y.; Romero-Troncoso, R.J.; Osornio-Rios, R.A. A Novel Methodology for Power Quality Disturbances Detection and Classification in Industrial Facilities. JSIR 2020, 79, 819–823. [Google Scholar]
  40. Hafiz, F.; Swain, A.; Naik, C.; Patel, N. Efficient Feature Selection of Power Quality Events Using Two Dimensional (2D) Particle Swarms. Appl. Soft Comput. 2019, 81, 105498. [Google Scholar] [CrossRef] [Green Version]
  41. Lu, S.; Wang, S.-H.; Zhang, Y.-D. Detection of Abnormal Brain in MRI via Improved AlexNet and ELM Optimized by Chaotic Bat Algorithm. Neural. Comput. Applic. 2021, 33, 10799–10811. [Google Scholar] [CrossRef]
  42. Igba, J.; Alemzadeh, K.; Durugbo, C.; Eiriksson, E.T. Analysing RMS and Peak Values of Vibration Signals for Condition Monitoring of Wind Turbine Gearboxes. Renew. Energy 2016, 91, 90–106. [Google Scholar] [CrossRef] [Green Version]
  43. Gonzalez-Abreu, A.-D.; Delgado-Prieto, M.; Osornio-Rios, R.-A.; Saucedo-Dorantes, J.-J.; Romero-Troncoso, R.-J. A Novel Deep Learning-Based Diagnosis Method Applied to Power Quality Disturbances. Energies 2021, 14, 2839. [Google Scholar] [CrossRef]
  44. INEGI. México en Cifras. Available online: https://www.inegi.org.mx/app/areasgeograficas/ (accessed on 21 October 2022).
  45. Xu, D.; Ma, W.; Chen, S.; Jiang, Q.; He, K.; Shi, Z. Assessment of Important Soil Properties Related to Chinese Soil Taxonomy Based on Vis–NIR Reflectance Spectroscopy. Comput. Electron. Agric. 2018, 144, 1–8. [Google Scholar] [CrossRef]
Figure 1. Flow chart for the implementation of a GA.
Electronics 11 03503 g001
Figure 2. Step-by-step diagram of the proposed methodology.
Electronics 11 03503 g002
Figure 3. Block diagram for the GA-PCA feature optimization.
Electronics 11 03503 g003
Figure 4. PV installation under test.
Electronics 11 03503 g004
Figure 5. Overview of the DAS.
Electronics 11 03503 g005
Figure 6. Procedure for the generation of the dust accumulation conditions in the PV panels; (a) dust layer weighing, (b) deposition of the dust over the panel surface and, (c) uniform spread of the dust layer over the panel surface.
Electronics 11 03503 g006
Figure 7. LDA projection obtained (a) using the optimized feature set and (b) using the complete feature set.
Electronics 11 03503 g007
Figure 8. Message delivered by the system for (a) the CLN condition, (b) the MAL condition, and (c) the HAL condition.
Electronics 11 03503 g008
Table 1. Time domain statistical features.
IndexFeatureEquationNumber
IMean x ¯ = 1 n k = 1 n | x k | (1)
IIMaximum value x ^ = max ( x ) (2)
IIIRMS R M S = 1 n k = 1 n ( x k ) 2 (3)
IVSquare root mean (SRM) S R M = ( 1 n k = 1 n | x k | ) 2 (4)
VStandard deviation σ = 1 n k = 1 n ( x k x ¯ ) 2 (5)
VIVariance σ 2 = 1 n k = 1 n ( x k x ¯ ) 2 (6)
VIIRMS shape factor S F R M S = R M S 1 n k = 1 n | x k | (7)
VIIISRM shape factor S F S R M = S R M 1 n k = 1 n | x k | (8)
IXCrest factor C F = x ^ R M S (9)
XLatitude factor L F = x ^ S R M (10)
XIImpulse factor I F = x ^ 1 n k = 1 n | x k | (11)
XIISkewness S k = E [ ( x k x ¯ ) 3 ] σ 3 (12)
XIIIKurtosis k = E [ ( x k x ¯ ) 4 ] σ 4 (13)
XIVFifth moment 5 t h M = E [ ( x k x ¯ ) 5 ] σ 5 (14)
XVSixth moment 6 t h M = E [ ( x k x ¯ ) 6 ] σ 6 (15)
Table 2. Specifications of the PV panels under test.
SpecificationValue
ManufacturerKyocera
MaterialPolycrystalline silicon
Maximum output power150 Wp
Maximum power point voltage17.6 V
Maximum power point current7.39 A
Short circuit current8.02 A
Open circuit voltage21.9 V
Table 3. Technical specifications of the sensors for the experimentation.
SensorSpecifications
ACS712Operating range±30 A
Sensitivity66 mV/A
Total output error1.5%
LM35Operating range0 to 100 °C
Sensitivity10 mV/°C
Accuracy±0.4 °C
UVM-30AOperating range200–370 nm
Sensitivity100 mV/UV index
Accuracy±1 UV index
Table 4. Resulting set of optimized features per variable.
Signal under TestRelevant Features
DC voltage[II, IV, V, VII, IX, X, XII, XIII, XIV, XV]
DC current[I, II, V, VII, IX, X, XI, XII, XIII]
Sun radiation[II, III, IV, V, VI, IX, XI, XII, XIII]
Temperature[III, IV, VII, VIII, IX, XI, XIII, XIV, XV]
Table 5. Confusion matrix for the estimation of dust level using the optimized feature set.
Assigned ClassTrue Class
CLNMALHAL
CLN96.5%3.5%0%
MAL5.9%94.1%0%
HAL0%0%100%
Publisher’s Note: MDPI stays neutral with regard to jurisdictional claims in published maps and institutional affiliations.

