Article

ELAA Channel Characterization with Parameter Estimation Based on a Generalized Array Manifold Model

1
College of Electronics and information Engineering, Tongji University, Shanghai 201804, China
2
Huawei Technologies Co., Ltd., Chengdu 610000, China
*
Author to whom correspondence should be addressed.
Electronics 2022, 11(21), 3442; https://doi.org/10.3390/electronics11213442
Submission received: 30 September 2022 / Revised: 14 October 2022 / Accepted: 19 October 2022 / Published: 25 October 2022
(This article belongs to the Special Issue Massive MIMO Technology for 5G and Beyond)

Abstract

:
The extremely large antenna arrays (ELAAs) and millimeter-wave systems have become key techniques for obtaining higher frequency spectrum efficiency in sixth-generation (6G) communication systems. It is necessary to determine appropriate statistical models to describe the channel characteristics for the ELAAs, such as spatial non-stationarity, dispersion in angular domain, and spatial consistency. Thus, a signal model based on the generalized array manifold (GAM) that describes the dispersion in direction using the definition of the slightly distributed scatterer (SDS) is proposed in this work. An estimator for the parameters of the GAM model, namely GAM Space-Alternating Generalized Expectation-maximization (GAM-SAGE), is also designed. Moreover, a method to obtain a stochastic SDS-based channel model (SBCM) that is capable of reproducing the spatial consistency is proposed. The method is then used to establish measurement-based models for line-of-sight (LoS) and non-line-of-sight (NLoS) scenarios using a 40 × 40 receiver (Rx) planar antenna array at a carrier frequency of 40 GHz. The results demonstrate that the SBCM is capable of achieving spatially consistent results and outperforms the specular-path (SP) models in completely characterizing the ELAA channels at millimeter-wave bands, which are fundamental for the design of 6G.

1. Introduction

With the advent of the sixth-generation (6G) era, millimeter-wave and Terahertz communications have received increasing attention in both academia and industry [1,2,3,4]. To overcome the large propagation loss in millimeter-wave bands, the utilization of extremely large antenna arrays (ELAAs) became the key technique for future beyond fifth generation communication system (B5G) and 6G cellular systems [5,6]. ELAAs bring higher spatial degree of freedom (SDoF) and thus yield increased channel capacity when utilizing techniques such as space division multiplexing (SDM) [7,8]. Meanwhile, ELAAs improve the frequency spectrum efficiency and the channel capacity through multiple-user deployments [9,10]. Accurate propagation channel models established for various ELAA scenarios are essential for the design and performance evaluation of transceiver algorithms and for network deployment optimization.
Compared with the channels experienced by conventional multiple-input multiple-output (MIMO) systems equipped with small-aperture antenna arrays, the channels for ELAA-based systems in millimeter-wave bands exhibit complex characteristics, e.g., significant spatial non-stationarity, which makes the statistical modeling more difficult [11,12,13]. In this paper, a propagation scenario where the Rx is equipped with an ELAA is considered; the analysis can be applied to the Tx side as well. As the array size increases, the small-scale characterization (SSC) condition becomes invalid [14], i.e., the parameters of the multipath components (MPCs) are variable along the antenna array. In such cases, the geometrical parameters of the paths, such as the direction of arrival, change for different individual array elements.
Another frequently encountered situation for most of propagation scenarios is that a scatterer has a certain geometrical extent which is small in the view of the Rx, or that local scatterer exists around a transmitter located far away from the Rx. In both cases, the received signal contributed by each scatterer or cluster of local scatterers can be conceived as the summation of the contributions of multiple “sub-paths” with slightly different directions of arrival.We refer to such scatterers or clusters of local scatterers as the slightly distributed scatterers (SDSs) [15,16,17]. The direction dispersion induced by an SDS can be characterized by means of the nominal direction and the direction spread of the power spectrum of the signal contributed by the SDS. For simplicity, we analyze the angle of arrival in this contribution, but the analysis can be extended to other parameters as well. In this case, the dispersion is characterized by a nominal angle and the angular spread [18,19].
Due to the lack of appropriate signal models for describing the dispersive characteristics, many channel parameter estimation algorithms have been derived based on the specular-path (SP) model, such as the space-alternating generalized expectation-maximization (SAGE) in [20] and the Richter’s MAXimum likelihood estimation (RiMAX) in [21], failed to apply to estimating the parameters for describing the dispersion in angular domain. Moreover, in order to overcome the difficulty of setting the number of MPCs, updated algorithms based on the SAGE principle have been proposed for jointly estimating the number of multipaths and channel parameters in recent years, such as the Sparse variational Bayesian SAGE in [22] and the two-dimensional (2D) frequency domain (FD) SAGE in [23]. The SAGE principle was also applied for estimating the time of arrival (ToA) of long-term evolution (LTE) signals received in multiple separate transmission bands by the same base station (BS) in [24]. However, these estimators have failed to estimate the sensible parameters inducing the spatial non-stationarity and the angle dispersion behavior of the channels [25]. “Fake paths” are estimated by these algorithms due to the model mismatch caused by the SP model [26]. In our previous work [27], the dispersions in the delay and Doppler domains were characterized by their corresponding spread parameters, and an algorithm for estimating these parameters was proposed. These estimation schemes can be easily extended to the angular domain.
Traditional measurement-based statistical channel models, such as the 3rd Generation Partner Project (3GPP) spatial channel model (SCM) [28], the WINNER II stochastic channel model enhanced (SCME) [29], the cluster-based channel model proposed by activities of the European Technology Cooperation Technology 2100 (COST2100) [30,31], or the deterministic map-based model proposed by the European fifth generation (5G) research project “mobile and wireless communications Enablers for the Twenty-twenty Information Society (METIS)” [32,33], have been used for channel simulation during the last decades. The clusters of the MPCs are applied in these models, which makes it difficult for these models to describe the dispersion in the angular domain caused by the SDSs. The degree of freedom of the ELAA channels may be underestimated by decomposition using the SP model. Due to these problems, the accuracy of the channel models has raised a lot of doubts in the industry. In this work, we propose a signal model using the generalized array manifold (GAM) methodology for describing the non-stationarity caused by the summation of the dispersive “sub-paths” generated by the SDSs in the angular domain. The derived algorithm, namely the GAM Space-Alternating Generalized Expectation-maximization (GAM-SAGE), mitigates the impact of model mismatch on channel estimation caused by SP assumptions. The performance of the GAM-SAGE was evaluated through the likelihood function, the reconstructed component accuracy, and the spatial consistency. The results indicate that the GAM-SAGE outperforms the specular-path space-alternating generalized expectation-maximization (SP-SAGE), especially in reproducing the spatial consistency. Thus, a method for establishing measurement-based stochastic models with spatial consistency from the parameters estimated by the GAM-SAGE, the so-called SDSbased channel model (SBCM), was proposed. Different from the conventional SCM/SCME, the definition of clusters was replaced by the SDSs. Furthermore, measurement campaigns with ELAAs were conducted in line-of-sight (LoS) and non-line-of-sight (NLoS) indoor scenarios. Exemplary SBCMs were established using the method proposed.
The main novelties of this work can be summarized as follows:
  • The channel parameters for ELAAs are estimated by the GAM-SAGE. The performance of the GAM-SAGE is evaluated by the measurement data, showing that it outperforms the SP-SAGE, especially in reproducing the spatial consistency.
  • Measurement-based stochastic channel models, namely SBCMs for LoS and NLoS corridors, were proposed. The proposed models are capable of reproducing the spatial non-stationarity and consistency effectively in the ELAA channel; hence, this property leads to the better scalability of these models. Moreover, two established models reveal important characteristics of the millimeter-wave ELAA channels.
This paper is organized as follows. In Section 2, the GAM model is presented. The GAM-SAGE is derived and introduced in Section 3. The measurement campaigns and environments are presented in Section 4. Section 5 illustrates the performance of the GAM-SAGE and compares it with that of SP-SAGE. Then, the channel characteristics obtained using the GAM are analyzed, and the exemplary SBCMs are presented in Section 6. Conclusions are finally drawn in Section 7.

2. GAM-Based Signal Model

Conventional SP models assume that the channel impulse response (CIR) consists of L specular multipath components. According to the nomenclature introduced in [20,34], the signal model for a single-input multiple-output (SIMO) system can be written as follows:
y m ( f ) = = 1 L α exp ( j 2 π f τ ) C Rx , n , m ( ϕ , θ ) + w m ( f ) , f [ f 1 , f 2 , , f K ] ,
where L represents the total number of specular multipath components, α is the complex attenuation coefficient experienced by a signal-transmitted array along the th path, and τ is the delay. We denote c Rx , n ( ϕ , θ ) with the steering vector of the nth antenna of the Rx array, written as c Rx , n ( ϕ , θ ) = [ sin ϕ cos θ , sin ϕ cos ϕ , cos θ ] T , with ( · ) T being the transpose operation, and ϕ and θ respectively the Azimuth of Arrival (AoA) and Elevation of Arrival (EoA) along the th path. It is worth mentioning that the antenna is assumed to be isotropic in this paper.
However, with the carrier frequency increasing, especially at millimeter-wave bands, the wavelength becomes short, which may lead to a large number of scattering “sub-paths” and dispersion in the angular domain. Thus, the signal at the output of an M-element Rx array can be viewed as comprised of the contributions of “sub-paths” distributed wrt the AoA and EoA. For simplicity, we assume dispersive propagation in the angular domain and neglect all other dispersion effects, such as that in the delay domain due to the slight delay difference. We consider a system where the Rx is equipped with M correlators. Then, the output signal of the mth correlator at the frequency f can be expressed as follows:
y m ( f ) = d = 1 D = 1 L α exp ( j 2 π f τ ) c Rx , m ( ϕ ¯ d ϕ ˜ , θ ¯ d θ ˜ ) + w m ( f ) , f = [ f 1 , f 2 , , f K ] ,
with D and L representing the total number of SDSs and “sub-paths”, and d and being the SDSs and “sub-path” index, respectively. It is worth noting that we assume a large enough L. The y m ( f ) denotes the observation data for the mth antenna of the Rx array, f is the frequency point, and τ is the delay of the dth SDS. ϕ ¯ d and θ ¯ d respectively represent the nominal AoA and nominal EoA, which can be considered as the statistical mean of the angle of the “sub-paths” generated by the SDS. The noise variable w m ( f ) in Equation (2) is a circularly symmetric, spatially and temporally white Gaussian process with a component spectral height of σ w 2 , α denotes the complex attenuation coefficient for the th “sub-path”, and c Rx , m ( ϕ ¯ d ϕ ˜ , θ ¯ d θ ˜ ) is the GAM steering vector. ϕ ˜ and θ ˜ are slight deviations from ϕ ¯ d and θ ¯ d , respectively, and they concentrate around the nominal AoA and EoA, with the AoA spread being σ ϕ ˜ and the EoA spread σ θ ˜ , respectively. Thus, c Rx , m can be approximated by the first-order Taylor series expansion with respect to the nominal values ϕ ¯ and θ ¯ as follows:
c Rx , m ( ϕ ¯ d ϕ ˜ , θ ¯ d θ ˜ ) c Rx , m ( ϕ ¯ d , θ ¯ d ) + ϕ ˜ c Rx , m ( ϕ , θ ) ϕ | ϕ = ϕ ¯ d , θ = θ ¯ d + θ ˜ c Rx , m ( ϕ , θ ) θ | ϕ = ϕ ¯ d , θ = θ ¯ d + ϕ ˜ θ ˜ 2 c Rx , m ( ϕ , θ ) ϕ θ | ϕ = ϕ ¯ d , θ = θ ¯ d ,
with the steering vector consisting of four parts, namely c Rx , 1 ( ϕ ¯ d , θ ¯ d ) , ϕ ˜ c Rx , 1 ( ϕ , θ ) ϕ | ϕ = ϕ ¯ d , θ = θ ¯ d , θ ˜ c Rx , 1 ( ϕ , θ ) θ | ϕ = ϕ ¯ d , θ = θ ¯ d , and ϕ ˜ θ ˜ 2 c Rx , 1 ( ϕ , θ ) ϕ θ | ϕ = ϕ ¯ d , θ = θ ¯ d . Thus, the signal model is assumed as a composition of four-part phase-shifts, the so-called GAM model. For convenience of notation, we vectorize some components in Equation (2), which leads to:
y ( f ) = d = 1 D ( s d C d ) a d + w ( f )
where the terms of Equation (4) are as follows:
s d = vec [ exp ( j 2 π f τ d ) , f = f 1 , f 2 , . . . , f K ] C K × 1 a d = [ = 1 L α , = 1 L α ϕ ˜ , = 1 L α θ ˜ , = 1 L α ϕ ˜ θ ˜ ] T = [ α d , β d , η d , γ d ] T C 4 × 1 C Rx ( ϕ ¯ , θ ¯ ) = c Rx , 1 ( ϕ ¯ , θ ¯ ) ϕ ˜ c Rx , 1 ( ϕ , θ ) ϕ θ ˜ c Rx , 1 ( ϕ , θ ) θ ϕ ˜ θ ˜ 2 c Rx , 1 ( ϕ , θ ) ϕ θ c Rx , 2 ( ϕ ¯ , θ ¯ ) ϕ ˜ c Rx , 2 ( ϕ , θ ) ϕ θ ˜ c Rx , 2 ( ϕ , θ ) θ ϕ ˜ θ ˜ 2 c Rx , 2 ( ϕ , θ ) ϕ θ c Rx , M ( ϕ ¯ , θ ¯ ) ϕ ˜ c Rx , M ( ϕ , θ ) ϕ θ ˜ c Rx , M ( ϕ , θ ) θ ϕ ˜ θ ˜ 2 c Rx , M ( ϕ , θ ) ϕ θ C M × 4 ,
with y ( f ) being the observation data for one snapshot and y ( f ) C K M × 1 , while vec ( · ) denotes the vectorization operation, ( · ) T is the transpose operation, ⊗ denotes the Kronecker product operation, and w ( f ) the circularly symmetric white Gaussian noise component with spectral height σ w and w ( f ) C K M × 1 . The unknown parameters in Equation (4) are as follows:
Θ = [ θ d ; d = 1 , 2 , 3 , , D ] ,
where θ d = [ τ d , ϕ ¯ d , θ ¯ d , α d , β d , η d , γ d ] represents the parameters for the dth SDS. The details of the estimation algorithm are elaborated in Section 3.

3. Generalized Array-Manifold Space-Alternating Generalized Expectation-Maximization

Maximum Likelihood Estimator

It is possible to estimate Θ based on the observed empirical realizations y ( f ) using a maximum-likelihood estimator (MLE) under the assumption that the noise components w ( f ) are independent random variables following a Gaussian distribution. However, solving the multi-dimensional optimization problem in MLE involves significant complexity that prohibits its application in practice. By applying the assumption that the received signal contains multiple components that follow orthogonal stochastic measurements, the innovative SAGE principle named GAM-SAGE is proposed in this paper, and it can be used to derive an approximation of the MLE by updating the parameter estimates of individual components iteratively. Thus, y ( f ) is identified with the incomplete data and is related to the complete data according to y ( f ) = d = 1 D x d ( f ) . Since x d ( f ) , , x d ( f ) are independent, the components x , are irrelevant for the estimation of θ d for different iterations. The log-likelihood function of θ d μ at μ th iteration for the observation is presented as follows:
Λ ( θ d μ ; x d μ ( f ) ) = ln 2 π σ w x d μ ( f ) ( s d μ C d μ ) a d μ 2 σ w ,
with μ denoting the iteration index. Then, ln 2 π σ w and the noise variance σ w 2 are known, and thus these items can be removed from Equation (6). Therefore, (6) is rewritten as follows:
Λ ( θ d μ ; x d μ ( f ) ) x d μ ( f ) ( s d μ C d μ ) a d μ 2 ;
then, we define z ( θ d μ ; x d μ ( f ) ) = x d μ ( f ) ( s d μ C d μ ) a d μ 2 , and the z ( θ d μ ; x d μ ( f ) ) can be detailed as follows:
z ( θ d μ ; x d μ ( f ) ) = { x d μ ( f ) H x d μ ( f ) x d μ ( f ) H [ ( s d μ C d μ ) a d μ ] [ ( s d μ C d μ ) a d μ ] H x d μ ( f ) + [ ( s d μ C d μ ) a d μ ] H [ ( s d μ C d μ ) a d μ ] } .
Subsequently, we set z ( θ d μ ; x d μ ( f ) ) / ( α d μ ) H = 0 ; since ( α d μ ) H is dependent on the estimation of x d μ ( f ) , the z ( θ d μ ; x d μ ( f ) ) can be rewritten as follows:
z ( θ d μ ; x d μ ( f ) ) = x d μ ( f ) H ( s d μ C d μ ) [ ( s d μ C d μ ) ( s d μ C d μ ) H ] 1 ( s d μ C d μ ) H x d μ ( f ) H ,
where ( · ) H is the Hermitian transposition operation, and ( · ) 1 stands for the matrix inversion operation. The conditions for the invertibility of [ ( s d μ C d μ ) ( s d μ C d μ ) H ] can be derived as in [18]. The MLE of θ d μ and the estimates of a d μ are given by the following equations:
( θ ^ d μ ) ML = arg max θ d μ z ( θ d μ ; x d μ ( f ) ) ,
( a ^ d μ ) ML = [ ( s d μ C d μ ) H ( s d μ C d μ ) ] 1 ( s d μ C d μ ) H x d μ ( f ) | ( θ ^ d μ ) ML ,
The coordinate-wise updating procedure for the parameter estimates of one scatterer is as follows:
τ ^ d μ = argmax τ d | z ( τ , ϕ ¯ ^ d μ 1 , θ ¯ ^ d μ 1 ; x ^ d μ ( f ) ) |
ϕ ¯ ^ d μ = argmax ϕ ¯ d | z ( τ ^ d μ , ϕ ¯ d , θ ¯ ^ d μ 1 ; x ^ d μ ( f ) ) |
θ ¯ ^ d μ = argmax θ ¯ d | z ( τ ^ d μ , ϕ ¯ ^ d μ , θ ¯ d ; x ^ d μ ( f ) ) |
where the μ th iteration hidden data for the dth scatterer is calculated as follows:
x ^ d μ ( f ) = y ( f ) d = 1 d 1 ( s ^ d μ C ^ d μ ) a ^ d μ d = d + 1 D ( s ^ d μ 1 C ^ d μ 1 ) a ^ d μ 1 .
Notice that in the initialization, α ^ d 0 = 0 T 4 × 1 , s ^ d 0 = 0 K × 1 , and C ^ d 0 = O M × 4 , with 0 and O respectively representing the all elements of the vector and matrix as 0. After estimating the α ^ d , the AoA spread σ ϕ ˜ , EoA spread σ θ ˜ , and their correlation ρ ϕ ˜ θ ˜ can be calculated as σ ϕ ˜ 2 = β d 2 α d 2 , σ θ ˜ 2 = η d 2 α d 2 , ρ θ ˜ ϕ ˜ = γ d α d * α d 2 σ θ ˜ σ ϕ ˜ [27,35] under these assumptions:
  • The slight deviations of the azimuth and elevation ϕ ˜ , θ ˜ , = 1 , , L , are independent and identical Gaussian distributions with a zero mean. The azimuths and elevations of sub-paths are concentrated, with a high probability around the nominal AoA ϕ ¯ d and EoA θ ¯ d , respectively.
  • The weight processes α 1 , α 2 , α L are independent and identically complex, circularly symmetric, wide-sense, stationary processes, and these weights have zero mean and equal variance.
  • The total number of sub-paths L is large.
  • Any two random elements in the set consisting of the azimuth and elevation deviations as well as the sub-path weights are independent.
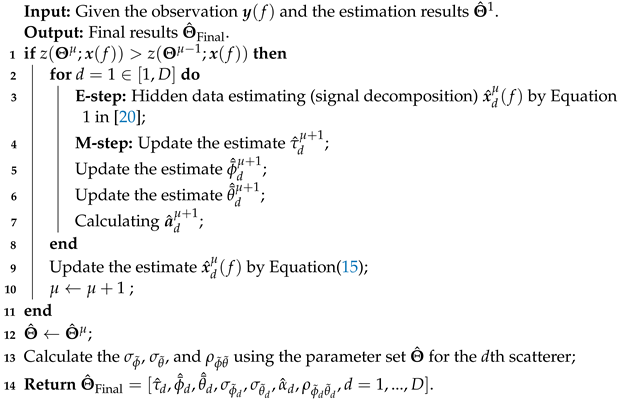
The flowchart and algorithm of GAM-SAGE are illustrated in Figure 1. The GAM-SAGE includes two parts, i.e., the E-step and M-step, which comprise the conventional SAGE principle. Then, the Θ ^ is applied to poster processing in order to obtain the σ ϕ ˜ , σ θ ˜ , and ρ ϕ ˜ θ ˜ . Due to the fact that σ ϕ ˜ follows an independent and identical Gaussian distribution, σ ϕ ˜ = σ ϕ ˜ d is hence satisfied, with σ ϕ ˜ d denoting the standard deviation of AoA for the dth SDS, and σ θ ˜ = σ θ ˜ d and ρ ϕ ˜ θ ˜ = ρ ϕ ˜ d θ ˜ d can be obtained in a similar way. Thus, we define the final results as Θ ^ final = [ τ d , ϕ ¯ d , θ ¯ d , σ ϕ ˜ d , σ θ ˜ d , ρ ϕ ˜ d θ ˜ d ] , and the detailed steps for GAM-SAGE are also elaborated in Algorithm 1.
Figure 2 represent examples of estimation results. Figure 2a illustrates the shape of an SDS with the same AoA and EoA dispersion. The AoA and EoA spreads, i.e., σ ϕ ˜ d and σ θ ˜ d , can reflect the dispersion on AoA and EoA, and the larger σ ϕ ˜ d denotes the more serious dispersion in the AoA direction, which is the same as that in the EoA direction. Figure 2b shows the shape of an SDS with a larger EoA spread. It is worth noting that the AoA and EoA spreads are uncorrelated in these two figures, i.e., ρ ϕ ˜ θ ˜ = 0 . As Figure 2c shows, the center of the distribution is ( ϕ ¯ d , θ ¯ d ) and the correlation coefficient is positive, which lead to a deflection of the shape. When the correlation coefficient approximates 1 or 1, the shape of the SDS becomes narrower; for example, see Figure 2d. In actual situations, this effect can be caused by the marginal diffraction of the scatterers or by the distribution of the “sub-paths” in the SDSs.
Algorithm 1:Proposed GAM-SAGE after initialization ( μ > 1 )
Electronics 11 03442 i001

4. Channel Measurement Campaigns

Recently, measurement campaigns for channel characterization in indoor environments, i.e., corridor under LoS and corridor under NLoS, were conducted in the Zhixing building, Tongji University in Shanghai, China. The SIMO configuration was adopted, with a virtual ELAA formed by positioning an antenna along specified grids in the Rx side. The environments where the measurements were taken, the setup of the equipment, and the preliminary channel spectral characteristics observed are presented in the following sub-sections.

4.1. Measurement Environments

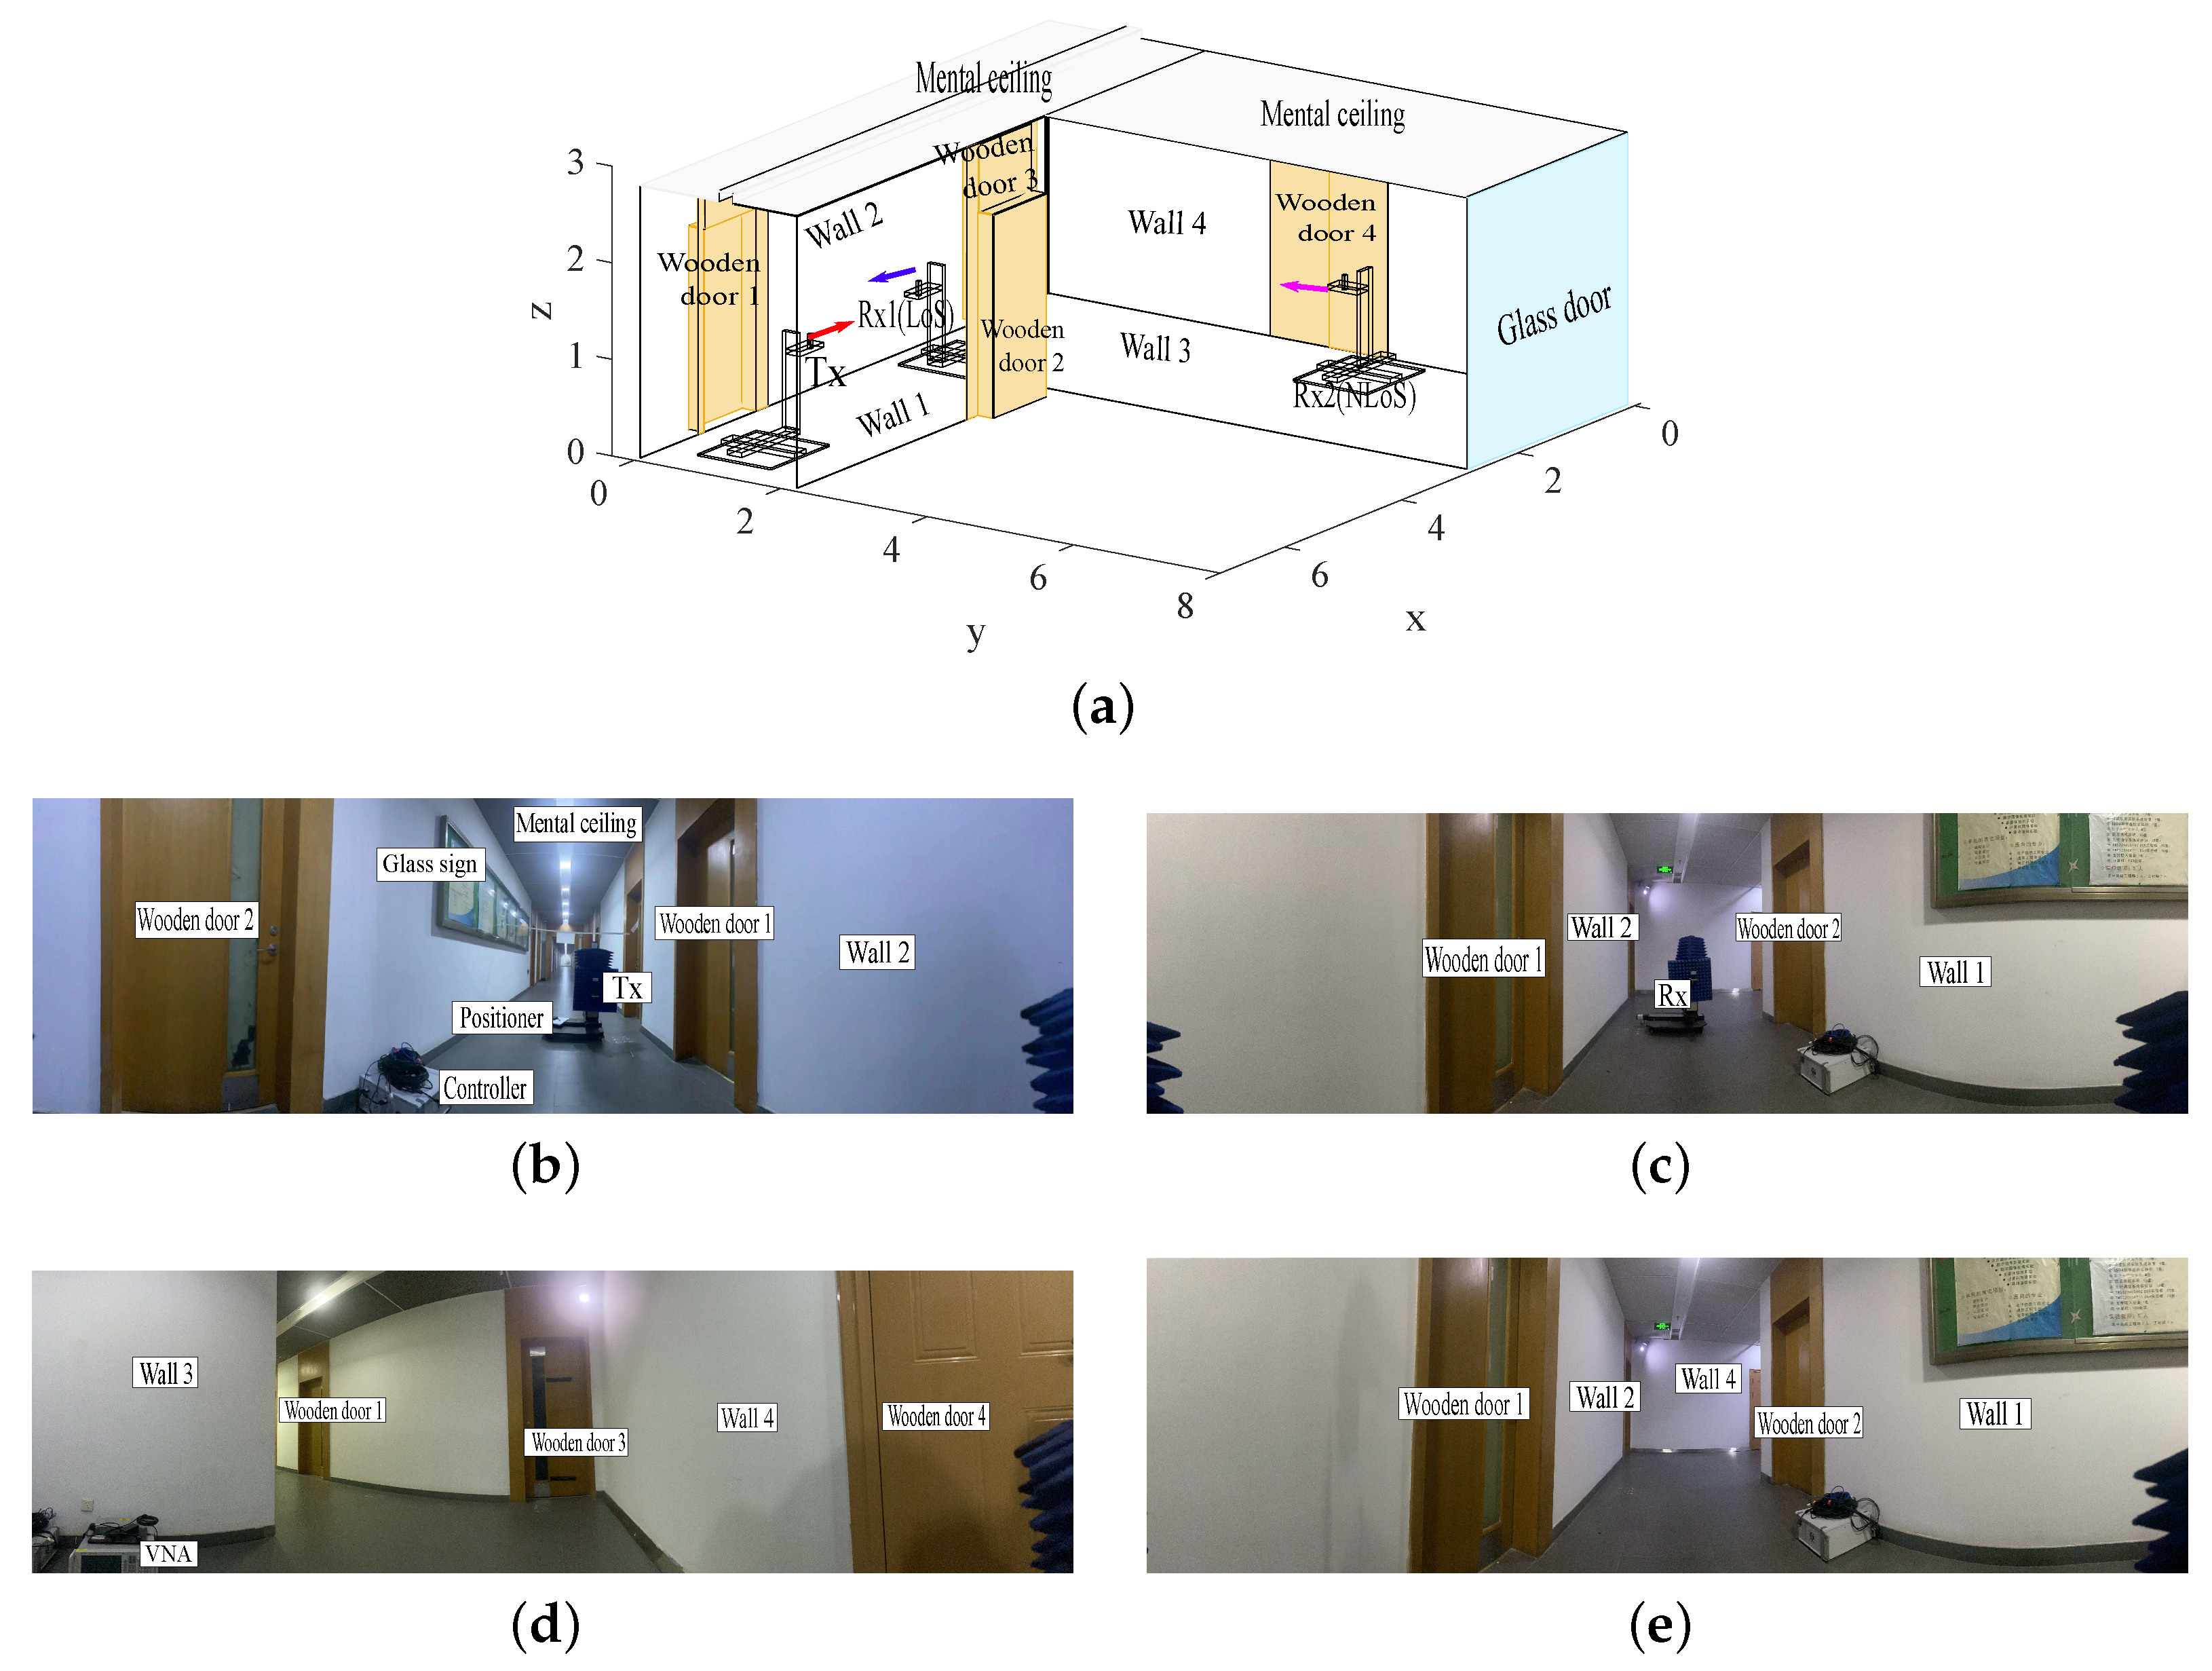
Figure 3 respectively shows the photographs and three-dimension (3D) digital layout of the corridor with the measurement equipment in it. The size of the corridor is 6.03 × 8.84 × 2.95 m 3 . The Rx antenna was mounted on top of a vertically oriented pole, which can be moved in 3D using a multi-axis position controller close to a wall of the room. The maximum reachable height is 1.4 m above the ground. The Tx antenna was fixed onto another multi-axis positioner with the same height. During the campaign, the SIMO channels with two different positions of the Rx virtual array were measured for LoS and NLoS, respectively. The objects in the corridor include two concrete walls, wooden doors, a glass-sign board, a controller, and a metal ceiling. The locations of those objects together with the two positions of the Rx antenna array are marked in Figure 3a.

4.2. Measurement Setup

The measurement system consists of three parts: (1) the virtual antenna array formed by using a three-axis guiding system, a 1 μ m -resolution position controller, and one physical antenna; (2) a Vector Network Analyser (VNA) used for measuring channel response within the frequency range of [ 36 , 40 ] GHz; (3) a computer used to coordinate the operations of the VNA and of the virtual array controller. The Tx and Rx physical antennas are of the same type, with a bi-conical structure, vertical polarization, and 4 dBi gain. The Rx virtual array contains the vertices of 40 × 40 square grids on a plane perpendicular to the ground surface. The width/length of the square grid are equal to 3.75 mm , which coincides with λ 0 / 2 , with λ 0 being the wavelength at 40 GHz. This setting was determined as such since the campaign was aimed at measuring the channels from 36 to 40 GHz. In order to avoid aliasing in the angular domain, the antenna separation was chosen to be the half of the minimum wavelength. In the work presented in this paper, we only considered the range from 36 to 40 GHz within, in which 1001 frequency points were measured. During the measurements, the positioner controller, the VNA, and the power amplifier were covered by microwave-absorbing materials to suppress their impacts on wave propagation. Table 1 summarizes the main setting parameters employed during the measurements.

5. Performance Evaluation of the GAM-SAGE Using the Measurements

5.1. Performance of the GAM-SAGE and SP-SAGE

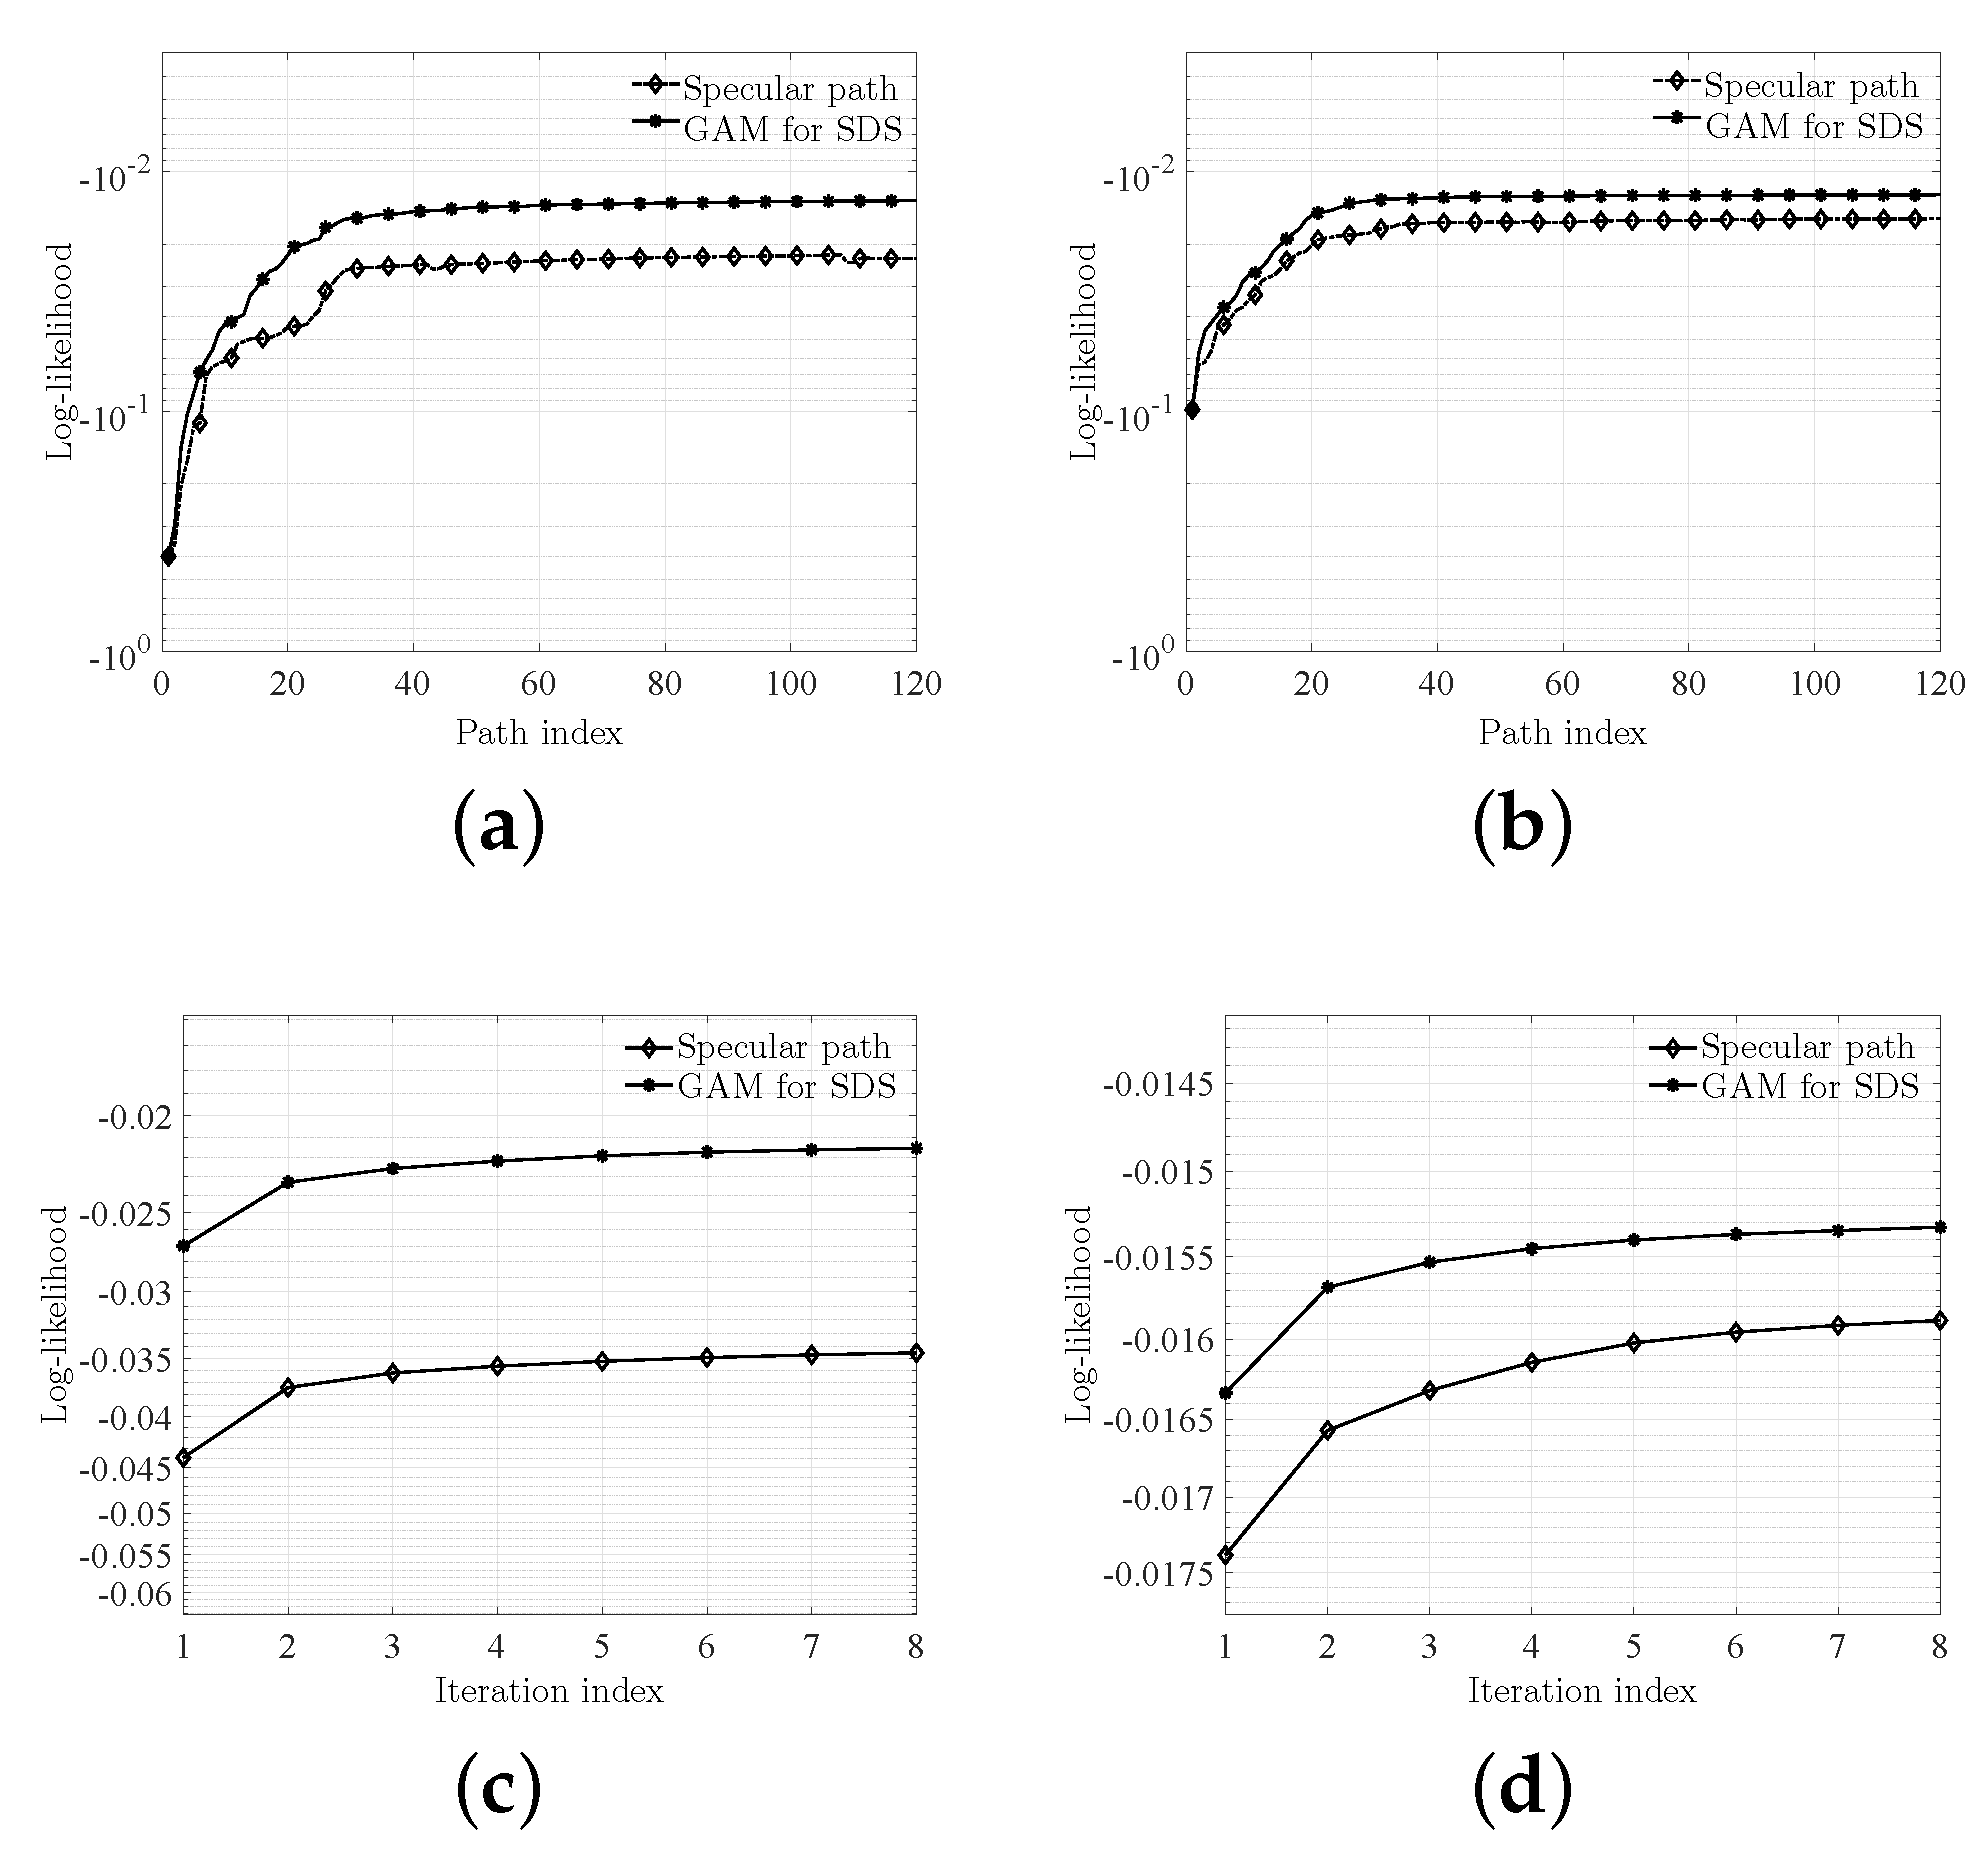
Figure 4 illustrates the Euclidean distance between the original frequency responses (FRs) and the reconstructed FRs (from the obtained estimates) wrt the number of iterations and estimated paths. The results of the conventional SAGE algorithm under the SP assumption are also given for comparison [36]. It can be seen that with the number of path indexes increasing, the log-likelihood of the GAM-SAGE converges faster and results in higher likelihood values than those of the SP-SAGE. This indicates that the signal model can better fit the empirical data when the GAM is applied. Moreover, in order to fairly compare GAM-SAGE with SP-SAGE, we kept the total number of estimated parameters constant in both cases. For this, we considered 20 SDSs (GAM-SAGE case) and 35 SPs (SP-SAGE case) since 7 parameters are required to describe an SDS in GAM-SAGE, but only 4 parameters are required in SP-SAGE. The number of iterations was set to 8 in both cases. Figure 4 a–d illustrate that the likelihoods of the GAM for LoS and NLoS are both higher than those of SP. This indicates that the GAM model outperforms the SP model in describing the ELAA channel at millimeter-wave bands. We conclude that this is due to the ability of the GAM model to describe the scattering at millimeter-wave bands. Thus, it is our postulation that the GAM model can fit the propagation for ELAAs well, even if we assume that the radiation pattern is isotropic. Thus, we can infer that the GAM model possibly overcomes some non-ideal factors of the system, such as unavoidable inaccuracies in the radiation pattern and the calibration in practical measurements.
Meanwhile, the reconstructed channel responses using the GAM-SAGE estimation results and those of SP-SAGE are represented in Figure 5. Notice that for conciseness, the power delay profiles in Figure 5 are the result of averaging out the concatenated power delay profiles for different antenna elements. As illustrated in Figure 5a,c, the GAM model requires fewer components to provide better results. For example, the results in Figure 5a were obtained by estimating just 20 SDSs, whereas the results in Figure 5c considered 35 SPs. However, despite of the lower number of estimated SDSs: (1) the GAM-SAGE provides a better fit for the dominant components of the power delay profile in comparison with the SP model; and (2) the GAM-SAGE is able to detect more components than the SP-SAGE (e.g., see the components labeled as “Path#1” and “Path#2” in Figure 5a). A similar phenomenon, i.e., a higher number of SPs required to fit the dominant components to the SP assumption w.r.t. the number of SDSs used by the GAM model, is also observed in the Figure 5b,d (since, in this case, the NLoS scenario is considered, the range of delay, including the dominant components, is marked by a blue line in the figures). As a summary, the GAM model is more accurate in fitting the measurement data, both for the LoS and the NLoS scenarios, which leads to the conclusion that the GAM-SAGE outperforms the SP-SAGE. It is worth noting that the total number of parameters estimated by GAM-SAGE and SP-SAGE are kept equal for fairness in the comparison. This premise is considered in all the comparison results in the rest of the paper.
In order to evaluate the spatial consistency, the coherence between the reconstructed channel responses and the measurements under different array apertures were calculated. For convenience, we define the so-called “channel similarity index”, namely ρ s , which can be calculated as follows:
ρ s = T r H ( f ) Γ ( f ) Γ H ( f ) Γ ( f ) ,
with T r ( f ) C M representing the channel frequency response reconstructed by using the estimation parameters, and Γ ( f ) C M representing the channel frequency response obtained through the actual measurements. As Figure 6a shows, the similarity between the reconstructed response and the measurement data illustrates an overall downward trend with the increasing aperture size, which indicates that the spatial consistency of the SP model becomes worse when reconstructing the channel responses for large apertures. Even if the downward trend is also seen in the GAM model results, we can observe that: (1) the downward slope is lower; and (2) the absolute level of the correlation coefficient is higher than that for the SP model regardless of the antenna aperture. This indicates the potential ability of the GAM model to reproduce the spatial consistency of the ELAAs channels, even if the signal model of GAM does not include parameters for describing the spatial consistency. Similar implications can also be found in Figure 6b. It is worth noting that the curve of the SP model shows an increasing trend for the antenna apertures, ranging between 12 2 and 20 2 . We infer that this is due to the fact that the SP model is inaccurate in reconstructing the channel responses of the elements close to the edge of the antenna array. As aforementioned, we conclude that the GAM model exhibits good spatial consistency. Thus, it is our postulation that the channel models established when using the parameters estimated by the GAM-SAGE can be used to reproduce the spatial consistency of the ELAA channels.

5.2. The Results Estimated by GAM-SAGE

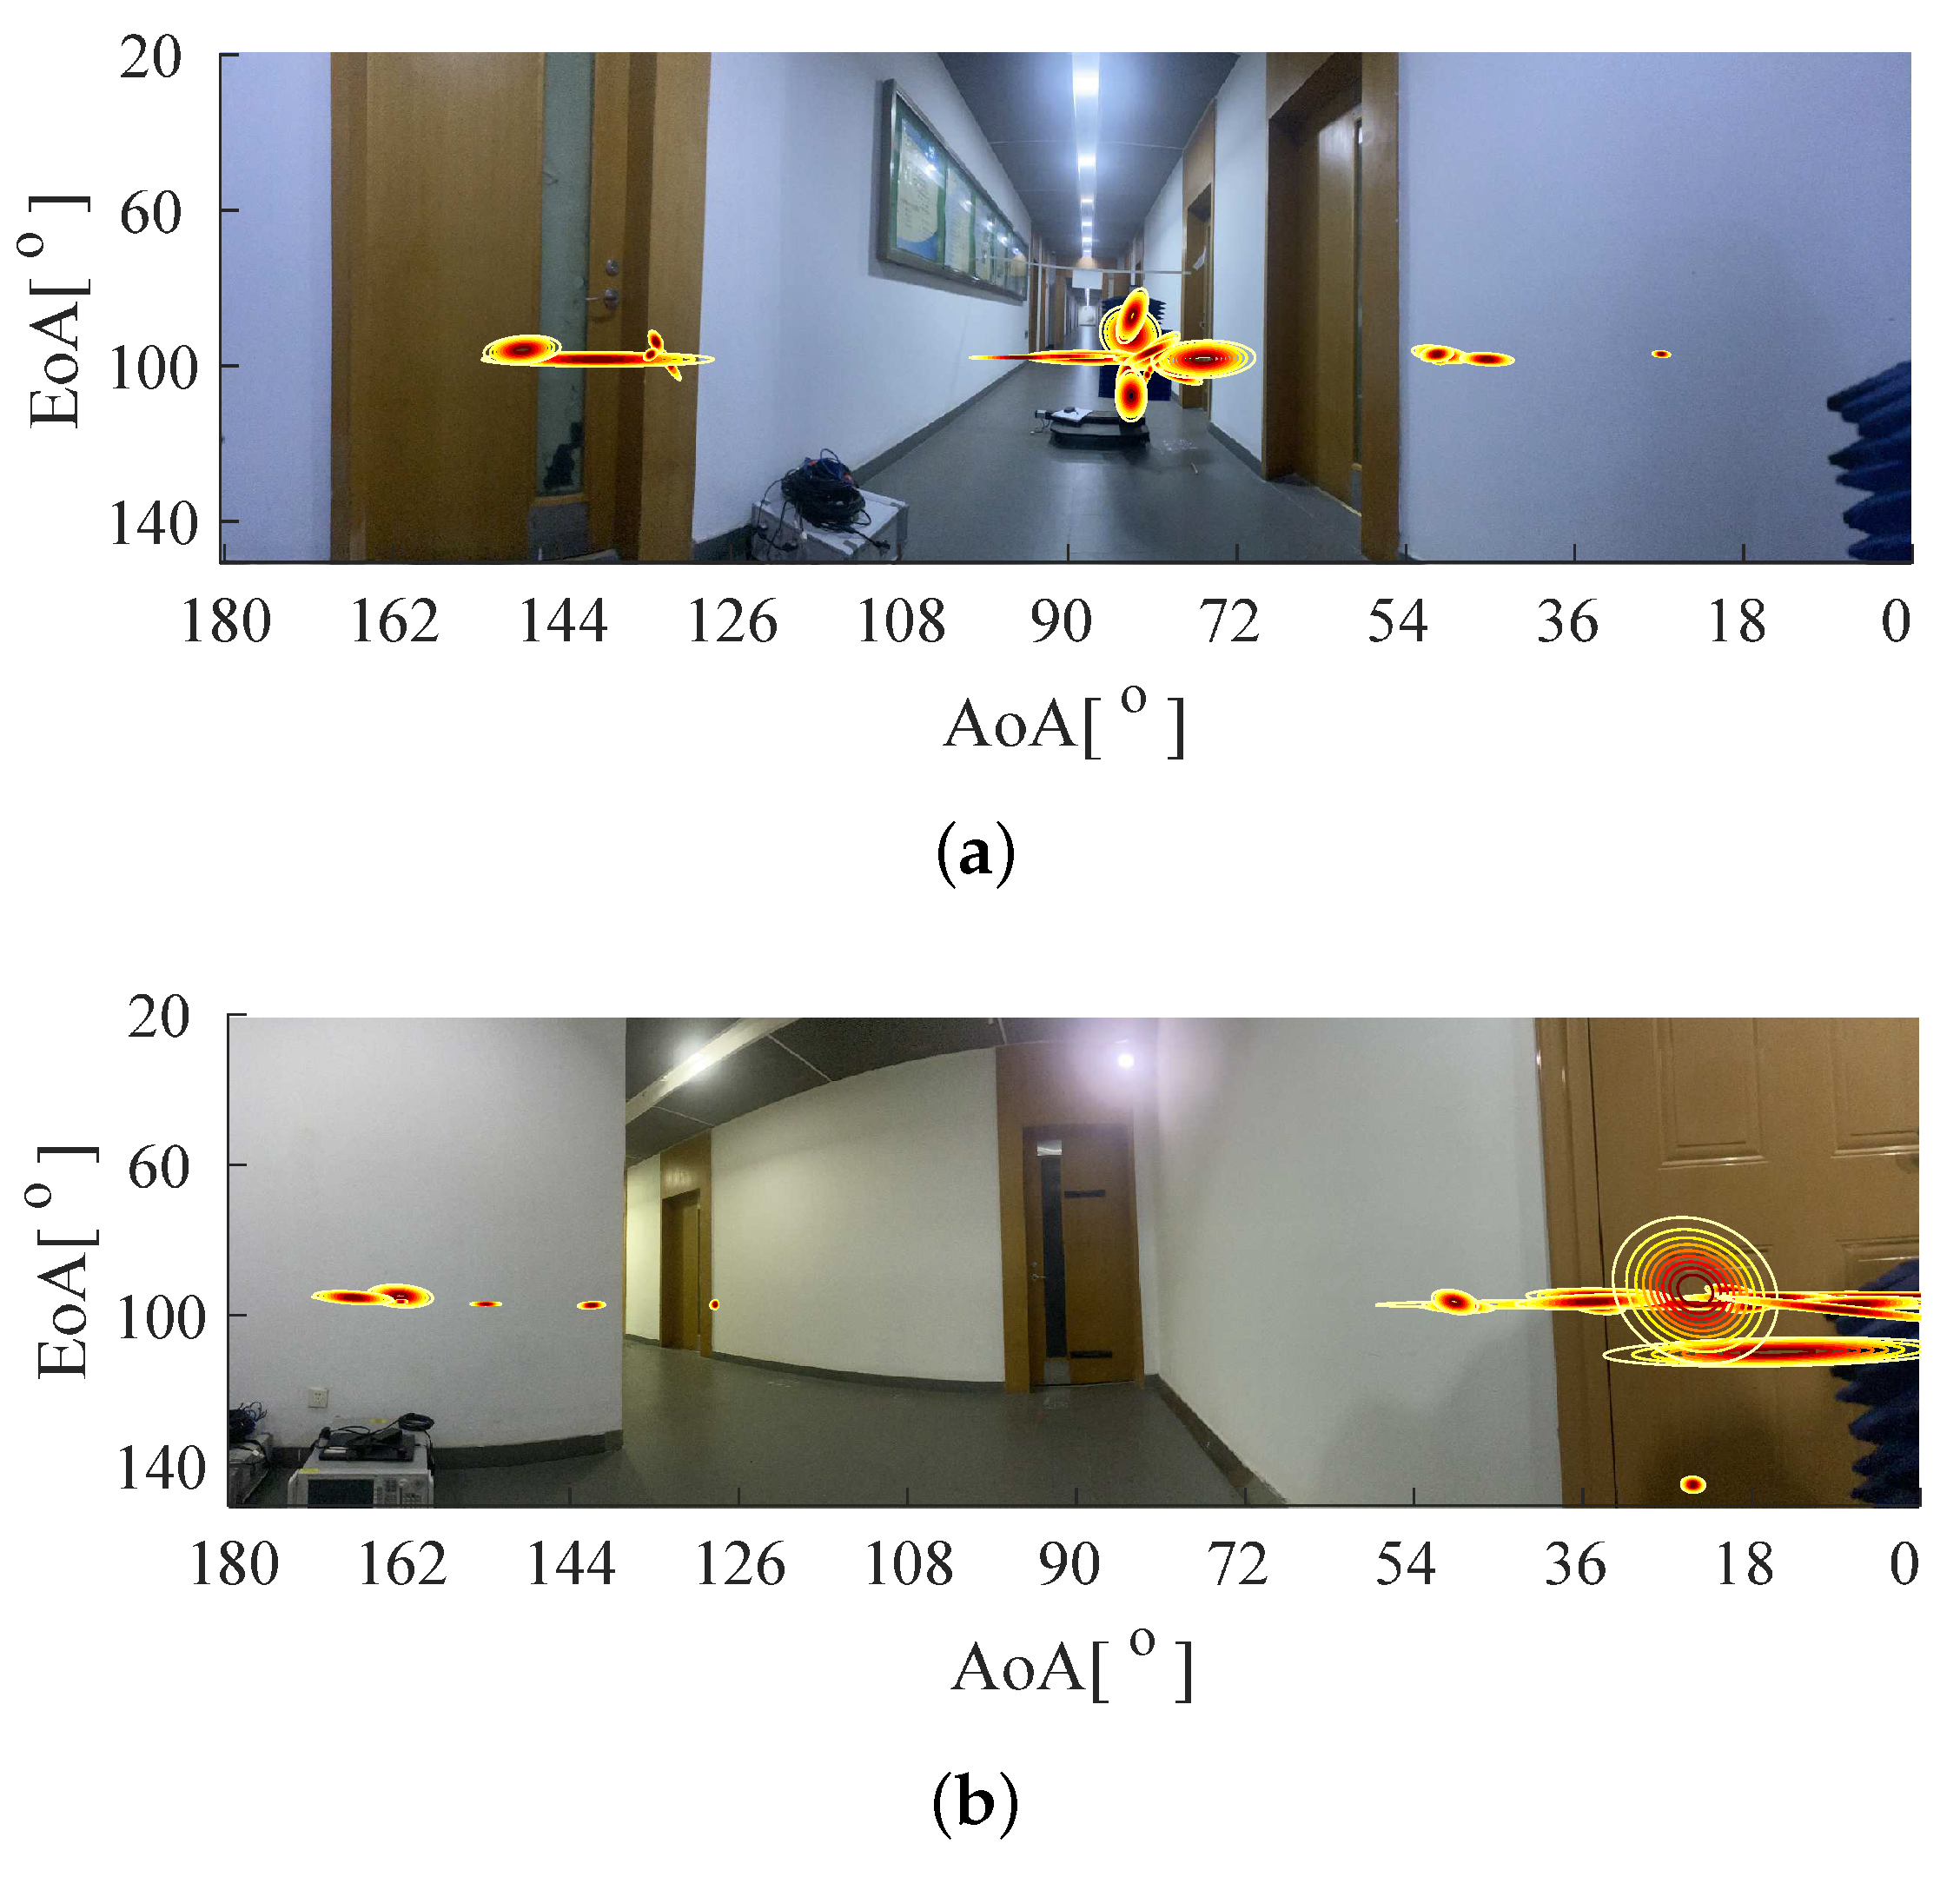
Figure 7a shows the SDSs estimated by GAM-SAGE. The SDSs of GAM with dispersion and inclination in the angular domain can be observed, which indicates that these results can partly reflect the characteristics of clusters. Most of the SDSs exists in the horizontal direction, which may be due to the horizontal direction of the rich scatterers such as the walls, glass sign, and wooden doors. The SDSs with larger angular spreads are observed at around 144 AoA. We infer that the door with a rough surface or a marginal diffraction on the edge of the door, which leads to a larger dispersion in the angular domain, implies that the GAM model may be able to partly describe the scattering and sense the roughness of the scatterer surface. Meanwhile, the GAM results for the NLoS scenario of the corridor is represented in Figure 7b. Similar to the LoS scenario, most of the SDSs also exist in the horizontal direction, which results from the walls along both sides of the Rx array. It is obvious that the spreads of the SDSs are larger than those of the LoS scenario, especially around the AoA 27 . It is our postulation that the SDSs from Wall 4 experienced higher-order bouncing, which led to severe scattering and a larger dispersion in direction. Moreover, the wooden door with a rough surface and a sharp edge on the right part of the Rx array also leads to SDSs with a larger spreading. As mentioned above, we focused on an investigation of the design and performance of the nominal value and the spreads of the AoA and EoA estimators for channel sounding. However, the proposed methods can also be used for the estimation of the nominal value and the spread of the azimuth and elevation of departure when the Tx is equipped with a multi-element array. We assumed that the antenna array was isotropic, which is an ideal condition. However, the GAM-SAGE outperformed the SP-SAGE when the radiation pattern was not applied to data processing, which indicates that the GAM model can partly overcome the non-ideal factor in systems such as the inaccurate radiation pattern and the calibration error, and it can also enhance the robustness of the estimators. Meanwhile, the spreading and shape of the SDS reflect some characteristics of the clusters to some extent, which prevents the procedure of clustering and the statistical errors caused by the different clustering algorithms. Moreover, we found that the GAM model can fit the ELAA channel better than the SP model, and that a better spatial consistency could be achieved. It is our postulation that the GAM model is able to partly reflect the spatial non-stationarity channel for ELAA; thus, we infer that the channel model established by using GAM can be possibly applied to the reproduction of the spatial consistency channel for the ELAA channel.

6. Stochastic SBCM Establishment

In this section, the procedure of modeling for SBCM is introduced, and the channel characteristics using the GAM model is analyzed, including the composite delay/AoA/EoA spreads, inter-SDS delay/AoA/EoA spreads, and the intra-SDS AoA/EoA spread. It is worth noting that the definitions of AoA/EoA spreads are different from their traditional concepts in [37,38], which will be detailed later in this section. In order to obtain the random observation snapshots, spatial smoothing is used to divide the whole antenna array with a 40 × 40 aperture into random sub-arrays with an aperture of 35 × 35 .

6.1. Modeling Procedure for the SBCM

The major steps and modules in this section are similar to their counterparts in conventional SCM/SCME modeling. First, a channel measurement campaign is conducted in the desired environments, and the MIMO channel data are obtained. Then, a High-Resolution Parameter Estimation (HRPE) algorithm derived by the GAM model is applied to obtain the channel parameters, which can be further used to calculate the spreading of the SDSs. Afterwards, composite channel parameters and “cluster-level” parameters are calculated, and the statistics extracted constitute a stochastic SBCM. Here, we propose a new definition for the replacement of the clusters in conventional SCM/SCME, namely the shape and spreading of the SDS being considered in the SBCM. The main differences between the SBCM and the conventional SCM/SCME modeling lie in the following aspects:
  • GAM adopted in channel parameter estimation: One major difference between SBCM modeling and SCM/SCME modeling is that the HRPE algorithm integrated in the GAM model is applied in the former, whereas the SP model is considered for the latter. Consequently, the parameter set [ τ , Ω ¯ Tx , , Ω ¯ Rx , ] for an MPC in the SP model is extended to the [ τ d , ϕ ¯ d , θ ¯ d , σ ϕ ˜ d , σ θ ˜ d , ρ ϕ ˜ d θ ˜ d ] . Thus, GAM can be used to describe the scattering generated by the SDSs, and the results illustrate that the GAM-SAGE outperforms the SP-SAGE in fitting the ELAA channel response and reproducing the spatial consistency.
  • The shape of SDS included in the SBCM: As the shape and spreading of SDS can be naturally obtained with the parameter set [ τ d , ϕ ¯ d , θ ¯ d , σ ϕ ˜ d , σ θ ˜ d , ρ ϕ ˜ d θ ˜ d ] , the shapes, spreading in angular domain, and the number of the SDSs become new elements in addition to the traditional geometrical parameters considered by the SCM. The benefits of including these characteristics into the model are: (1) they allow the dispersion in the angular domain, and (2) spatially consistent properties of the channel are reasonably generated, especially in the case of the ELAAs. Moreover, due to the application of the new definition of the SDS, the clustering step of the SCM/SCME can be omitted.
The key characteristic parameters of the SBCM are tabulated in Table 2. To generate the random channel realizations from an established SBCM, three major stages are performed sequentially, similar to the case of the SCM/SCME. The steps are summarized as follows:
  • Generating the dominant SDS: The dominant SDS can be generated using the dominant SDS parameters modeled in the SBCM. As the dominant SDS is a reference for generating the NLoS SDSs (by using inter-SDS parameter offsets, as indicated in Section 6.4), some parameters of the dominant SDS, such as the nominal AoA, nominal EoA, and delay, should be included in the model.
  • Generating the NLoS SDSs: The inter-SDS offsets are used to generate the delay, nominal AoA, and nominal EoA. Then, the intra-SDS spreads and the correlation coefficients are applied in order to reproduce the shape of the SDS. The power of the SDSs can be allocated by the inter-SDS power offsets. It is worth noting that the power allocation must satisfy the K-factor.
  • Generating the overall channel response: The overall channel response can be obtained by the summation of the responses reconstructed using the NLoS and LoS SDSs.

6.2. Composite Delay, AoA, EoA Spreads, and the K-factor

Similar to the SCM/SCME, the composite channel parameters, such as the root mean square (RMS) delay spread, azimuth, and elevation angular spreads, should be calculated in the model establishment. These spreads can be obtained as follows:
σ τ d = τ 2 ¯ τ ¯ 2 ,
τ 2 ¯ = d = 1 D α d 2 ( τ d ) 2 d = 1 D α d 2 , τ ¯ = d = 1 D α d 2 τ d d = 1 D α d 2 ,
with D being the total number of SDSs estimated in one snapshot; the composite angular spread can be calculated as follows:
σ ( · ) = 2 log | d D exp ( · ) | α d | 2 d D | α d | 2 |
where ( · ) can be replaced with ϕ ¯ d , θ ¯ d , and the statistics of these composite spreads are calculated based on their values from multiple measurement snapshots obtained in the environments of the same typical type. Then, in order to obtain the ratio of the power of the dominant SDS to the power of the rest of the SDSs, the parameter named K-factor is calculated as follows:
K = p 1 d = 2 D p d , with p d = | α d | 2 ,
A larger K indicates that the power of the dominant SDS accounts for a large proportion of the total power of the channel.
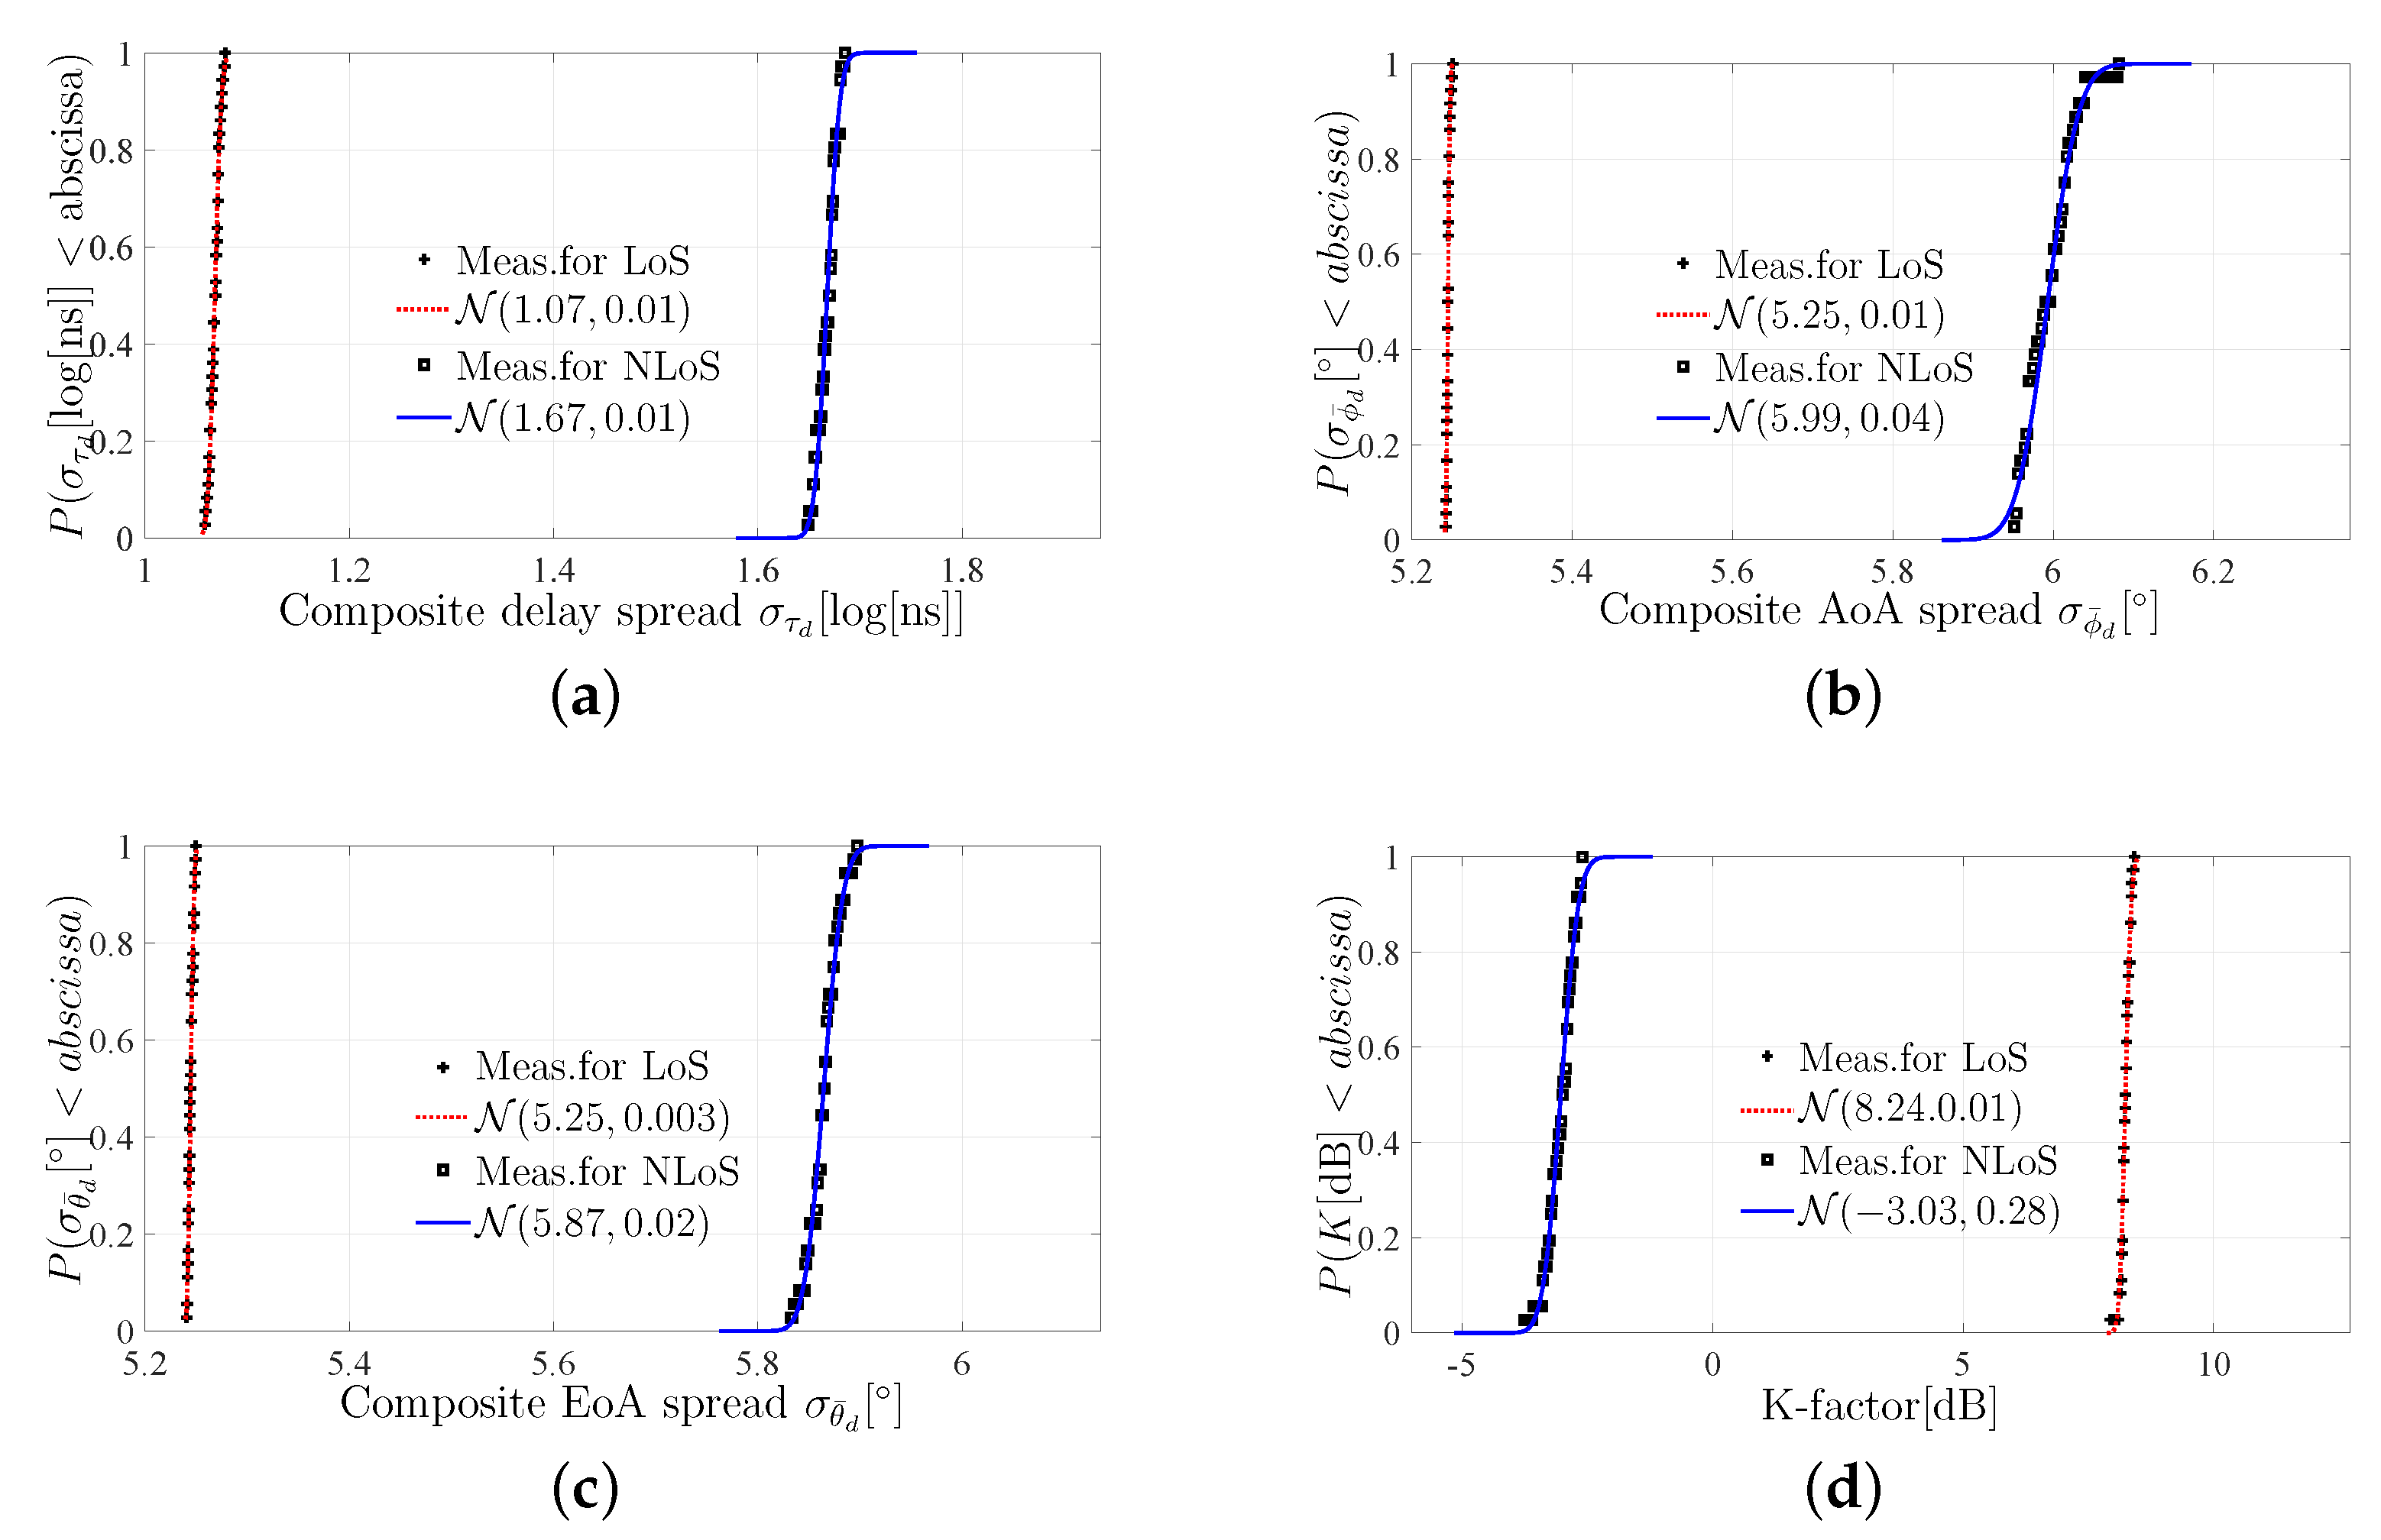
By comparing these Cumulative Distribution Functions (CDFs), it can be observed that in general, the distribution of the spreads and the K-factors observed at different Rx positions are distinct in different environments. This implies that it is necessary to model the LoS and NLoS scenarios separately. More specifically, the variance of the composite delay spread, as shown in Figure 8a, is observed to be small regardless of the Rx positions in both the LoS and NLoS scenarios. This is reasonable since most of the SDSs are generated by the walls of the corridor along both sides of the Rx array, and these SDSs of both the LoS and NLoS scenarios have a similar distribution in random snapshots, which leads to the similar composite delay spread. The mean of the composite delay spread is larger in the NLoS scenario than that in the LoS, implying that the NLoS has a larger composite delay spread and discrete SDSs. We conclude that the strong LoS path exists in the channels of the LoS scenario, and most of the energy is concentrated in a small delay range, which leads to a small composite delay spread. A similar conclusion can be applied to the analysis of the composite AoA and EoA spreads, respectively, as illustrated in Figure 8b,c. It can be seen that the mean of the K-factor for the LoS scenario is larger than that for the NLoS scenario in Figure 8d. It is our postulation that the larger K-factor in the LoS was caused by the LoS path with strong power; thus, this phenomenon is reasonable. The random samples were fitted by the normal distribution, which fit well, indicating that the samples can be generated by normal distribution after obtaining the channel model.

6.3. Intra-Cluster AoA, EoA Spread, and the Correlation Coefficient between Slight Deviations of AoA and EoA

For convenience, the “cluster” is redefined as the SDS in SBCM, and the intra-cluster parameter spreads and inter-cluster parameter offsets in [28,38] are replaced by the intra-SDS parameter spreads and inter-SDS parameter offsets. The intra-SDS AoA and EoA spreads are denoted with σ ϕ ˜ and σ θ ˜ , respectively. The empirical CDFs and the fitting distributions for the samples of the AoA and EoA spreads are respectively illustrated in Figure 9a,b. The normal distribution is used to fit the CDF curves of the intra-SDS AoA and EoA spreads, and they fit very well. We can observe that the mean and variance of the distribution for the intra-SDS AoA spread of the NLoS scenario is larger than that of the LoS scenario. We conclude that the SDS of NLoS with a larger intra-SDS AoA spread and the larger variance imply that the SDS of the NLoS scenario has a stronger randomness in the horizontal direction, which is also certified by Figure 7a,b. It is our postulation that the multipaths of the SDS experience have high-order bouncing and stronger scattering, which lead to the SDS with variant spreading. The mean of the intra-SDS EoA spread of the LoS is larger than that of the NLoS, implying that the size of the cluster in the LoS scenario in the vertical direction is larger than that in the NLoS scenario in the vertical direction. Moreover, the mean of the intra-SDS AoA spread in the NLoS scenario is larger than the intra-SDS EoA spread in the NLoS scenario. We infer that the clusters generated by the walls have a stronger scattering in the horizontal direction than that in the vertical direction, which leads to a larger spread in the horizontal direction. It is also caused by the radiation pattern of the antenna with a higher gain in the horizontal direction. Moreover, Figure 9c shows the correlation coefficient CDF between the intra-SDS AoA and EoA spreads. We can observe that the distributions of the correlation coefficients for the LoS are similar to those in the NLoS scenario. We conclude that the walls and wooden doors play a dominant role in generating the multipaths of the SDSs in both the LoS and NLoS scenarios, which leads to similar correlation coefficients.

6.4. Inter-SDS AoA, EoA, and Power Offsets

The inter-SDS parameters in the SBCM, such as the delay offsets, nominal AoA ϕ ¯ d , and EoA θ ¯ d intervals of the SDSs, as well as the power offsets were utilized to deploy the SDSs with a delay in the angular domain, and in order to determine their powers relative to the dominant SDS. The inter-cluster parameter offsets are defined as Δ ( · ) = ( · ) d ( · ) 1 , where ( · ) d can be replaced by the nominal ϕ ¯ , nominal θ ¯ , τ , and the power of SDS, except for the dominant component; the ( · ) 1 can be replaced by the nominal ϕ ¯ , nominal θ ¯ , τ , and the power of the dominant SDS. The inter-SDS delay, AoA, and EoA offsets do not have the obvious distributions, implying that most of the SDSs are generated by the walls on both sides of the corridor, which leads to partly deterministic characteristics. If more types of corridors are measured to obtain more random snapshots, the better the statistic distribution can be observed. However, the inter-SDS power offsets obey a normal distribution, as Figure 10 illustrates; we thus conclude that the statistic bouncing order happened on the SDSs, which led to the statistical power of the SDSs. Furthermore, the inter-SDS power offsets of the LoS scenario are larger than those of the NLoS scenario. We infer that the LoS path has a stronger power, which leads to the larger inter-SDS power offsets in the LoS scenario. Meanwhile, the exemplary SBCM are established and the mean and variance of the distribution for different parameters are summarized in the Table 3.

7. Conclusions

In this work, a signal model using the GAM methodology for describing the non-stationarity caused by the summation of the dispersive “sub-paths” generated by the SDSs in the angular domain was proposed. Based on the signal model, we derived an algorithm designed to mitigate the impact of the model mismatch on channel estimation caused by SP assumptions, namely the GAM-SAGE. The performance of the GAM-SAGE was evaluated through the likelihood function, the accuracy of the reconstructed components, and the spatial consistency. The results indicated that the GAM-SAGE outperforms the SP-SAGE, especially in reproducing the spatial consistency. Moreover, the results obtained by the GAM-SAGE can be used to establish the measurement-based stochastic models with spatial consistency. The practical applicability of this method was proven by the measurement-based results. Furthermore, two exemplary SBCMs were established based on measurements in LoS and NLoS indoor scenarios with a 40 × 40 ELAA at a carrier frequency of 40 GHz. Different from the conventional SCM/SCME, the definition of the clusters was replaced by the SDSs, which can be used to accurately reproduce the ELAA channels with spatial consistency. Thus, the GAM-SAGE was proven to be a useful tool for the efficient processing of extensive channel measurement data, especially for developing stochastic channel models capable of achieving spatially consistent results. Accurate propagation channel models established for various ELAA scenarios are essential for the design and performance evaluation of transceiver algorithms and for network deployment optimization.

Author Contributions

All of the authors have significantly contributed to this paper. G.J. contributed to the formal analysis, investigation, methodology, visualization, software, and writing the original draft of this paper. J.H. was enormously dedicated to data curation and visualization. X.Y. was involved in the research conceptualization, funding acquisition as well as project administration, and also provided the resources and supervision for the research. J.R.-P. contributed to the review and editing and the conceptualization. In addition, Z.Y. contributed to the investigation and methodology. All the authors participated in the review and editing of the paper. All authors have read and agreed to the published version of the manuscript.

Funding

This work was supported by the National Natural Science Foundation of China (NSFC) under Grant No. 61971313 and the Ministry Of Science and Technology (MOST) of China under Grant No. QN2022133003L.

Data Availability Statement

Not applicable.

Acknowledgments

The authors would like to thank their colleagues at the Sino-German Center of Intelligent Systems in Tongji University.

Conflicts of Interest

The authors declare no conflict of interest.

References

  1. Rappaport, T.S.; Sun, S.; Mayzus, R.; Zhao, H.; Azar, Y.; Wang, K.; Wong, G.N.; Schulz, J.K.; Samimi, M.; Gutierrez, F. Millimeter Wave Mobile Communications for 5G Cellular: It Will Work! IEEE Access 2013, 1, 335–349. [Google Scholar] [CrossRef]
  2. Wang, J.; Wang, C.X.; Huang, J.; Wang, H.; Gao, X. A General 3D Space-Time-Frequency Non-Stationary THz Channel Model for 6G Ultra-Massive MIMO Wireless Communication Systems. IEEE J. Sel. Areas Commun. 2021, 39, 1576–1589. [Google Scholar] [CrossRef]
  3. Xiao, M.; Mumtaz, S.; Huang, Y.; Dai, L.; Li, Y.; Matthaiou, M.; Karagiannidis, G.K.; Björnson, E.; Yang, K.; Chih-Lin, I.; et al. Millimeter Wave Communications for Future Mobile Networks. IEEE J. Sel. Areas Commun. 2017, 35, 1909–1935. [Google Scholar] [CrossRef] [Green Version]
  4. Ma, Z.; Ai, B.; He, R.; Zhong, Z.; Yang, M. A Non-Stationary Geometry-Based MIMO Channel Model for Millimeter-Wave UAV Networks. IEEE J. Sel. Areas Commun. 2021, 39, 2960–2974. [Google Scholar] [CrossRef]
  5. Andrews, J.G.; Buzzi, S.; Choi, W.; Hanly, S.V.; Lozano, A.; Soong, A.C.K.; Zhang, J.C. What Will 5G Be? IEEE J. Sel. Areas Commun. 2014, 32, 1065–1082. [Google Scholar] [CrossRef]
  6. Wang, W.Q.; Zheng, Z. Hybrid MIMO and Phased-Array Directional Modulation for Physical Layer Security in mmWave Wireless Communications. IEEE J. Sel. Areas Commun. 2018, 36, 1383–1396. [Google Scholar] [CrossRef]
  7. Haneda, K.; Khatun, A.; Dashti, M.; Laitinen, T.A.; Kolmonen, V.; Takada, J.; Vainikainen, P. Measurement-Based Analysis of Spatial Degrees of Freedom in Multipath Propagation Channels. IEEE Trans. Antennas Propag. 2013, 61, 890–900. [Google Scholar] [CrossRef]
  8. Haneda, K.; Omaki, N.; Imai, T.; Raschkowski, L.; Peter, M.; Roivainen, A. Frequency-Agile Pathloss Models for Urban Street Canyons. IEEE Trans. Antennas Propag. 2016, 64, 1941–1951. [Google Scholar] [CrossRef]
  9. Liu, F.; Masouros, C.; Li, A.; Sun, H.; Hanzo, L. MU-MIMO Communications With MIMO Radar: From Co-Existence to Joint Transmission. IEEE Trans. Wirel. Commun. 2018, 17, 2755–2770. [Google Scholar] [CrossRef]
  10. Ni, W.; Dong, X. Hybrid Block Diagonalization for Massive Multiuser MIMO Systems. IEEE Trans. Commun. 2016, 64, 201–211. [Google Scholar] [CrossRef]
  11. Yin, X.; Ouyang, L.; Wang, H. Performance Comparison of SAGE and MUSIC for Channel Estimation in Direction-Scan Measurements. IEEE Access 2016, 4, 1163–1174. [Google Scholar] [CrossRef]
  12. Li, J.; Ai, B.; He, R.; Yang, M.; Wang, Q.; Zhang, B.; Zhong, Z. Cluster-Based 3-D Channel Modeling for Massive MIMO in Subway Station Environment. IEEE Access 2018, 6, 6257–6272. [Google Scholar] [CrossRef]
  13. Ma, Z.; Ai, B.; He, R.; Wang, G.; Niu, Y.; Yang, M.; Wang, J.; Li, Y.; Zhong, Z. Impact of UAV Rotation on MIMO Channel Characterization for Air-to-Ground Communication Systems. IEEE Trans. Veh. Technol. 2020, 69, 12418–12431. [Google Scholar] [CrossRef]
  14. Fleury, B. First- and second-order characterization of direction dispersion and space selectivity in the radio channel. IEEE Trans. Inf. Theory 2000, 46, 2027–2044. [Google Scholar] [CrossRef]
  15. Besson, O.; Stoica, P. Decoupled estimation of DOA and angular spread for a spatially distributed source. IEEE Trans. Signal Process. 2000, 48, 1872–1882. [Google Scholar] [CrossRef]
  16. Alshammari, A.; Albdran, S.; Ahad, M.A.R.; Matin, M. Impact of angular spread on massive MIMO channel estimation. In Proceedings of the 2016 19th International Conference on Computer and Information Technology (ICCIT), Shenzhen, China, 18–19 April 2016; pp. 84–87. [Google Scholar] [CrossRef]
  17. Han, Y.; Wang, J.; Song, X.; Zhang, Y. Joint Estimation of the Central Direction of Arrival and Angular Spread for Distributed Source Based on Beamspace Propagator. In Proceedings of the 2006 6th World Congress on Intelligent Control and Automation, Dalian, China, 21–23 June 2006; Volume 1, pp. 1693–1696. [Google Scholar] [CrossRef]
  18. Iwase, S.; Kikuma, N.; Sakakibara, K. Angular Spread Estimation of MIMO Radar Using Transmission Beam Diversity. In Proceedings of the 2018 IEEE International Workshop on Electromagnetics: Applications and Student Innovation Competition (iWEM), Nagoya, Japan, 29–31 August 2018; p. 1. [Google Scholar] [CrossRef]
  19. Asztely, D.; Ottersten, B. The effects of local scattering on direction of arrival estimation with MUSIC and ESPRIT. In Proceedings of the 1998 IEEE International Conference on Acoustics, Speech and Signal Processing, ICASSP ’98 (Cat. No.98CH36181), Seattle, DC, USA, 12–15 May 1998; Volume 6, pp. 3333–3336. [Google Scholar] [CrossRef]
  20. Fleury, B.H.; Tschudin, M.; Heddergott, R.; Dahlhaus, D.; Ingeman Pedersen, K. Channel parameter estimation in mobile radio environments using the SAGE algorithm. IEEE J. Sel. Areas Commun. 1999, 17, 434–450. [Google Scholar] [CrossRef]
  21. Richter, A. On the Estimation of Radio Channel Parameters: Models and Algorithms (RIMAX); Dissertation: ISLE Blacksburg, VA, USA, 2005. [Google Scholar]
  22. Shutin, D.; Fleury, B.H. Sparse Variational Bayesian SAGE Algorithm With Application to the Estimation of Multipath Wireless Channels. IEEE Trans. Signal Process. 2011, 59, 3609–3623. [Google Scholar] [CrossRef] [Green Version]
  23. Chong, C.; Laurenson, D.; Tan, C.; McLaughlin, S.; Beach, M.; Nix, A. Joint detection-estimation of directional channel parameters using the 2-D frequency domain SAGE algorithm with serial interference cancellation. In Proceedings of the 2002 IEEE International Conference on Communications. Conference Proceedings, ICC 2002 (Cat. No.02CH37333), New York, NY, USA, 28 April–2 May 2002; Volume 2, pp. 906–910. [Google Scholar] [CrossRef] [Green Version]
  24. Noschese, M.; Babich, F.; Comisso, M.; Marshall, C. Multi-Band Time of Arrival Estimation for Long Term Evolution (LTE) Signals. IEEE Trans. Mob. Comput. 2021, 20, 3383–3394. [Google Scholar] [CrossRef]
  25. Ji, Y.; Hejselbæk, J.; Fan, W.; Pedersen, G.F. A Map-Free Indoor Localization Method Using Ultrawideband Large-Scale Array Systems. IEEE Antennas Wirel. Propag. Lett. 2018, 17, 1682–1686. [Google Scholar] [CrossRef] [Green Version]
  26. Ji, Y.; Fan, W.; Pedersen, G.F. Channel Characterization for Wideband Large-Scale Antenna Systems Based on a Low-Complexity Maximum Likelihood Estimator. IEEE Trans. Wirel. Commun. 2018, 17, 6018–6028. [Google Scholar] [CrossRef] [Green Version]
  27. Zhang, N.; Yin, X.; Tian, L.; Duan, W.; Boqué, S.R. Performance evaluation of interference cancellation using a generalized-array-manifold model. In Proceedings of the 2014 IEEE 25th Annual International Symposium on Personal, Indoor, and Mobile Radio Communication (PIMRC), Washington, DC, USA, 2–5 September 2014; pp. 670–675. [Google Scholar] [CrossRef]
  28. Universal Mobile Telecommunications System (UMTS); Spatial Channel Model for Multiple Input Multiple Output (MIMO) Simulations (V16.0.0; 3GPP TR 25.996 Version 16.0.0 Release 16); European Telecommunications Standards Institute: Headquarters, French, 2010.
  29. Meinilä, J.; Kyösti, P.; Jämsä, T.; Hentilä, L. WINNER II Channel Models. In Radio Technologies and Concepts for IMT-Advanced; Wiley: Hoboken, NJ, USA, 2010. [Google Scholar] [CrossRef]
  30. Liu, L.; Oestges, C.; Poutanen, J.; Haneda, K.; Vainikainen, P.; Quitin, F.; Tufvesson, F.; Doncker, P.D. The COST 2100 MIMO channel model. IEEE Wirel. Commun. 2012, 19, 92–99. [Google Scholar] [CrossRef] [Green Version]
  31. Zhu, M.; Eriksson, G.; Tufvesson, F. The COST 2100 Channel Model: Parameterization and Validation Based on Outdoor MIMO Measurements at 300 MHz. IEEE Trans. Wirel. Commun. 2013, 12, 888–897. [Google Scholar] [CrossRef] [Green Version]
  32. Carton, I.; Fan, W.; Kyösti, P.; Pedersen, G.F. Validation of 5G METIS map-based channel model at mmwave bands in indoor scenarios. In Proceedings of the 2016 10th European Conference on Antennas and Propagation (EuCAP), Davos, Switzerland, 10–15 April 2016; pp. 1–5. [Google Scholar] [CrossRef]
  33. Kim, J.G.; Lim, J.T. MAP-Based Channel Estimation for MIMO–OFDM Over Fast Rayleigh Fading Channels. IEEE Trans. Veh. Technol. 2008, 57, 1963–1968. [Google Scholar] [CrossRef]
  34. Yin, X.; Wang, S.; Zhang, N.; Ai, B. Scatterer Localization Using Large-Scale Antenna Arrays Based on a Spherical Wave-Front Parametric Model. IEEE Trans. Wirel. Commun. 2017, 16, 6543–6556. [Google Scholar] [CrossRef]
  35. Yin, X.; Cheng, X. Measurement-based Statistical Channel Modeling. In Propagation Channel Characterization, Parameter Estimation, and Modeling for Wireless Communications; Wiley: Hoboken, NJ, USA, 2016; pp. 236–259. [Google Scholar] [CrossRef]
  36. Yin, X.; Ling, C.; Kim, M.D. Experimental Multipath-Cluster Characteristics of 28-GHz Propagation Channel. IEEE Access 2015, 3, 3138–3150. [Google Scholar] [CrossRef]
  37. Cai, X.; Zhang, G.; Zhang, C.; Fan, W.; Li, J.; Pedersen, G.F. Dynamic Channel Modeling for Indoor Millimeter-Wave Propagation Channels Based on Measurements. IEEE Trans. Commun. 2020, 68, 5878–5891. [Google Scholar] [CrossRef]
  38. Study on Channel Model for Frequencies From 0.5 to 100 GHz; document 3GPP TR 38.901 V17.0.0; ETSI: Sophia Antipolis Cedex, France, 2022.
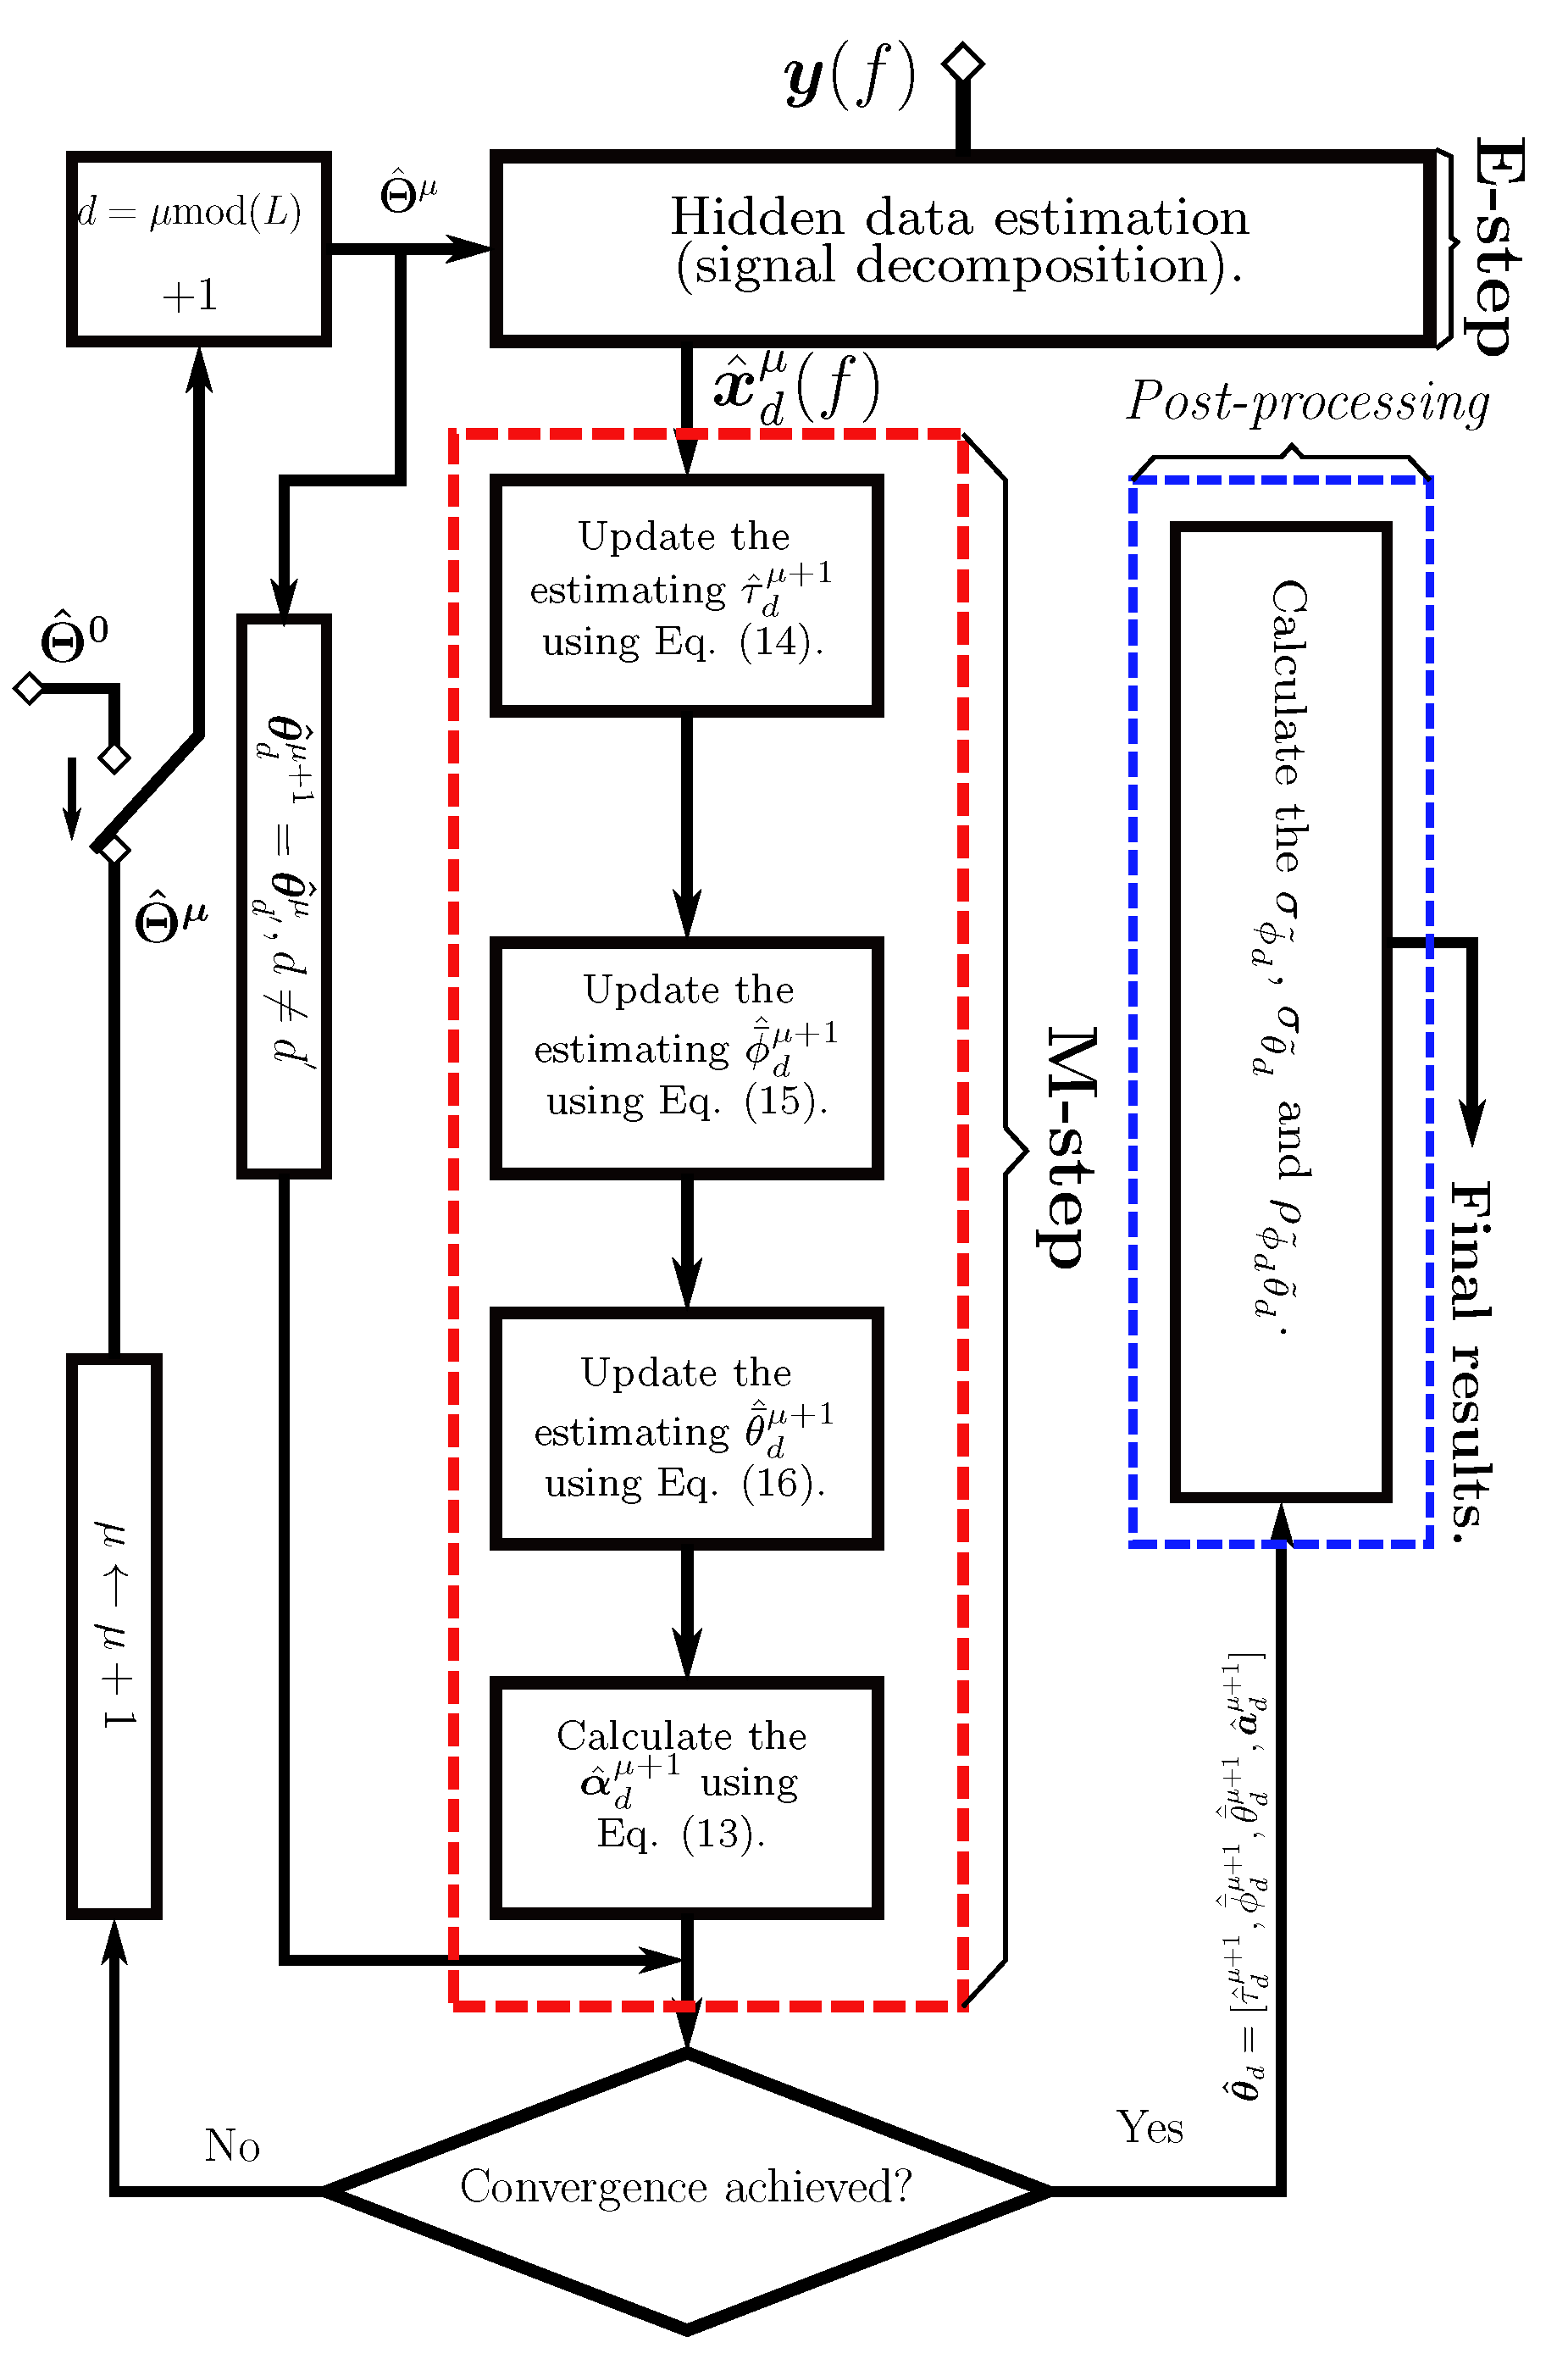
Figure 1. Flow chart of the GAM-SAGE.
Electronics 11 03442 g001
Figure 2. Examples of diagrams of the angular spreading of an SDS by simulation. (a) The SDS with same σ θ ˜ d σ ϕ ˜ d , and with ρ ϕ ˜ d θ ˜ d = 0 . (b) The SDS with larger σ θ ˜ d smaller σ ϕ ˜ d , and with ρ ϕ ˜ d θ ˜ d = 0 . (c) The SDS with same σ θ ˜ d σ ϕ ˜ d , and with ρ ϕ ˜ d θ ˜ d = 0.6 . (d) The SDS with same σ θ ˜ d σ ϕ ˜ d , and with ρ ϕ ˜ d θ ˜ d = 0.95 .
Electronics 11 03442 g002
Figure 3. A 3D sketch and photographs of the measurement scenarios; the direction of view are marked in Figure 3a by the arrows. (a) A 3D digital layout of the corridor scenario. (b) Photograph of the corridor scenario (LoS) from the Rx view. (c) Photograph of the corridor scenario (LoS) from the Tx view. (d) Photograph of the corridor scenario (NLoS) from the Rx view. (e) Photograph of the corridor scenario (NLoS) from the Tx view.
Electronics 11 03442 g003
Figure 4. Likelihood functions of the SP-SAGE and the GAM-SAGE for the different paths and iterations in the LoS and NLoS scenarios. (a) Log-likelihood functions with different paths in the LoS scenario. (b) Log-likelihood functions with different paths in the NLoS scenario. (c) Log-likelihood functions with different iterations in the LoS scenario. (d) Log-likelihood functions with different iterations in the NLoS scenario.
Electronics 11 03442 g004
Figure 5. Power delay profiles and reconstructed paths using the GAM and the specular-path model. (a) Reconstructed power delay profile using the GAM for the LoS scenario. (b) Reconstructed power delay profile using the GAM for the NLoS scenario. (c) Reconstructed power delay profile using the specular-path model for the LoS scenario. (d) Reconstructed power delay profile using the specular-path model for the NLoS scenario.
Electronics 11 03442 g005
Figure 6. Channel similarity index with the number of elements in the planar array for the specular-path model and the GAM for SDSs. (a) Channel similarity index of the specular-path model and the GAM for the SDSs in the LoS scenarios. (b) Channel similarity index of the specular-path model and the GAM for the SDSs in the NLoS scenarios.
Electronics 11 03442 g006
Figure 7. Results estimated by the GAM-SAGE. (a) Results estimated by the GAM-SAGE in the LoS scenario. (b) Results estimated by the GAM-SAGE in the NLoS scenario.
Electronics 11 03442 g007
Figure 8. CDFs of the distributions of the composite channel parameter spreads in the LoS and NLoS scenarios. (a) Composite delay spread. (b) Composite AoA spread. (c) Composite EoA spread. (d) K-factor.
Electronics 11 03442 g008
Figure 9. CDFs of the distributions of the intra-SDS parameter spreads in the LoS and NLoS scenarios. (a) Intra-SDS AoA spread. (b) Intra-SDS EoA spread. (c) Correlation coefficient.
Electronics 11 03442 g009
Figure 10. CDFs of the distributions of the inter-SDS power offsets in the LoS and NLoS scenarios.
Electronics 11 03442 g010
Table 1. Corridor SIMO Measurement configuration.
Antenna ConfigurationMeasurement VNA ConfigurationVirtual Array Configuration
Antenna typeBi-conicalFrequency range (GHz)36–40Type of array2D planar array
Gain (dBi)4Frequency points1001Space Interval (mm)3.75
PolarizationVerticalTransmitted power (dBm)0Number of elements 40 × 40
Table 2. Model parameters constituting the SBCM and SCM/SCME.
ModelSBCMSCM/SCME
Category
Composite-level characteristicsDelay spread, AoA spread, EoA spread, K-factor
Cluster-level
characteristics
SDS number, correlation coefficientCluster number
Intra-SDS ϕ ¯ Tx / Rx spread,
θ ¯ Tx / Rx spread
Intra-cluster ϕ Tx / Rx spread,
θ Tx / Rx spread
Inter-SDS ϕ ¯ Tx / Rx offsets,
θ ¯ Tx / Rx offsets
Inter-cluster ϕ Tx / Rx offsets,
θ Tx / Rx offsets
Dominant component parametersDelay, (nominal) ϕ ¯ Tx / Rx , (nominal) θ ¯ Tx / Rx , power
Table 3. Parameters of the exemplary SBCMs of the corridor.
Composite Channel Parameters
ScenariosDistributionLoSNLoS
Parameters
Composite delay spread  [ log 10 ( [ s ] ) ]Normal μ 1.07 μ 1.67
σ 0.01 σ 0.01
Composite AoA spread  ( )Normal μ 5.25 μ 5.59
σ 0.01 σ 0.04
Composite EoA spread  ( )Normal μ 5.25 μ 5.87
σ 0.003 σ 0.02
Number of SDSs-2035
K-factor(dB)Normal μ 8.24 μ −3.03
σ 0.01 σ 0.28
Cluster-level channel parameters
Intra-SDS AoA spread
 [ log 10 ( [ ] ) ]
Normal μ −0.08 μ 0.21
σ 0.42 σ 0.53
Intra-SDS EoA spread
 [ log 10 ( [ ] ) ]
Normal μ 0 μ −0.34
σ 0.43 σ 0.51
Correlation coefficientNormal μ 0.02 μ 0.02
σ 0.41 σ 0.38
Inter-SDS delay offsets  (ns)- μ 17.48 μ 46.33
σ 22.37 σ 60.58
Inter-SDS AoA offsets  ( )- μ 22.16 μ 39.37
σ 22.40 σ 52.51
Inter-SDS EoA offsets  ( )- μ 2.13 μ 4.19
σ 2.29 σ 10.86
Inter-SDS power offsets (dB)Normal μ 32.78 μ 9.04
σ 16.84 σ 7.59
Dominant-SDS parameters- τ d = 9.04  (ns) ϕ ¯ d = 85 . 19 τ d = 25.20  (ns) ϕ ¯ d = 25 . 51
θ ¯ d = 91 . 19 P = 61.25  (dB) θ ¯ d = 89 . 28 P = 79.23  (dB)
Publisher’s Note: MDPI stays neutral with regard to jurisdictional claims in published maps and institutional affiliations.