Article

Research on Co-Estimation Algorithm of SOC and SOH for Lithium-Ion Batteries in Electric Vehicles

1
Hubei Key Laboratory of Advanced Technology for Automotive Components, Wuhan University of Technology, Wuhan 430070, China
2
Hubei Collaborative Innovation Center for Automotive Components Technology, Wuhan University of Technology, Wuhan 430070, China
3
Dongfeng Commercial Vehicle Technical Center of DFCV, Wuhan 430056, China
*
Author to whom correspondence should be addressed.
Electronics 2022, 11(2), 181; https://doi.org/10.3390/electronics11020181
Submission received: 9 December 2021 / Revised: 31 December 2021 / Accepted: 5 January 2022 / Published: 7 January 2022
(This article belongs to the Special Issue Intelligent Energy Management System for Electric Vehicles)

Abstract

:
The accurate estimation of the state of charge (SOC) and state of health (SOH) is of great significance to energy management and safety in electric vehicles. To achieve a good trade-off between real-time capability and estimation accuracy, a collaborative estimation algorithm for SOC and SOH is presented based on the Thevenin equivalent circuit model, which combines the recursive least squares method with a forgetting factor and the extended Kalman filter. First, the parameter identification accuracy is studied under a dynamic stress test (DST) and the federal urban driving schedule (FUDS) test at different ambient temperatures (0 °C, 25 °C, and 45 °C). Secondly, the FUDS test is used to verify the SOC estimation accuracy. Thirdly, two batteries with different aging degrees are used to validate the proposed SOH estimation algorithm. Subsequently, the accuracy of the SOC estimation algorithm is studied, considering the influence of updating the SOH. The proposed SOC estimation algorithm can achieve good performance at different ambient temperatures (0 °C, 25 °C, and 45 °C), with a maximum error of less than 2.3%. The maximum error for the SOH is less than 4.3% for two aged batteries at 25 °C, and it can be reduced to 1.4% after optimization. Furthermore, calibrating the capacity as the SOH changes can effectively improve the SOC estimation accuracy over the whole battery life.

1. Introduction

Rising energy costs and tightening regulations on exhaust emissions of ground vehicles emphasize the need for electric vehicles (EVs) [1]. With the expansion of EVs, the application of lithium-ion batteries in automobiles has seen explosive growth. The battery system is a key component of electric vehicles as it affects their power, economy, and safety [2,3,4]. The performance of lithium-ion batteries depends not only on the battery performance itself but also on accurate state estimation, and the state of charge (SOC) and state of health (SOH) are the most important aspects of this. For a plug-in hybrid electric vehicle (PHEV), the state estimation of the battery is critical for the vehicle’s energy management strategy [5].
The SOC is defined as the ratio of the current remaining capacity of a battery to its available capacity. Several methods of estimating the SOC have been proposed thus far, such as the Coulomb counting method (CCM), open-circuit voltage (OCV) method, artificial neural network method, and model-based method. The Coulomb counting method calculates the remaining capacity of the battery by integrating the current and time, but the estimation accuracy decreases during operation due to cumulative errors. The OCV method obtains the SOC by mapping the relationship between SOC and OCV. This method can achieve high estimation accuracy, but the battery has to rest for several hours, which is not suitable in practical applications [6]. In [7], the initial SOC was obtained by the OCV method, and the SOC was then estimated by the Coulomb counting method based on capacity and Coulombic efficiency modification. Under constant current conditions, the estimation error was less than 5%. However, in the changeable conditions of electric vehicles, the error of this method would be further enlarged, and the problem of cumulative error would remain unsolved. An artificial neural network (ANN) can be used to obtain the SOC as the output by training on a large amount of battery operation data. The back-propagation neural network (BPNN) is a commonly used ANN. In [8], a BPNN composed of five neurons and two hidden layers was introduced to estimate the SOC of Li-ion batteries using different drive profiles and ambient temperatures. The maximum SOC error was 3.5% under the US06 test at 25 °C. In [9], a radial basis function neural network was used to measure the parameter uncertainties and improve the parameter accuracy. The maximum SOC error was under 2% in series-connected batteries. The ANN method has high accuracy in SOC estimation, but this algorithm is complex and highly dependent on training data, so it cannot meet the requirements of a real-time system. Plett [10,11,12] used the extended Kalman filter (EKF) for the first time to estimate the SOC. Subsequently, many scholars studied deuterogenic algorithms based on the Kalman filter for SOC estimation, including the extended fractional Kalman filter, correntropy EKF, and improved EKF [13,14,15]. These methods combine the CCM and the OCV method, and they possess the advantages of real-time performance, good computational efficiency, and good estimation accuracy. In recent years, they have been gradually applied in battery management systems.
The SOH is used to reflect the aging degree of a battery, which is usually expressed by the ratio of the current available capacity of the aged battery to its nominal capacity. It is generally considered that the battery reaches the end of its life when the current available capacity decreases to 80% of the initial capacity or the current internal resistance is two times the initial internal resistance. SOH estimation methods mainly include the experience-based method, electrochemical-model-based method, equivalent-circuit-model-based method, and curve-characteristic-based method [16,17]. The experience-based method uses a large number of aging experiments to obtain the battery aging characteristics. In [18], the effects of temperature, discharge depth, and discharge rate on battery aging were studied, and an aging model for batteries was established. This method relies on a large number of experiments designed to reflect the actual use of the battery as far as possible. The electrochemical-model-based method reflects the changes in battery characteristics by describing the physical and chemical reactions during the use of the battery. In [19], the changes in thermodynamic factors, diffusion coefficient, and lattice parameters during battery aging were studied, and an electrochemical SOH estimation method was proposed. As the aging process of batteries is affected by a variety of factors, and there is a coupling relationship between the factors, an accurate electrochemical aging model is complex [20,21,22]. The equivalent-circuit-model-based method evaluates the SOH of a battery by identifying parameters such as ohmic resistance in the equivalent circuit model. The curve-characteristic-based method evaluates the SOH by studying the time-varying characteristic of the OCV curve. In [23], an SOH estimation model was established using a Gaussian regression process, and the OCV range, which has sensitive characteristic parameters, was quantified. This method has great estimation accuracy, but the conditions of low current and specific range variation are unlikely to be met in practical applications.
Based on the aforementioned studies, the SOC and SOH should be considered at the same time, because their coupling relationship will allow for mutual improvement of SOC and SOH estimation accuracy. In [24], an equivalent circuit model was used to construct an EKF-based SOC and SOH estimation algorithm. However, the existence of multiple state observers increased the computing burden for online applications, and the increase in data dimensions in the calculation process reduced the stability of the system, which would be likely to lead to divergence. In [25], the author proposed a SOC and SOH joint estimation algorithm using state estimators and offline data; this method requires a lot of data to make sure the algorithm converges. The current estimation methods with high accuracy also have high calculation cost, which is not suitable for embedded systems. Therefore, this study proposes an accurate and real-time algorithm to estimate the SOC and SOH in vehicle battery management systems.
The remainder of the paper is organized as follows: Section 2 describes the experiment setup; Section 3 introduces the Thevenin equivalent circuit model and explains how the model parameters were acquired; Section 4 presents the co-estimation algorithm; Section 5 discusses the results of the co-estimation algorithm; and Section 6 offers the conclusions.

2. Experiment

2.1. Test Bench and Battery

The experiment test bench consisted of: (1) 18,650 cylindrical lithium-ion batteries provided by Huizhou EVE Energy Co. Ltd, the parameters of which are listed in Table 1; (2) a fixture for clamping a battery; (3) a temperature chamber with a temperature range of −40 °C to 100 °C and a control accuracy of 1 °C; (4) a Neware BTS4002 battery test station, which was used to provide current profiles with a range of −10 to 10 A and measure signals in a voltage range of 0 to 5 V and a current range of −10 to 10 A, where the errors of current, voltage, and temperature measurement are less than 0.2%; and (5) a host computer with Neware software used to set and monitor the battery test station.
The schematic of the battery test under different ambient temperatures is shown in Figure 1. The battery was clamped in a fixture and placed inside the temperature chamber, which provided a stable ambient temperature. The battery test station was connected to the clamping fixture and a host computer using sample cables and Ethernet cable, respectively.

2.2. Static Capacity Test
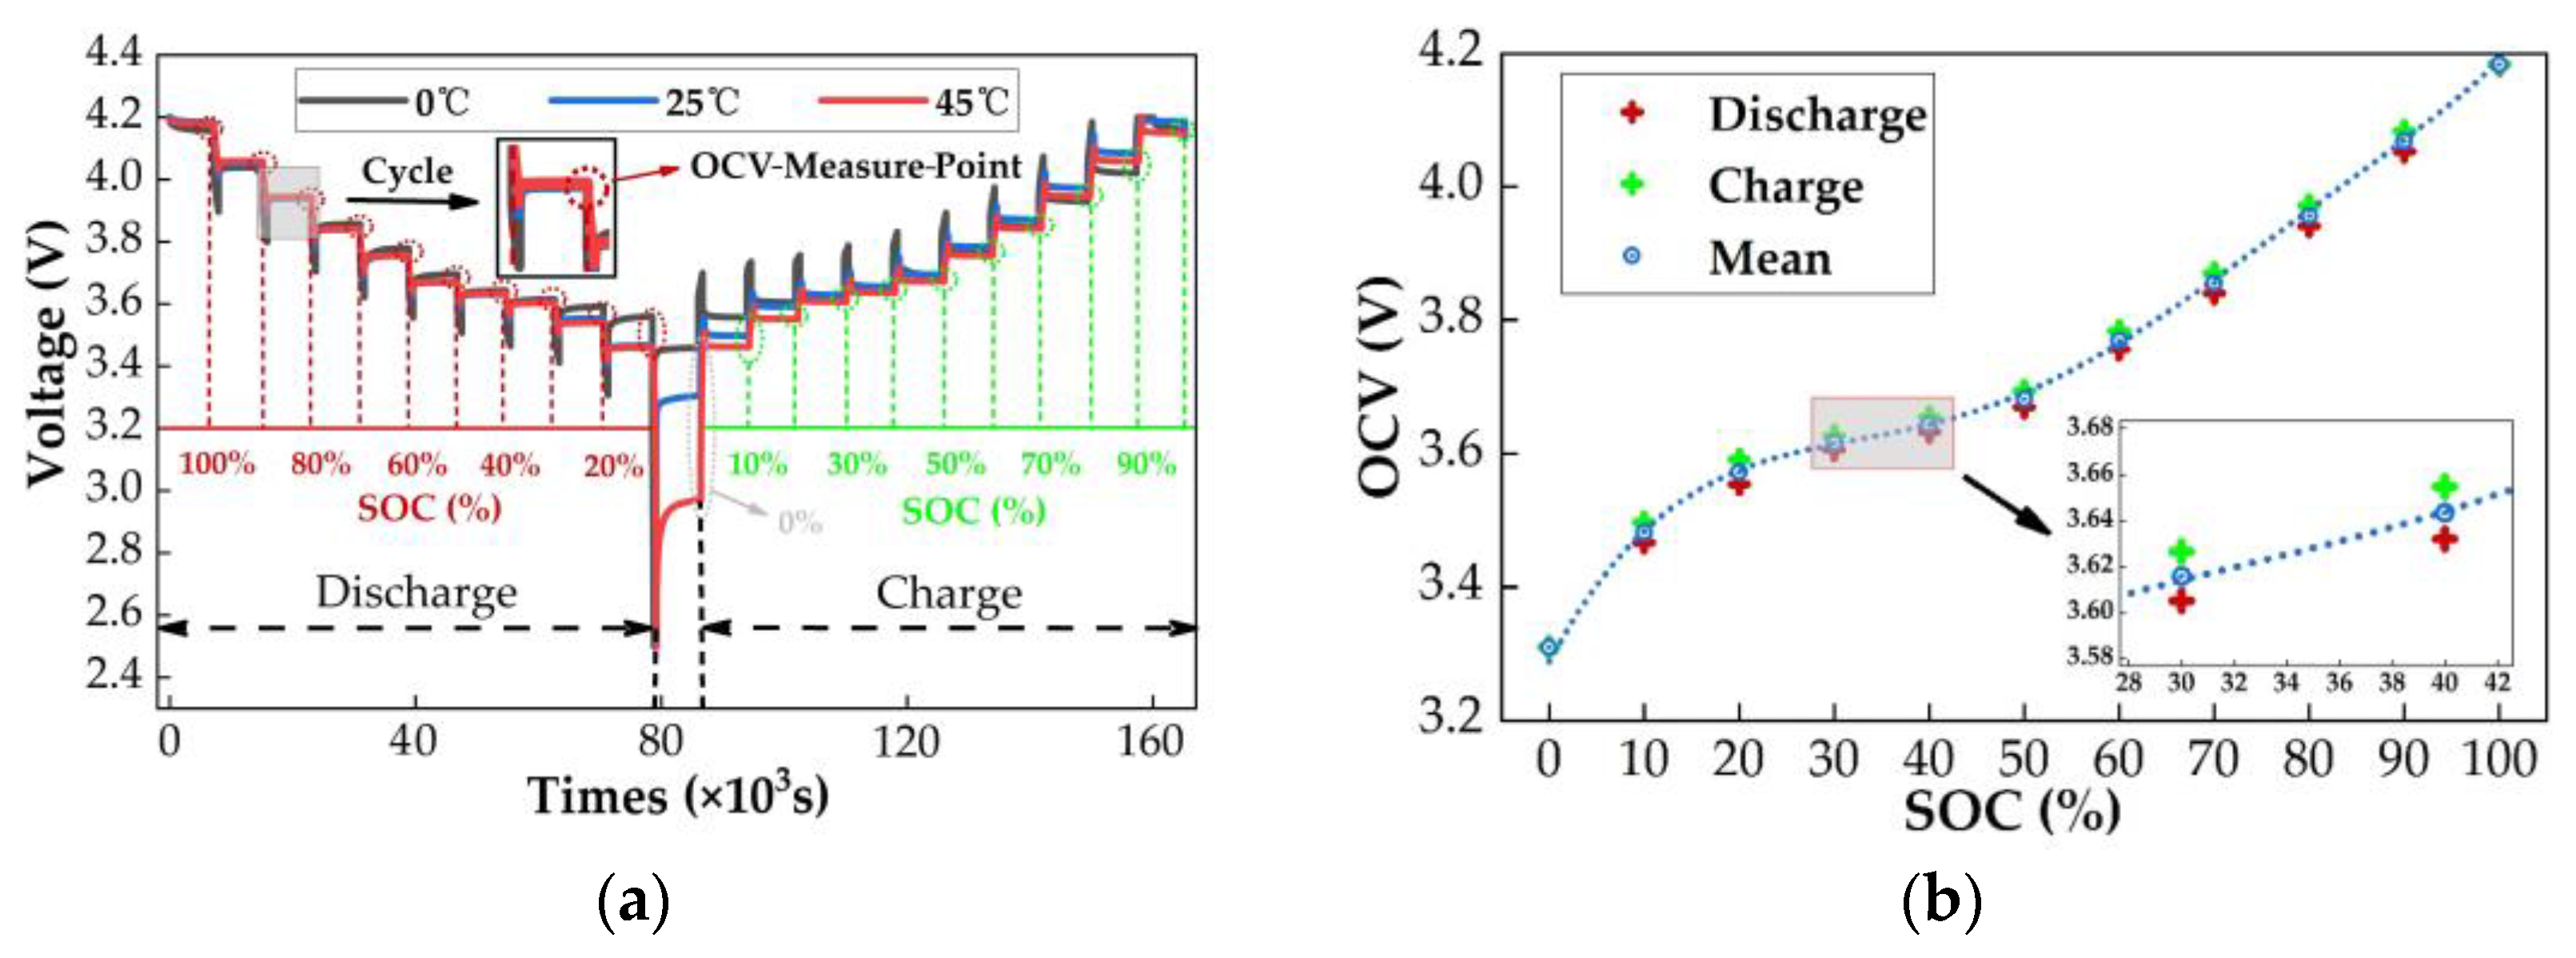
Static capacity, which has a strong relationship with aging and ambient temperature, is an important parameter of batteries. In this study, static capacity was obtained at different aging stages and ambient temperatures (0 °C, 25 °C, and 45 °C) via the following steps. Step 1: discharge the battery to discharge cut-off voltage (2.5 V) and allow the battery to stand for 2 h to reach thermodynamic equilibrium. Step 2: charge the battery to charge cut-off voltage (4.2 V) using the constant current (CC) and constant voltage (CV) method at the specific ambient temperature. In the CC stage, charge the battery using a constant current with 1/2 C rate (about 1 A) until the voltage reaches the charge cut-off voltage (4.2 V). Then switch to the CV stage. In the CV stage, reduce the current from 1/2 C to 1/25 C (about 0.08 A), keeping the voltage at 4.2 V, and then relax it for 2 h. Step 3: discharge the battery with a constant current of 1 C rate (about 2 A) and calculate the capacity released from the battery. Step 4: repeat step 2 and step 3 twice. If the maximum error of the three test results is less than 2% of the nominal capacity, take the mean capacity measured in the three experiments as the static capacity of the battery; otherwise, check the experimental setup and retry the experiment.

2.3. SOC–OCV Test

The open-circuit voltage (OCV) represents the voltage difference between the positive and negative poles of the battery after reaching thermodynamic equilibrium [26]. Studies show that the OCV is a function of the SOC. The incremental test and the low current test are commonly used to obtain SOC–OCV curves. In this study, the incremental test was used to acquire the SOC–OCV curves as follows. Step 1: first charge the battery to 100% SOC using the CC–CV method at a specific ambient temperature and then rest it for 2 h. Step 2: discharge the battery with constant current of 1 C rate until the SOC has decreased by 10%, then rest it for 2 h. Repeat the process of discharge and resting eleven times until the battery is discharged to the discharge cut-off voltage (2.5 V). Step 3: charge the battery with a constant current of 1 C rate until the SOC has increased by 5%, then rest it for 2 h. Repeat the process of discharge and resting ten times until the battery is charged to the charge cut-off voltage (4.2 V).

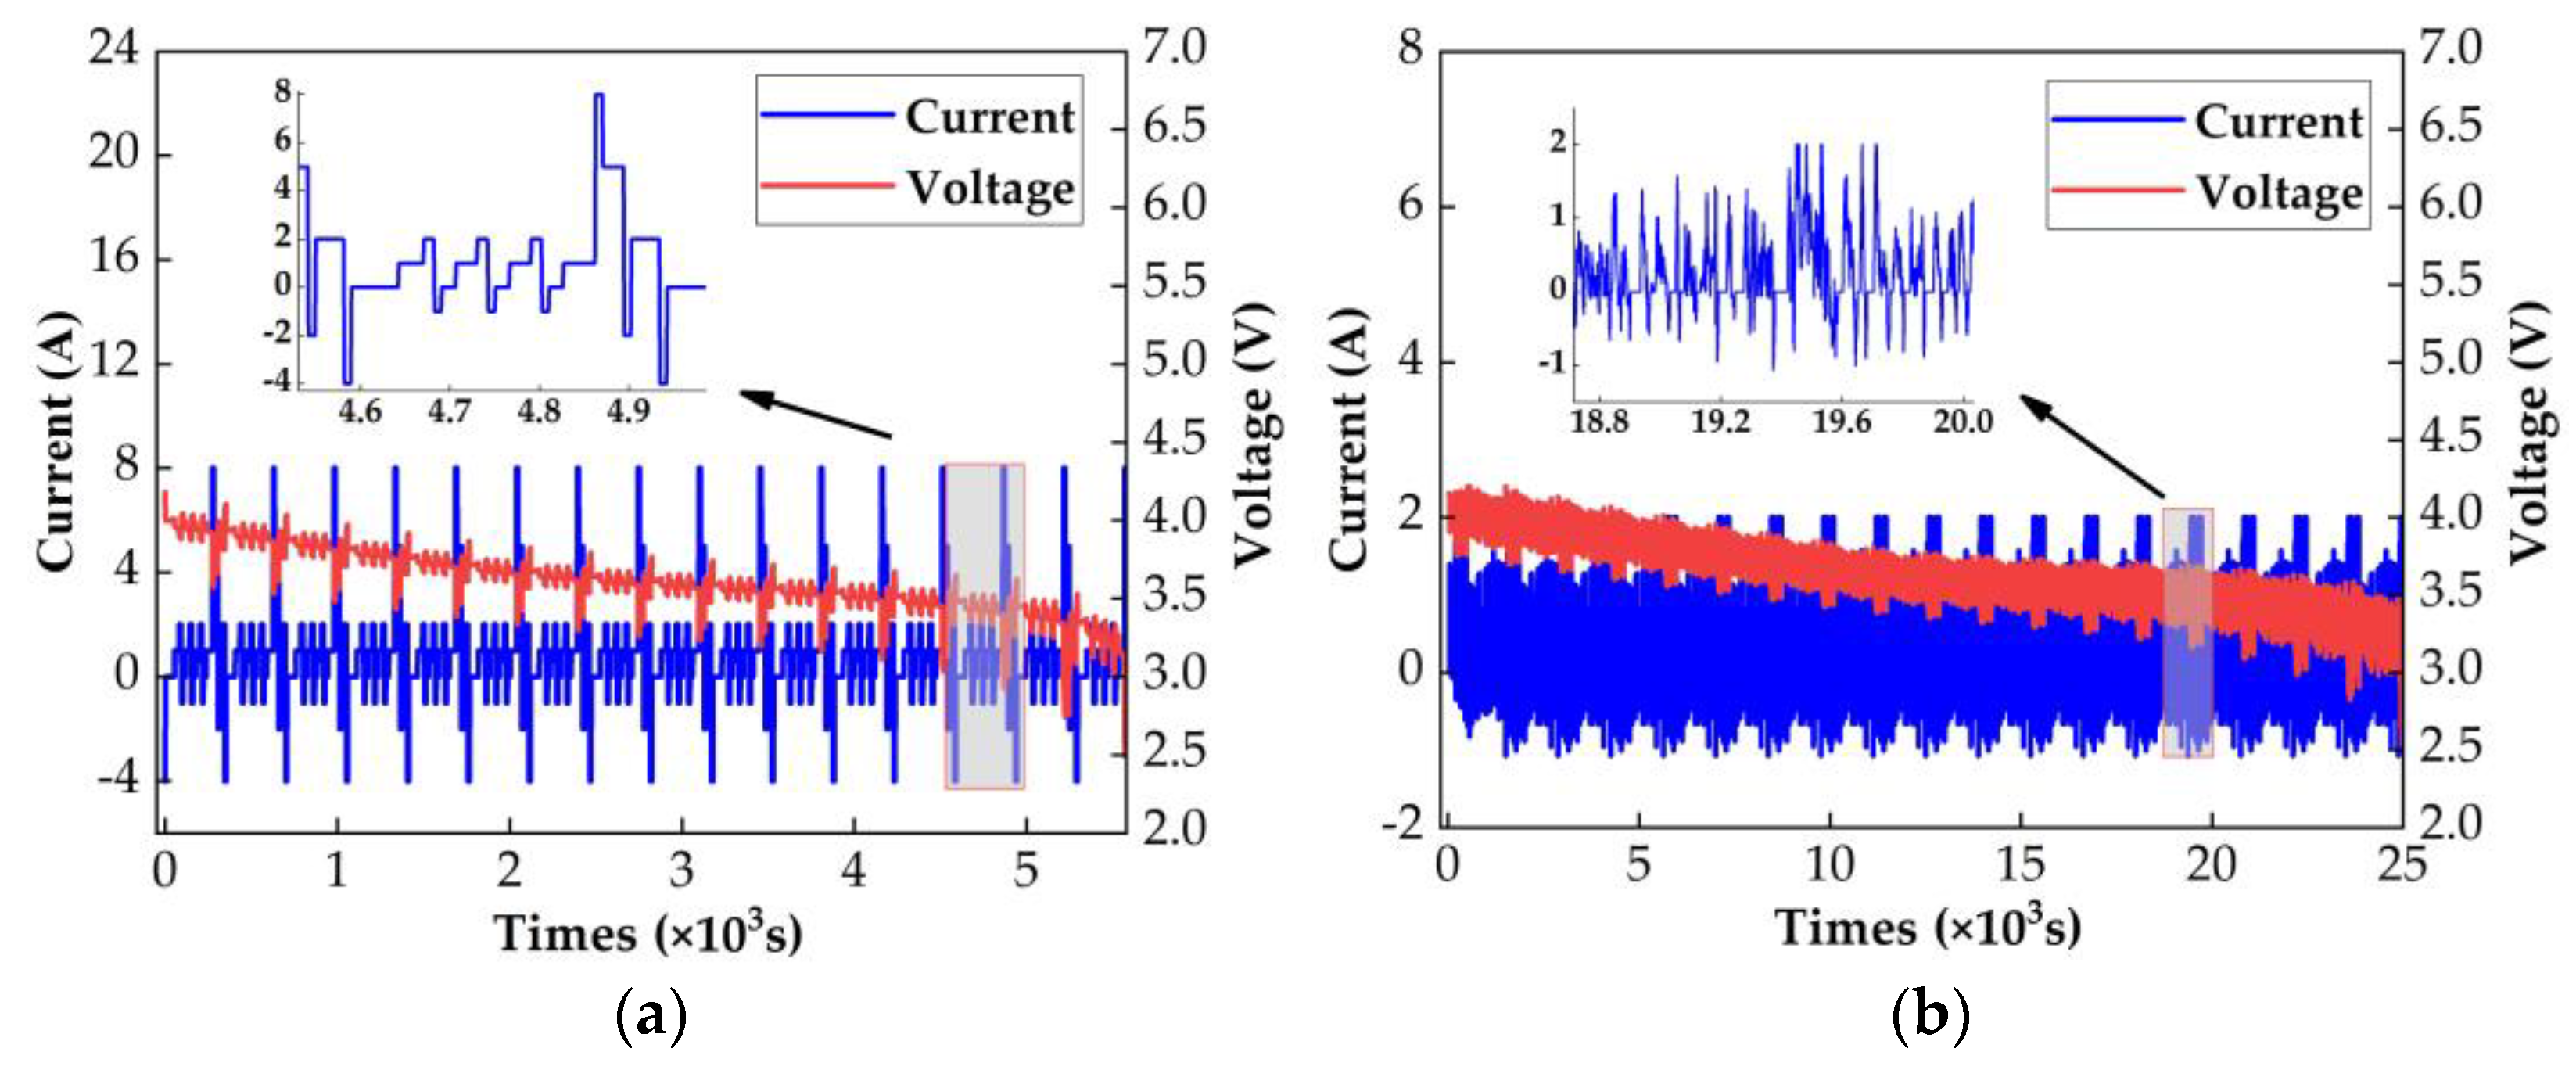
2.4. DST and FUDS Tests

To verify the performance of the proposed algorithm, two typical variable power discharge tests, namely, the dynamic stress test (DST) and the federal urban driving schedule (FUDS) test were conducted, which were both combined with the characteristic vehicle driving process.
The DST test profile is a series of constant power discharge and charge steps, each lasting for 360 s. It was used to validate the parameter identification algorithm of the battery model in this study. The whole test process is illustrated in Figure 2a.
The FUDS test profile, a standard test profile in the automobile industry, involves applying a dynamic load for 1372 s. Compared with the DST test profile, the FUDS test profile shows more dynamic power changes and is closer to real working conditions. It was used to validate the performance of the joint estimation algorithm for SOC and SOH in this study. The FUDS test process is shown in Figure 2b.

3. Battery Model

3.1. Equivalent Circuit Model

The equivalent circuit model describes the external characteristics of a battery through the electrical components. Establishing the equivalent circuit model is the basis of developing state estimation algorithms. There are two main considerations when establishing a model. First, the basic function of the equivalent circuit model is to reflect the response of the battery accurately when a dynamic current is applied. Secondly, the equivalent circuit model should have reasonable complexity to ensure the real-time performance of the algorithm in battery management systems. The Rint model, Thevenin model, second-order resistor–capacitance circuit (RC) model, and PNGV model are widely used. In [27], the complexity and accuracy of each model were evaluated based on the Akaike information criterion, and the results showed that the Thevenin model achieved accurate modeling of the battery with less RC network structure, which is suitable for embedded hardware with limited computation resource. Therefore, the Thevenin model was selected in this study, consisting of an ideal voltage source, an ohmic resistance, and an RC network. The schematic of the model is shown in Figure 3, and the equation describing the model is given as Equation (1).
{ d U p d t = U p C p R p + I C p U L = U o c v I R 0 U p
where Uocv is the OCV, R0 is the ohmic resistance, Rp is the polarization resistance, Cp is the polarization capacitance, the polarization network composed of Rp and Cp is used to describe the polarization effect of the battery, UL is the battery terminal voltage, and I is the current (the negative value represents the charge state in this paper). The SOC can be defined as in Equation (2).
S O C ( t ) = S O C ( t 0 ) 1 C t 0 t η i I ( t ) d t
where SOC(t) is the SOC of the battery at time t, SOC(t0) is the initial value of the SOC at time t0, C is the available capacity under the current state, ηi is the Coulombic efficiency when the current is i, and I(t) is the current at time t. The state space equation and the observation equation of the Thevenin model can be achieved by discretizing Equations (1) and (2) as follows:
[ S O C k + 1 U p , k + 1 ] = [ 1 0 0 e Δ t τ ] [ S O C k U p , k ] + [ η i Δ t C R p ( 1 e Δ t τ ) ] i k
U L , k = O C V ( S O C k ) i k R 0 U p , k
where Δt is the sampling period, τ is the value of the time constant (which is equal to the product of Rp and Cp), and OCV(SOCk) is the mapping relationship between SOC and OCV at time k.

3.2. Model Parameters

The accuracy of the model parameters is of great importance in ensuring the reliability of the battery model. The parameters that must be identified include OCV, R 0 , R P , and C P . In this study, the function of the OCV and SOC was identified by polynomial curve fitting, and the other parameters were identified by the recursive least squares method with a forgetting factor (FFRLS).

3.2.1. SOC–OCV Curve

The SOC–OCV test results at different temperatures are shown in Figure 4a. In this test, the OCV for discharge and charge at different SOC values were acquired. The test was composed of 21 cycles, and each cycle contained a discharge or charge process to decrease or increase the SOC by 10% and rest the battery for 2 h. When the battery reached a stable state after the 2 h rest, the terminal voltage was regarded as the OCV. It can be seen that the voltage undergoes a rebound process during the rest period after discharge, and the amplitude of the rebound voltage is smaller at normal temperatures (25 °C and 45 °C) than at low temperature (0 °C) in the 0–20% SOC range. This is mainly because the high temperature promotes the electrochemical reaction of the battery, allowing it to release more energy during the discharging process. The OCV in the charging process is larger than in the discharging process due to the hysteresis effect; therefore, the mean values of the OCV were used to acquire the SOC–OCV curves. In this study, MATLAB software was used to perform the sixth-order polynomial fitting of the experimental data. Figure 4b shows the fitting process for the SOC–OCV curve at 25 °C, and SOC–OCV curves at different temperatures are shown in Figure 4c,d. It can be observed that the SOC–OCV curve varies at different ambient temperatures. Taking the SOC–OCV curve obtained at 25 °C as a reference, the greatest difference between these SOC–OCV curves can be found in the range of SOC below 20%, where the SOC–OCV curve becomes lower as the ambient temperature increases.

3.2.2. RLS Algorithm with Forgetting Factor

The recursive least squares (RLS) method is an online parameter identification method developed on the basis of adaptive filtering theory, and it is suitable for cases in which the system model parameters are easily affected by external input and are difficult to determine. The system equations are shown in Equations (5)–(7).
y k = Φ k T θ k + e k
Φ k = [ 1 U L , k 1 i k i k 1 ]
θ k = [ ( 1 a 1 ) U o c v , k a 1 a 2 a 3 ]
where yk is the output observation value of the system at time k, Φ k T is the data matrix of the system at time k, θk is the system parameter matrix to be identified at time k, ek is the system error at time k, and ik is the system input at time k. The cost function is defined in Equation (8). The aim of RLS is to minimize the cost function. The parameter estimation equation is shown in Equation (9).
J ( θ ) = ( y k Φ k T θ k ) T ( y k Φ k T θ k )
θ ^ k = ( Φ k T Φ k ) 1 Φ k y k
where θ ^ k is the estimated value of the system parameter matrix to be identified at time k.
FFRLS introduces a forgetting factor into RLS, which can reduce past data information and strengthen new data information, effectively avoid data saturation, and improve the accuracy of model parameter identification. The recursive equations are shown in Equations (10)–(12).
θ ^ k = θ ^ k 1 + K k e k
K k = P k 1 Φ k λ + Φ k T P k 1 Φ k
P k = P k 1 K k Φ k T P k 1 λ
where Kk is the gain matrix of the algorithm at time k, Pk is the covariance matrix calculated at time k, and λ is the forgetting factor, which is generally between 0.95 and 1 according to experience. The identification parameters can be analyzed as shown in Equation (13).
{ R 0 = a 3 a 2 1 + a 1 R p = 2 ( a 1 a 2 + a 3 ) 1 a 1 2 C p = ( 1 + a 1 ) 2 4 ( a 1 a 2 + a 3 )

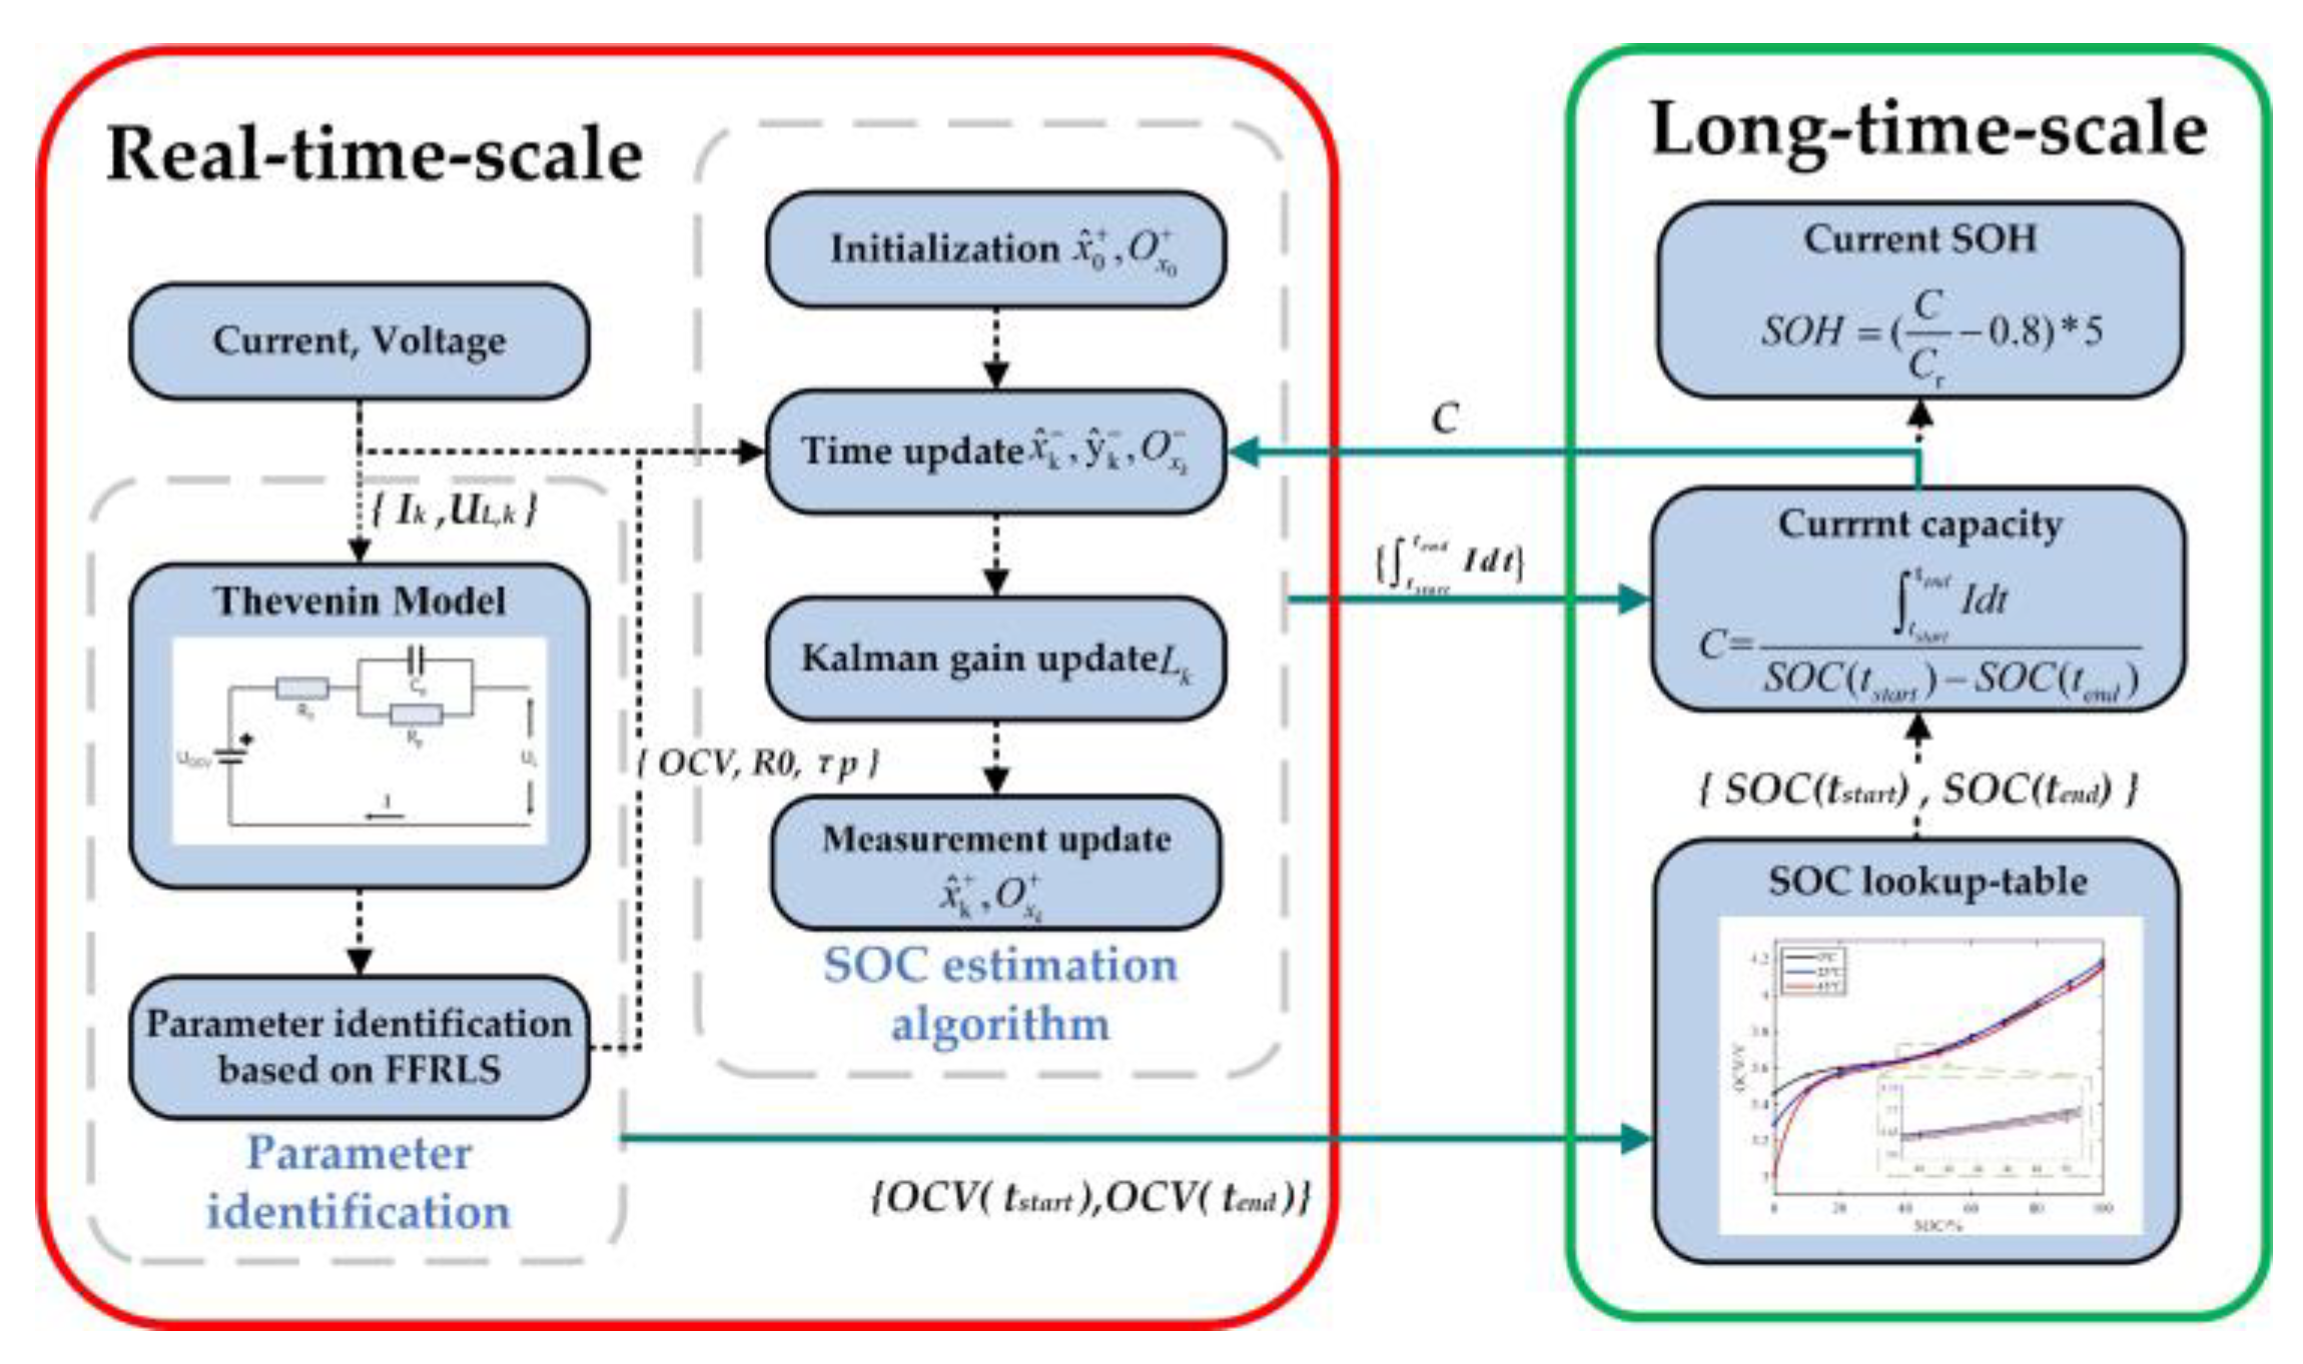
4. Collaborative Estimation Algorithm

4.1. SOC Estimation Algorithm Based on EKF

The Kalman filter (KF) is a recursive estimation algorithm based on the least mean square error (MSE) and filtering theory [28]. The principle of the algorithm is to establish the state space model of the system, compare the estimated observation value at the previous moment with the actual observation value at the current moment, update the state variable, and calculate the estimated value at the current moment. An accurate system state can be obtained in the continuous “prediction–comparison–update” process. The traditional KF algorithm is only suitable for linear systems, but batteries are nonlinear systems, so the KF must be modified.
Based on the KF, the extended Kalman filter (EKF) completes the linearization of the system by removing the higher-order terms from the nonlinear part through Taylor expansion. For any nonlinear system, the algorithm can be expressed as follows.
{ x k + 1 = f ( x k , u k ) + w k y k = g ( x k , u k ) + v k
where f(xk,uk) is the state function; g(xk,uk) is the observation function; xk is the state vector of the system at time k; yk is the observed value of the system; uk is the input vector of the system at time k; and both wk and vk are white noise terms and are independent of each other. Via Taylor expansion of Equation (14), the general form of the state space model can be obtained, as shown in Equation (15).
{ x k + 1 A k x k + B k u k + w k y k C k x k + D k u k + v k
Combined with the Thevenin model, the description of the EKF parameters is shown in Equations (16)–(22).
x k = [ S O C k , U p , k ] T
u k = i k
y k = U L , k
A k = [ 1 0 0 e Δ t τ ]
B k = [ η i Δ t C S O H R p ( 1 e Δ t τ ) ]
C k = [ d U O C V d S O C , 1 ]
D k = R 0
The available capacity of the battery decreases gradually as the battery ages. Therefore, CSOH in Bk indicates that the available capacity is a variable related to the SOH status, which is the update object of the SOH algorithm in the cooperative estimation algorithm in this study. The process of the EKF algorithm is summarized in Algorithm 1.
Algorithm 1 The flow of extended Kalman filter (EKF) algorithm
Step 1: Initialization,
   { x ^ 0 + = E ( x 0 ) O x 0 + = E [ ( x 0 x ^ 0 + ) ( x 0 x ^ 0 + ) T ]
Step 2: Iteration,
State update:
   x ^ k = f ( x ^ k 1 + , u k 1 )
   O x k = A ^ k 1 O x k 1 + A ^ k 1 T + w
Kalman gain:
   L k = O x k C ^ k T ( C ^ k O x k C ^ k T + v ) 1
Measurement update:
   x ^ k + = x ^ k + L k ( y k y ^ k )
   O x k + = ( I L k C ^ k ) O x k

4.2. SOH Estimation Algorithm

The SOH can be evaluated by the battery’s capacity or the ohmic resistance. The capacity was taken as the evaluation indicator for the SOH in this study. When the battery is fresh (SOH of 100%), the available capacity of the battery is its nominal capacity. Therefore, the definition of SOH is as shown in Equation (23) [29].
S O H = ( C C r 0.8 ) 5
where C is the current available capacity and Cr is the initial nominal capacity. The current available capacity of the battery can be calculated by the ratio of the accumulated current over time to the change of SOC, as shown in Equation (24).
C = t s t a r t t e n d I d t S O C ( t s t a r t ) S O C ( t e n d )
where tstart and tend are the start time and end time of the algorithm. SOC(tstart) and SOC(tend) can be obtained from the SOC–OCV curve at the start time and end time of the algorithm, and OCV can be obtained from online identification based on FFRLS. It can be seen from Equation (24) that the reliability of the FFRLS algorithm and the SOC estimation affect the SOH estimation accuracy. Therefore, in order to ensure the accuracy of the SOH algorithm, the limit conditions associated with the SOC and the temperature are analyzed in Section 5.2.2.
The scheme for the collaborative estimation is shown in Figure 5. Since battery aging is a slow process, the SOH estimation algorithm has low requirements for real-time performance and can be used over an interval of a few weeks in practical applications. The real-time-scale SOC estimation and the long-time-scale SOH estimation comprise a multi-time-scale state estimation algorithm for batteries. The SOH estimation algorithm updates the battery capacity state and improves the estimation accuracy of the SOC. The parameter identification results and the accurate estimation of the SOC guarantee the accurate estimation of the SOH.

5. Results and Discussion

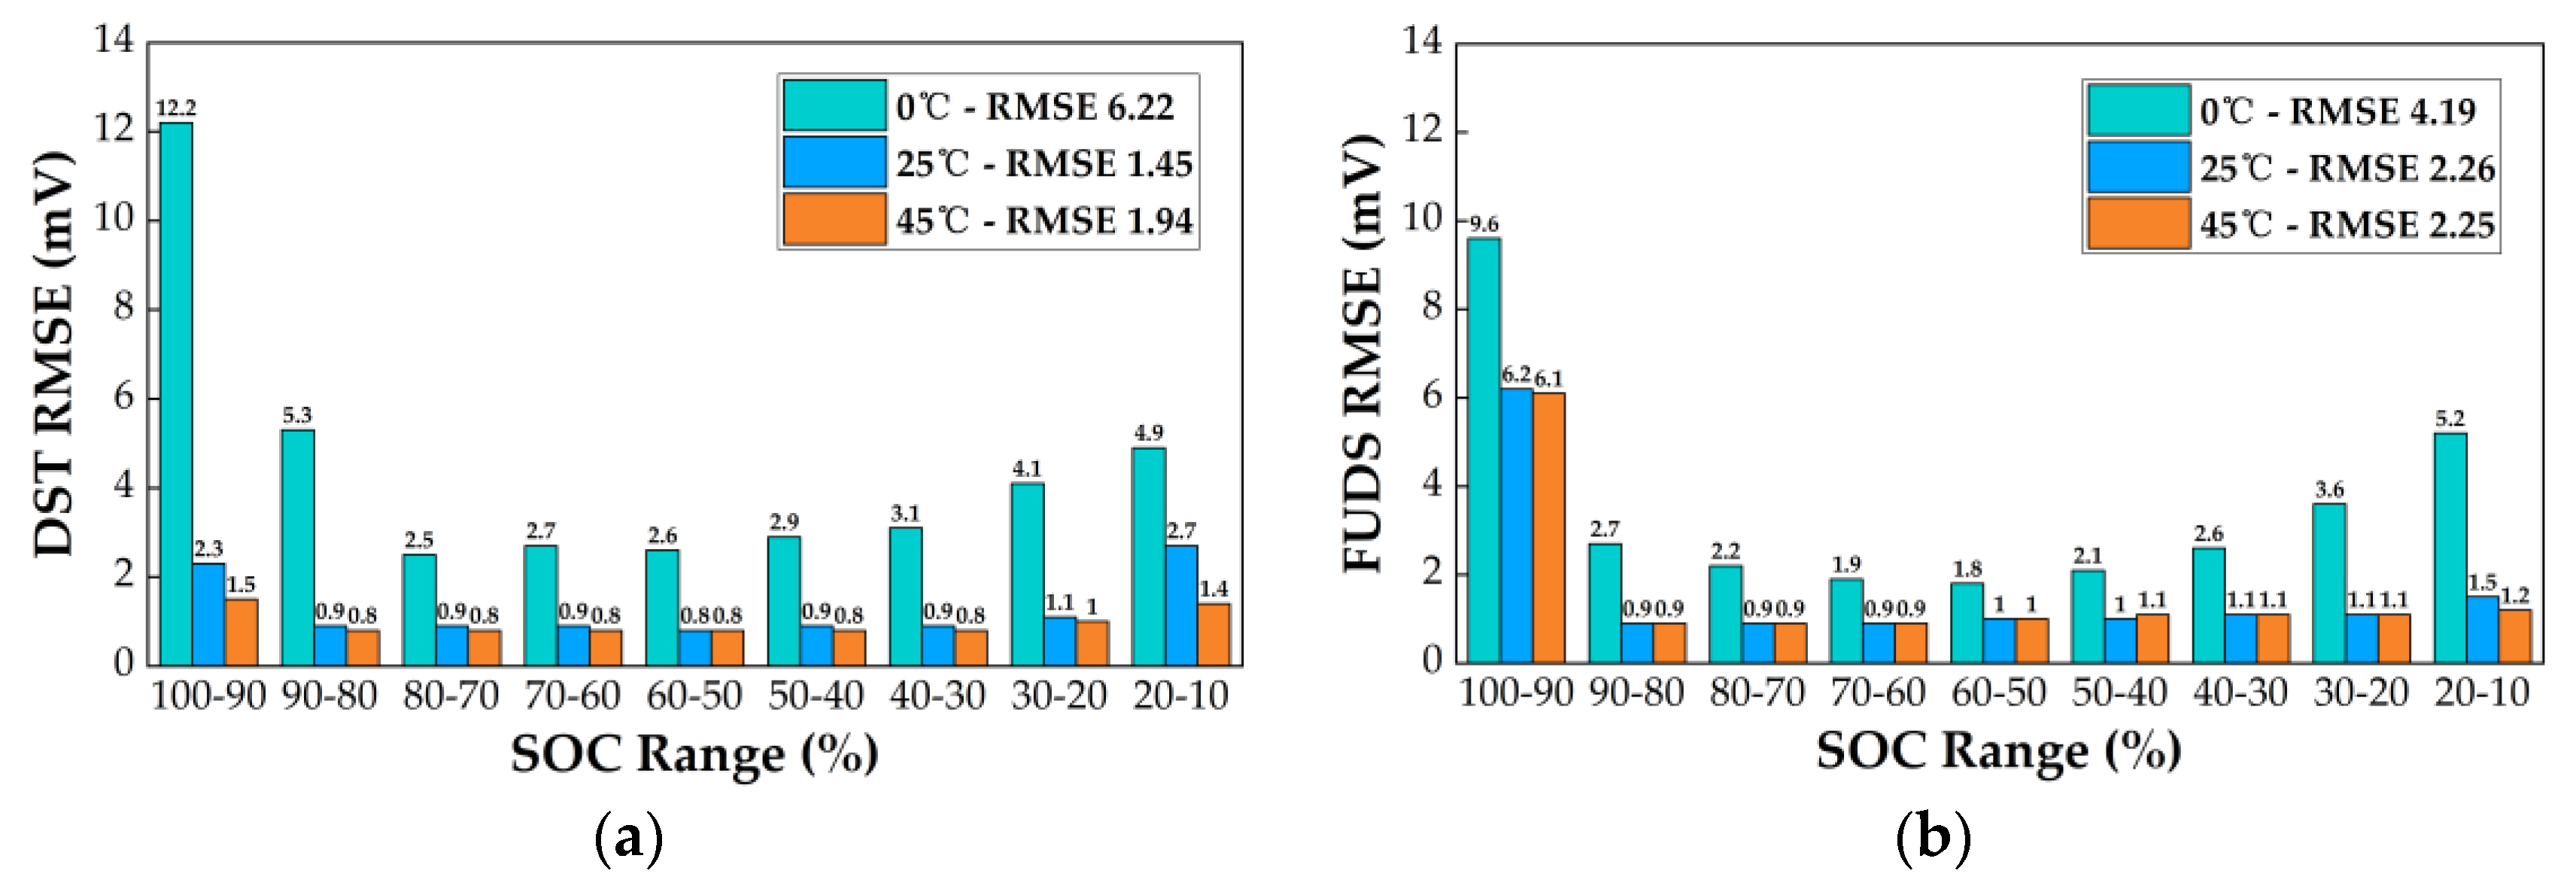
5.1. Analysis of the Model Accuracy

An accurate battery model and accurate parameters are necessary for effective battery state estimation. In this study, the accuracy of parameter identification was verified at different temperatures (0 °C, 25 °C, and 45 °C) under different test profiles (DST and FUDS). The error in the terminal voltage, which is identified by FFRLS, is shown in Figure 6. The terminal voltage error shows similar trends with the increase in discharge depth under different ambient temperatures and test profiles, and can be divided into three stages. The first stage is the initial discharge stage. The large error in this stage occurs because of the random initialization of the estimated parameters described in Equation (7), which cannot reflect the state of batteries accurately. However, according to the closed-loop feedback mechanism of FFRLS described in Section 3.2.2, the estimated error will quickly converge to a low value after a certain number of iterations. The maximum error (DST profile: 63 mV, FUDS profile: 30 mV) occurred at 0 °C. The error was between 13 mV and 20 mV at 25 °C and 45 °C. The second stage is the stable discharge stage. The result calculated by the FFRLS algorithm gradually converges in this stage, and the terminal voltage error of the battery can be stabilized. The error was about 20 mV at 0 °C and 5 mV at 25 °C and 45 °C. The third stage is the end of the discharge process. The decreasing battery reactivity leads to strong nonlinear characteristics, which cause the performance of FFRLS to decrease and the error in parameter identification to increase. It should be noted that the error increased obviously at 25 °C in this stage.
The root mean square error (RMSE) is an evaluation index which describes the error level under a certain number of observations. Figure 7a,b shows the RMSE of the parameter identification results for DST and FUDS, respectively, under different ambient temperatures and SOC ranges. The RMSE calculated by the identification results at the low ambient temperature (0 °C) was larger than that at the other ambient temperatures (25 °C and 45 °C) in each SOC range. Using the DST test profile as an example, the overall RMSE at low ambient temperature (0 °C) was 6.22 mV, which is larger than that at normal temperatures (25 °C: 1.45 mV, 45 °C: 1.94 mV). Furthermore, the RMSE at normal temperatures remains in the range of 0.8 to 1.1 in the 10–90% SOC range under different test profiles, which means that FFRLS can achieve good performance at normal temperatures.

5.2. Analysis of Collaborative Estimation Algorithm

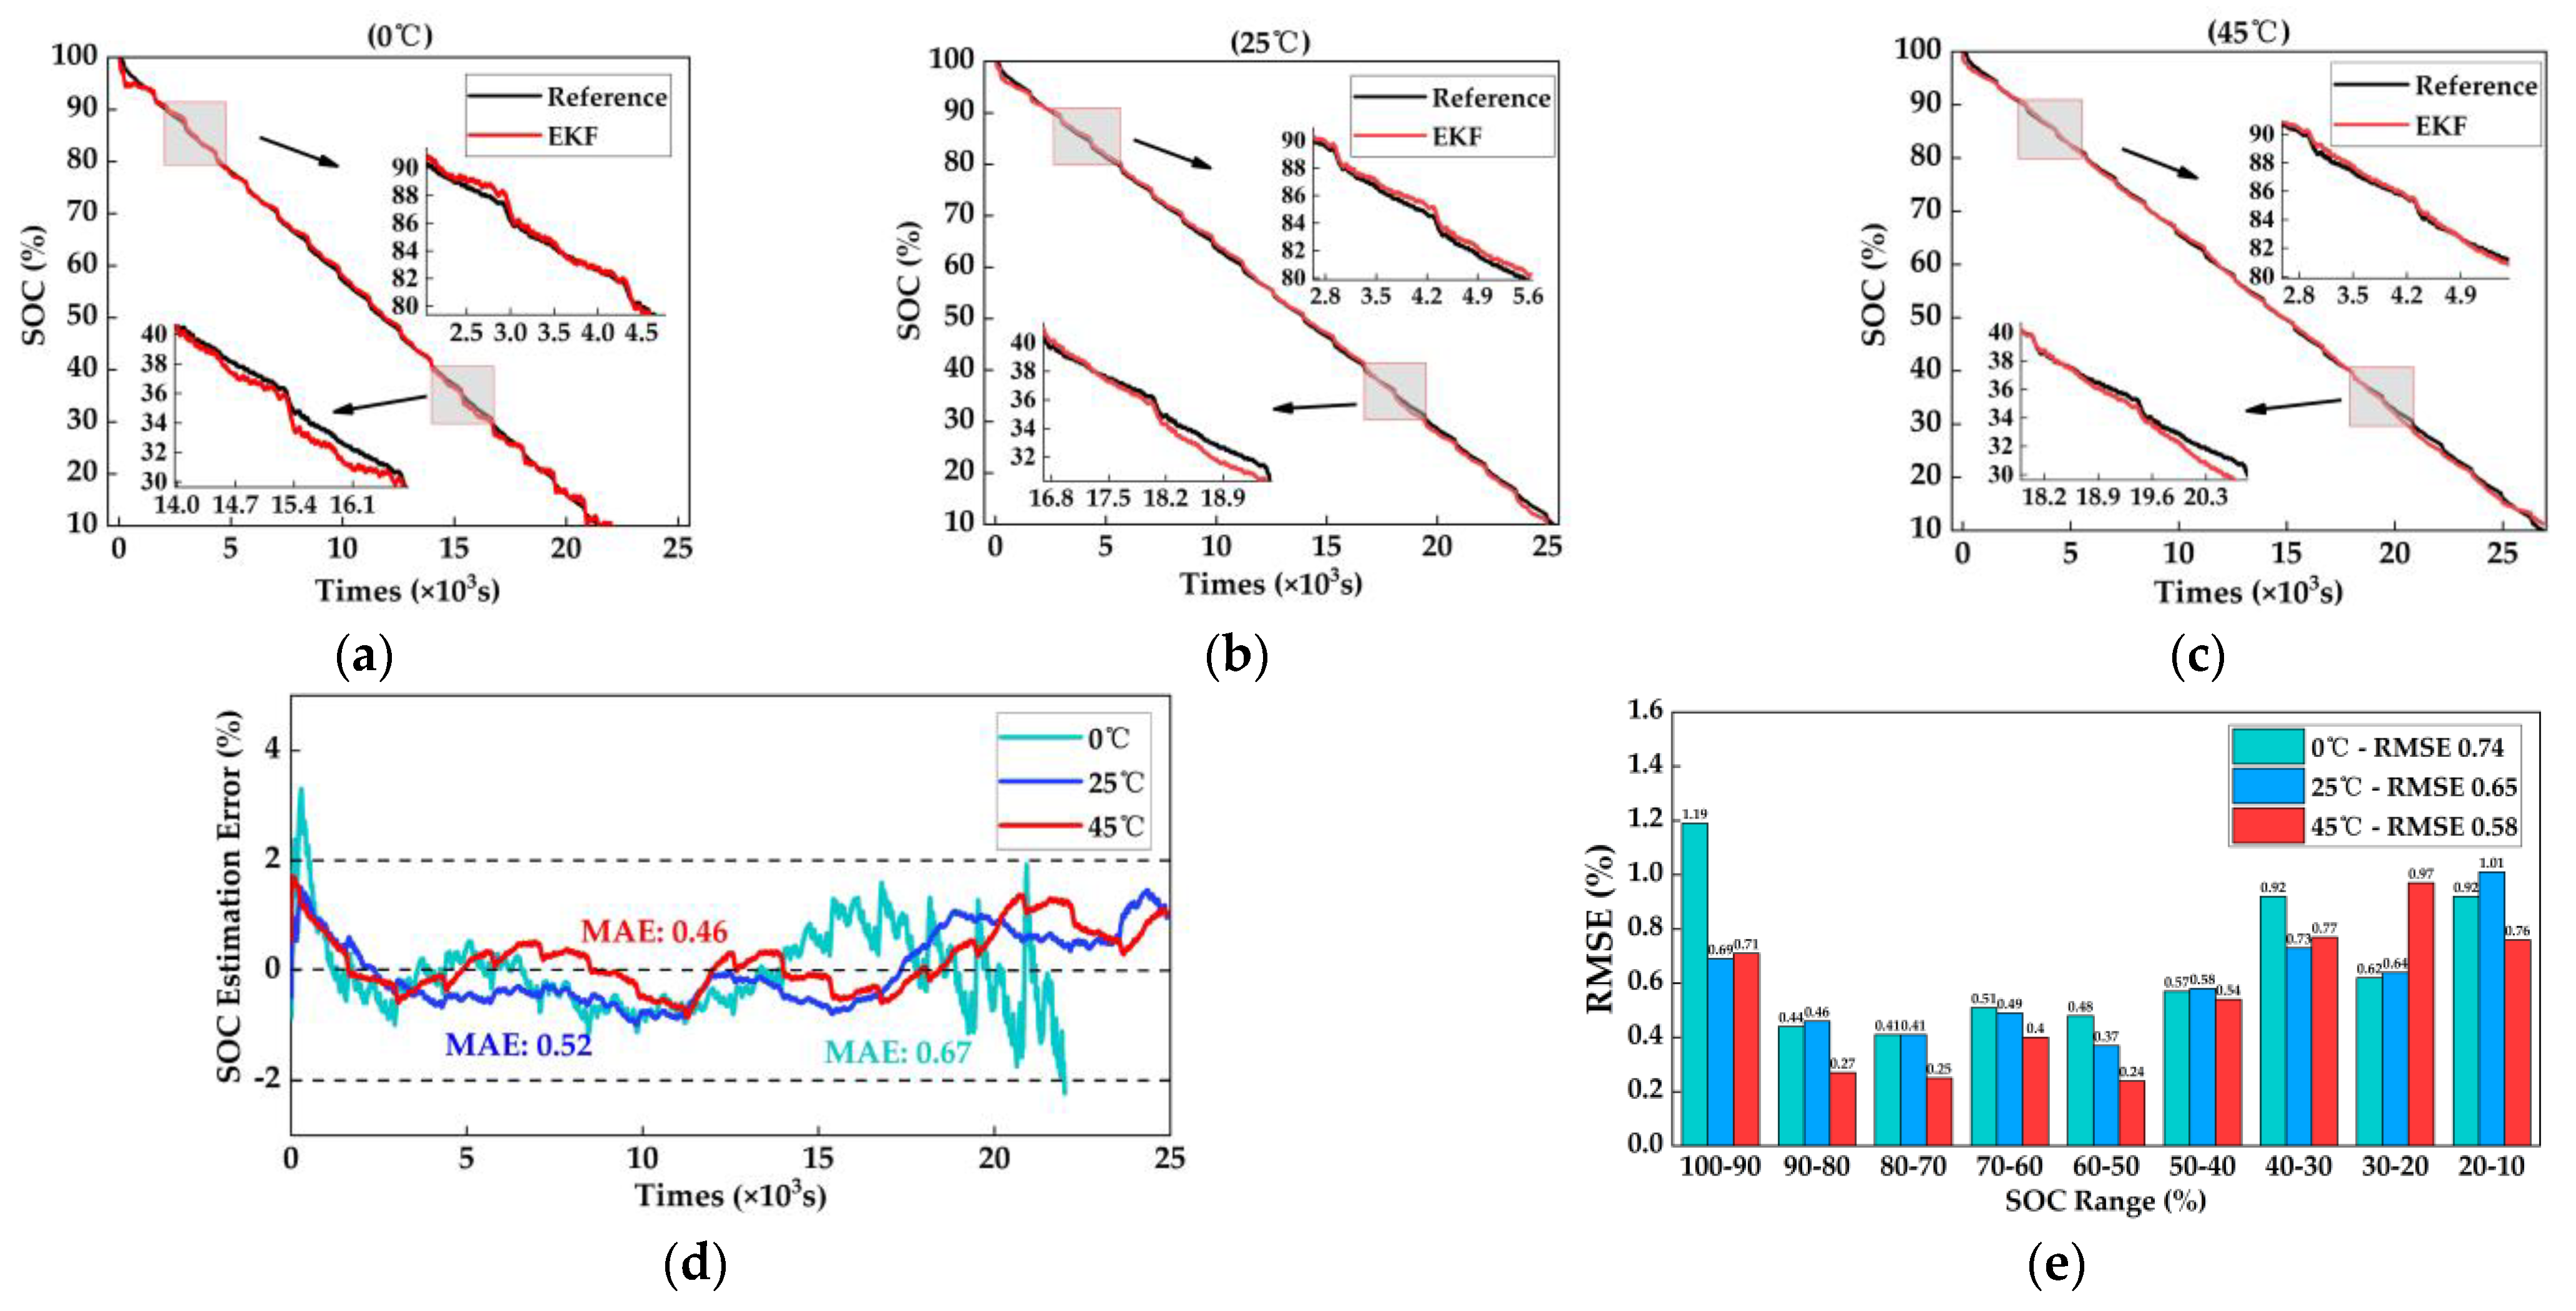
5.2.1. Analysis of the SOC Estimation Result

Compared with the DST test profile, the FUDS test profile is closer to the real conditions of batteries. Thus, the FUDS test profile was used to verify the SOC estimation algorithm of the power battery. To avoid damage to the battery caused by overdischarge, the SOC range between 10% and 100% was selected.
The SOC estimation results in Figure 8a–c compare the EKF estimation results and the reference values at different ambient temperatures. The estimation values follow the trend of the reference values but exhibit slight fluctuations. Under the same ambient temperature, the stability of the estimation result in the high SOC range was better than that in the low SOC range. Taking the estimation result at 25 °C as an example, within the SOC range of 50–90%, the maximum error was 0.97%. Within the SOC range of 10–50%, the error was higher, at 1.46%. The reason for this phenomenon is that the EKF achieves linearization of nonlinear problems through Taylor expansion and truncation of high-order terms. In the high SOC range, the battery shows linear characteristics, so the EKF can track the system changes well. In the low SOC range, due to the nonlinear characteristics of the battery, the omission of higher-order terms reduces the accuracy of estimation. It was demonstrated in [30] that the degree of nonlinearity of a battery is mainly determined by the OCV. The estimation results at 0 °C and 45 °C also show similar characteristics.
Figure 8d,e presents the mean absolute error (MAE) and RMSE for the SOC estimation results at different ambient temperatures. The EKF shows better accuracy when the battery runs at 25 °C and 45 °C, and the MAE and RMSE are both lower. The accuracy of the EKF should be further optimized for the low SOC range and low ambient temperature. However, the overall maximum estimation error was less than 2.3% in the SOC range of 10% to 90%, which meets the requirements for SOC estimation accuracy in practical applications. In addition, it should be noted that in the SOC range between 50% and 90%, the EKF had high estimation accuracy.

5.2.2. Analysis of the SOH Estimation Result

The relationship between the SOH estimation accuracy and the SOC estimation accuracy is discussed in Section 4.2. According to the analysis of the SOC estimation algorithm in Section 5.2.1, it can be determined that the operating conditions of the SOH algorithm are as follows: the SOC used in the SOH algorithm should be greater than 50%, and the battery should not be at a low ambient temperature when the algorithm is calculated. In this study, two batteries with different aging degrees (i.e., SOH at 89% and 84.5%) were selected to verify the SOH estimation algorithm under the FUDS profile at 25 °C. For the sake of simplicity, the two aged batteries are denoted by B01 (SOH = 89%) and B02 (SOH = 84.5%).
SOH estimation verification was conducted for each battery in the time ranges of 3000 s to 4000 s, 5000 s to 6000 s, 7000 s to 8000 s, and 9000 s to 10,000 s, and the mean value of the estimation results of the four intervals was obtained. Table 2 shows the verification results. It can be observed that in a single range, the maximum SOH estimation error was 4.3% and the minimum estimation error was 0.4%. For a single battery, there were also differences in estimation errors in different estimation ranges, mainly because the accuracy of the algorithm depends on the OCV identification results at the beginning and end of the estimation range, and the OCV identification results obtained by the FFRLS have certain random errors, leading to differences in SOH estimation results in different ranges. To solve this problem, the mean values of the SOH estimated in the four ranges were calculated. According to Table 2, the maximum error of B01 was reduced from 3.8% to 2.1% and the maximum error of B02 was reduced from 4.3% to 1.4%. It can be observed that the influence of random error on the estimation results can be reduced effectively, and the robustness of the algorithm can be enhanced through the process of calculating the mean value.

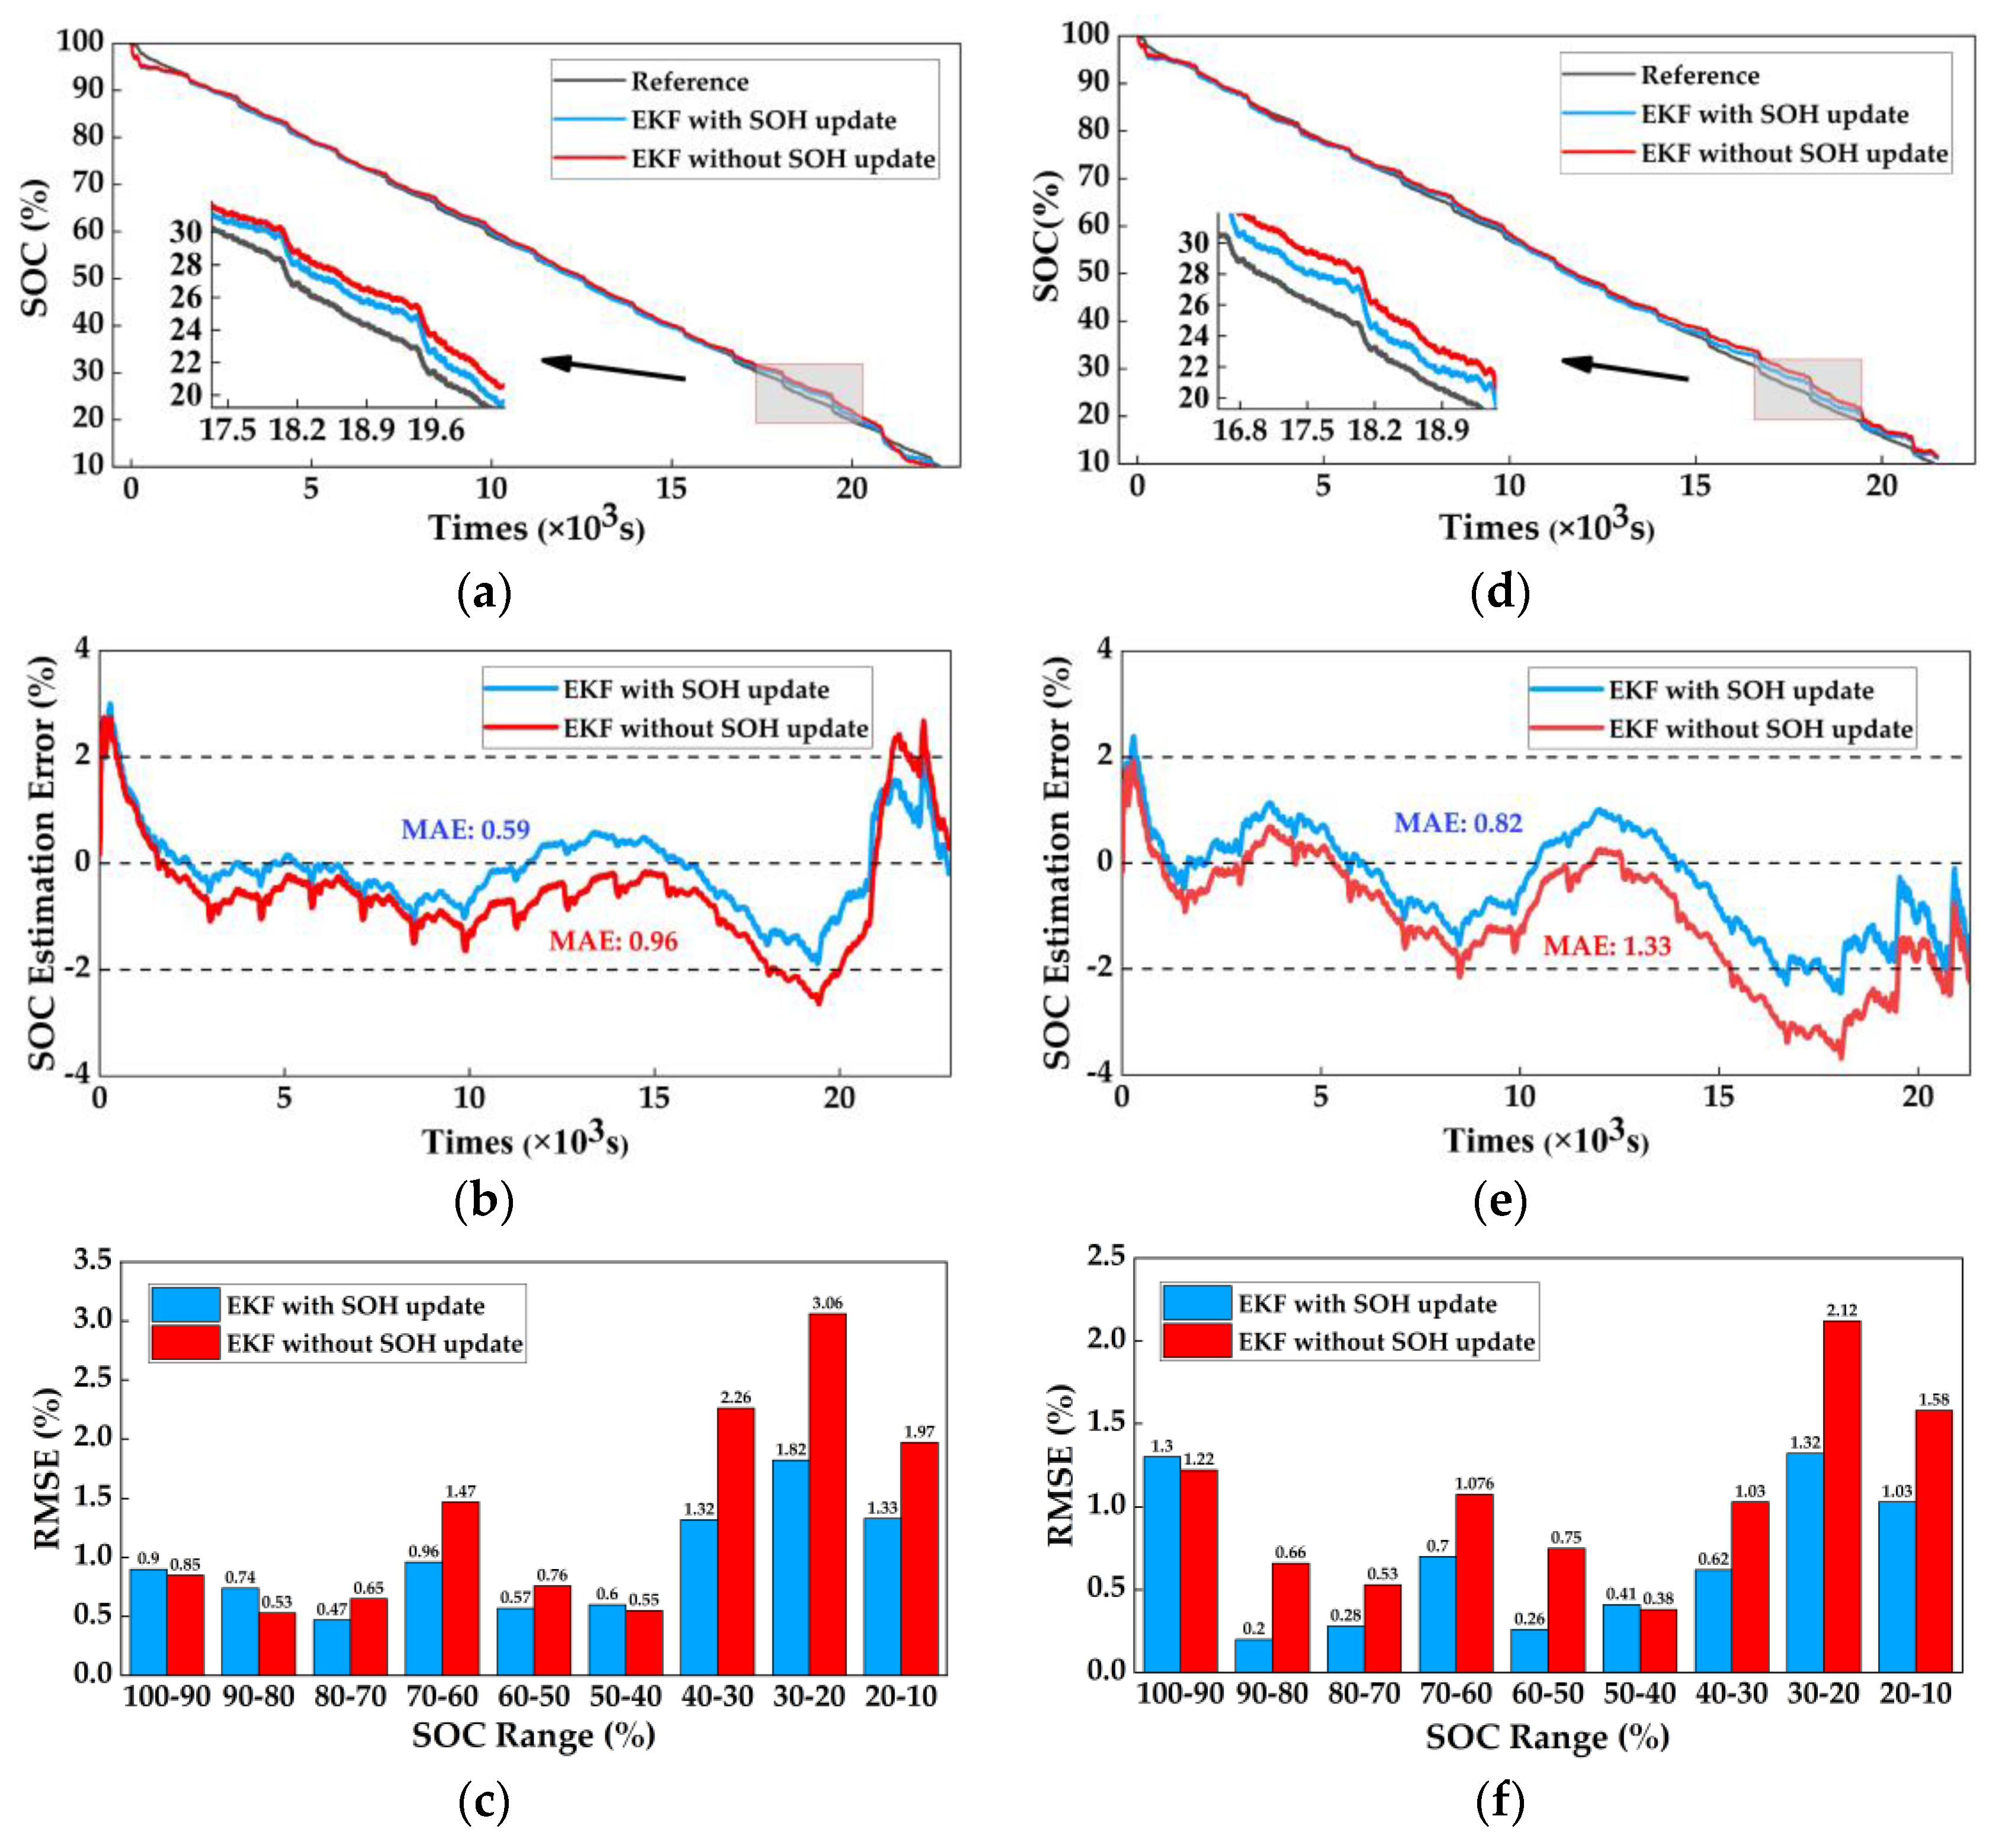
5.2.3. Analysis of the SOC and SOH Collaborative Estimation Algorithm

According to Equation (2), C is the current available capacity under any conditions, which decreases as the battery ages. Therefore, it is important to calibrate C as the SOH changes to improve the SOC estimation accuracy over the whole battery life. In this section, the SOC estimation accuracy of the two aged batteries mentioned in Section 5.2.2, with or without capacity calibration, are compared to validate the co-estimation algorithm.
The estimated values of the SOH (B01: 91.1%, B02: 85.9%) are used in this section. Figure 9 depicts the SOC estimation results of the two aged batteries, with or without capacity calibration, under the FUDS test profile at 25 °C. From Figure 9a,b, it can be observed that the SOC estimation accuracy of B01 clearly increased after capacity calibration. The RMSE decreased from 1.26% to 0.82%, the MAE decreased from 0.96% to 0.59%, and the maximum error decreased from 2.65% to 1.88% within the SOC range of 20–90%. In addition, according to Figure 9b, the fluctuation of the error curves remained similar over the whole SOC region, demonstrating the effectiveness of capacity calibration. After capacity calibration, the error curve remained within the ±2% error boundary in the 10–90% SOC range. As discussed above, capacity calibration is extremely important to guarantee the SOC estimation accuracy when the battery is close to the end of its life. Figure 9d,e shows the SOC estimation results for B02, whose SOH was 84.5%. It can be clearly seen that after capacity calibration, the estimated SOC could track the reference over the whole SOC region well, whereas without capacity calibration, the maxmium SOC estimation error exceeded 3.5% when the SOC was below 50%. Furthermore, the RMSE decreased from 1.78% to 1.05%, indicating a 0.73% improvement, and the MAE decreased from 1.33% to 0.82%, indicating a 0.51% improvement. Compared with B01, the improvement was much greater. According to the analysis above, it can be concluded that calibrating the capacity as the SOH changes can effectively improve the SOC estimation accuracy for aged batteries.

6. Conclusions

The purpose of this study was to establish a collaborative estimation algorithm for the SOC and SOH that considered accuracy and real-time performance. According to the characteristics of the battery, the Thevenin model was established. At the real-time scale, FFRLS and EKF were used to identify the model parameters and estimate SOC under different test profiles and ambient temperatures (0 °C, 25 °C, and 45 °C). At the long-term scale, SOH estimation was realized through the capacity estimation of the battery. The primary conclusions are as follows:
(1) FFRLS was used to identify the parameters of the Thevenin equivalent circuit model, and the identification results for the DST and FUDS test profiles were analyzed. The identification accuracy of this method was better at normal temperatures (25 °C and 45 °C) than at low temperature (0 °C). The terminal voltage error was about 20 mV at low temperature, and was about 5 mV at normal temperatures. The RMSE of this algorithm remained between 0.8 and 1.1 mV in the range of 20–90% SOC at normal temperatures, which means that this algorithm has high identification accuracy.
(2) The SOC estimation algorithm based on EKF had high accuracy in the FUDS test under different ambient temperatures. The maximum estimation error was 1.46% at normal ambient temperatures (25 °C and 45 °C) and 2.3% at low temperature (0 °C). In addition, the estimation accuracy in the high SOC range from 50% to 90% was greater and more stable than in the low SOC range from 10% to 50% in the estimation process.
(3) According to the accuracy of the SOC estimation based on EKF, the temperature and interval conditions of the SOH estimation algorithm were proposed. The maximum error for single interval estimation was 4.3%, and the maximum error for multi-interval mean estimation was 1.4%. Furthermore, calibration of the capacity as the SOH changed could effectively improve the SOC estimation accuracy over the whole battery life.

Author Contributions

C.-Q.D. made the main contribution to the conceptualization and methodology. J.-B.S. contributed to designing the experiments, algorithm implementation and writing. Z.R. contributed to writing, reviewing, and editing. Z.-Y.W. contributed to the experiments and validation. D.-M.W. made contributions to writing and investigation. W.-Q.R. contributed as a co-author via funding acquisition. All authors have read and agreed to the published version of the manuscript.

Funding

This research was funded by the National Natural Science Foundation of China under grant number 51775393, the Key R&D project of Hubei Province China under grant number 2020BAB132, and the Innovation Research Team Development Program of the Ministry of Education of China under grant number IRT_17R83.

Data Availability Statement

The data presented in this study are available on request from corresponding author. The data are not publicly available due to privacy.

Conflicts of Interest

The authors declare no conflict of interest.

References

  1. Zhang, L.; Ding, H.T.; Shi, J.P.; Huang, Y.J.; Chen, H.; Guo, K.H.; Li, Q. An Adaptive Backstepping Sliding Mode Controller to Improve Vehicle Maneuverability and Stability via Torque Vectoring Control. IEEE Trans. Veh. Technol. 2020, 69, 2598–2612. [Google Scholar] [CrossRef]
  2. Xiong, R.; Sun, F.C.; Chen, Z.; He, H.W. A data-driven multi-scale extended Kalman filtering based parameter and state estimation approach of lithium-ion polymer battery in electric vehicles. Appl. Energy 2014, 113, 463–476. [Google Scholar] [CrossRef]
  3. He, Z.G.; Chen, D.; Pan, C.F.; Chen, L.; Wang, S.H. State of charge estimation of power Li-ion batteries using a hybrid estimation algorithm based on UKF. Electrochim. Acta 2016, 211, 101–109. [Google Scholar]
  4. Lipu, M.S.H.; Hannan, M.A.; Hussain, A.; Ayob, A.; Saad, M.H.M.; Karim, T.F.; How, D.N.T. Data-driven state of charge estimation of lithium-ion batteries: Algorithms, implementation factors, limitations and future trends. J. Clean. Prod. 2020, 277, 124110. [Google Scholar] [CrossRef]
  5. Song, C.; Kim, K.; Sung, D.; Kim, K.; Yang, H.; Lee, H.; Cho, G.Y.; Cha, S.W. A Review of Optimal Energy Management Strategies Using Machine Learning Techniques for Hybrid Electric Vehicles. Int. J. Automot. Technol. 2021, 22, 1437–1452. [Google Scholar] [CrossRef]
  6. Hu, X.S.; Feng, F.; Liu, K.L.; Zhang, L.; Xie, J.L.; Liu, B. State estimation for advanced battery management: Key challenges and future trends. Renew. Sustain. Energy Rev. 2019, 114, 109334. [Google Scholar] [CrossRef]
  7. Feng, F.; Lu, R.G.; Zhu, C.B. A Combined State of Charge Estimation Method for Lithium-Ion Batteries Used in a Wide Ambient Temperature Range. Energies 2014, 7, 3004–3032. [Google Scholar] [CrossRef] [Green Version]
  8. He, W.; Williard, N.; Chen, C.C.; Pecht, M. State of charge estimation for Li-ion batteries using neural network modeling and unscented Kalman filter-based error cancellation. Int. J. Electr. Power Energy Syst. 2014, 62, 783–791. [Google Scholar] [CrossRef]
  9. Sun, F.C.; Xiong, R.; He, H.W. A systematic state-of-charge estimation framework for multi-cell battery pack in electric vehicles using bias correction technique. Appl. Energy 2016, 162, 1399–1409. [Google Scholar] [CrossRef]
  10. Plett, G.L. Extended Kalman filtering for battery management systems of LiPB-based HEV battery packs—Part 1. Background. J. Power Sources 2004, 134, 252–261. [Google Scholar] [CrossRef]
  11. Plett, G.L. Extended Kalman filtering for battery management systems of LiPB-based HEV battery packs—Part 2. Modeling and identification. J. Power Sources 2004, 134, 262–276. [Google Scholar] [CrossRef]
  12. Plett, G.L. Extended Kalman filtering for battery management systems of LiPB-based HEV battery packs—Part 3. State and parameter estimation. J. Power Sources 2004, 134, 277–292. [Google Scholar] [CrossRef]
  13. Liu, C.Z.; Liu, W.Q.; Wang, L.Y.; Hu, G.D.; Ma, L.P.; Ren, B.Y. A new method of modeling and state of charge estimation of the battery. J. Power Sources 2016, 320, 1–12. [Google Scholar] [CrossRef]
  14. Duan, J.D.; Wang, P.; Ma, W.T.; Qiu, X.Y.; Tian, X.; Fang, S. State of Charge Estimation of Lithium Battery Based on Improved Correntropy Extended Kalman Filter. Energies 2020, 13, 4197. [Google Scholar] [CrossRef]
  15. Wang, S.L.; Fernandez, C.; Shang, L.P.; Li, Z.F.; Li, J.C. Online state of charge estimation for the aerial lithium-ion battery packs based on the improved extended Kalman filter method. J. Energy Storage 2017, 9, 69–83. [Google Scholar] [CrossRef]
  16. Lipu, M.S.H.; Hannan, M.A.; Hussain, A.; Hoque, M.M.; Ker, P.J.; Saad, M.H.M.; Ayob, A. A review of state of health and remaining useful life estimation methods for lithium-ion battery in electric vehicles: Challenges and recommendations. J. Clean. Prod. 2018, 205, 115–133. [Google Scholar] [CrossRef]
  17. Tian, H.X.; Qin, P.L.; Li, K.; Zhao, Z. A review of the state of health for lithium -ion batteries: Research status and suggestions. J. Clean. Prod. 2020, 261, 120813. [Google Scholar] [CrossRef]
  18. Wang, J.; Liu, P.; Hicks-Garner, J.; Sherman, E.; Soukiazian, S.; Verbrugge, M.; Tataria, H.; Musser, J.; Finamore, P. Cycle-life model for graphite-LiFePO4 cells. J. Power Sources 2011, 196, 3942–3948. [Google Scholar] [CrossRef]
  19. Christensen, J.; Newman, J. A mathematical model of stress generation and fracture in lithium manganese oxide. J. Electrochem. Soc. 2006, 153, A1019–A1030. [Google Scholar] [CrossRef]
  20. Li, X.Y.; Wang, Z.P.; Zhang, L.; Zou, C.F.; Dorrell, D.D. State-of-health estimation for Li-ion batteries by combing the incremental capacity analysis method with grey relational analysis. J. Power Sources 2019, 410, 106–114. [Google Scholar] [CrossRef]
  21. Liu, T.Y.; Sun, Q.; Feng, J.; Pan, Z.Q.; Huangpeng, Q.Z. Residual life estimation under time-varying conditions based on a Wiener process. J. Stat. Comput. Simul. 2017, 87, 211–226. [Google Scholar] [CrossRef]
  22. Safari, M.; Delacourt, C. Mathematical Modeling of Lithium Iron Phosphate Electrode: Galvanostatic Charge/Discharge and Path Dependence. J. Electrochem. Soc. 2011, 158, A63–A73. [Google Scholar] [CrossRef]
  23. Yang, D.; Zhang, X.; Pan, R.; Wang, Y.J.; Chen, Z.H. A novel Gaussian process regression model for state-of-health estimation of lithium-ion battery using charging curve. J. Power Sources 2018, 384, 387–395. [Google Scholar] [CrossRef]
  24. Chaoui, H.; Miah, S.; Oukaour, A.; Gualous, H. State-of-Charge and State-of-Health Prediction of Lead-Acid Batteries with Genetic Algorithms. In Proceedings of the 2015 IEEE Transportation Electrification Conference and Expo (ITEC), Dearborn, MI, USA, 14–17 June 2015. [Google Scholar]
  25. Zou, Y.; Hu, X.S.; Ma, H.M.; Li, S.E. Combined state of charge and state of health estimation over lithium-ion battery cell cycle lifespan for electric vehicles. J. Power Sources 2015, 273, 793–803. [Google Scholar] [CrossRef]
  26. Ren, Z.; Du, C.Q.; Wu, Z.Y.; Shao, J.B.; Deng, W.J. A comparative study of the influence of different open circuit voltage tests on model-based state of charge estimation for lithium-ion batteries. Int. J. Energy Res. 2021, 45, 13692–13711. [Google Scholar] [CrossRef]
  27. Suarez-Garcia, A.; Alfonsin, V.; Urrejola, S.; Sanchez, A. Optimal parametrization of electrodynamical battery model using model selection criteria. J. Power Sources 2015, 285, 119–130. [Google Scholar] [CrossRef]
  28. Liu, W.; Xia, X.; Xiong, L.; Lu, Y.S.; Gao, L.T.; Yu, Z.P. Automated Vehicle Sideslip Angle Estimation Considering Signal Measurement Characteristic. IEEE Sens. J. 2021, 21, 21675–21687. [Google Scholar] [CrossRef]
  29. Shen, P.; Ouyang, M.G.; Lu, L.G.; Li, J.Q.; Feng, X.N. The Co-estimation of State of Charge, State of Health, and State of Function for Lithium-Ion Batteries in Electric Vehicles. IEEE Trans. Veh. Technol. 2018, 67, 92–103. [Google Scholar] [CrossRef]
  30. Yu, Q.Q.; Xiong, R.; Wang, L.Y.; Lin, C. A Comparative Study on Open Circuit Voltage Models for Lithium-ion Batteries. Chin. J. Mech. Eng. 2018, 31, 65. [Google Scholar] [CrossRef] [Green Version]
Figure 1. Schematic of the battery test under different ambient temperatures.
Electronics 11 00181 g001
Figure 2. Dynamic test profile: (a) the dynamic stress test (DST) profile; (b) the federal urban driving schedule (FUDS) profile.
Electronics 11 00181 g002
Figure 3. Schematic of the Thevenin model.
Electronics 11 00181 g003
Figure 4. (a) SOC–OCV test results at different temperatures. (b) Fitting process of SOC–OCV curve at 25 °C. (c) SOC–OCV curves at different temperatures. (d) OCV difference at 0 °C and 45 °C.
Electronics 11 00181 g004aElectronics 11 00181 g004b
Figure 5. The scheme for the collaborative estimation algorithm.
Electronics 11 00181 g005
Figure 6. The error in parameter identification for different ambient temperatures and test profiles.
Electronics 11 00181 g006
Figure 7. The RMSE of parameter identification under (a) DST and (b) FUDS for different SOC ranges.
Electronics 11 00181 g007
Figure 8. (ac) SOC estimation results under different ambient temperatures. (d) Estimation error under different ambient temperatures. (e) RMSE of SOC estimation under different ambient temperatures.
Electronics 11 00181 g008
Figure 9. (ac) The SOC estimation results for 89% SOH battery. (df) The SOC estimation results for 84.5% SOH battery.
Electronics 11 00181 g009
Table 1. Key parameters of battery.
NameTypeNominal Capacity (mAH)Nominal Voltage (V)Discharge Cut-Off Voltage (V)Charge Cut-Off Voltage (V)
EVE ICR 18650NCM20003.62.54.2
Table 2. The reference state of health (SOH) and estimated SOH of aged batteries.
BatteryStart Time (s)End Time (s)Change of SOC (%)Used Capacity (mAH)Estimated Capacity (mAH)Estimated SOH (%)Estimation Error (%)
B01300040003.5863.46177288.6−0.4
500060003.9872.32181790.81.8
700080004.2278.34185692.83.8
9000100004.0474.64184792.33.3
Mean Value----------------182391.12.1
B02300040003.8263.46166183−1.5
500060004.3472.32166683.3−1.2
700080004.4278.34177288.64.1
9000100004.274.64177788.84.3
Mean Value----------------171985.91.4
Publisher’s Note: MDPI stays neutral with regard to jurisdictional claims in published maps and institutional affiliations.

