Article

Demonstration of Converter Control Interactions in MMC-HVDC Systems

1
School of Engineering, Cardiff University, Queen’s Buildings, The Parade, Cardiff CF24 3AA, Wales, UK
2
SSE Renewables, 1 Waterloo Street, Glasgow G2 6AY, Scotland, UK
3
SINTEF Energy Research, Strindvegen 4, NO-7465 Trondheim, Norway
4
Tecnalia Basque Research and Technology Alliance (BRTA), 48160 Derio, Spain
5
Department of Electronic and Electrical Engineering, Institute for Energy and Environment, University of Strathclyde, 16 Richmond Street, Glasgow G1 1XQ, Scotland, UK
6
School of Engineering, University of Edinburgh, Sanderson Building, Robert Stevenson Road, The King’s Buildings, Edinburgh EH9 3FB, Scotland, UK
7
Ricerca sul Sistema Energetico (RSE), Via Rubattino Raffaele 54, 20134 Milano, Italy
8
Renewables Business Unit, Iberdrola Tower, Plaza Euskadi 5, 48009 Bilbao, Spain
*
Author to whom correspondence should be addressed.
Electronics 2022, 11(2), 175; https://doi.org/10.3390/electronics11020175
Submission received: 10 December 2021 / Revised: 31 December 2021 / Accepted: 5 January 2022 / Published: 6 January 2022
(This article belongs to the Special Issue 10th Anniversary of Electronics: Recent Advances in Power Electronics)

Abstract

:
Although the control of modular multi-level converters (MMCs) in high-voltage direct-current (HVDC) networks has become a mature subject these days, the potential for adverse interactions between different converter controls remains an under-researched challenge attracting the attention from both academia and industry. Even for point-to-point HVDC links (i.e., simple HVDC systems), converter control interactions may result in the shifting of system operating voltages, increased power losses, and unintended power imbalances at converter stations. To bridge this research gap, the risk of multiple cross-over of control characteristics of MMCs is assessed in this paper through mathematical analysis, computational simulation, and experimental validation. Specifically, the following point-to-point HVDC link configurations are examined: (1) one MMC station equipped with a current versus voltage droop control and the other station equipped with a constant power control; and (2) one MMC station equipped with a power versus voltage droop control and the other station equipped with a constant current control. Design guidelines for droop coefficients are provided to prevent adverse control interactions. A 60-kW MMC test-rig is used to experimentally verify the impact of multiple crossing of control characteristics of the DC system configurations, with results verified through software simulation in MATLAB/Simulink using an open access toolbox. Results show that in operating conditions of 650 V and 50 A (DC voltage and DC current), drifts of 7.7% in the DC voltage and of 10% in the DC current occur due to adverse control interactions under the current versus voltage droop and power control scheme. Similarly, drifts of 7.7% both in the DC voltage and power occur under the power versus voltage droop and current control scheme.

1. Introduction

High-voltage direct-current (HVDC) transmission systems based on voltage source converter (VSC) technology are suitable for the grid-connection of offshore wind farms and for the development of DC grids. In general, the three main types of VSC topologies are two-level, three-level, and multi-level; however, from 1997 until 2010, VSC-HVDC projects favoured the use of two-level or three-level topologies. Modular multi-level converters (MMCs) are a more recent development enabling lower switching frequencies, reduced switching power losses and reduced harmonic components than their two-level and three-level counterparts. In 2010, the Trans Bay Cable Project in the USA became the first VSC-HVDC scheme to adopt MMCs. VSC-HVDC projects, nowadays, typically consider the use of the multi-level topology due to its improved efficiency [1,2,3].
Control schemes for VSCs are classified into non-islanded and islanded designs. Non-islanded schemes are typically employed when converter stations are connected to an AC system with synchronous generation. They are typically used for DC voltage, active power and reactive power control. Islanded controls are used when converter stations are connected to an AC system with a passive load or with limited generation. They can create an AC voltage source with fixed frequency, amplitude and phase angle at the islanded network [4,5,6,7]. However, the large-scale grid integration of renewable energy sources and power converters may increase the risk of control interactions in power systems. In response to this, the European Network of Transmission System Operators for Electricity developed a grid code on the use of HVDC converters to enhance the stability of AC grids [8].
Three often-used DC voltage control approaches in multi-terminal networks are the constant voltage, voltage margin and voltage droop schemes. The constant voltage method uses a single (master) converter to regulate DC voltage and an additional VSC (slave) to regulate active power through the DC network. A drawback is that if a converter outage or overcurrent occurs at the master station, all the remaining VSCs will attempt to regulate active power and this may result in DC voltage instability. The voltage margin method allows a slave converter to switch from power control to constant voltage control following an overcurrent or outage at the original master station. However, a single back-up converter is used for DC voltage regulation, which requires switching between different control modes. This in turn may affect voltage control [9,10,11,12,13]. An alternative solution is to share the responsibility for DC voltage control among multiple converters using a DC voltage droop control scheme. This enables all the available converters to adjust their power output in accordance with their droop characteristics following power imbalances. However, droop control schemes may exhibit unintended power flows and DC voltage variations.
Few studies have examined the potential for control interactions between VSCs in DC grids. The authors in [14] reviewed different DC voltage droop and power control methods for DC grids. A generic voltage droop controller for DC grids was developed in [15]. References [16,17,18,19,20] presented DC voltage with multiple droop control characteristics to improve the accuracy of DC power flow control. In [21], a hybrid control strategy which combines DC voltage with power control was proposed. A droop correction factor to avoid interactions between different VSCs equipped with voltage droop and frequency droop control schemes was tested in [22]. Adverse interactions caused by multiple cross-over of control characteristics between VSCs were first found and demonstrated in [23]. However, limited types of control characteristics and their adverse interactions have been discussed in previous studies. In addition, these studies did not examine the risk of multiple cross-over between different control characteristics in DC networks with MMCs.
This paper analyses the potential risks of multiple cross-over between different MMC control characteristics and verifies the theoretical analyses through both simulation and experimental tests. Lessons learned are useful to prevent adverse system performance in a practical implementation of a DC system. The specific contributions of this work are:
  • The multiple cross-over caused by two control configurations in a point-to-point HVDC link are theoretically analysed. The resulting unintended DC voltage drops and power imbalances are also investigated.
  • Guidelines on how to appropriately select droop coefficients to avoid the occurrence of multiple cross-over of control characteristics are presented.
  • The impact of multiple crossing of control characteristics is demonstrated using a 60-kW physical MMC test-rig. This is also verified through simulations using an open access toolbox developed in MATLAB/Simulink for the BEST PATHS project [24].

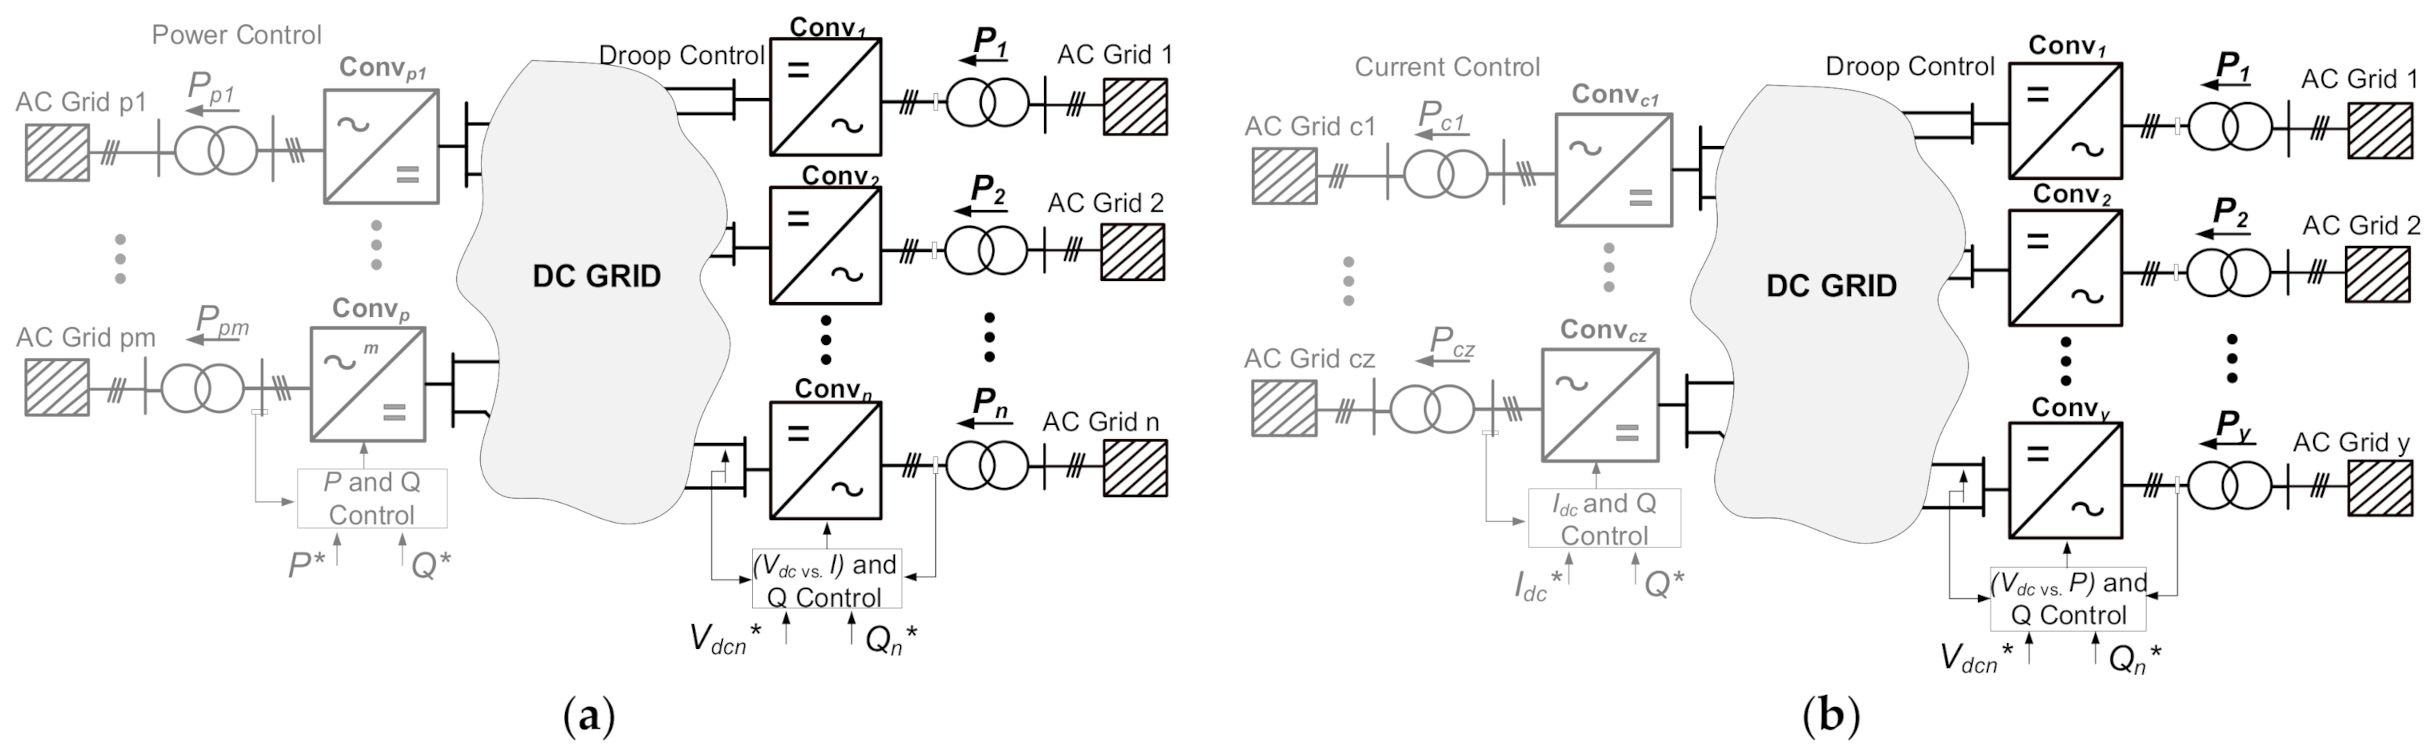
2. Droop Control Schemes in HVDC Networks

2.1. Overview of HVDC Control Schemes

The conventional control approach for a point-to-point HVDC link is that one converter station is equipped with constant DC voltage control and the other station with constant power control. However, disruptions in the station regulating DC voltage would result in malfunction of the DC link. To this end, voltage droop schemes were introduced to enhance the regulation capabilities. With the adoption of these schemes, both converter stations can undertake power and voltage regulation and, thus, the DC link can remain operational following contingencies in either converter station. Different types of droop control methods are summarised in Table 1.
As shown in Table 1, droop control schemes are generally classified into two types: conventional methods with a single droop characteristic [15,21,22] and improved methods with multiple droop characteristics [17,18,19,20,23]. Droop controllers have been modified to improve the transient performance [21] and enable frequency regulation in the AC system [22]. To achieve a better power control accuracy, multiple droop characteristics have been adopted [17,18,19,20,23], where control interactions may occur in the narrow droop range (high droop slope) of the piecewise droop curves [23].

2.2. Research Gap

Multiple droop control can achieve accurate power flow control. However, due to the resulting narrow droop range around desired operating points, potential interactions between the converter stations of an HVDC link may arise. Such adverse control interactions have been rarely investigated in the literature, with [23] reporting interactions arising from a power and current versus voltage droop configuration only. Given the widescale deployment of MMC-based HVDC links and the interest in multi-terminal HVDC systems, interactions resulting from different control characteristics and their adverse impacts still need to be comprehensively assessed—particularly if converter stations are provided by different manufacturers implementing different control characteristics.

3. Control Characteristics

Control schemes for grid-tied VSCs can be designed using either a voltage against current (V-I) frame or a voltage against power (V-P) frame.

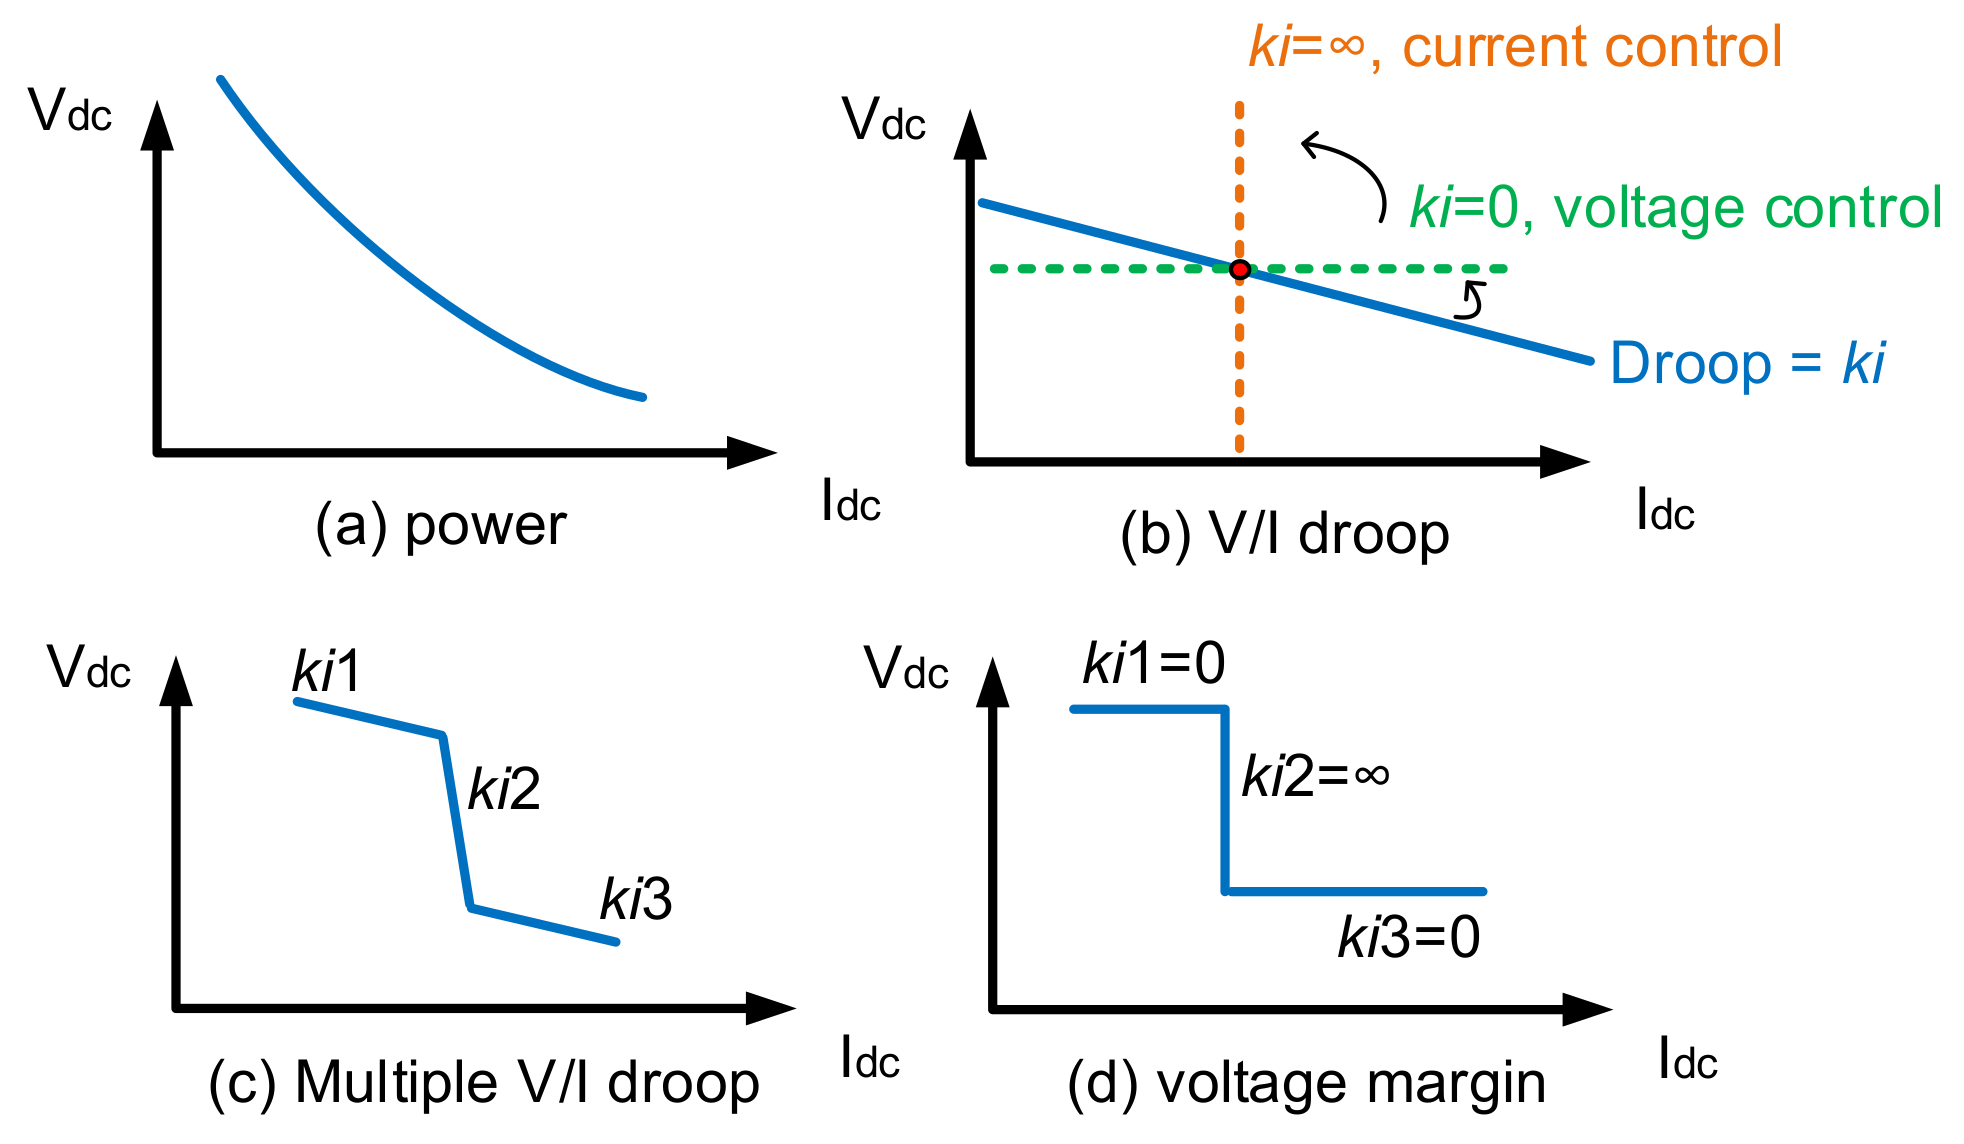
3.1. Voltage against Current (V-I) Frame

Figure 1 shows four typical V-I characteristics for active power control, DC voltage versus current (Vdc vs. I) droop, multiple Vdc vs. I droop and voltage margin with current control scheme.
The power control curve illustrated in Figure 1a has a non-linear characteristic:
P = V d c × I d c .
The slope of the power curve, kslope, is not constant and is given as:
k s l o p e = V d c I d c .
The Vdc vs. I droop scheme has a linear characteristic, as shown in Figure 1b, and can be expressed as:
( V o V m ) = I o I m × k i , ( < k i < 0 ) ,
where k i is the gain of the Vdc vs. I droop, V o and I o are the reference DC voltage and current, respectively. If k i is set to zero in (3), then the control loop will operate as a constant DC voltage control scheme (i.e., V o = V m ) and the DC voltage will not be influenced by the change of DC current in steady-state. When k i is set to infinite, the control scheme operates as a constant current controller (i.e., I o = I m ). However, the use of a very large proportional gain in a control loop is not practical, so the current control equation is obtained by re-writing (3) as:
( V o V m ) × k i r = I o I m ,
where k i r = k i 1 is the gain of the I vs. Vdc droop and kir can be set to zero in (4) to achieve direct current control. Hence, the I vs. Vdc droop can replace the Vdc vs. I droop.
The advantages of using droop control are described in [16,17,18,19]. However, a major shortcoming is that current or power cannot be regulated to a desired set point. For the Vdc vs. I droop, if gain k i is assigned a very small magnitude, the droop controller will exhibit more controllability over the DC voltage than the current. Therefore, the DC current will be very sensitive to any change in DC voltage. For example, a measurement error caused by a voltage transducer could lead to a large current offset. To overcome this problem, an alternative droop method is used to assign multiple droop gains to a VSC, as shown in Figure 1c.
During normal operation, the multiple droop scheme uses a very high droop gain ( k i 2 ) to achieve an improved current control within a certain voltage band. Two other droop gains with reduced values ( k i 1 , k i 3 ) are used for DC voltage control when, following a disturbance, the system voltage or current exceeds the original band.
Figure 1d shows a voltage margin with current control scheme which achieves a similar performance as the multiple droop scheme. However, a drawback of this method is that it may result in only one converter regulating the DC voltage at a time; thereby potentially affecting the capability for effective DC voltage control [9].

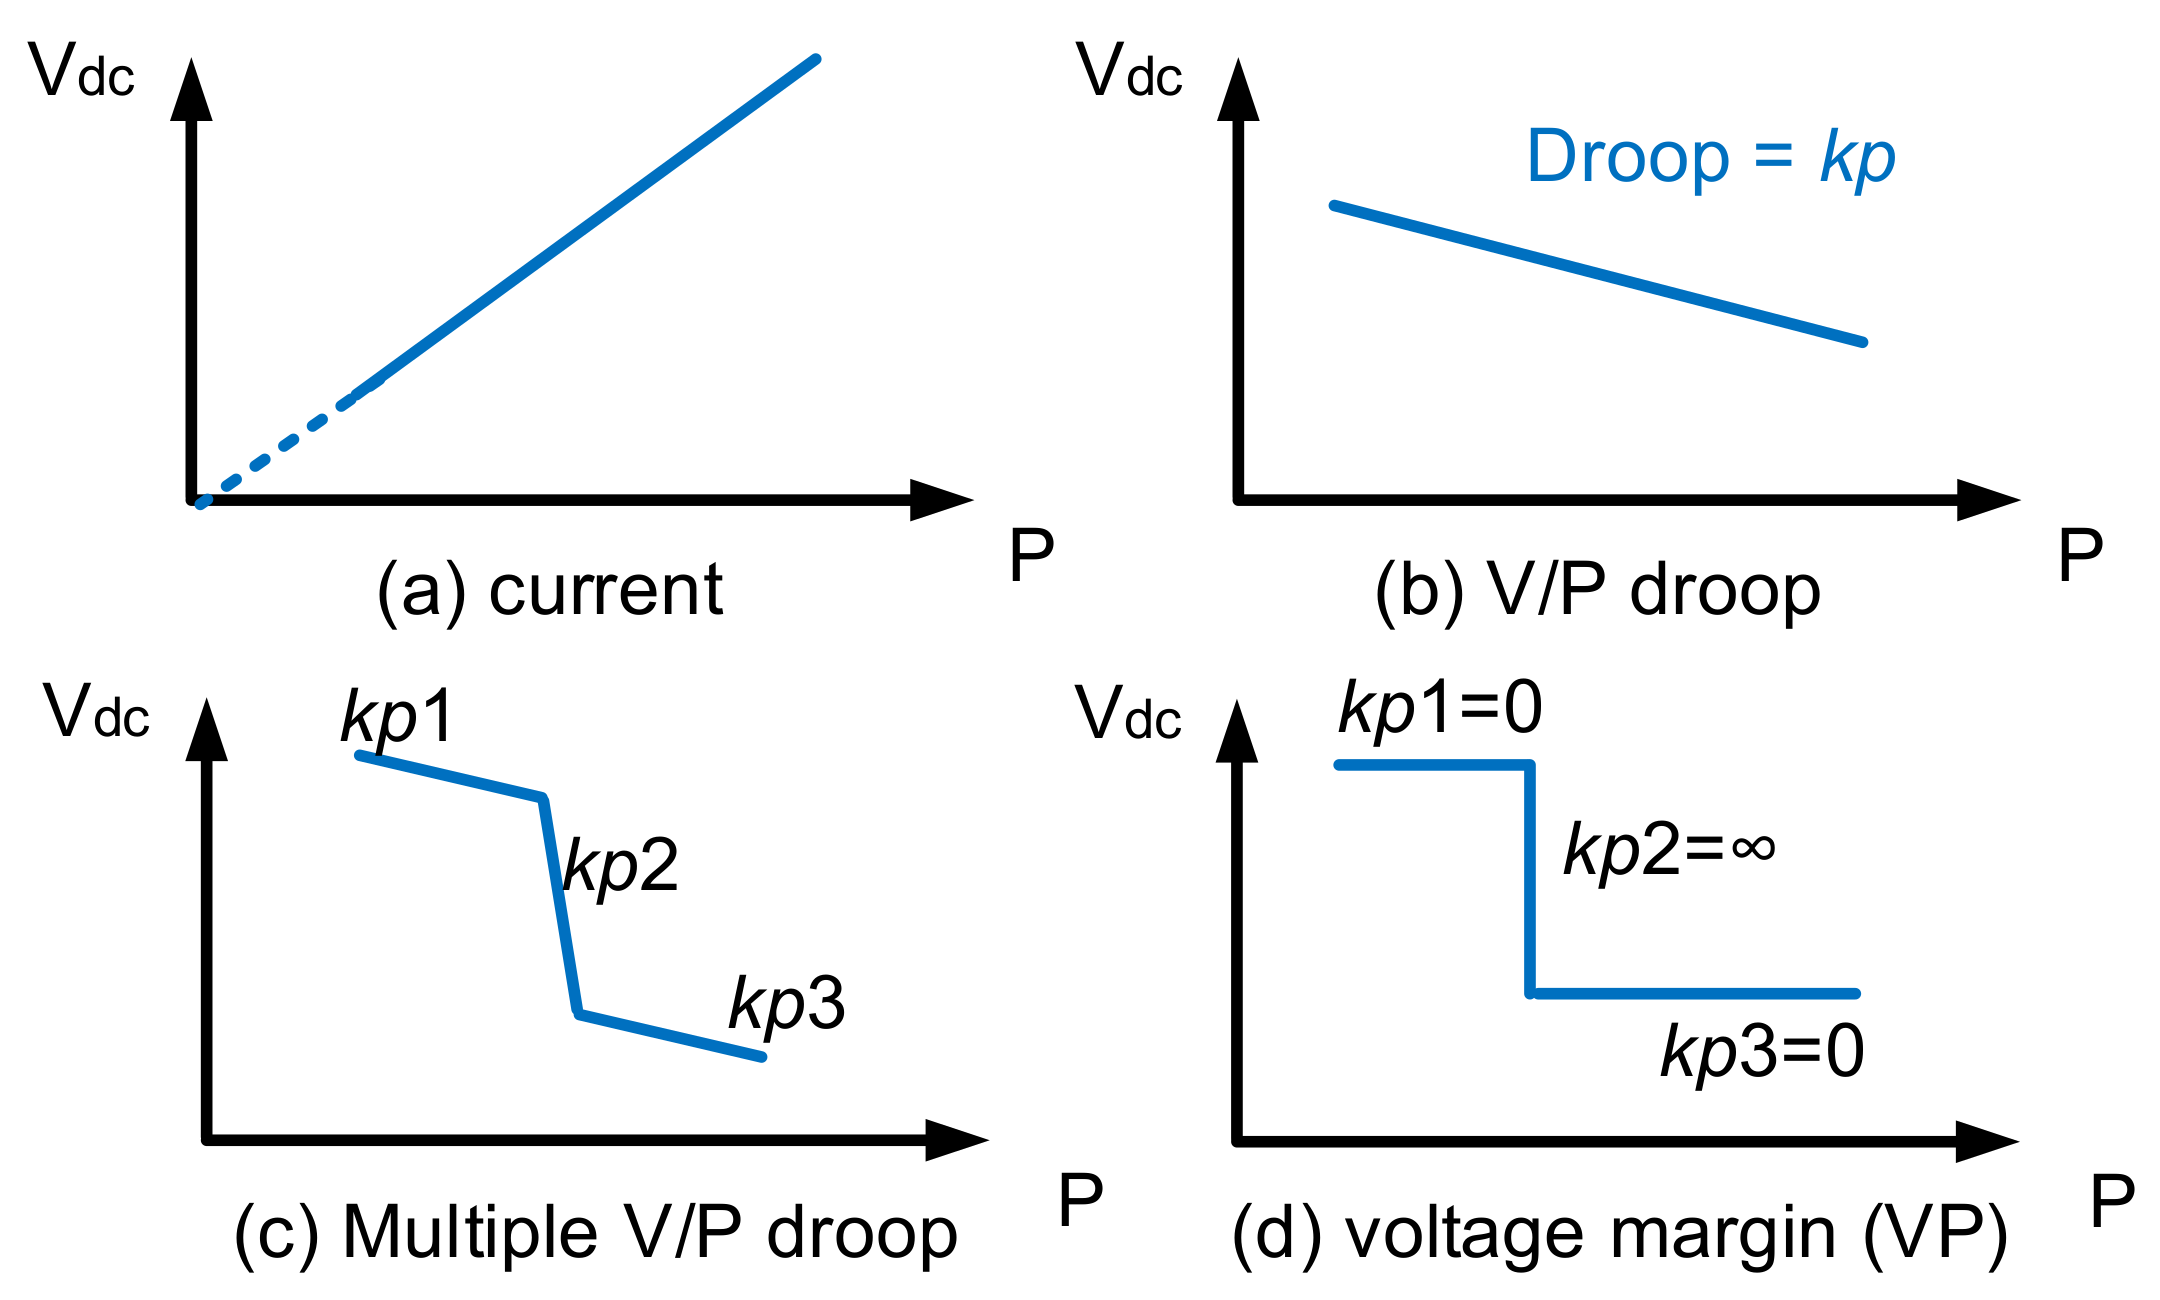
3.2. Voltage against Power (V-P) Frame

Figure 2 shows four typical V-P characteristics for DC current control, DC voltage versus power (Vdc vs. P) droop, multiple Vdc vs. P droop and voltage margin with power control schemes.
The DC current control curve has a linear slope as illustrated in Figure 2a. From Figure 2b, the Vdc vs. P droop control equation is:
( V o V m ) = P o P m × k p , ( < k p < 0 ) ,
where P o and P m are the reference and measured power, respectively and k p is the gain of the Vdc vs. P droop. A multiple Vdc vs. P droop scheme is illustrated in Figure 2c and a voltage margin with power control scheme is shown in Figure 2d.

3.3. Multiple Cross-Over of Control Characteristics

MMC control schemes should be carefully designed to avoid multiple cross-over of control characteristics. Figure 3 shows the V-I control interactions on a two-terminal HVDC network when Conv1 regulates power and Conv2 uses a Vdc vs. I droop. The multiple cross-over issue can occur when the droop-controlled Conv2 is an exporting converter (rectifier) and the current-controlled Conv1 is an importing converter (inverter).
In Figure 3b, three different crossings occur at the intersection of the Vdc vs. I droop and the power control characteristics. This triple cross-over will result in the shifting of steady-state DC voltage from the intended voltage (Vopt) to a higher value (Vopt1) or to a lower one (Vopt2). Therefore, the converters can operate with three different DC voltages for the same amount of power and this may result in unintended power imbalances [16]. Such a multiple-crossing problem can be avoided by reversing the power flow through Conv1 to achieve a single operating point (Vopt), as illustrated in Figure 3c.
Figure 4 shows the V-P control interactions on a two-terminal HVDC network with Conv1 regulating current and Conv2 using a Vdc vs. P droop. In Figure 4b, three different crossings (Vopt, Vopt1 and Vopt2) occur at the intersection of the Vdc vs. P droop and the constant DC current control characteristics. If the current flow is reversed on Conv1, then a single operating point (Vopt) exists and the multiple crossing problem is avoided, as seen in Figure 4c.

4. Mathematical Analysis

Figure 5 shows an ideal DC grid with multiple VSCs using droop control and other VSCs using power or current control schemes. In Figure 5a, the DC grid is composed of n converters equipped with a Vdc vs. I droop control and m converters in power control. The sum of current flowing through the converters is balanced:
i = 1 n I d r p i + j = 1 m I p o w e r j = 0
where Idrpi is the current of one droop-controlled VSCs and Ipowerj is the current through a single power-controlled VSC. During normal operation, the converters with droop control will operate in their active region using the equation:
I d r p i = I o i 1 k i × V d r p i + 1 k i × V o i
The current flow through the converters in power control is:
I p o w e r j = P p o w e r j V p o w e r j
Substituting (7) and (8) into (6) gives:
i = 1 n I o i 1 k i × V d r p i + 1 k i × V o i + j = 1 m P p o w e r j V p o w e r j = 0
where Vdrpi is the measured DC voltage on the VSCs with droop and Vpowerj is the measured DC voltage at the power-controlled VSCs.
For simplicity, it is assumed that VSCs with droop control have the same Vo and that all the VSCs in power control maintain constant power. Considering an ideal DC network:
V d r p = V d r p i = V p o w e r j
To obtain the slope of the equivalent control characteristics of all VSCs in power control and all the VSCs using droop control, the derivative of (9) can be taken with respect to Vdrp, yielding:
i = 1 n 1 k i + j = 1 m P p o w e r j V o 2 = 0
In (11), term 1 / i = 1 n 1 k i is the equivalent slope of the Vdc vs. I droop curve and term 1 / j = 1 m P p o w e r j V o 2 is the slope of the merged power curve. To avoid multiple crossing between the droop curve and power curve, the following condition should hold:
1 i = 1 n 1 k i 1 j = 1 m P p o w e r j V o 2
In Figure 5b, the DC network has y converters using Vdc vs. P droop control and z converters in current control. The sum of power flowing through the converters is balanced:
i = 1 y P d r p i + j = 1 z P p o w e r j = 0
where Pdrpi is the power of a single VSC with the droop control and Ppowerj is the current through a single VSC with current control. During normal operation, the control equation of the converters with the Vdc vs. P droop is given as:
P d r p i = P o i 1 k p × V d r p i + 1 k p × V o i
The power through the converter in current control mode is obtained from (8). Substituting (14) and (1) into (13) yields:
i = 1 y P o i 1 k p × V d r p i + 1 k p × V o i + j = 1 z I p o w e r j × V p o w e r j = 0
To find the slope of the merged control characteristics of all VSCs with the Vdc vs. P droop and the VSCs in current control mode, the derivative of (15) is taken with respect to Vdrp, yielding:
i = 1 y 1 k p + j = 1 z I p o w e r j = 0
To avoid multiple curve crossings, the following condition must hold:
1 i = 1 y 1 k p 1 j = 1 z I p o w e r j ,
where term 1 / i = 1 y 1 k p is the equivalent slope of Vdc vs. P droop control curve and term 1 / j = 1 z I p o w e r j is the slope of the merged current control curve. The Vdc vs. P droop is implemented as a P vs. Vdc droop and the Vdc vs. I droop is implemented as an I vs. Vdc droop in the following sections.

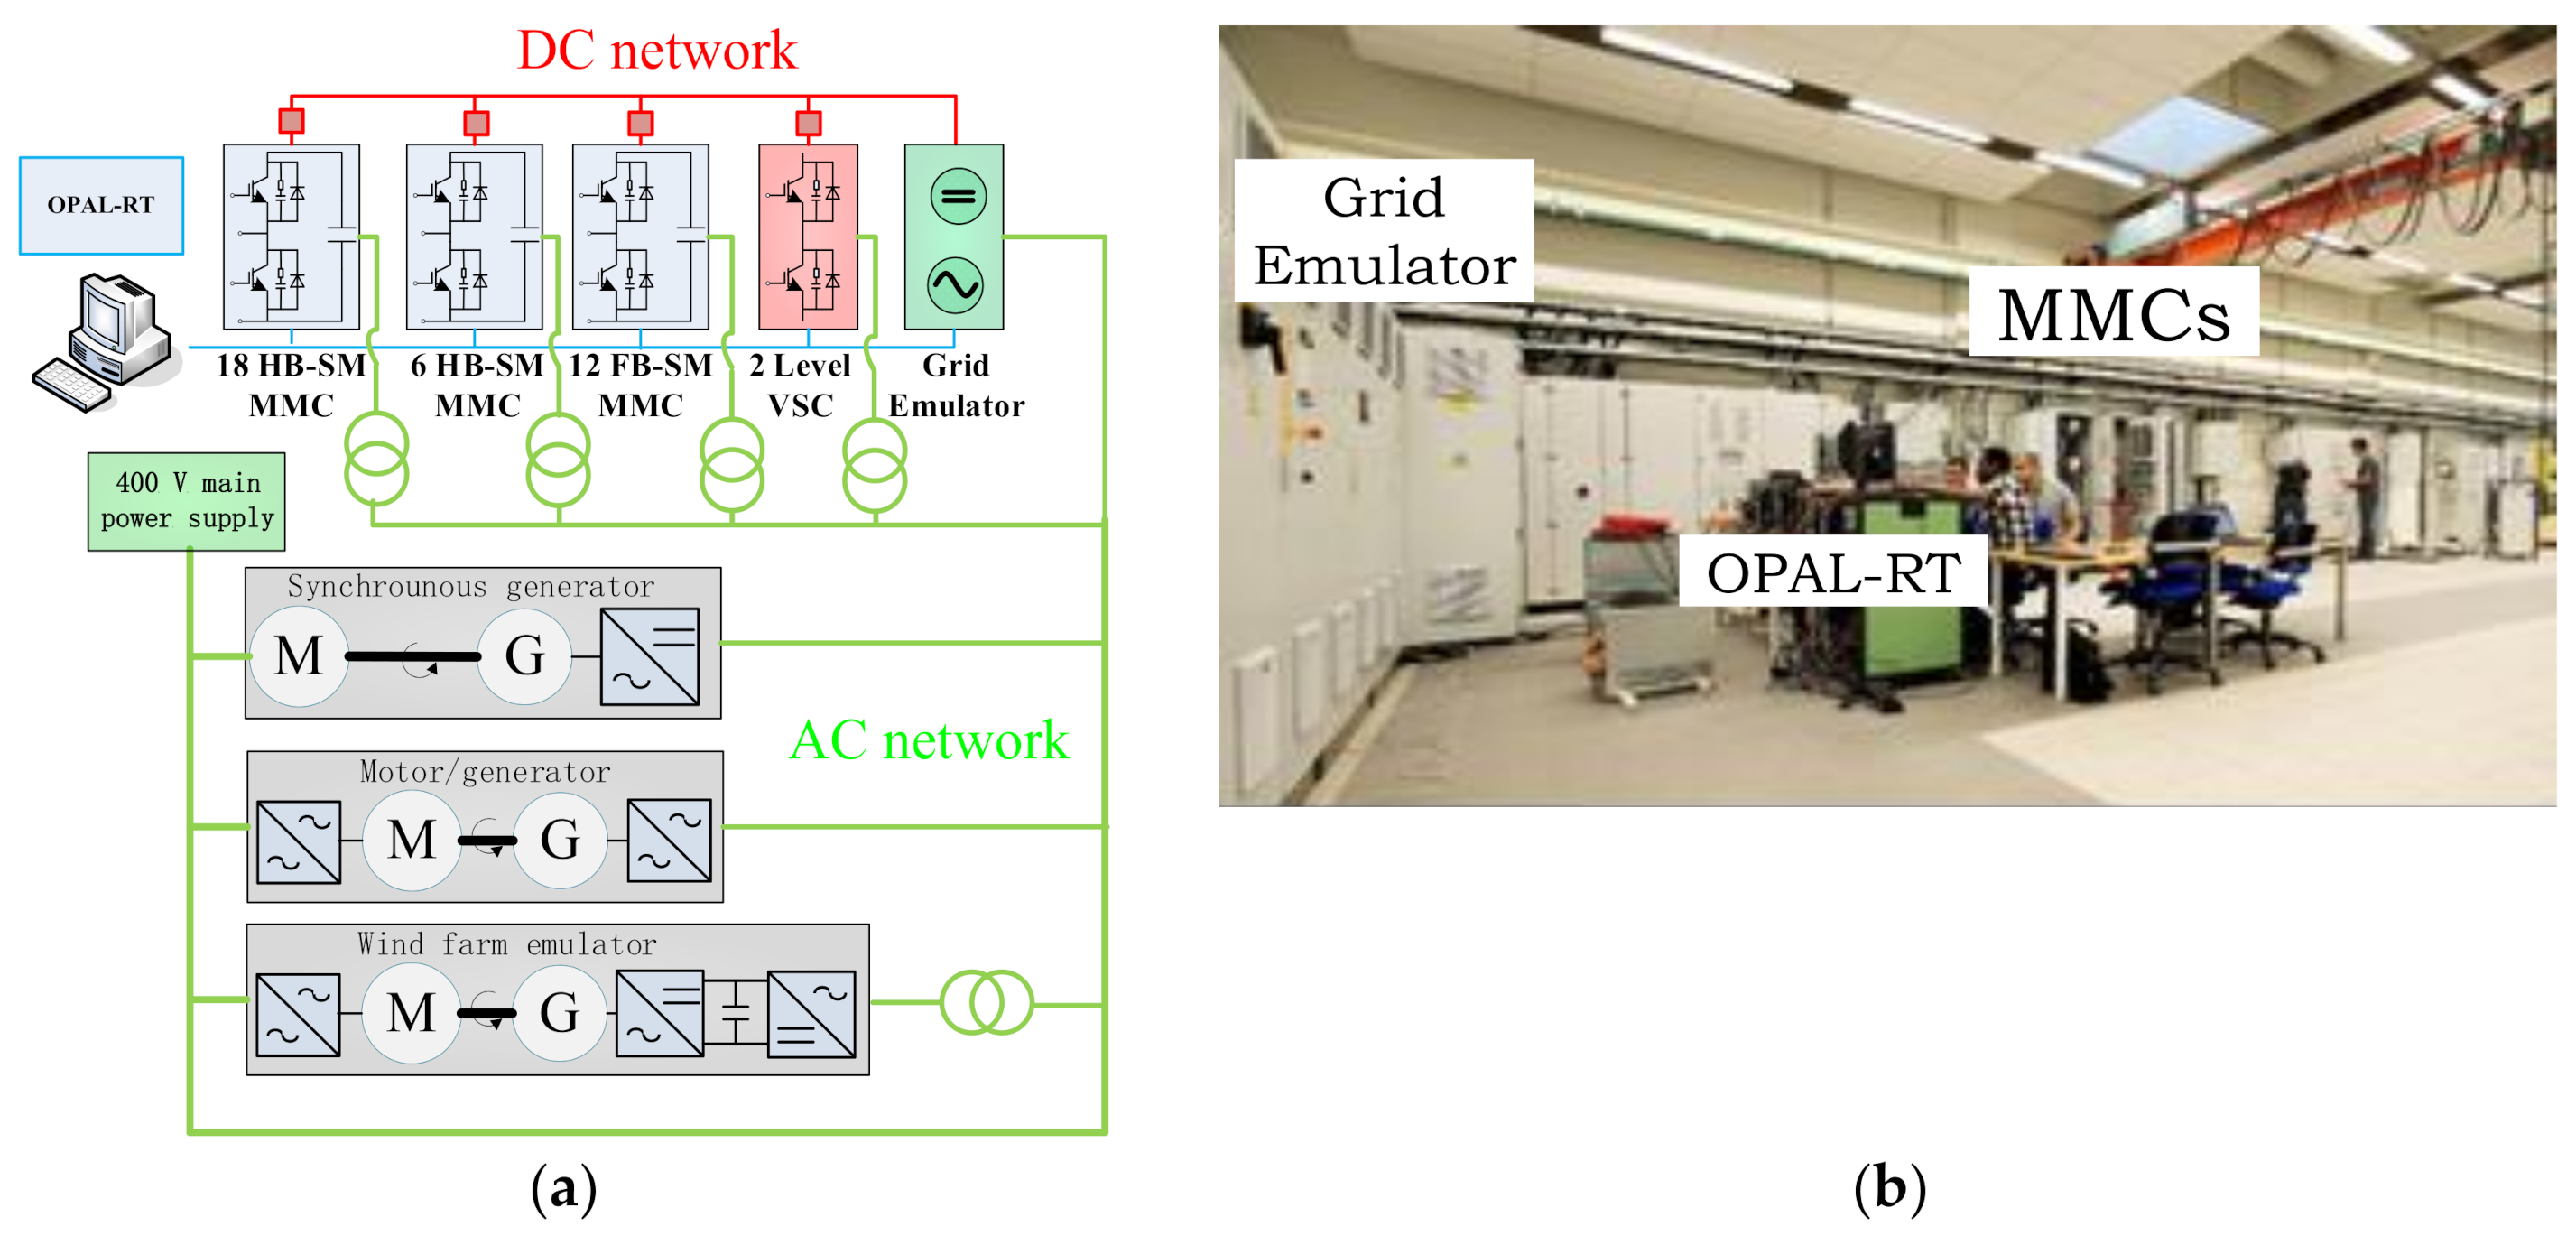
5. MMC-Based Test System

An MMC-based experimental test-rig is used to demonstrate droop control interactions between different converter stations in HVDC networks.

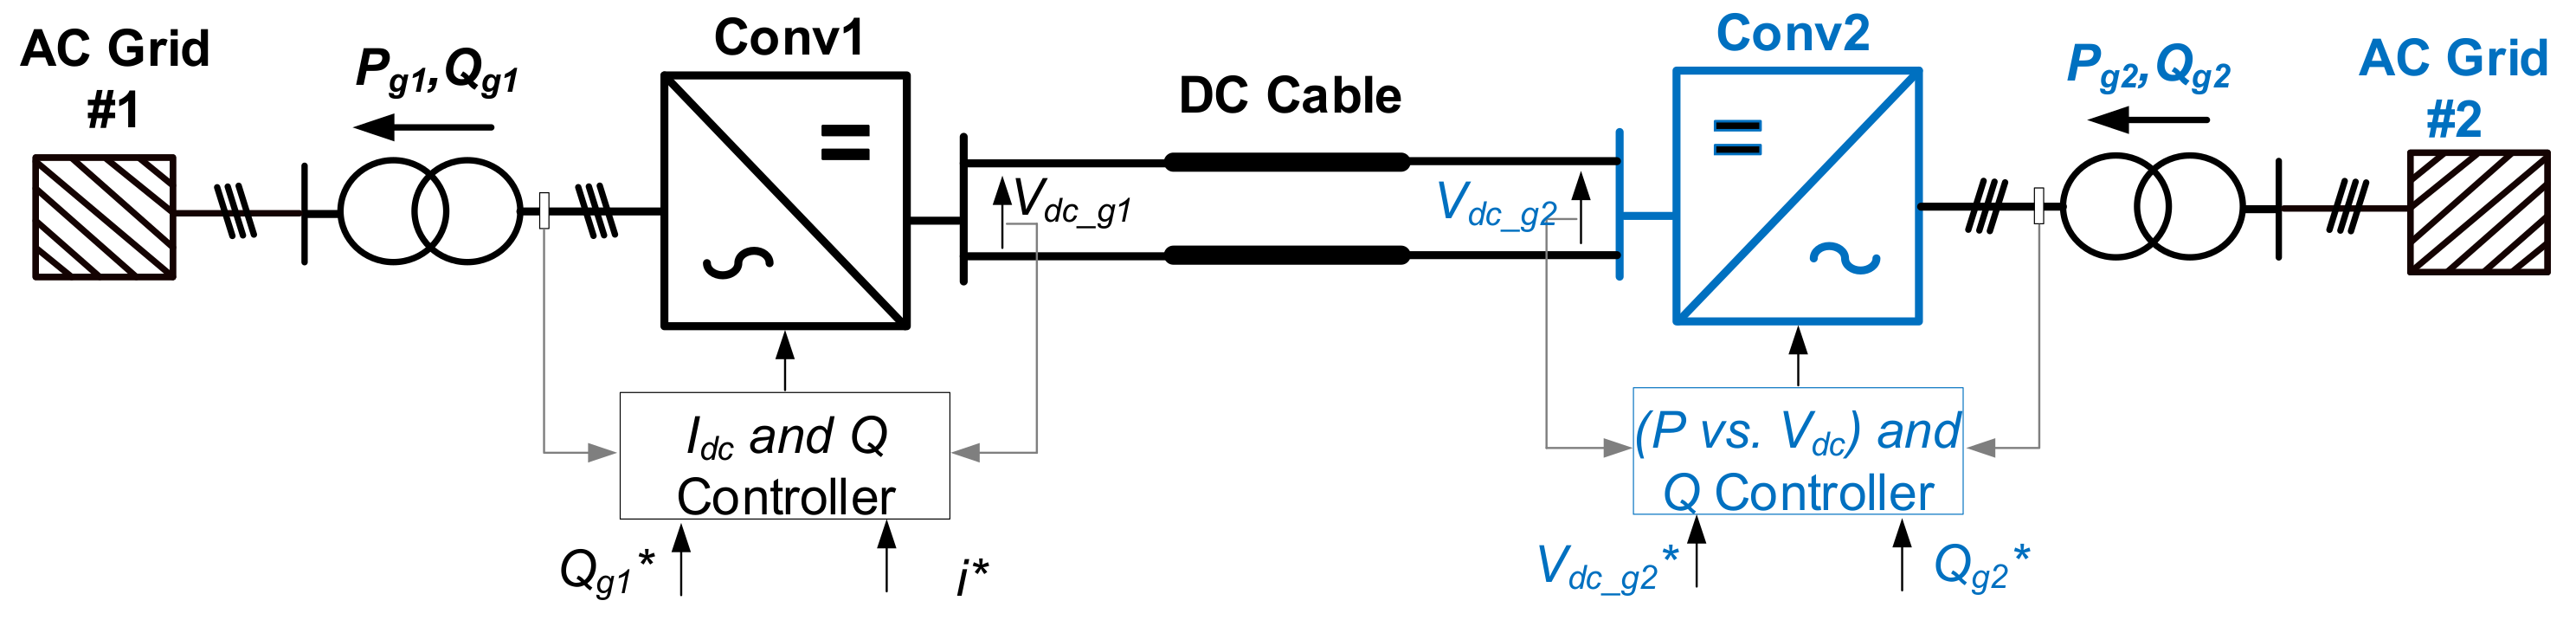
5.1. Configuration of the MMC Demonstrator

The demonstrator consists of three different MMCs each rated at 60 kW, a grid emulator with rated power of 200 kW and a two-level VSC. The MMCs consist of a half-bridge type with 18 submodules per arm, a full-bridge type with 12 submodules per arm and another half-bridge type with 6 submodules per arm. The power converters have a nominal voltage of 400 V AC and 800 V DC [25]. Figure 6 shows the schematic diagram and configuration of the experimental demonstrator.
The grid emulator is a switching converter with a high bandwidth. It has six digital amplifiers controlled by field-programmable gate arrays and can represent power system components such as AC/DC sources, loads and electrical machines. A three-phase AC voltage source is modelled in real-time and connected through the grid emulator to the MMCs for hardware-in-the-loop tests. The two-level VSC can be connected to the three MMCs to form a four-terminal DC system. Data acquisition, control and monitoring of the power converters and grid emulator are achieved using OPAL-RT.

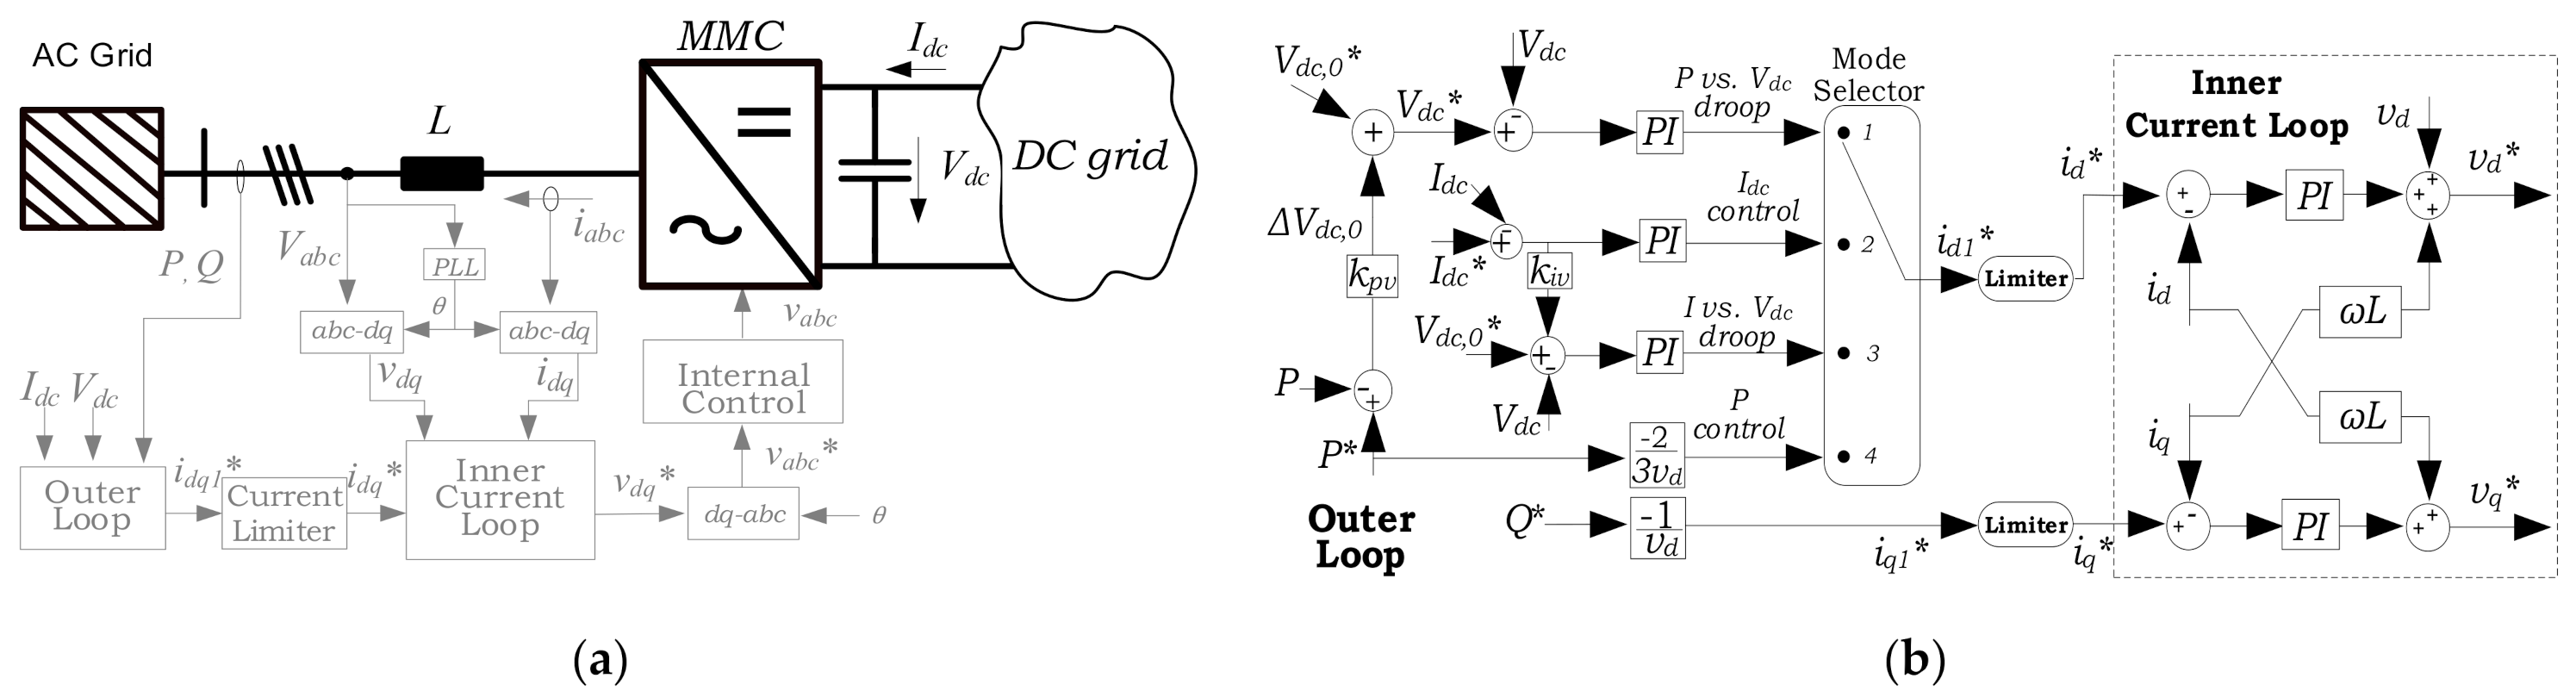
5.2. Control Structure of Grid-Tied MMC

Figure 7 shows the generic control scheme of an MMC connected to an AC network with synchronous generation. The control structure is organised into an outer loop, an inner current loop and an internal control block. The outer loop and the inner current loop use a vector control strategy to regulate the direct (d) and quadrature (q) components of the AC grid currents, iabc, and voltages, Vabc. A phase-locked loop (PLL), whose input is the AC grid voltage, Vabc, generates a reference phase angle, θ, for the abc-to-dq transformation of the AC currents and voltages, as seen in Figure 7a [4,26].
The outer loop is configured to operate using four different control modes, shown in Figure 7b. These control modes are: (1) power vs. DC voltage droop and reactive power; (2) active power and reactive power; (3) current and reactive power; and (4) current vs. DC voltage droop and reactive power. The output of the outer loop is a current signal, idq1*, which is fed through a current limiter to the inner current loop, as shown. The (limited) reference current, idq*, is fed to the inner current controller, which generates reference d-axis and q-axis voltage signals, Vdq*. Using the dq-to-abc transform, Vdq* is transformed to a reference abc voltage, Vabc*. Vabc* is the input to the internal control block, which produces the switching signals of the grid-side converter [6].
The internal control of the MMCs considers a circulating current suppression controller, a capacitor voltage balancing control and a modulation strategy. The two modulation strategies implemented in the demonstrator are the phase disposition pulse-width modulation (PWM) and the nearest-level vector control. The converter with 6 sub-modules per arm operates using phase disposition PWM. The converters with 12- and 18 sub-modules may use phase disposition PWM, nearest-level control or a combination of both modulation strategies—depending on operational requirements [6].

5.3. Open-Access Simulation Tool for DC Networks

An open-access simulation toolbox for grid-connection of wind farms through HVDC networks is used to represent the steady-state and dynamic characteristics of the experimental demonstrator. The toolbox comprises basic building blocks and control algorithms that can enable researchers and designers to study and simulate different topologies of DC networks for connection of offshore windfarms into terrestrial grids. The simulation toolbox was developed by Demo 1 partners in the BEST PATHS project and formulated using MATLAB/Simulink. The main components of the simulation toolbox are [24]:
  • Converter stations: with averaged and switched models of MMCs. Half and full-bridge submodules with arm reactors and AC circuit breakers are included. Averaged models can be employed to reduce the simulation time, while switched models may be used when an accurate assessment of system performance is required instead.
  • High-level controllers: with three modes of operation including DC voltage control and reactive power control, active power and reactive power control and AC voltage and frequency control. The high-level controllers communicate with a dispatch controller which is used, in turn, to select the control mode and manage the operating set points. The reference voltages produced by the high-level controllers are communicated to a lower-level controller (modulator) to generate switching signals.
  • Wind farm: a wind turbine generator with full power converters is modelled in detail and current injection is used to scale the generator output to the rated power of a wind farm.
  • DC cables: using a frequency-dependent, travelling wave model based on the universal line model for the adequate simulation of electromagnetic transients [27].
  • AC grid: adapted from the 9-bus system presented in [28].

6. Control Interaction Case Studies

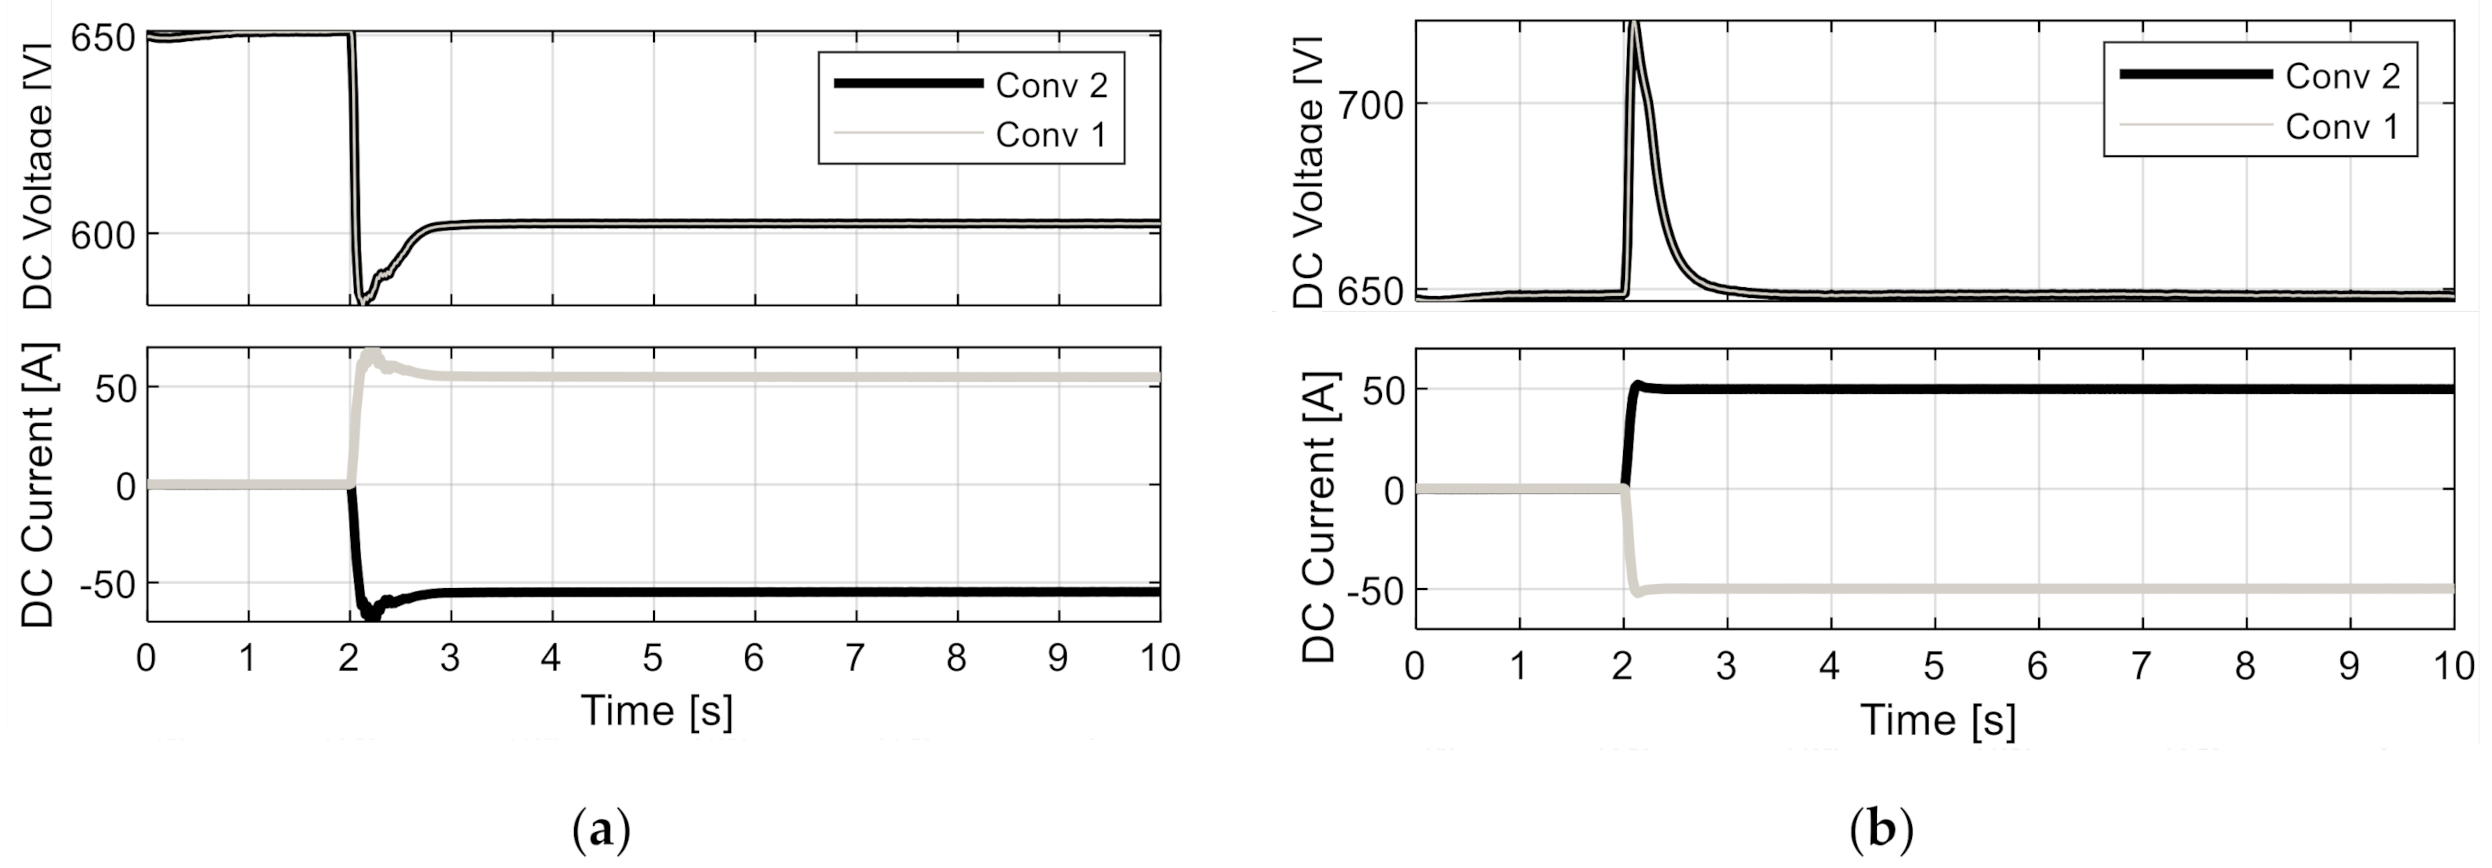
6.1. Experimental Results

The two-terminal DC system shown in Figure 3a and Figure 4a is used to demonstrate the risk of multiple cross-over of control characteristics. This point-to-point topology is employed for the interconnection of two different AC grids. Conv1 is an MMC with 12-submodules and Conv2 is an MMC with 6-submodules. Both MMCs use the phase disposition PWM. The sample time is set to 80 μs in both converters. The control parameters of the experimental demonstrator are included in Appendix A.

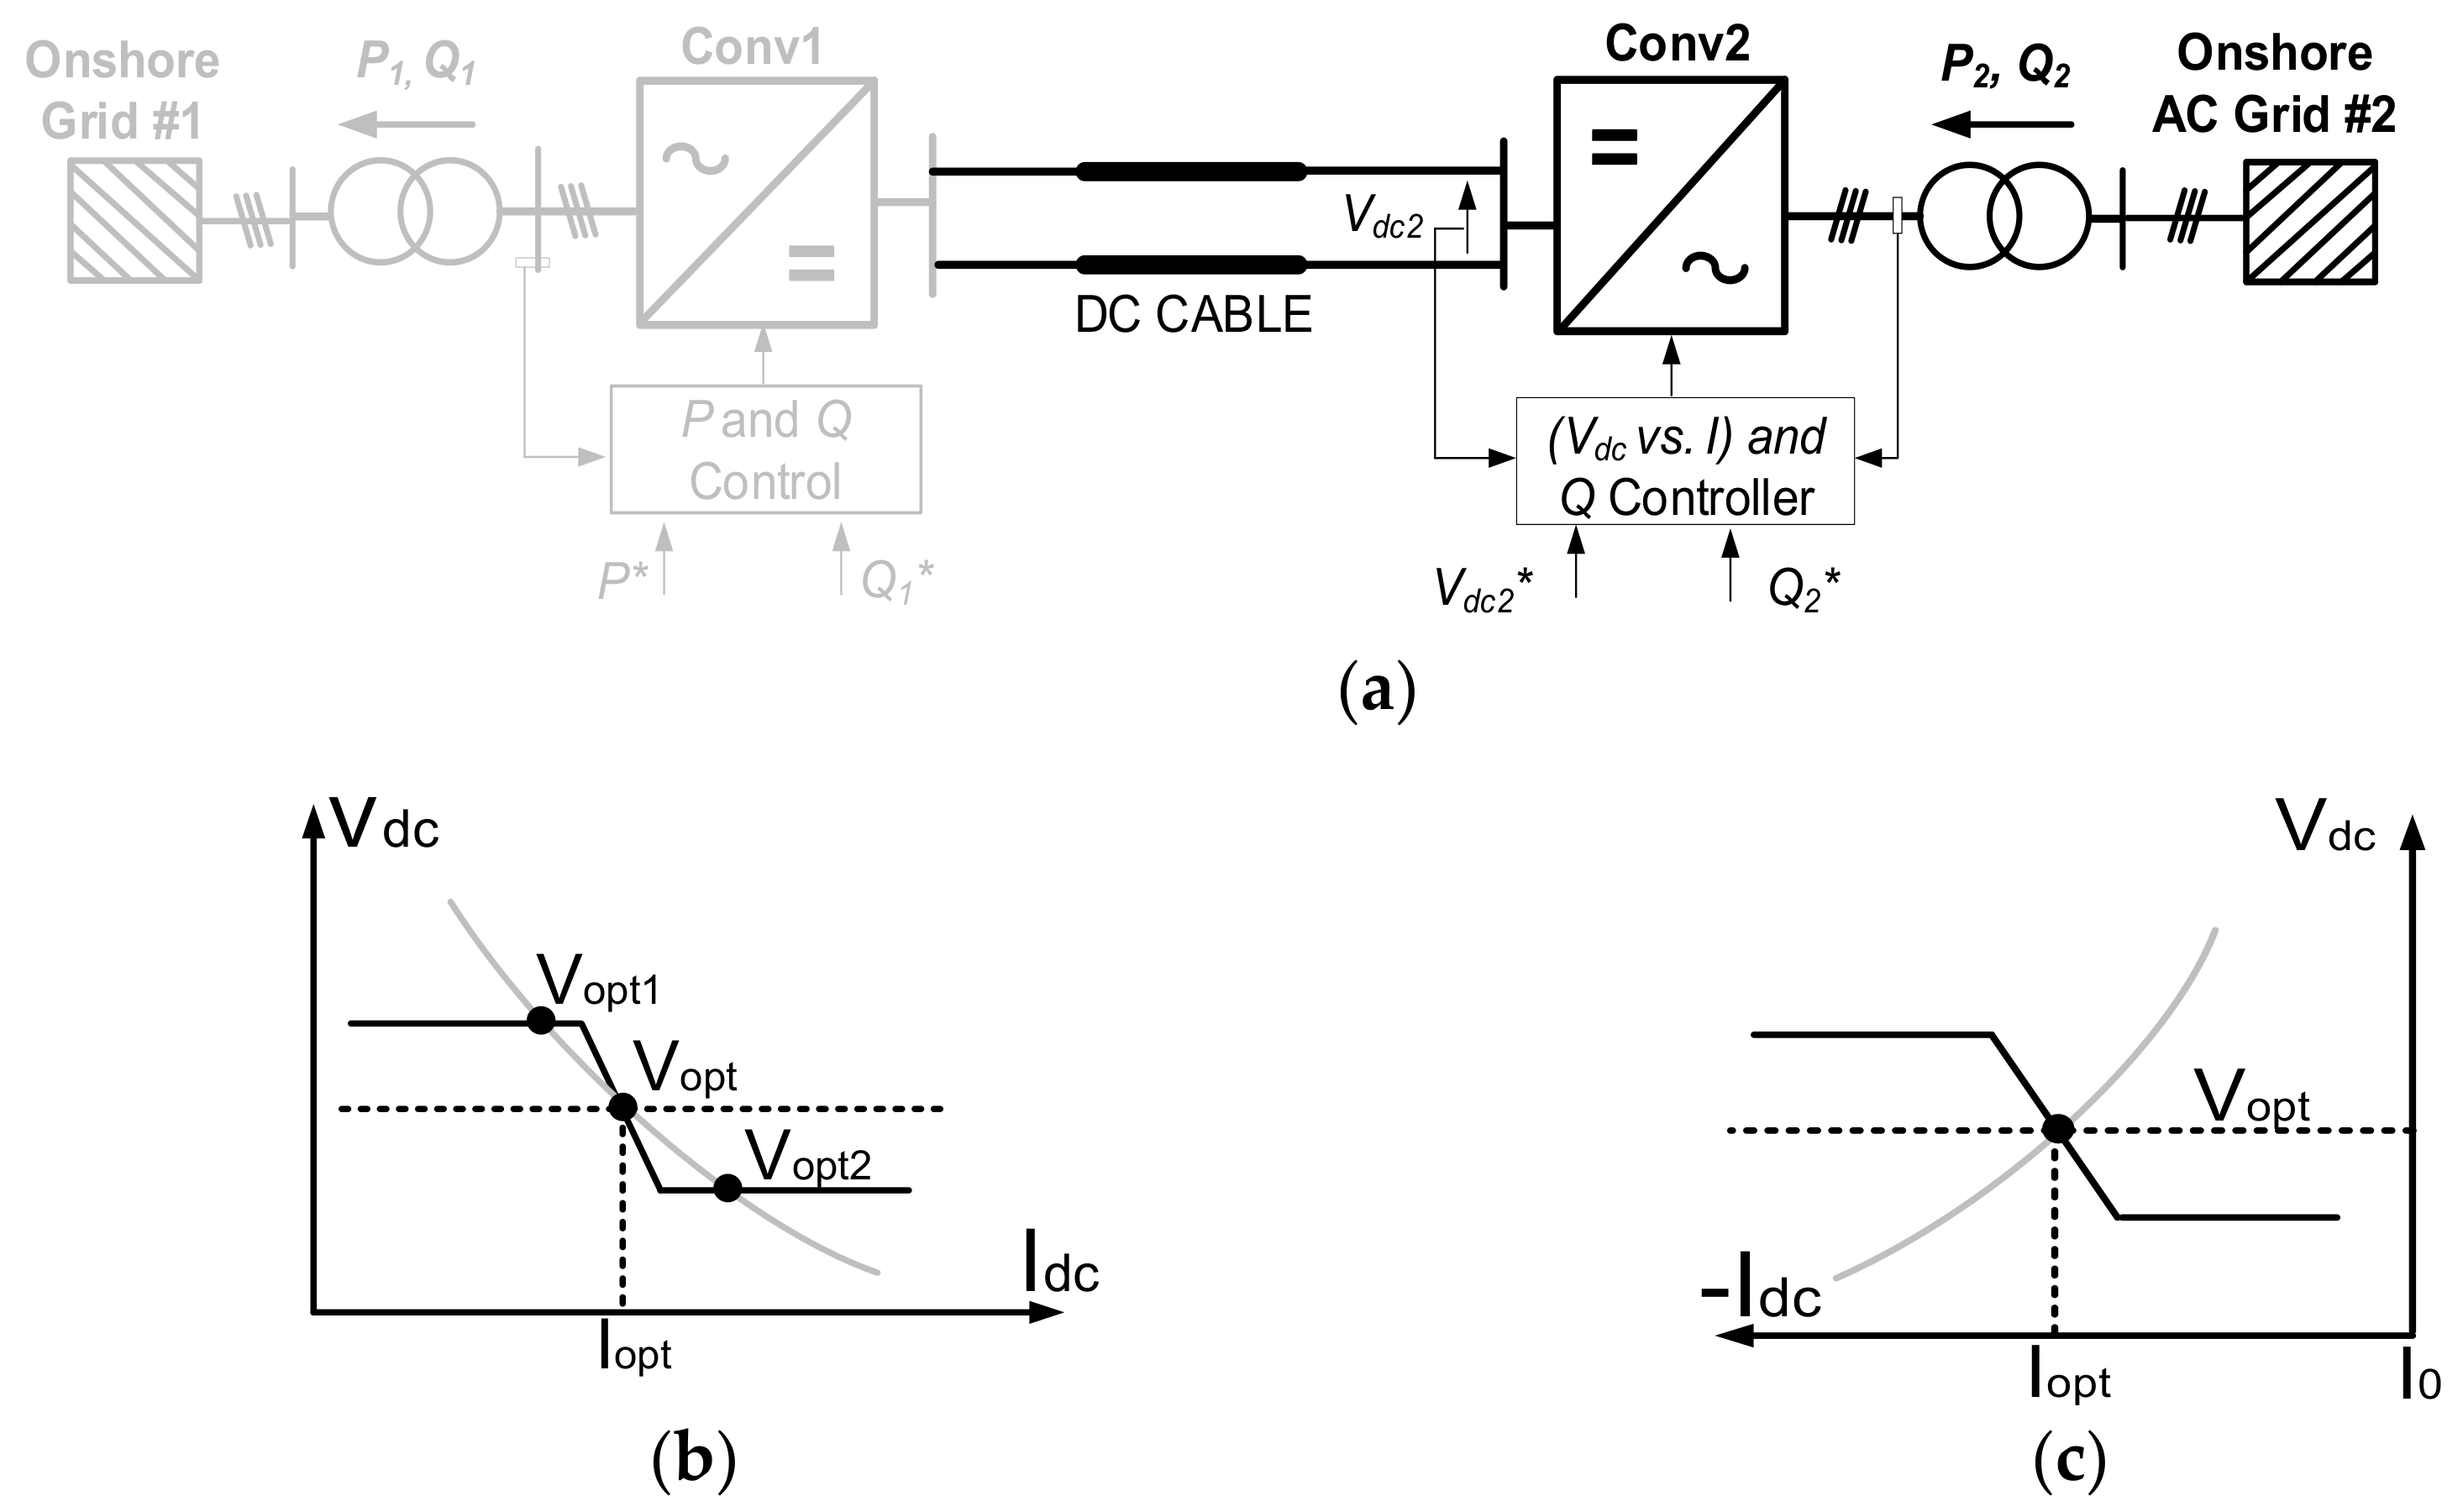
6.1.1. I vs. Vdc Droop against Power Control

Figure 8 shows the experimental results of active power, DC voltage and current for a power reversal on Conv1 at 2 s from −2000 W to 2000 W. During the period of 0 to 2 s, the power reference of Conv1 is set at −2000 W and the operating point of the DC voltage is 190 V. For this condition, multiple cross-over of control characteristics does not exist and there is no mismatch between reference and measured current through Conv1.
At time 2 s, the power set-point of Conv1 is reversed to 2000 W and the DC voltage drops to 180 V due to multiple cross-over of the converter control characteristics. This results in a current mismatch of 1 A between the measured and reference current on Conv1 following the power reversal after a short transient period.

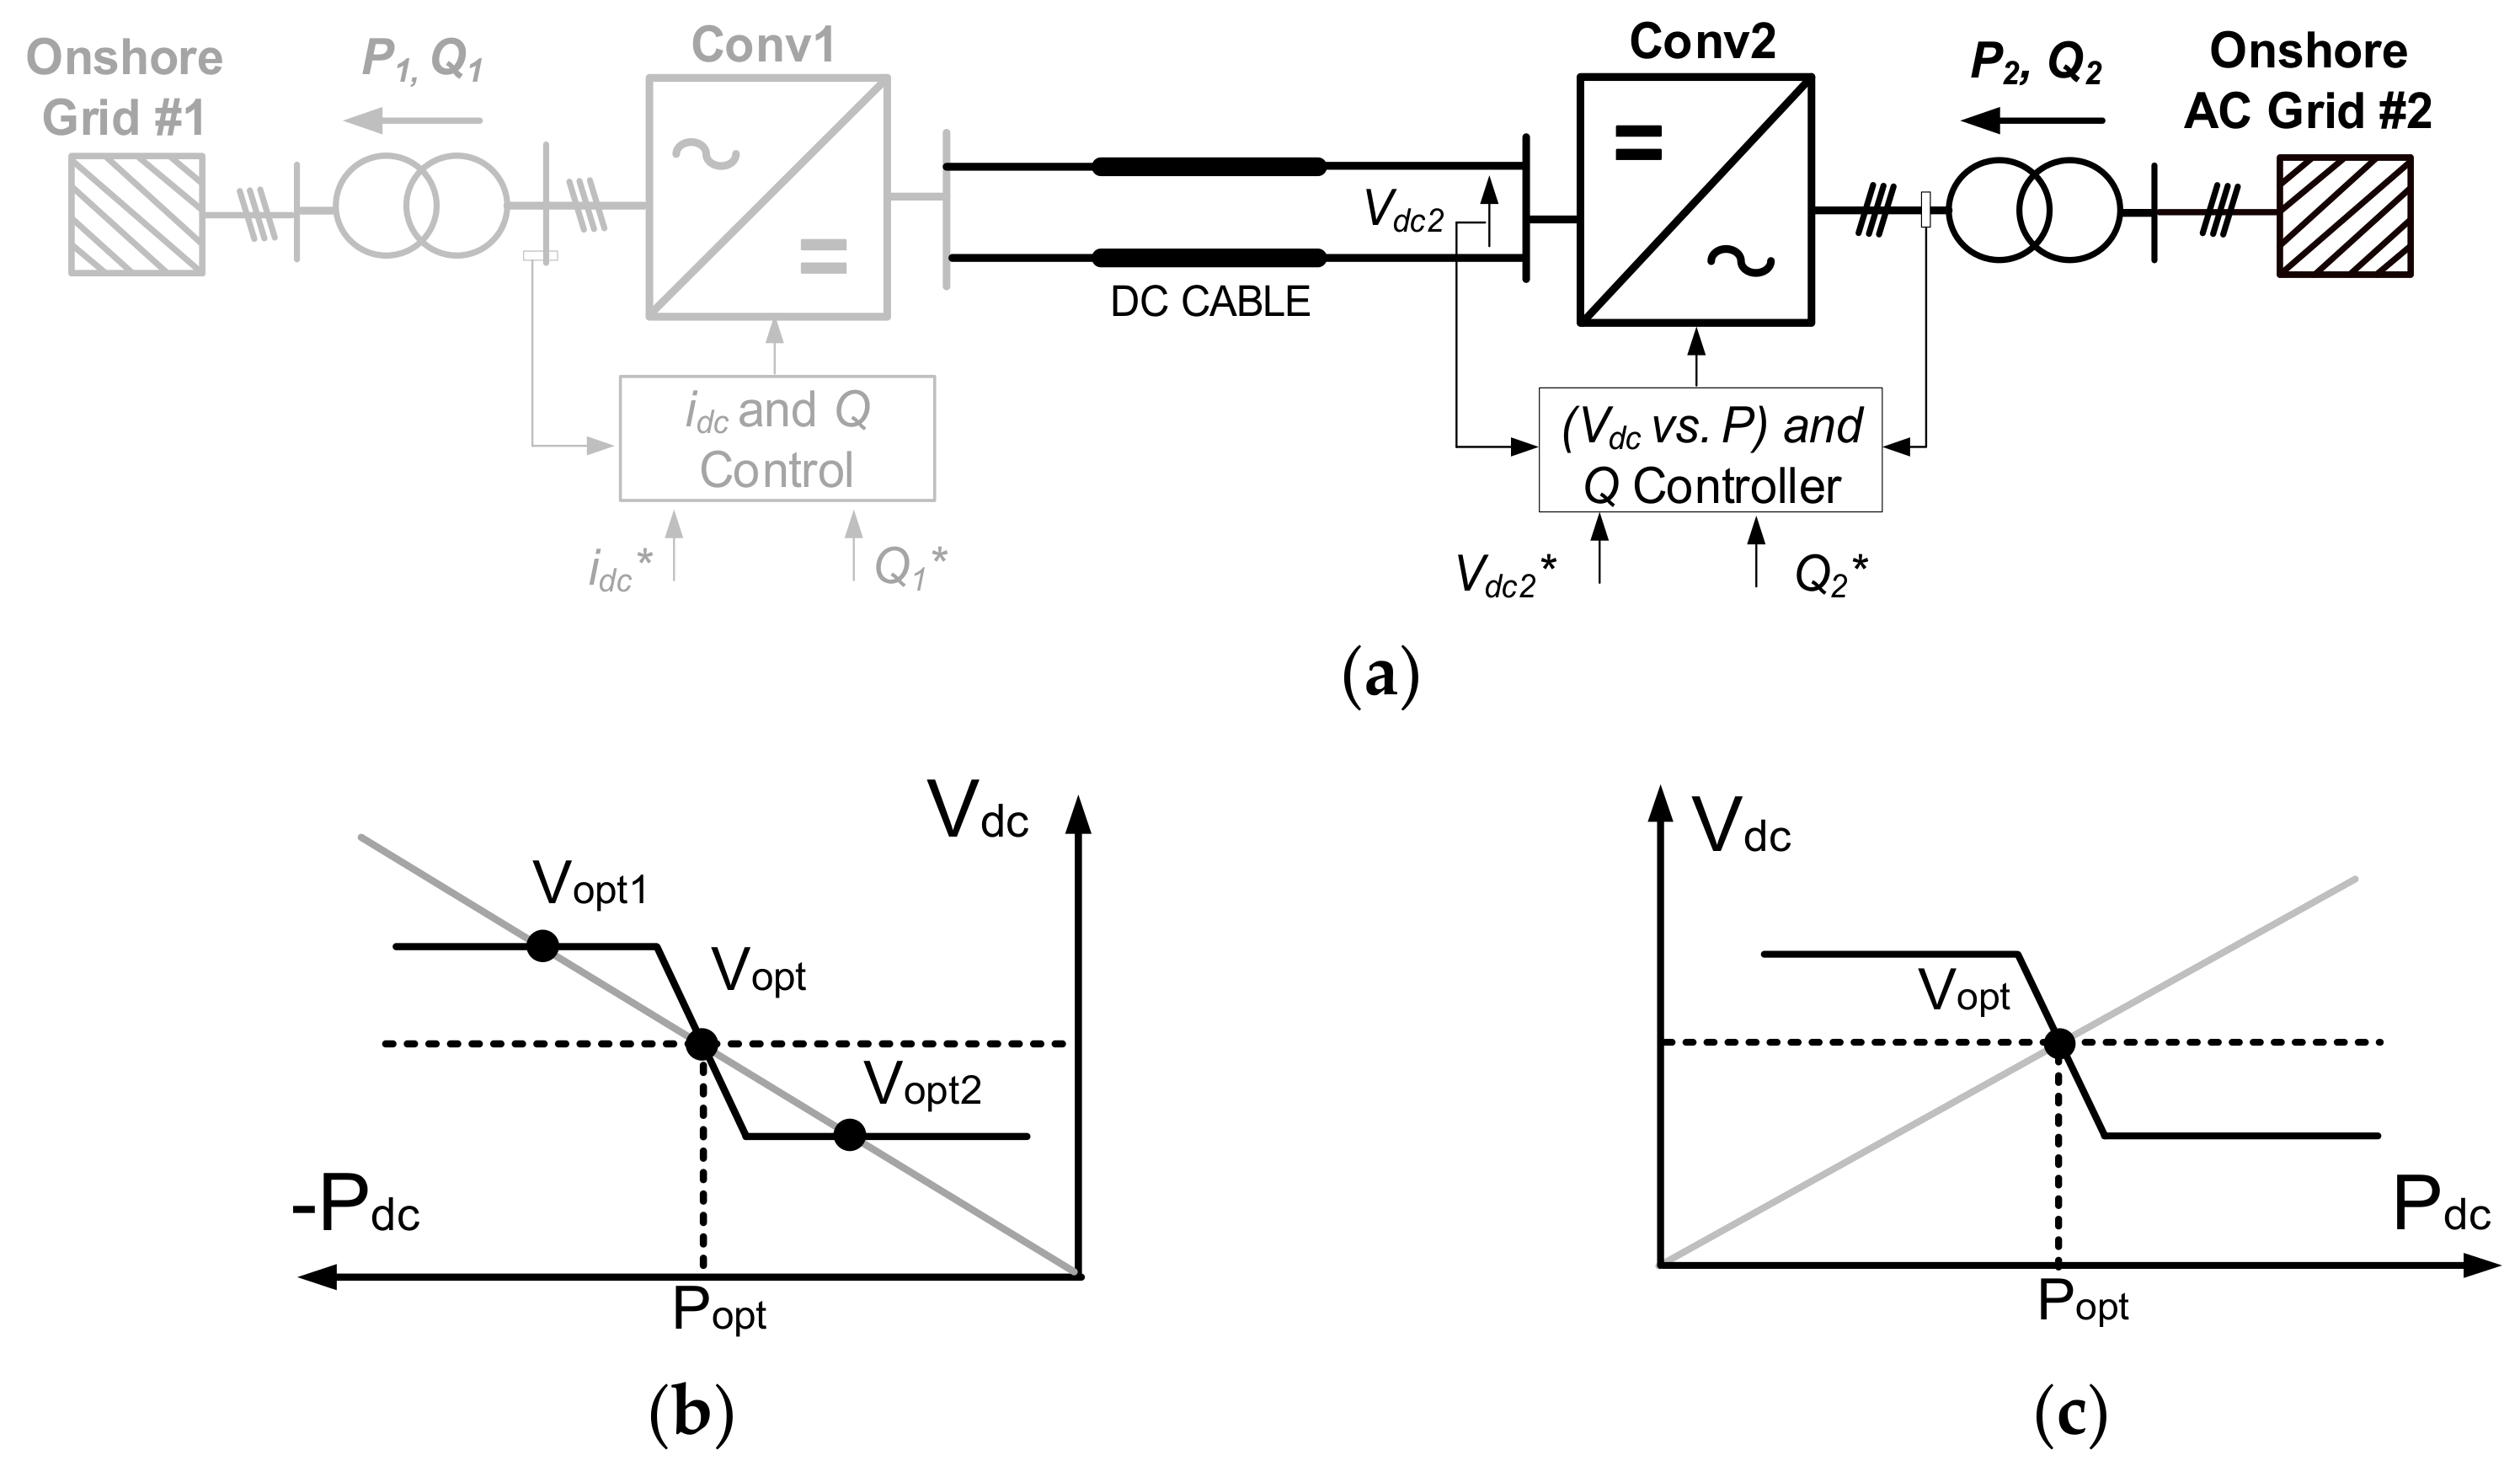
6.1.2. P vs. Vdc Droop against Current Control

Figure 9 shows the experimental results of active power, DC voltage and current for a current reversal on Conv1 from −10 A to 10 A at time 2 s.
Between 0 to 2 s, the current reference of Conv1 is −10 A and the operating point of DC voltage is 180 V due to a cross-over of the control characteristics. This results in a power mismatch of 200 W between the measured power (−1800 W) and the desired power (−2000 W). When current is reversed to 10 A, following a transient period, the multiple cross-over disappears and, hence, DC voltage increases to 190 V. This reduces the power mismatch to 100 W between 6 to 10 s.

6.2. Simulation Results

A two-terminal DC system is used to examine the risk of multiple cross-over of VSC control characteristics. The base values of system voltage, power and current are 650 V, 32.5 kW and 50 A and the control parameters are included in Appendix A. The necessary blocks to build the simulation model including the MMC stations and their controllers have been adopted from the open access toolbox developed in the BEST PATHS project (described in Section 5.3). The toolbox capabilities have been previously demonstrated for point-to-point links, three-terminal HVDC networks and six-terminal HVDC networks [24].
Two MMC stations, with 6 and 12 submodules, were deployed at the end of the HVDC link. For the high-level controllers, the MMC with 12 submodules works at constant P or Vdc control mode, while the MMC with 6 submodules operates using a droop control mode (either I vs. Vdc or P vs. Vdc droop). The inner current control loop works on a dq reference frame and a PLL is employed for synchronisation. Additional controllers for suppressing circulating current and voltage imbalance across the capacitors of submodules are included as well. These are consistent with the control structure shown in Figure 7.

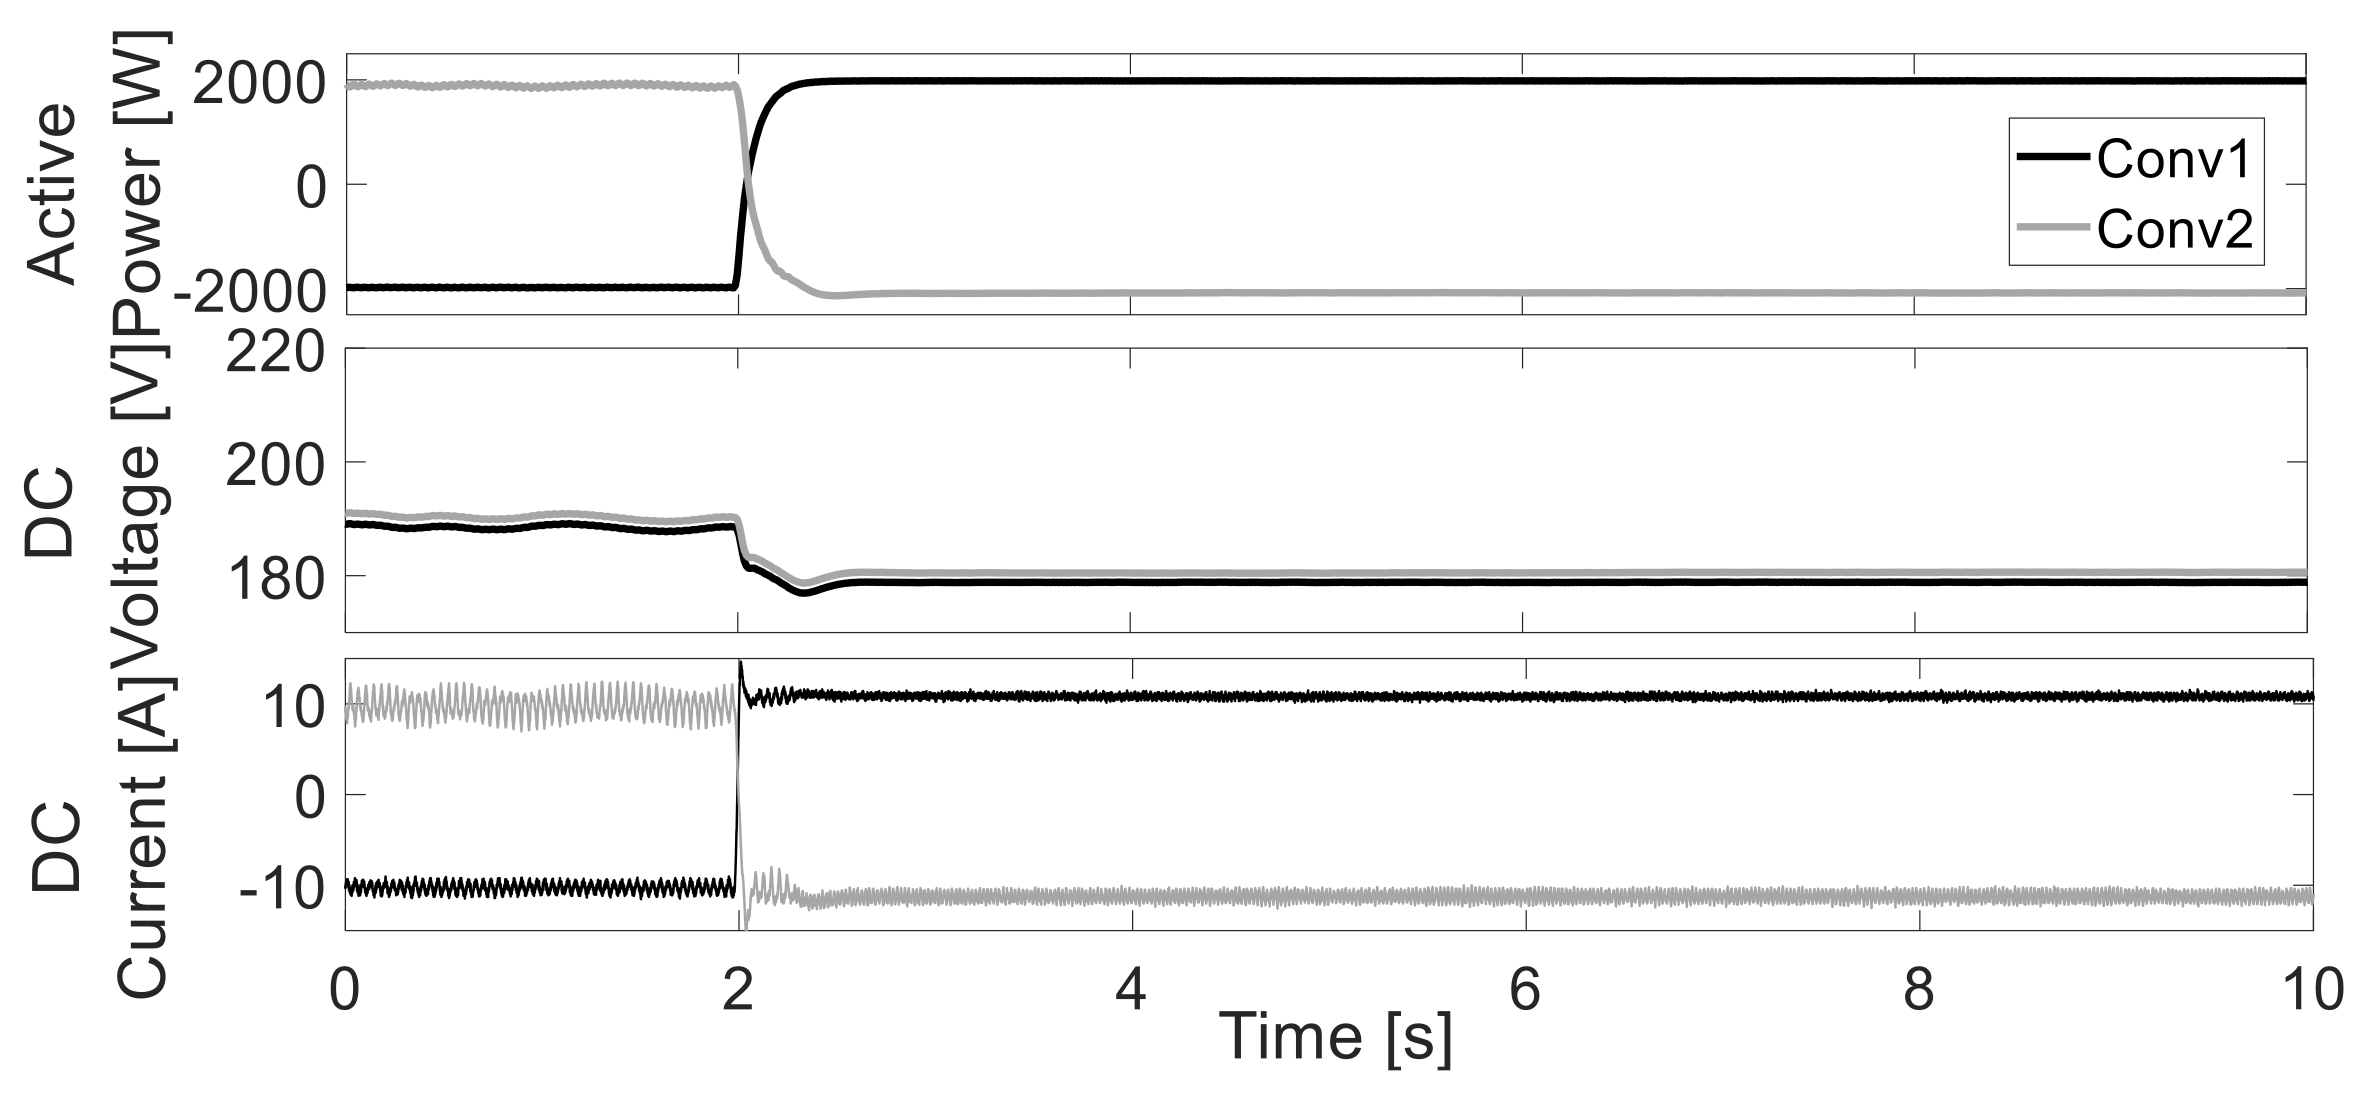
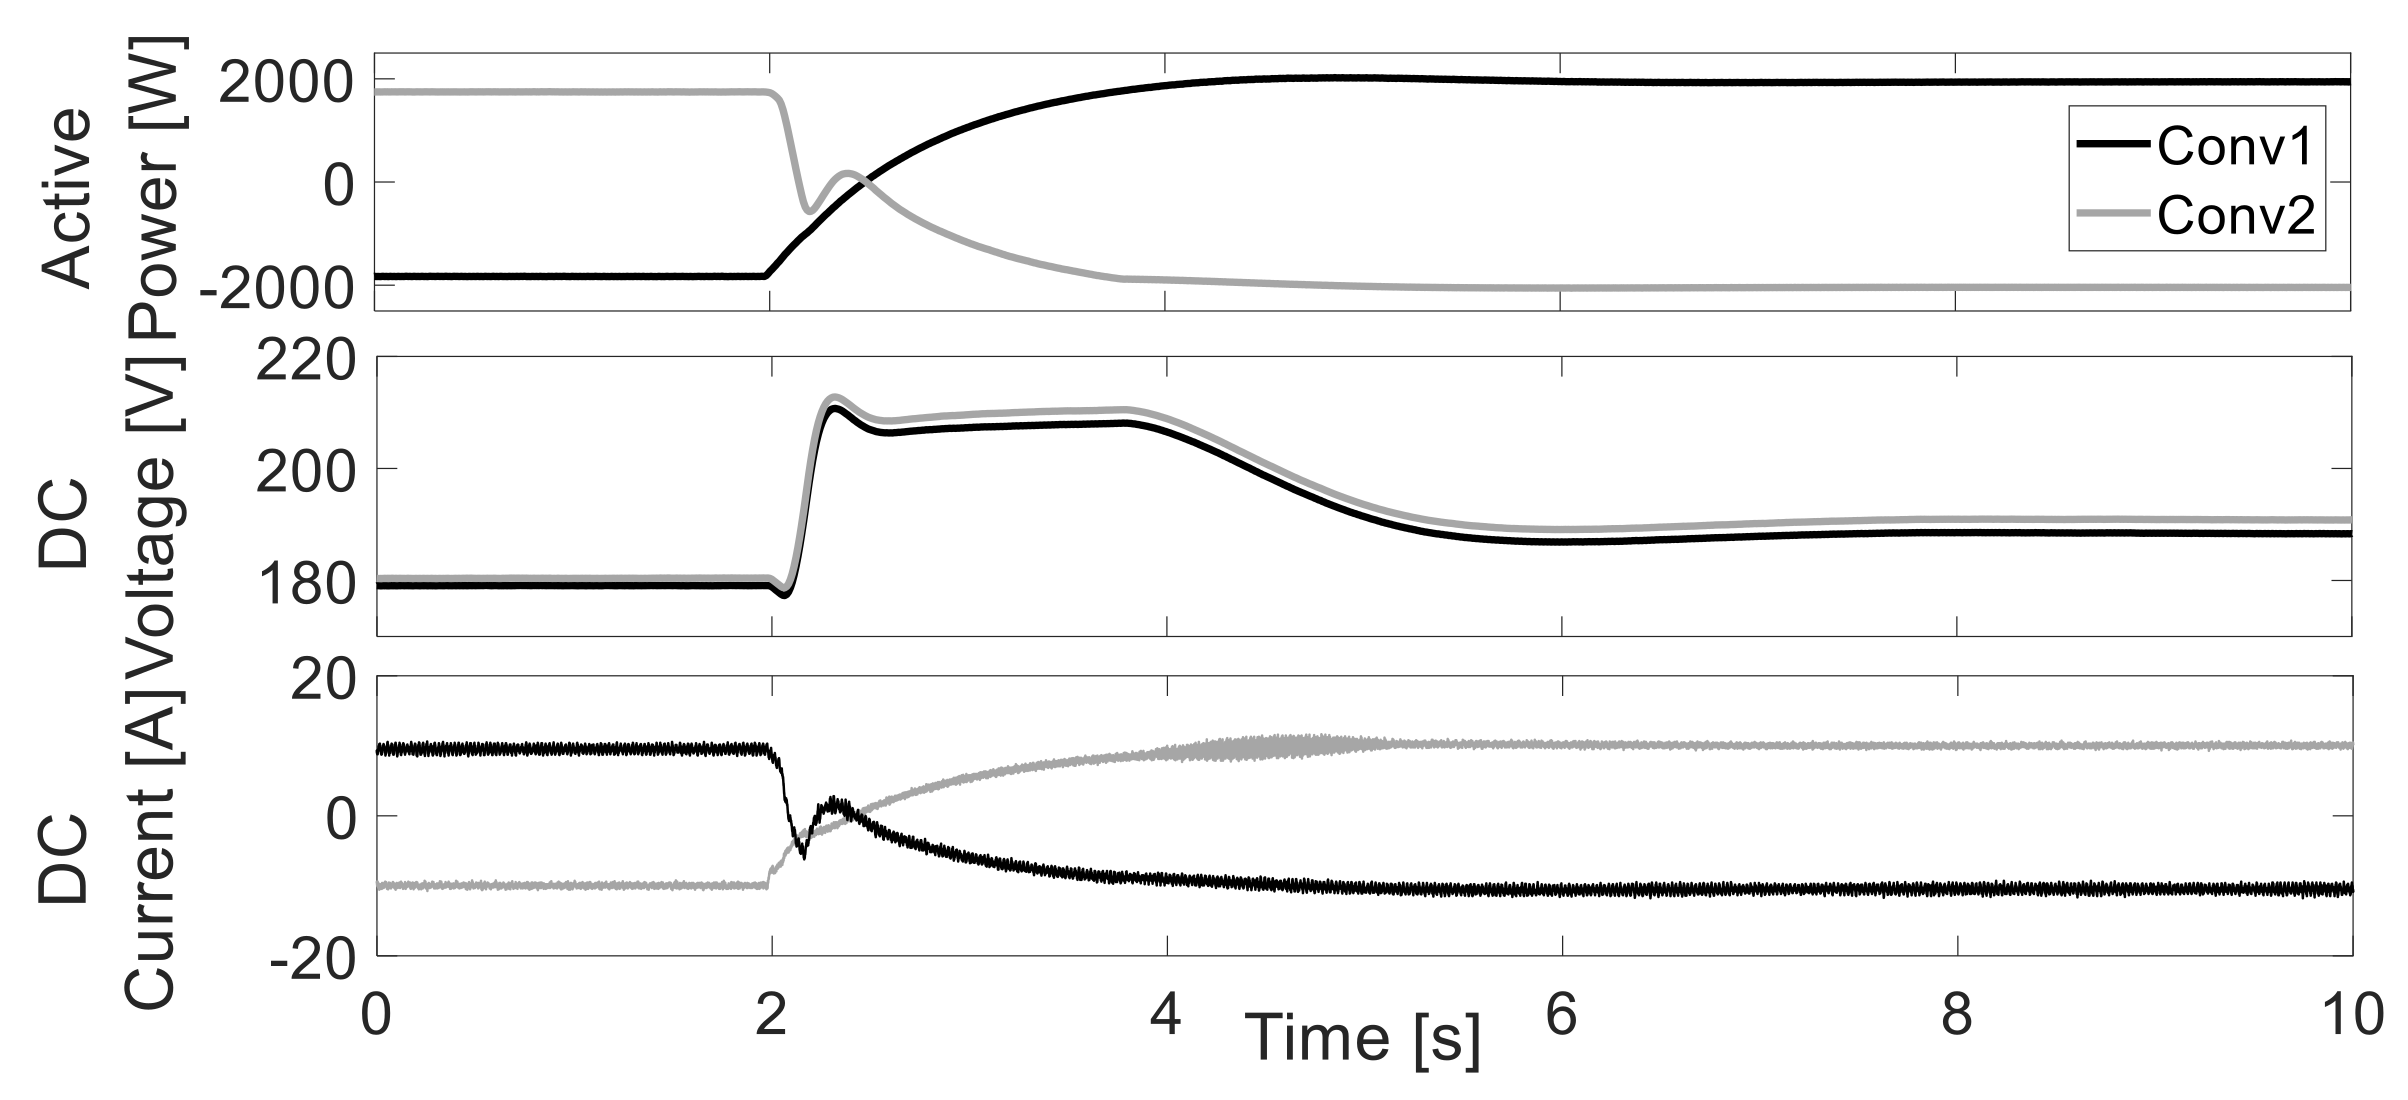
6.2.1. I vs. Vdc Droop against Power Control

Figure 10 shows the two-terminal DC system used to study interactions between an MMC with the I vs. Vdc droop and the other MMC with power control scheme.
The control modes of the converters are:
  • Conv1: MMC with 12-submodules using P control.
  • Conv2: MMC with 6-submodules (inverter) in I vs. Vdc droop control, with DC voltage reference of 1 p.u. and droop gain of 1.25 p.u.
Two cases are studied, namely: (i) Multiple cross-over on Conv2 following a step change in power reference from 0 to −32.5 kW and (ii) No multiple cross-over on Conv2 following a step change in power reference from 0 to 32.5 kW.
Figure 11 shows the simulation results of DC voltage and current for both cases. In Figure 11a, the power and current references on both MMCs are initially 0 p.u. At 2 s, the power reference of Conv1 is changed to 32.5 kW, which results in a reverse power flow of −32.5 kW on Conv2. In the period between 3 to 10 s, the steady-state DC voltage drops to 602 V after the power reference is changed due to the multiple crossing issue. The 48 V DC voltage deviation results in an overcurrent of 5 A through Conv2. Conversely, the multiple crossing problem does not exist if the sign of power on Conv2 is changed from 0 to 32.5 kW. Figure 11b shows that the steady-state DC voltage is 650 V in the period 3 s to 10 s. Hence, there is no mismatch in the current on Conv2.
Comparing the results in Figure 11 with the experimental results shown in Figure 8, the waveforms obtained from simulations exhibit a similar behaviour although with a slightly different transient period. The mismatch in the dynamic response arises from the differences between parameters of the simulation model and the test-rig (e.g., the line impedance and the submodules’ capacitance of MMCs). However, both sets of results clearly exhibit the cross-over of control characteristics.

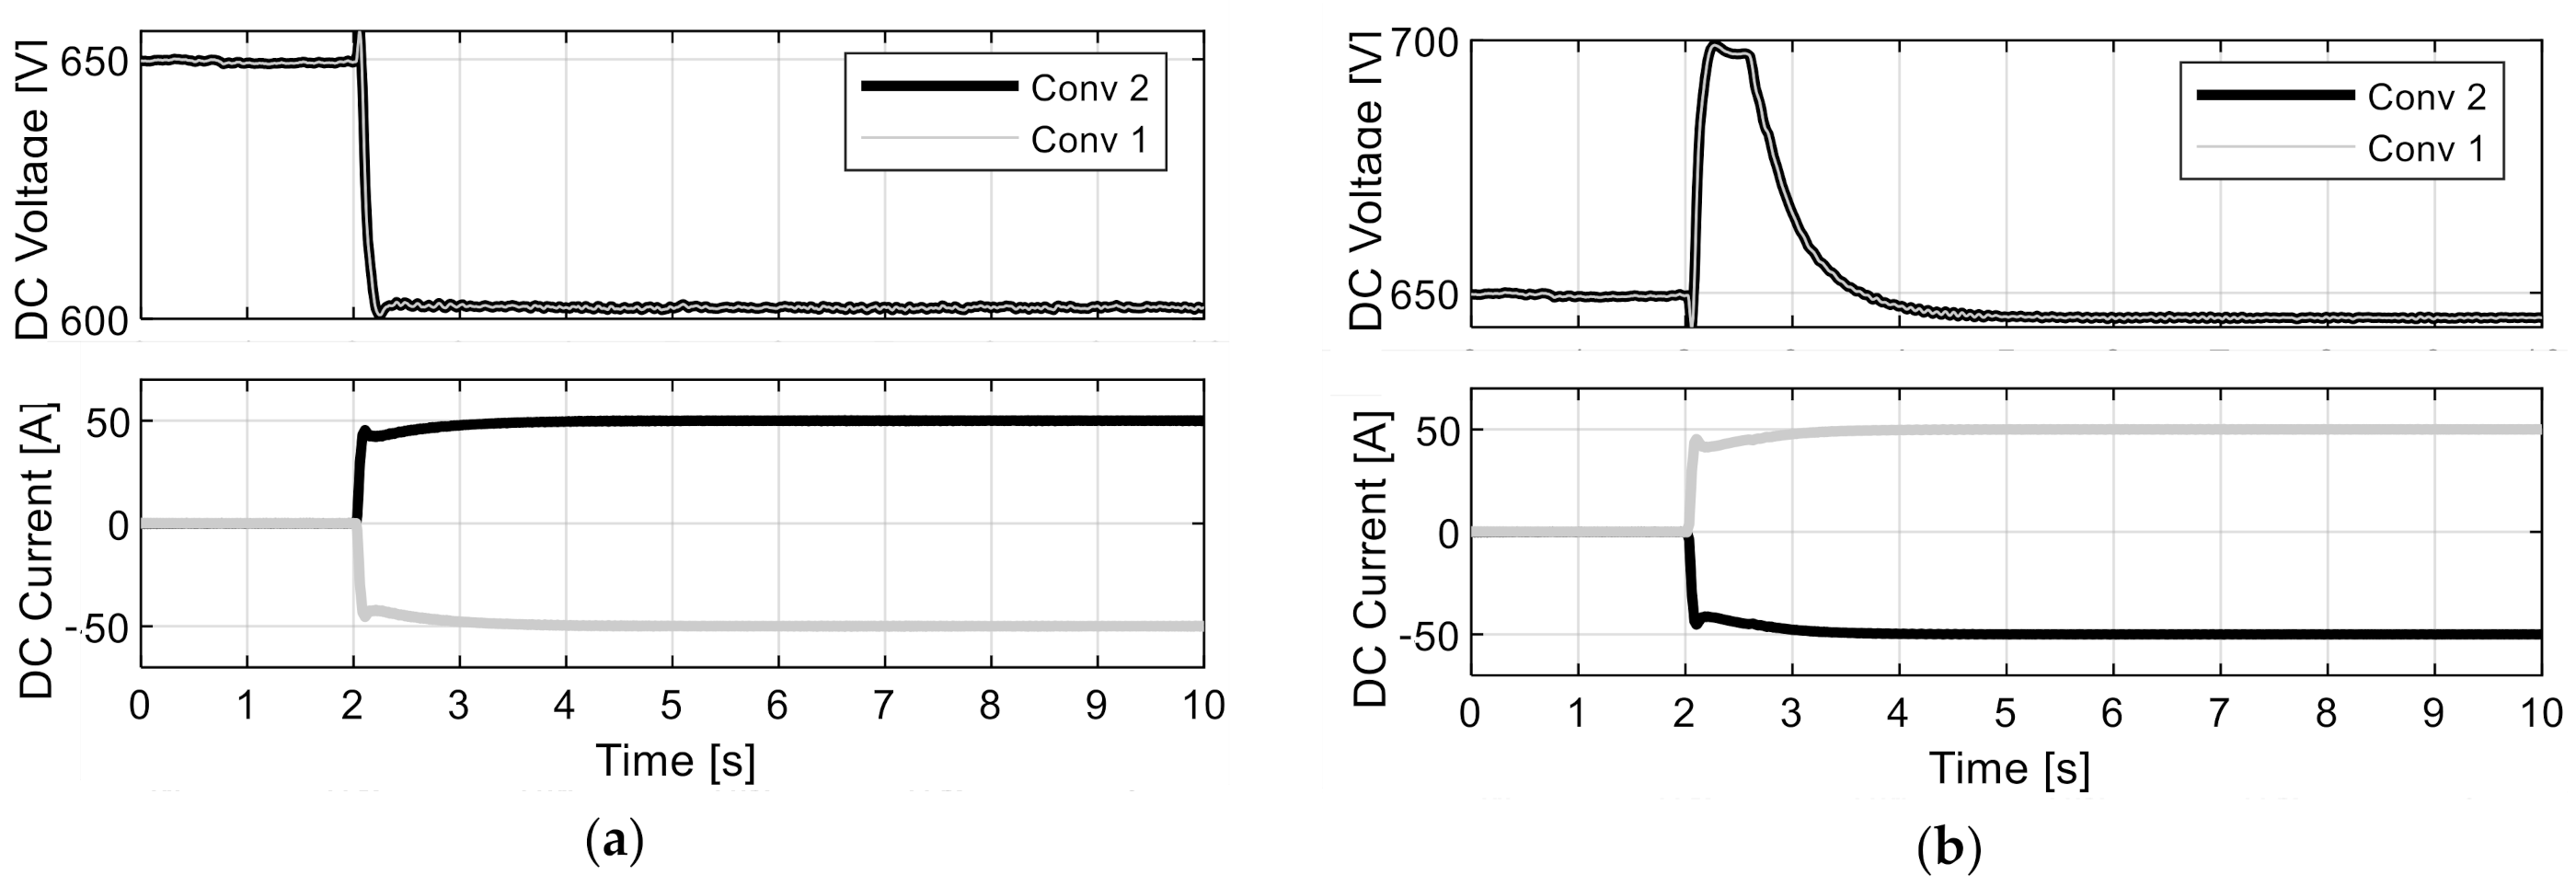
6.2.2. P vs. Vdc Droop against Current Control

Figure 12 shows the two-terminal DC system used to study interactions between an MMC with P vs. Vdc droop and the other MMC with current control scheme.
The control modes of the converters are:
  • Conv1: MMC with 12-submodules with Idc control.
  • Conv2: MMC with 6-submodules in P vs. Vdc droop control, with DC voltage reference of 1 p.u. and droop gain of 1.25 p.u.
Two cases are studied: (i) multiple crossing on Conv2 due to a step change in current reference from 0 to 50 A; and (ii) no multiple crossing following a step change in current reference from 0 to −50 A on Conv2. Figure 13 shows the simulation results of DC voltage and current for both cases. In Figure 13a, the power and current references on both converters are initially 0 p.u. At 1 s, the current reference of Conv1 changes to −50 A, which results in a reverse current flow of 50 A through Conv2. In the period between 3 s to 10 s, the steady-state DC voltage drops to 602 V due to the multiple crossing issue; however, the currents are correctly regulated. The steady-state error of 48 V DC voltage due to the control interactions results in an imbalance between the actual and reference active power.
Conversely, the multiple crossing problem does not exist if the sign of current through Conv2 is changed from 0 to −50 A. Figure 13b shows the steady-state voltage drops from 650 V to 645 V after the current reference is changed. The DC voltage drop of 5 V may be caused by the resistance of the dc system, but not by the multiple crossing problem. In addition, the currents are correctly regulated. Hence, there is no offset in power caused by control interactions.

7. Conclusions

This paper examined the potential risk of multiple cross-over of control characteristics in DC networks with MMCs. An experimental MMC test-rig was used to demonstrate the risk of multiple crossing between different converter control schemes for a point-to-point DC system. A DC network modelled in MATLAB/Simulink was used to verify the experimental results.
Both through simulation and experimental results, it was observed that multiple cross-over of control characteristics can result in unintended DC voltage drops and power imbalances. However, these may be avoided with a careful control system design.
The results presented in this paper may enable electricity system operators to design improved converter control schemes, prevent adverse control interactions and thus reduce operational risks in future implementations of DC grids.

Author Contributions

Conceptualisation, S.W., C.E.U.-L., S.D., S.C. and S.F.; data curation, J.C., S.W. and O.D.A.; formal analysis, S.W.; funding acquisition, C.E.U.-L., S.D., S.C., S.F., D.C., and I.A; investigation, J.C., S.W. and O.D.A.; methodology, S.W., O.D.A., S.C. and M.P.; project administration, S.W., C.E.U.-L., S.D., S.F., D.C. and I.A.; resources, C.E.U.-L., W.M., S.D., and I.A.; software, J.C., S.W., O.D.A., S.C., M.P., S.D. and A.P.; supervision, C.E.U.-L., W.M., and S.D.; validation, S.W. and O.D.A.; visualisation, S.W.; writing—original draft preparation, J.C., and S.W.; writing—review and editing, C.E.U.-L., W.M. and S.C. All authors have read and agreed to the published version of the manuscript.

Funding

This work was supported by the EU FP7 program, through the project “BEyond State of the art Technologies for re-Powering AC corridors and multi-Terminal HVDC Systems” (BEST-PATHS), grant agreement 612748. The simulation toolbox can be downloaded from the project website at www.bestpaths-project.eu (accessed on 10 December 2021).

Conflicts of Interest

The authors declare no conflict of interest.

Appendix A

Appendix A.1. Parameters in MMC Demonstrator

For I vs. Vdc droop against current control in Section 6.1.1. the initial control parameters are:
Conv1: Power reference = 2000 W.
Conv2: DC voltage reference = 200 Vdc (1 p.u.); Droop gain = 25 V/A (1.25 p.u.); Current reference = 10 A; DC voltage offset limit: (200 Vdc (1 p.u.) + / 20 V (0.1 p.u.)).
For P vs. Vdc droop against current control in Section 6.1.2. the initial control parameters are:
Conv1: Current reference = 10 A.
Conv2: DC voltage reference = 200 Vdc (1 p.u.); Droop gain = 0.125 V/W (1.25 p.u.); Power reference = 2000 W; DC voltage offset limit: (200 Vdc (1 p.u.) + / 20 V (0.1 p.u.)).

Appendix A.2. Parameters in Simulation Model

For I vs. Vdc droop against power control in Section 6.2.1, the initial control parameters are:
Conv1: Power reference = 32.5 kW.
Conv2: DC voltage reference = 650 Vdc (1 p.u.); Droop gain = 16.25 V/A (1.25 p.u.); Current reference = 50 A; DC voltage offset limit: (650 Vdc (1 p.u.) + / 48.75 V (0.075 p.u.)).
For P vs. Vdc droop against current control in Section 6.2.2, the initial control parameters are:
Conv1: Current reference = 50 A.
Conv2: DC voltage reference = 650 Vdc (1 p.u); Droop gain = 0.01625 V/W (1.25 p.u.); Power reference = 32.5 kW; DC voltage offset limit: (650 Vdc (1 p.u.) + / 48.75 V (0.075 p.u.)).

References

  1. Shah, R.; Sánchez, J.C.; Preece, R.; Barnes, M. Stability and control of mixed AC–DC systems with VSC-HVDC: A review. IET Gener. Transm. Distrib. 2018, 12, 2207–2219. [Google Scholar] [CrossRef]
  2. Beddard, A.; Barnes, M.; Preece, R. Comparison of Detailed Modeling Techniques for MMC Employed on VSC-HVDC Schemes. IEEE Trans. Power Deliv. 2015, 30, 579–589. [Google Scholar] [CrossRef]
  3. Arai, T.; Sekiguchi, K.; Mochikawa, H.; Sano, K.; Fujita, H. Evaluation of Required Energy Storage in Neutral-Point-Clamped Modular Multilevel Converter for Downsizing Low-Voltage Grid Converters. IEEE Trans. Power Electron. 2021, 36, 6774–6786. [Google Scholar] [CrossRef]
  4. CIGRE Brochure 604 (WG B4-57). Guide for the Development of Models for HVDC Converters in a HVDC Grid. Cigré WG B 2014, 4, 27–32. [Google Scholar]
  5. Kaur, J.; Chaudhuri, N.R. Secondary Frequency Support to Weak Grids Through Coordinating Control of Hybrid HVDC System. IEEE Trans. Power Deliv. 2020, 35, 1685–1694. [Google Scholar] [CrossRef]
  6. Ceballos, S.; D’Arco, S.; Bergna, G.; Adeuyi, D.; Ugalde-Loo, C.E.; Barenys, M.; Parker, M.; Gatti, A.; Pitto, A.; Rapizza, M.; et al. BEST PATHS Deliverable D3.1. Models of WTG, HVDC Links, Offshore Grid. Control Algorithms, Models and Strategies; BEST PATHS: London, UK, 2016; pp. 1–68. [Google Scholar]
  7. Freytes, J.; Li, J.; de Préville, G.; Thouvenin, M. Grid-Forming Control with Current Limitation for MMC under Unbalanced Fault Ride-Through. IEEE Trans. Power Deliv. 2021, 36, 1914–1916. [Google Scholar] [CrossRef]
  8. ENTSO-E. Draft Network Code on High Voltage Direct Current Connections and DC-connected Power Park Modules; ENTSO-E: Brussels, Belgium, 2014. [Google Scholar]
  9. Bianchi, F.D.; Domínguez-García, J.L.; Gomis-Bellmunt, O. Control of multi-terminal HVDC networks towards wind power integration: A review. Renew. Sustain. Energy Rev. 2015, 55, 1055–1068. [Google Scholar] [CrossRef] [Green Version]
  10. Akhmatov, V.; Callavik, M.; Franck, C.M.; Rye, S.E.; Ahndorf, T.; Bucher, M.K.; Muller, H.; Schettler, F.; Wiget, R. Technical Guidelines and Prestandardization Work for First HVDC Grids. IEEE Trans. Power Deliv. 2014, 29, 327–335. [Google Scholar] [CrossRef] [Green Version]
  11. Muñoz, L.A.; Rios, M.A. Performance Comparison of Voltage Control Strategies of VSC-HVDC Grids. In Proceedings of the 2019 IEEE Workshop on Power Electronics and Power Quality Applications (PEPQA), Manizales, Colombia, 30–31 May 2019; pp. 1–5. [Google Scholar]
  12. Haileselassie, T.M.; Uhlen, K. Precise control of power flow in multiterminal VSC-HVDCs using DC voltage droop control. In Proceedings of the 2012 IEEE Power and Energy Society General Meeting, San Diego, CA, USA, 22–26 February 2012; pp. 1–9. [Google Scholar]
  13. Zhang, S.; Zhou, M.; Li, G. Applying power margin tracking droop control to flexible operation in multi-terminal DC collector systems of renewable generation. CSEE J. Power Energy Syst. 2021, 7, 1176–1186. [Google Scholar]
  14. Zhang, L.; Zou, Y.; Yu, J.; Qin, J.; Vijay, V.; Karady, G.G.; Shi, D.; Wang, Z. Modeling, control, and protection of modular multilevel converter-based multi-terminal HVDC systems: A review. CSEE J. Power Energy Syst. 2017, 3, 340–352. [Google Scholar] [CrossRef]
  15. Rouzbehi, K.; Miranian, A.; Candela, J.I.; Luna, A.; Rodriguez, P. A Generalized Voltage Droop Strategy for Control of Multiterminal DC Grids. IEEE Trans. Ind. Appl. 2015, 51, 607–618. [Google Scholar] [CrossRef]
  16. CIGRE Brochure 699 (WG B4.58). Control Methodologies for Direct Voltage and Power Flow in a Meshed HVDC Grid; CIGRE: Paris, France, 2017. [Google Scholar]
  17. Vrana, T.K.; Beerten, J.; Belmans, R.; Fosso, O.B. A classification of DC node voltage control methods for HVDC grids. Electr. Power Syst. Res. 2013, 103, 137–144. [Google Scholar] [CrossRef] [Green Version]
  18. Bibaya, L.; Liu, C.; Li, G. An Improved Coordinated Control Strategy of VSC-MTDC Distribution Network. In Proceedings of the 2018 2nd IEEE Conference on Energy Internet and Energy System Integration (EI2), Beijing, China, 20–22 October 2018; pp. 1–7. [Google Scholar]
  19. Chai, R.; Zhang, B.; Dou, J. Improved DC voltage margin control method for DC grid based on VSCs. In Proceedings of the 2015 IEEE 15th International Conference on Environment and Electrical Engineering (EEEIC), Rome, Italy, 10–13 June 2015; pp. 1683–1687. [Google Scholar]
  20. Liu, S.; Zheng, J.; Li, Z.; Li, R.; Fang, W.; Liu, X. Distributed Piecewise Droop Control of DC Microgrid with Improved Load Sharing and Voltage Compensation. In Proceedings of the 2019 IEEE Third International Conference on DC Microgrids (ICDCM), Shimane, Japan, 20–23 May 2019; pp. 1–6. [Google Scholar]
  21. Stamatiou, G.; Bongiorno, M. Power-dependent droop-based control strategy for multi-terminal HVDC transmission grids. IET Gener. Transm. Distrib. 2016, 11, 283–391. [Google Scholar] [CrossRef]
  22. Akkari, S.; Petit, M.; Dai, J.; Guillaud, X. Interaction between the voltage-droop and the frequency-droop control for multi-terminal HVDC systems. IET Gener. Transm. Distrib. 2016, 10, 1345–1352. [Google Scholar] [CrossRef] [Green Version]
  23. Barker, C.; Whitehouse, R.; Liang, J.; Wang, S. Risk of multiple cross-over of control characteristics in multi-terminal HVDC. IET Gener. Transm. Distrib. 2016, 10, 1353–1360. [Google Scholar] [CrossRef]
  24. Ugalde-Loo, C.E.; Adeuyi, O.D.; Wang, S.; Liang, J.; Jenkins, N.; Ceballos, S.; Santos, M.; Vidaurrazaga, I.; D’Arco, S.; Bergna, G.; et al. Open access simulation toolbox for the grid connection of offshore wind farms using multi-terminal HVDC networks. In Proceedings of the 13th IET International Conference on AC and DC Power Transmission (ACDC 2017), Manchester, UK, 14–16 February 2017; p. 54. [Google Scholar]
  25. D’Arco, S.; Torres, R.; Ljøkelsøy, K.; Guidi, G.; Reigstad, T.I.; Bergna, G. BEST PATHS Deliverable D8.1. Detailed Specification of the Demonstrator: Offshore Integration; BEST PATHS: London, UK, 2017; pp. 1–48. [Google Scholar]
  26. Xu, L.; Andersen, B.R.; Cartwright, P. VSC Transmission Operating Under Unbalanced AC Conditions—Analysis and Control Design. IEEE Trans. Power Deliv. 2005, 20, 427–434. [Google Scholar] [CrossRef]
  27. Morched, A.; Gustavsen, B.; Tartibi, M. A universal model for accurate calculation of electromagnetic transients on overhead lines and underground cables. IEEE Trans. Power Deliv. 1999, 14, 1032–1038. [Google Scholar] [CrossRef]
  28. Anderson, P.M.; Fouad, A.A. Power System Control and Stability; IEEE Press: Piscataway, NJ, USA, 2003. [Google Scholar]
Figure 1. Control characteristics in V-I frame.
Electronics 11 00175 g001
Figure 2. Control characteristics in V-P frame.
Electronics 11 00175 g002
Figure 3. V-I control interactions. (a) Schematic. (b) Multiple crossing of two control characteristics. (c) No multiple crossing if sign of power reference is reversed.
Electronics 11 00175 g003
Figure 4. V-P control interactions. (a) Schematic. (b) Multiple crossing of two control characteristics. (c) The multiple crossing is avoided if the sign of the current is changed.
Electronics 11 00175 g004
Figure 5. Schematic of a representative DC grid with control schemes. (a) Vdc vs. I droop and power control. (b) Vdc vs. P droop and current control.
Electronics 11 00175 g005
Figure 6. The experimental demonstrator. (a) Schematic diagram. (b) Configuration.
Electronics 11 00175 g006
Figure 7. Control scheme of a grid-tied MMC. (a) Structure. (b) Outer and inner current loops.
Electronics 11 00175 g007
Figure 8. Experimental results of power reversal from −2000 W to 2000 W with Conv1 in power control and Conv2 using I vs. Vdc droop.
Electronics 11 00175 g008
Figure 9. Experimental results of current reversal from −10 A to 10 A with Conv1 in current control and Conv2 using P vs. Vdc droop.
Electronics 11 00175 g009
Figure 10. Two-terminal DC system with I vs. Vdc droop and P control.
Electronics 11 00175 g010
Figure 11. Simulation results of I vs. Vdc droop and power control. (a) Multiple crossing Conv2 (step power change from 0 to −32.5 kW) (b) No multiple crossing on Conv2 (step power change from 0 to 32.5 kW).
Electronics 11 00175 g011
Figure 12. Two-terminal DC system with P vs. Vdc droop and Idc control.
Electronics 11 00175 g012
Figure 13. Simulation results of P vs. Vdc droop and current control. (a) Multiple crossing on Conv2 (step current change from 0 to 50 A). (b) No multiple crossing on Conv2 (step current change from 0 to −50 A).
Electronics 11 00175 g013
Table 1. Comparison between HVDC control schemes.
Control MethodsReferenceController StructureDistinctive Features
Conventional method with a single droop characteristic[15]Generic controller combining constant voltage/power and droop control.Different control modes can be smoothly switched by selecting coefficients α , β and γ in α V d c + β P + γ = 0 .
[21]Power control loop consisting of a PI controller with a negative feedback gain of 1/k.The method provides a filtered droop signal to the voltage controller during transients, preventing large DC voltage changes—thereby improving the dynamic performance.
[22]Frequency and voltage droop loops are incorporated to the active power reference.The method enables the DC system to participate in DC voltage and AC frequency regulation concurrently.
Improved method with multiple droop characteristics[17,18,19,20]Outer loops with different droop slopes are integrated to create multiple droop characteristics.The impact on power flow due to the drift in DC voltage is mitigated—the accuracy of the DC power flow control is thus improved.
[23]One converter station operates with constant power control and the other station with current versus voltage droop control.The adverse interaction caused by this control configuration in an HVDC link is first reported. The analysis is verified through computer simulations.
This paperTwo configurations are studied: constant power and current versus voltage droop control; and constant current and power versus voltage droop control.The adverse impact caused by these control configurations in the performance of DC voltage and power is analysed. The interactions are demonstrated through software simulations using an open access toolbox and experimentally with a 60-kW MMC test-rig.
Publisher’s Note: MDPI stays neutral with regard to jurisdictional claims in published maps and institutional affiliations.

