Article

Experimental Study on Positronium Detection under Millimeter Waves Generated from Plasma Wakefield Acceleration

1
Korea Institute of Radiological and Medical Sciences (KIRAMS), Seoul 01812, Korea
2
Center for THz–Driven Biomedical Systems, Department of Physics and Astronomy, College of Natural Sciences, Seoul National University, Seoul 08826, Korea
3
Center for Applied Electromagnetic Research, Advanced Institute of Convergence Technology, Suwon 16229, Korea
4
R&D Department, Seoul–Teracom, Inc., Suwon 16229, Korea
*
Author to whom correspondence should be addressed.
Electronics 2022, 11(19), 3178; https://doi.org/10.3390/electronics11193178
Submission received: 21 August 2022 / Revised: 29 September 2022 / Accepted: 30 September 2022 / Published: 3 October 2022
(This article belongs to the Section Bioelectronics)

Abstract

:
Positronium (Ps) is an unstable system created by the temporary combination of electrons and negative electrons, and Ps generation technology under resonance conditions at millimeter waves is emerging as a new research topic. In general, Ps can be observed when an unstable separate state remains after electron and positron pair annihilation, as in positron emission tomography (PET). However, in this study, a plasma wakefield accelerator based on vacuum electronics devices (VEDs) was designed in the ponderomotive force generating electrons and positrons simultaneously using annular relativistic electron beams. It can induce Cherenkov radiation from beam–wave interaction by using dielectric materials. According to the size of dielectric materials, the frequency of oscillation is approximately 203 GHz at the range of millimeter waves. At this time, the output power is about 109 watts-levels. Meanwhile, modes of millimeter waves polarized by a three-stepped axicon lens are used to apply the photoconversion technology. Thus, it is possible to confirm light emission in the form of a light-converted Bessel beam.

1. Introduction

In general, a positron (e+) emitted during positron emission tomography (PET) undergoes pair annihilation with a nearby electron (e) and releases energy corresponding to the rest mass of an electron (511 keV), generating two photons (γ-rays). However, the pair annihilation is only around 60% with ≃40% forming metastable positronium (Ps) as an intermediate state. Ps is an unstable system consisting of an exotic atom that is formed when a positron and an electron combine. It is similar to an isotope of hydrogen with a mass number of 0, with the positron occupying the proton’s place. However, the Bohr radius is twice that of hydrogen’s, as the electron’s mass is halved. The Ps system, in a precisely coupled state, is a viable model for research in quantum electrodynamics (QED). A positron and electron weigh less than the lightest hadron and muon, and the contribution by strong interaction and the contribution of the virtual muon are negligible compared to the measurement accuracy of the experiment. There are two types of Ps: ortho-Ps (o-Ps), in which the spins of electrons and positrons are aligned, and para-Ps (p-Ps), in which the spins of electrons and positrons are opposite; o-Ps has an average lifetime of approximately 10–7 s and produces three γ-rays, while p-Ps has a shorter lifetime (about 10–10 s) and produces only two γ-rays [1,2,3,4,5,6].
A Ps state in vivo is sensitive to metabolic reactions and can provide information on the degree of disease progression. Life expectancy and formation probability of Ps, which depend on the material’s health, its nanostructure, and concentration of bioactive molecules, indicate the stages of metabolic disorder in human tissues. Therefore, the study of spectroscopic imaging techniques for the decay of Ps may provide new information for medical diagnosis. In addition, in vitro studies comparing Ps properties in cancerous and healthy tissues suggest that o-Ps life expectancy correlates with the developmental grade of metabolic disorders in cancer cells. Investigation of samples and cancer types is essential for a more accurate quantification of this correlation. One major hypothesis based on this correlation is that oxygen concentration in cancerous tissue differs from normal tissue concentration (hypoxia). Therefore, it is necessary to confirm such hypotheses experimentally [7,8,9,10].
An important issue in diagnostic imaging medicine is early disease diagnosis and precise localization of the cause. PET could resolve this by enabling cancer detection at an early developmental stage before any morphological changes. In PET diagnosis, a drug incorporated with a radioactive isotope that emits a positron is administered. Recessive positrons form a metastable Ps state that either annihilates directly inside the patient or is initially trapped within intermolecular spaces [3,7,8,11].
However, Ps generation has not been recorded or used in PET images with the existing technology. Currently, the determining parameter for the degree of metabolic change is the standardized absorption value, which expresses the absorption of radiopharmaceuticals in volume units relative to the average absorption throughout the body. The higher the absorption value, the higher the probability that metabolism is disturbed in a given tissue area, leading to damage in normal cells. Thus, it is necessary to find an alternative to creating a Ps state through PET, i.e., a nuclear medicine imaging method that obtains the physiological, chemical, and functional images of a human body in three dimensions using radiopharmaceuticals that emit positrons [3,7].
In particular, it is possible to induce hyperfine splitting in the energy level of Ps for the application of photoconversion technology based on the generation of electromagnetic millimeter wave (mmW) resonance, wherein the characteristics of Ps during decay can be fused with mmW generation-based spectroscopy for efficient utilization [3,12,13].
In this study, the possibility of Ps photoconversion technology is confirmed experimentally under mmW electromagnetic resonance conditions (which creates an unstable state in which electrons and positrons are generated simultaneously) by using a relativistic electron beam in vacuum, mmW generation, and Cherenkov radiation (CR) with the ponderomotive force principle in the plasma wakefield acceleration state. The relativistic electron beam energy was 0.5 MeV (γ = 2), and the mmW frequency was 203 GHz of the resonant frequency for the Ps transition in the energy level, which is the G-band (140–220 GHz). In addition, the mmW mode converting a three-stepped axicon lens was used to apply the optical conversion technology. It was possible to confirm the light emission in the form of a light-converted Bessel beam [3,4,12,13,14,15,16,17,18,19,20,21,22,23,24,25]. In other words, the typical requirements of experimental conditions for the in vivo imaging with Ps technology are the levels of 0.5 MV (the applied voltage) and 106~109 watts (output power) under the frequency of 203.389 GHz, as proposed in this paper [3,4]. These experimental requirements are covered in detail in Materials and Methods and Results.
These experimental results demonstrate a novel method that enables in vivo imaging of Ps properties by combining them into a single tomography system by splitting the hyperfine structure energy levels under resonance conditions using mmW photoconversion technology. It is anticipated that this method will be adopted on a large scale in the future and to complement PET in the field of medical imaging.

2. Materials and Methods

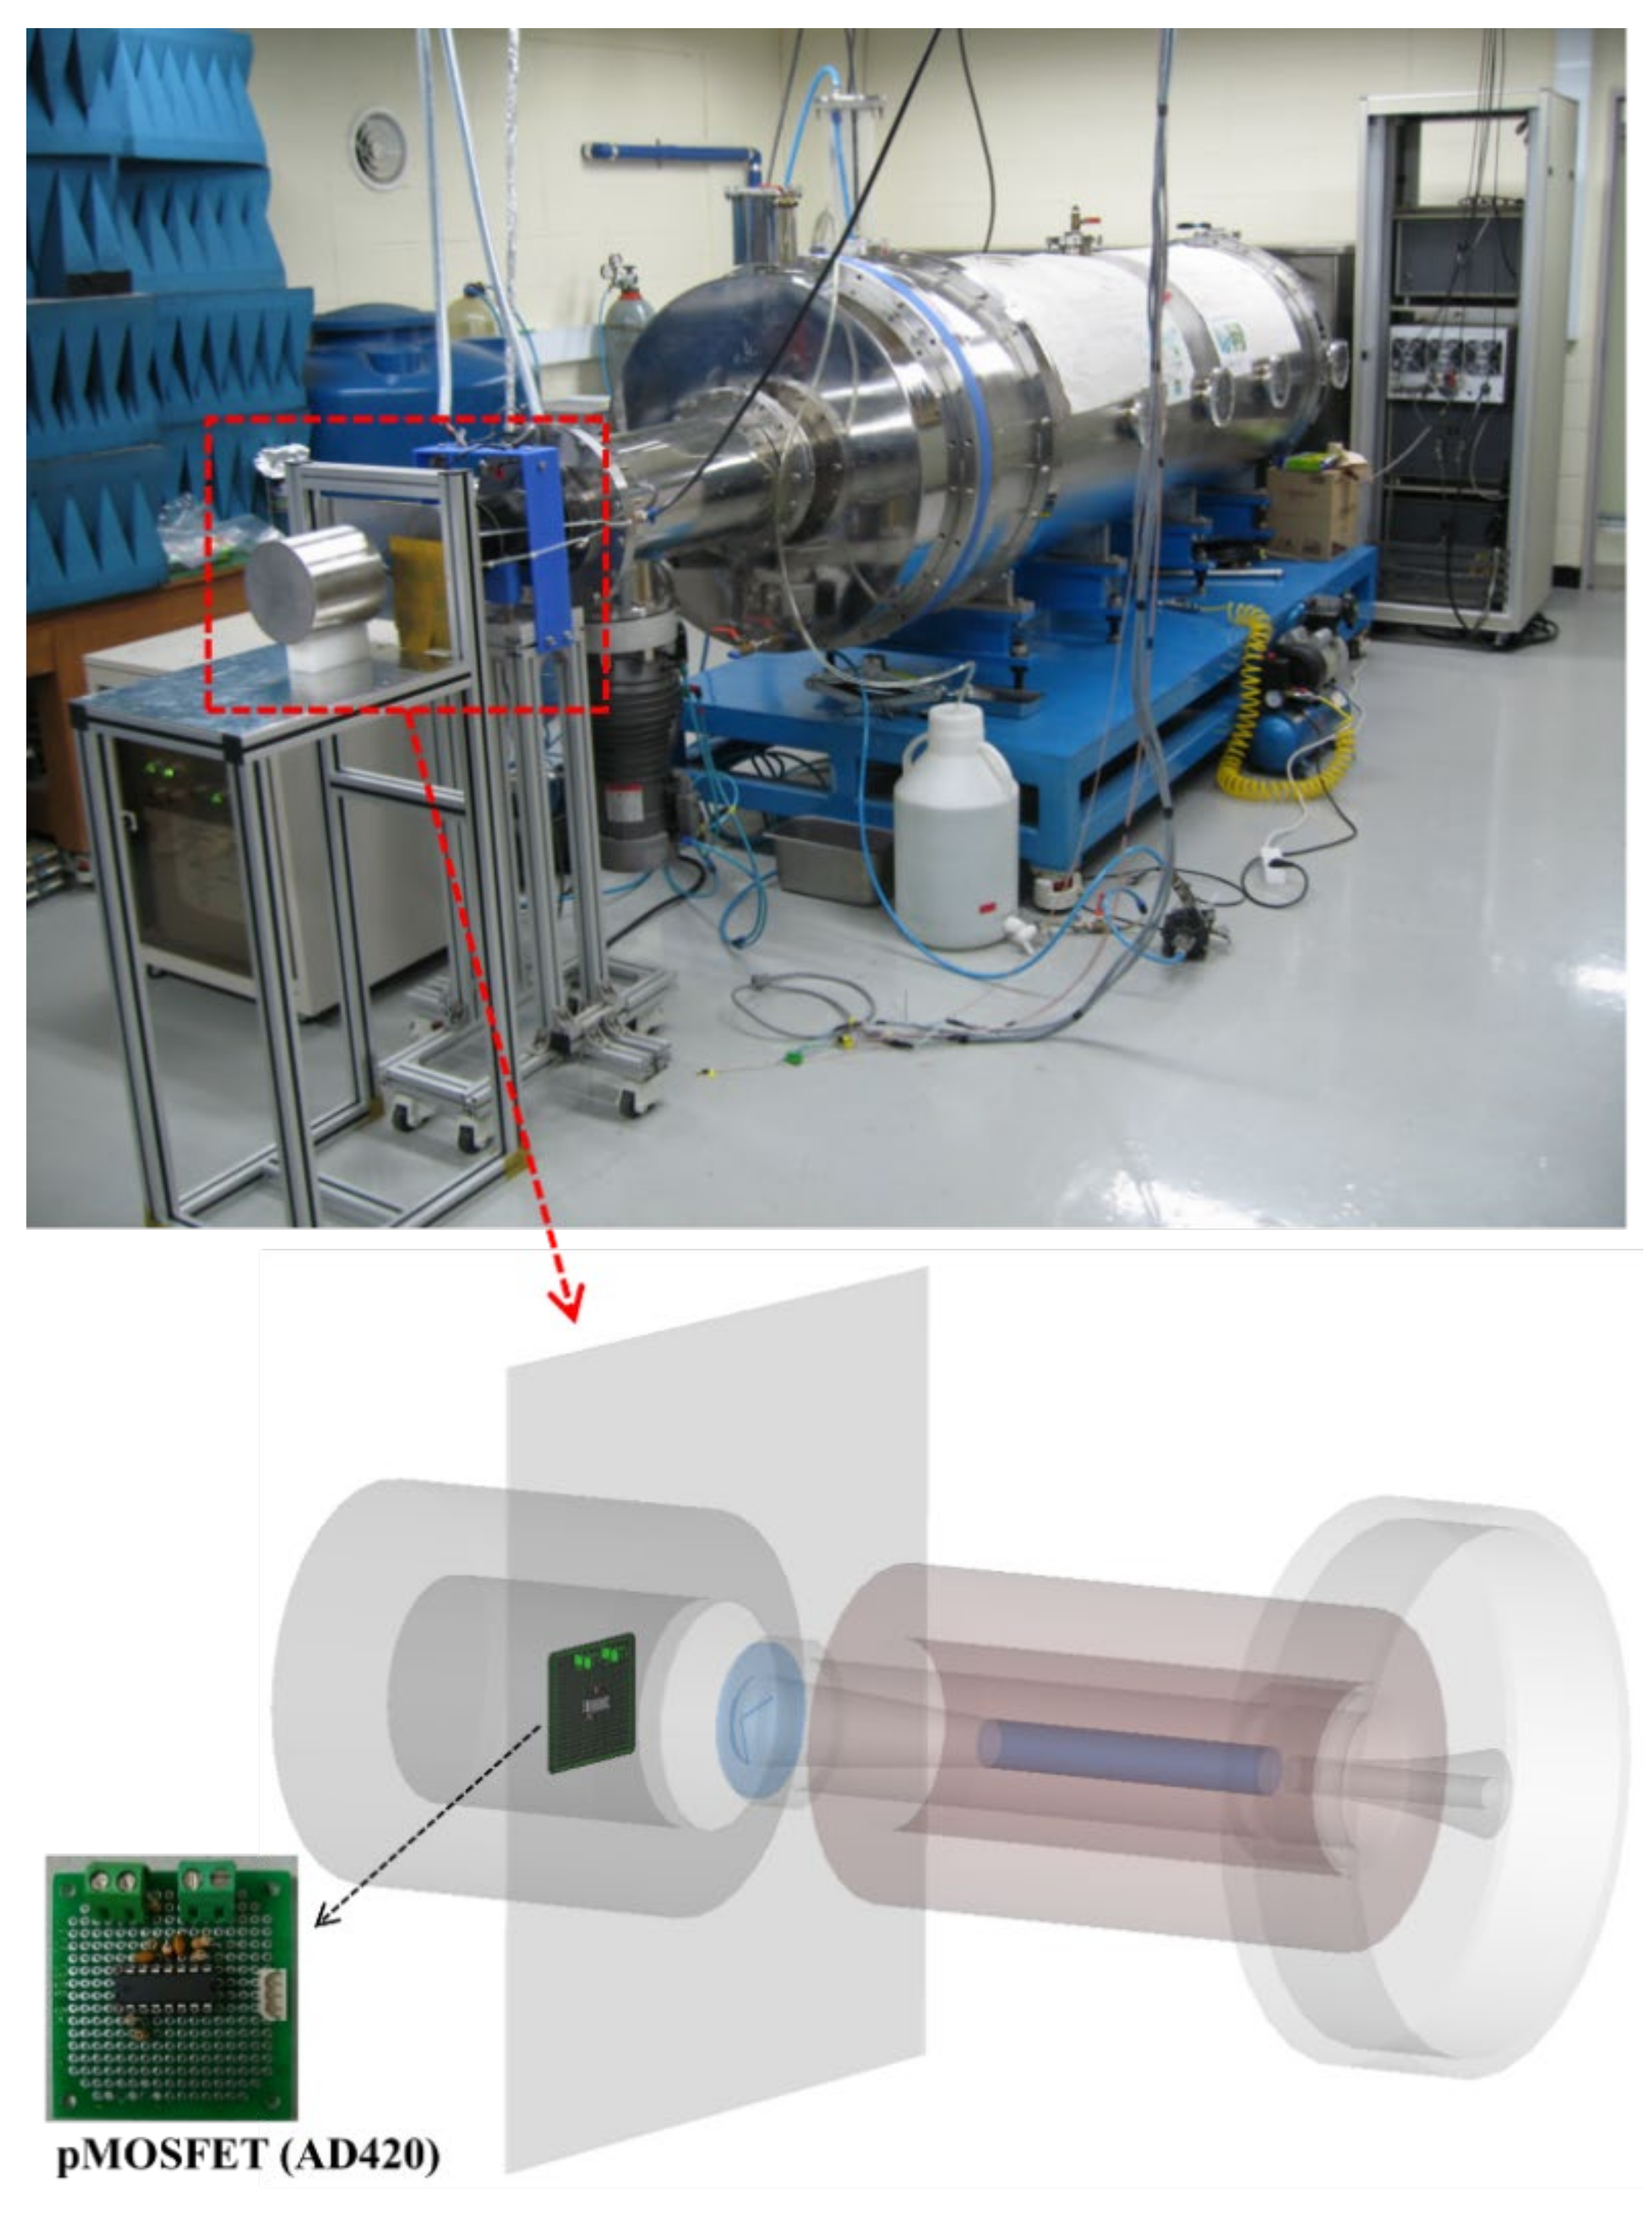
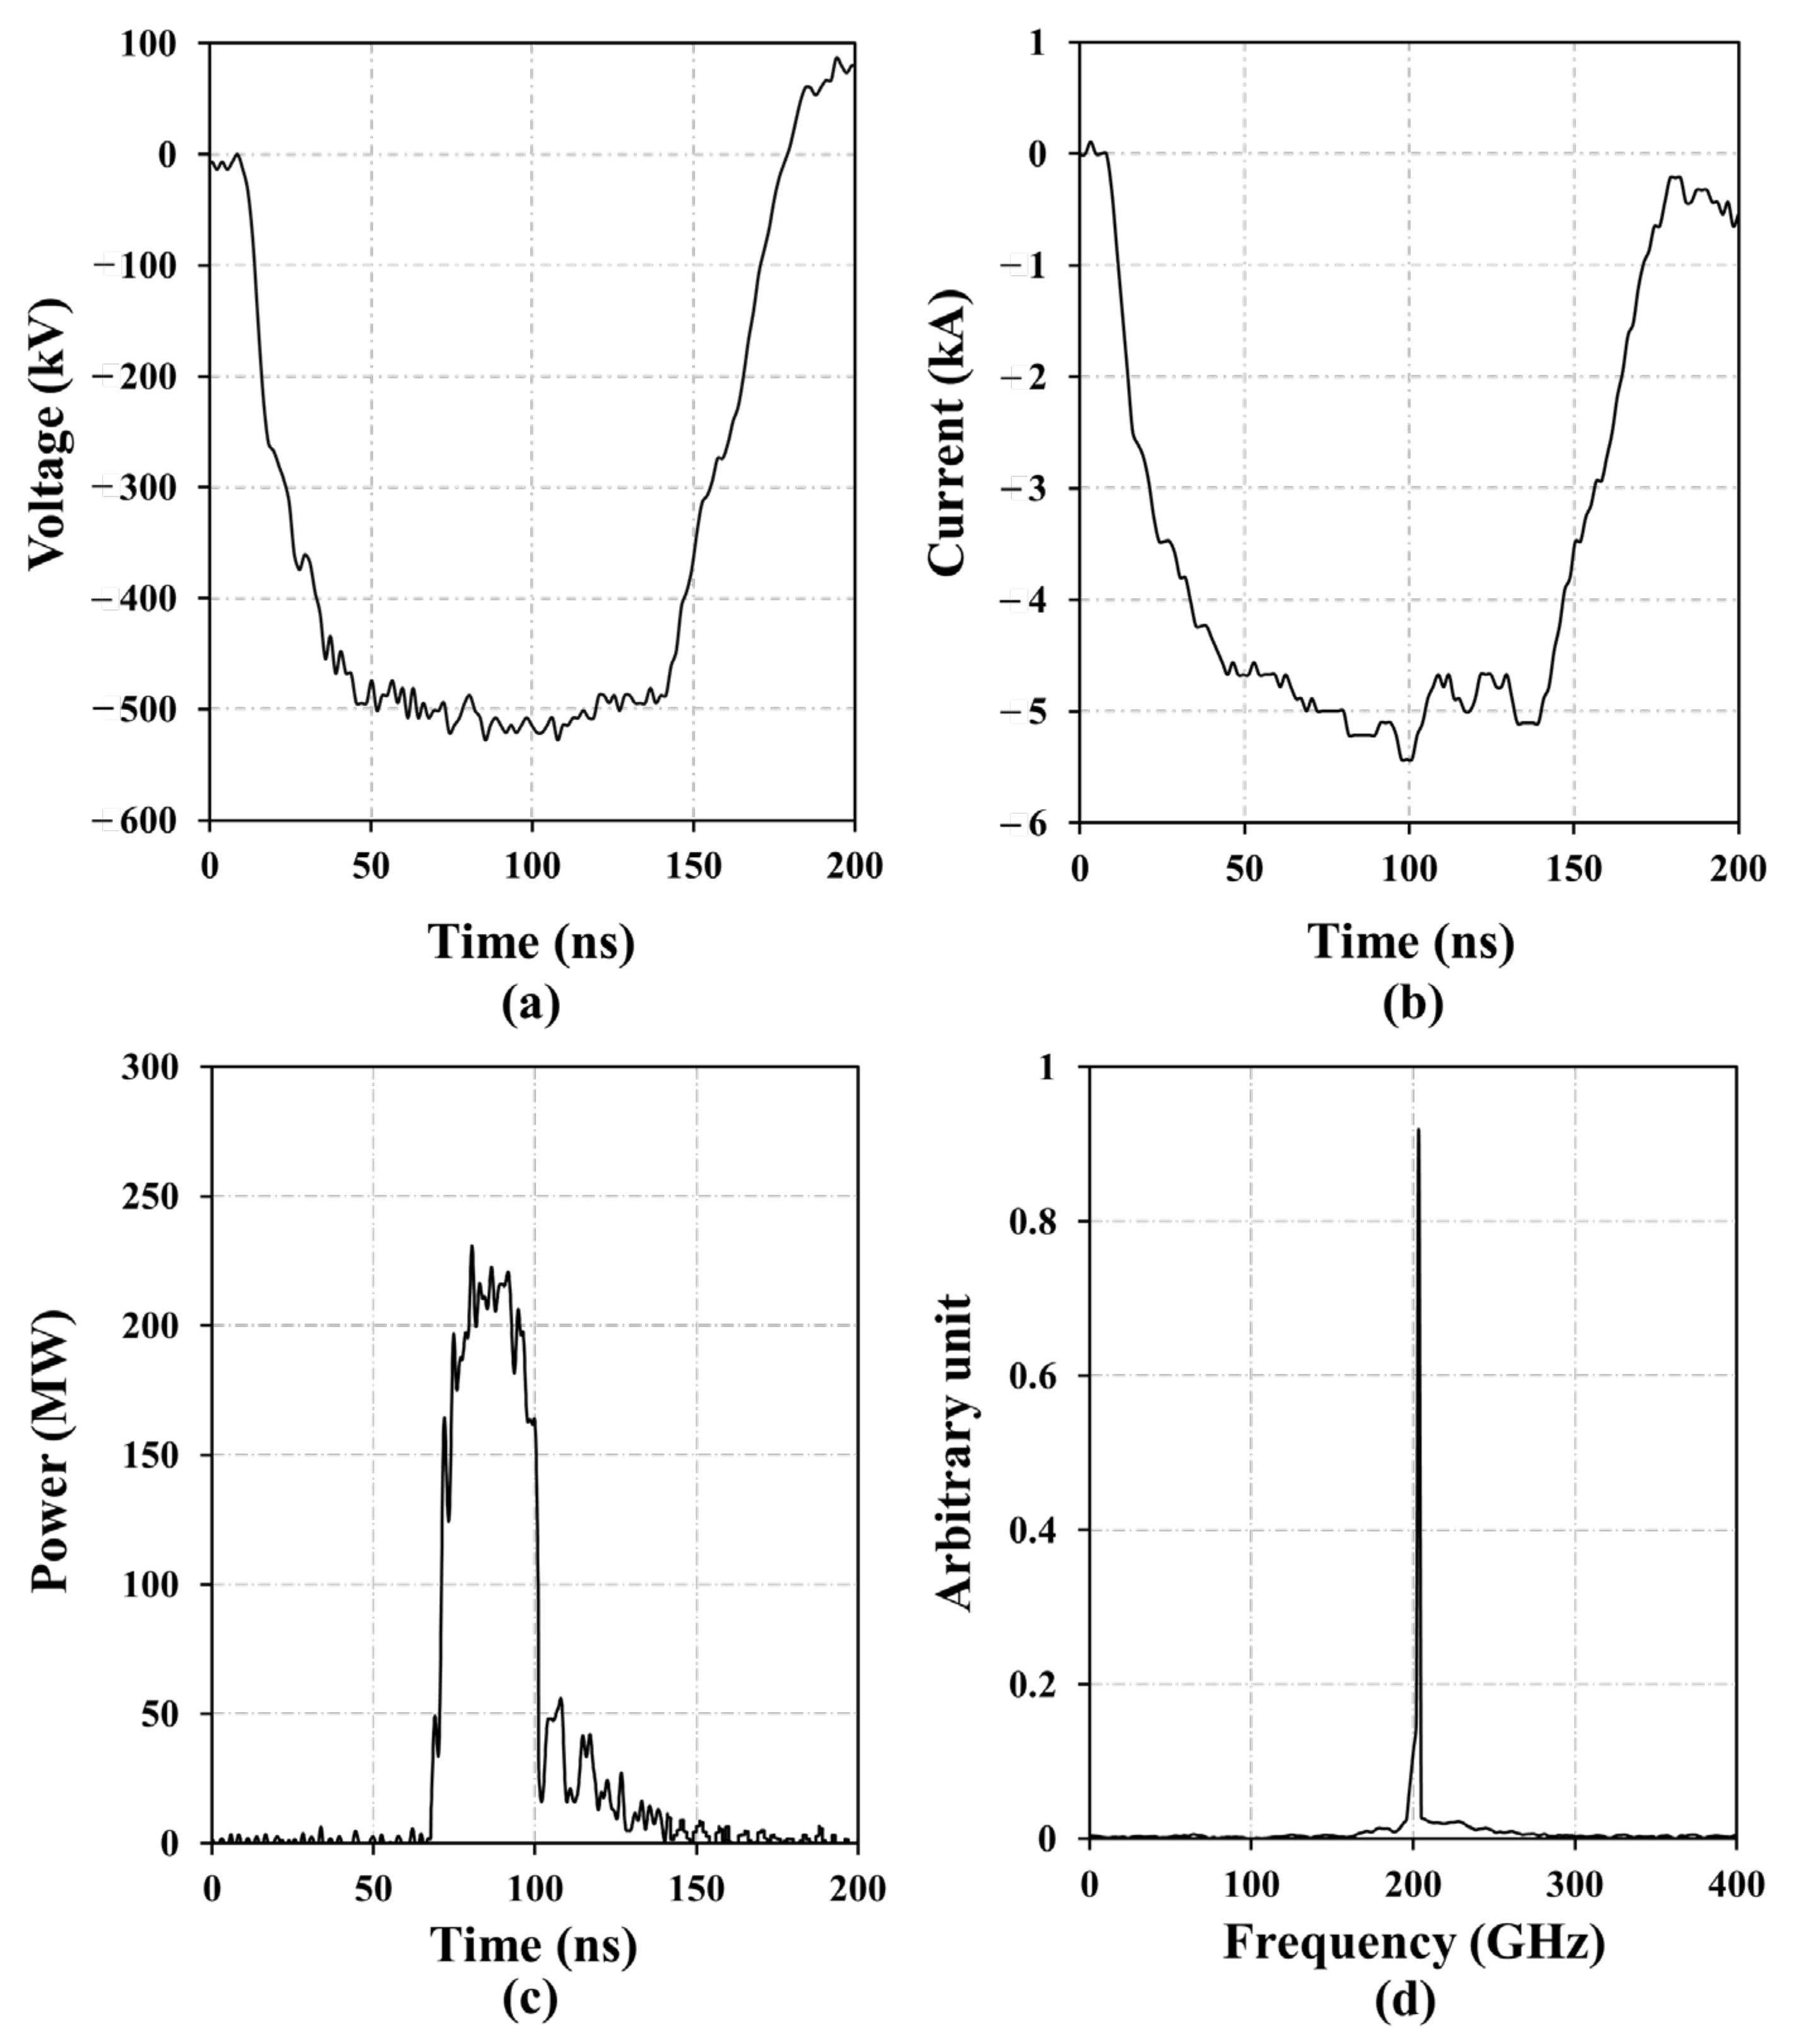
2.1. Ps Generation Based on Plasma Wakefield Acceleration and mmW Source

To create a Ps state, as in the case of PET, the emitted positron is in an intermediate state when a pair annihilation reaction occurs with a nearby electron, and conditions must be created to form a metastable positron. However, PET may cause damage to normal cells due to radiation by generating two photons (gamma rays) for every Ps, each with an energy of 511 keV corresponding to the rest mass of electrons when the pair annihilation occurs. Therefore, it is necessary to develop a device that artificially creates an unstable state coexisting with electrons while generating positrons through other methods.
Relativistic electron beams were used to generate a ponderomotive force induced by an uneven electromagnetic field applied to the plasma through plasma wakefield acceleration. At this time, the unequal electrical and magnetic properties caused several ions to drift in the plasma by the charge-to-mass ratio. The amorphous property of the electric and magnetic fields created second-order nonlinear terms in the equations that described the average motion of the ions. The mmW vacuum electronic device shown in Figure 1 demonstrates the generation of Cherenkov radiation (CR) via beam–wave interaction, in the grating structure of the dielectric using polycarbonate material, by plasma wakefield acceleration. The oscillating resonant frequency is dependent on the relative permittivity of the dielectric, the size and thickness, the characteristic thickness (the surface wave decay length) of the field layer in the synchronous harmonic mode, and the relativistic electron related to the beam–wave interaction occurring on the surface of the dielectric, as well as the thickness of the beam. Figure 1a shows a plasma dielectric wakefield accelerator that can create a Ps state which generates electrons and positrons simultaneously under the Debye length condition.
In general, the relationship between power and frequency in a vacuum element is a function of P∝1/f2, and as the frequency increases, the maximum output power decreases. In addition, as the wavelength of the wave decreases and the frequency increases, the size of the vacuum circuit in the form of a waveguide becomes inevitably smaller. There are production limitations in fabricating a circuit with a high-output mmW frequency band due to circuit size problems on the micrometer scale. However, a technology capable of generating power in the high-power range (MW to GW) is possible, while reducing the power density with maintaining frequencies at the range of millimeter waves by optimizing the design of large-diameter, overmoded (oversized) structures by using VEDs as backward wave oscillators (BWOs) and traveling wave tubes (TWTs). Oversized BWOs using a slow-wave structure that slows the phase velocity of electromagnetic waves due to the interaction of relativistic electron beams and waves have a cylindrical overmoded structure with a large diameter that increases the cross-sectional area to prevent breakdown. Similarly, plasma wakefield accelerators using dielectric materials can have an overmoded structure that generates Cherenkov radiation through the interaction of beams and waves [26,27,28,29].
A dielectric was devised to generate an electron beam in a relativistic region faster than an electromagnetic wave to generate Cherenkov radiation. An annular-shaped cathode was used to achieve an optimized power efficiency without mode competition in the desired frequency mode (TM01) and according to the thickness and structure of the dielectric. In addition, the dielectric was designed as an overmoded structure (Figure 1a) to increase the cross-sectional area of the interaction between the electromagnetic wave and the relativistic electron beam and the size of the electrostatic breakdown electric field. Here, the inner diameter of the dielectric was set to 24 mm (D/λ = 16, overmoded structure for D/λ ≥ 1.76; D = diameter of the cylindrical circuit, λ = wavelength) [29]. The magnitude of the wakefield generated by the dielectric structure can be expressed as follows [30,31].
λ n = 4 b a n ε r 1
As in Equation (1) above, we set the dominant mode to TM01 (n = 1) and the operating frequency to 203.389 GHz, where a is the inner diameter of the dielectric (24 mm), b is the outer diameter of the dielectric (26.1 mm), and the longitudinal length of the dielectric is 160 mm, εr is the relative permittivity, and the value here is approximately 3–203 GHz; usually, a compound of quartz material based on quartz (SiO2) or polycarbonate can be used as a dielectric material. Figure 1b shows the trajectory of the relativistic electron beam used to generate the ponderomotive force induced by an uneven electromagnetic field applied to the plasma through plasma wakefield acceleration. At this time, the unequal electrical and magnetic properties cause several ions to drift in the plasma by the charge-to-mass ratio. The amorphous nature of the electric or magnetic fields creates second-order nonlinear terms in the equations that describe the average motion of various ions (Figure 1c); the Cherenkov radiation using a dielectric such as polycarbonate occurs, and wakefields are generated centered on the dielectric surface, as shown in Figure 1d. Cherenkov wakes are generated inside the dielectric while passing the pre-bunch electrons through a dielectric hollow tube (driven bunch). The next bunch (witness bunch), if injected properly, will be accelerated under the formation of a strong radiofrequency (RF) field on the axis in a periodic manner. The dispersion relation for the circuit with beam–wave interaction was calculated with the eigen-solver using CST simulation, as shown in Figure 1e. When the acceleration voltage was 500 kV, the oscillation frequency was designed as 203.389 GHz. The mode with the lower frequency centered on the TM01 mode is a fast wave mode, so the speed of the electromagnetic wave is faster than that of the electron beam, making it impossible to interact. In the mode with a frequency higher than the TM01 mode, the negative absolute value of the group velocity, which is the slope of the tangent of the phase velocity, is larger than that of the TM01 mode; therefore, it is more difficult to oscillate in resonance frequency mode than in the TM01 mode. Based on this fact, the TM01 mode is designed as an overmoded structure that allows beam–wave interaction to occur in high-order modes compared to the conventional structure, so that modes other than the TM01 mode are prevented from occurring in advance [29]. The fabricated circuit components and dielectric wakefield accelerator (DWA) system are shown in Figure 1f.
Using a pMOSFET (AD420 series) of a semiconductor device, a measurement system that can detect the unstable Ps system was also designed, manufactured, and used in the experiment (Figure 2).

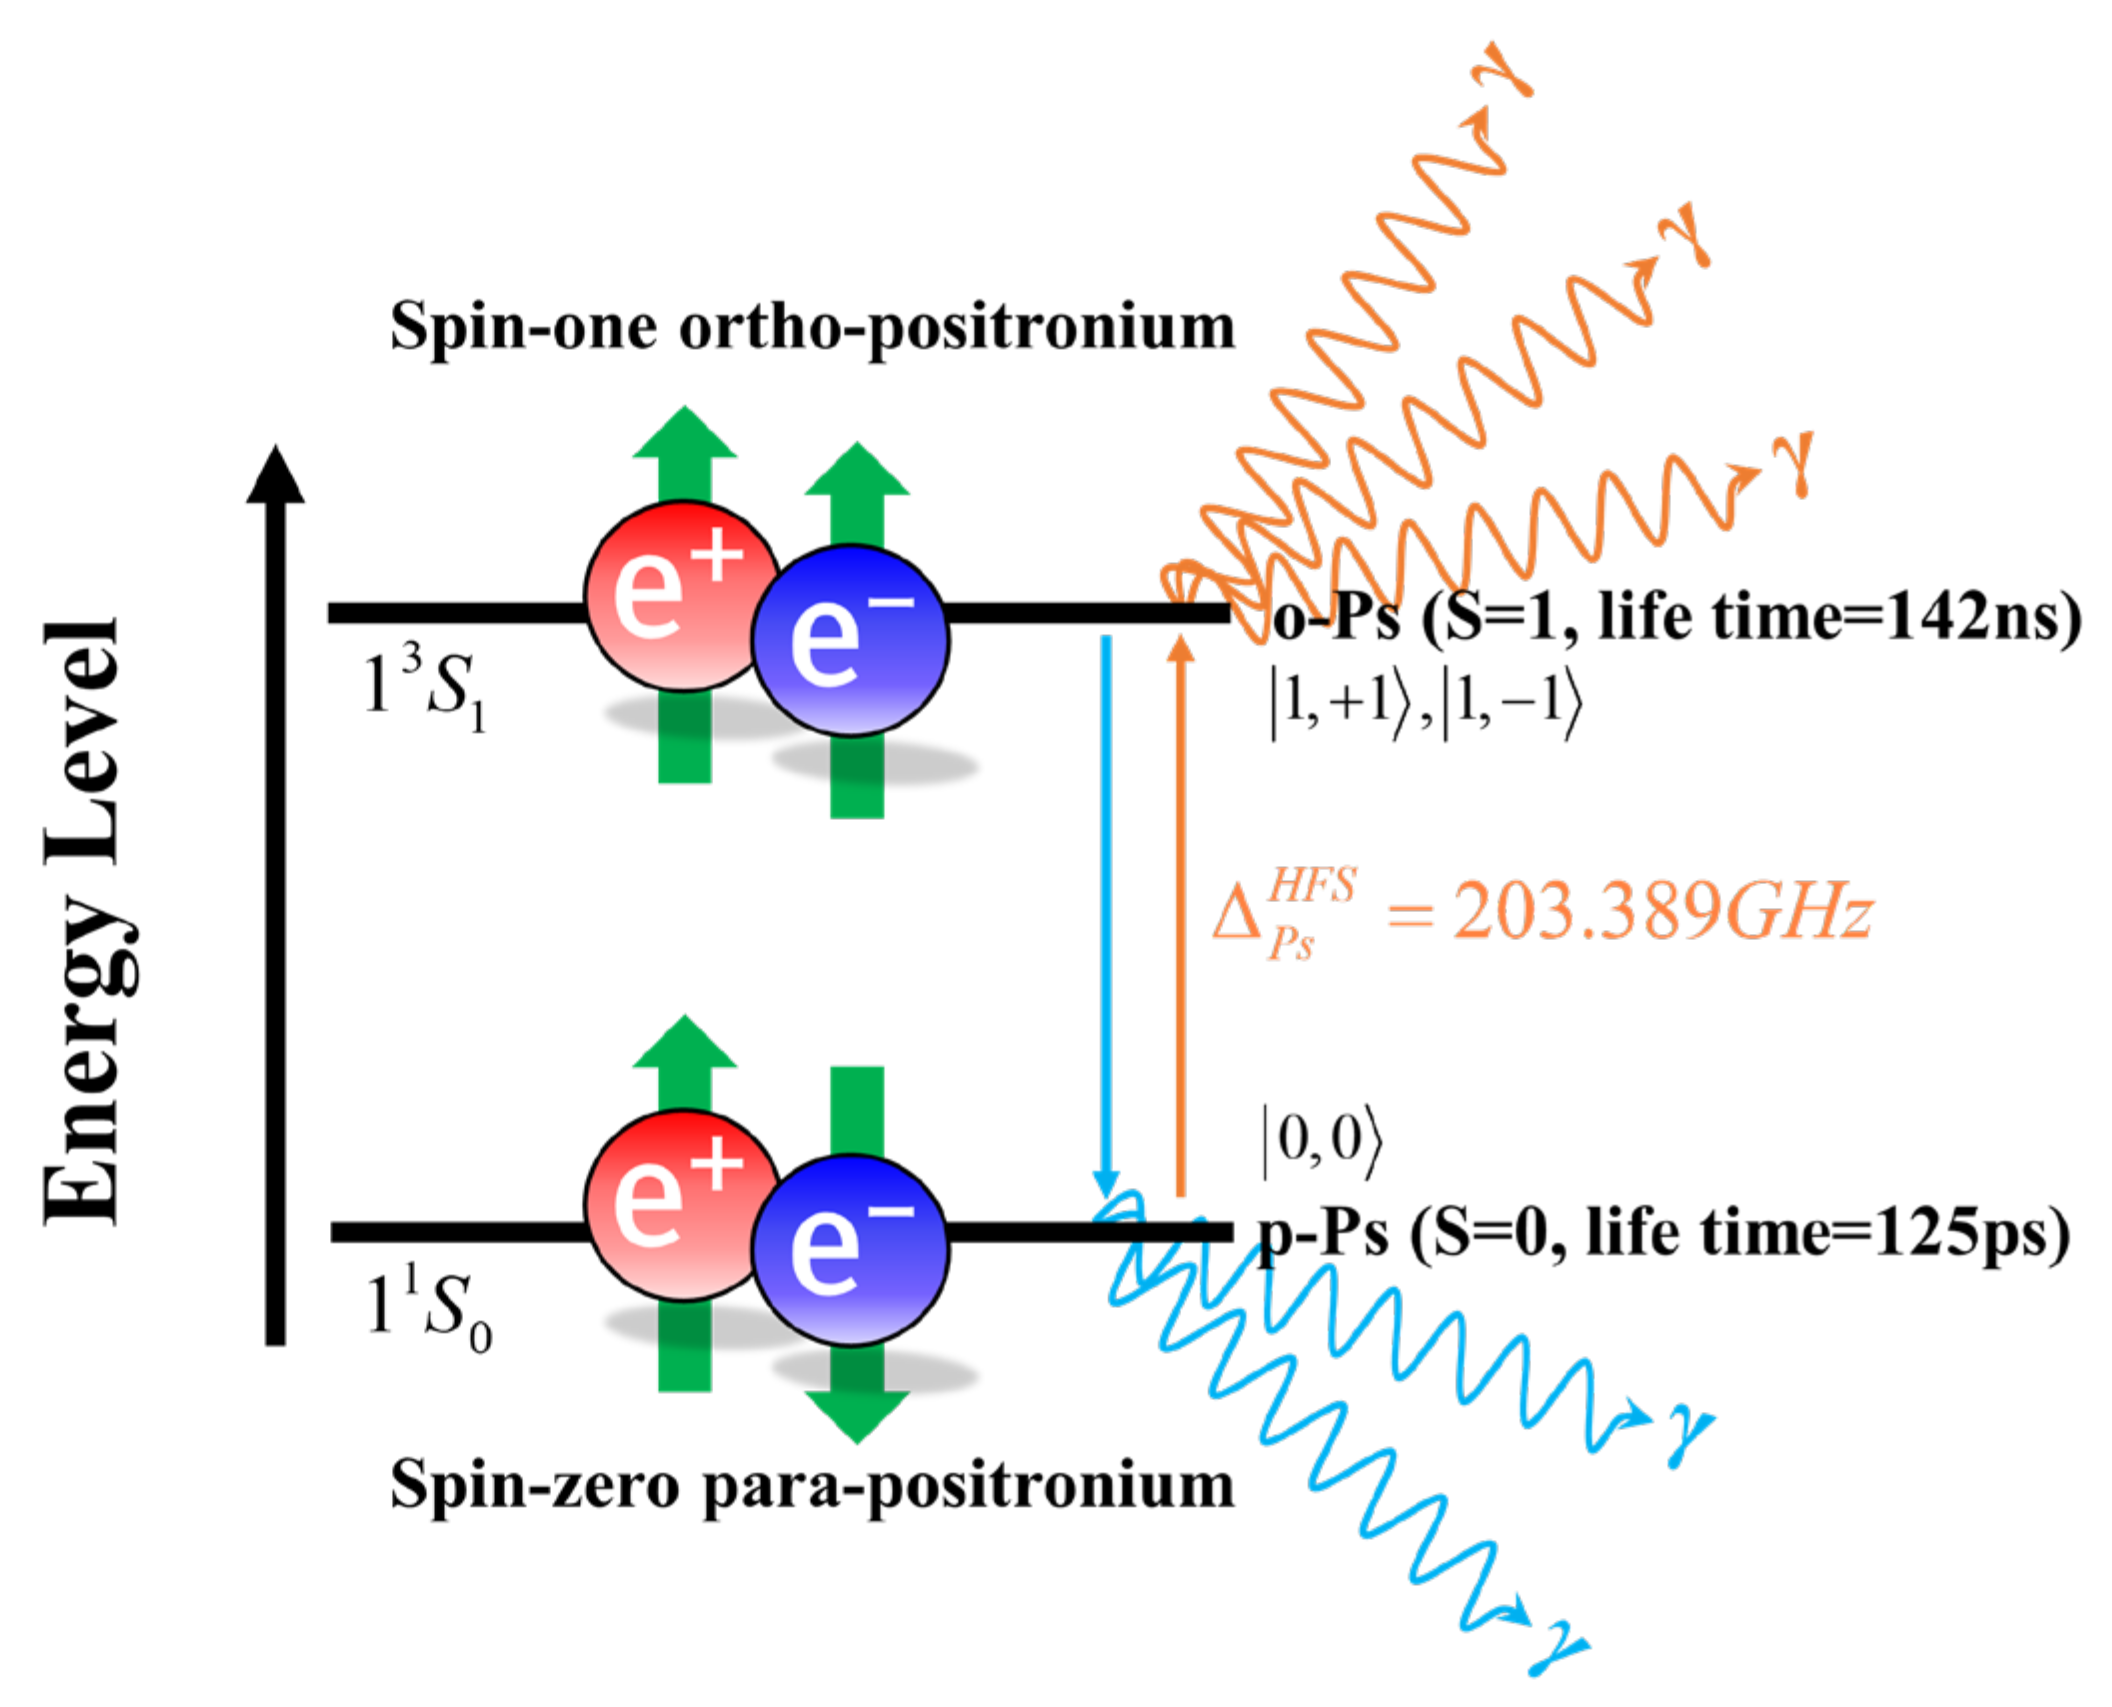
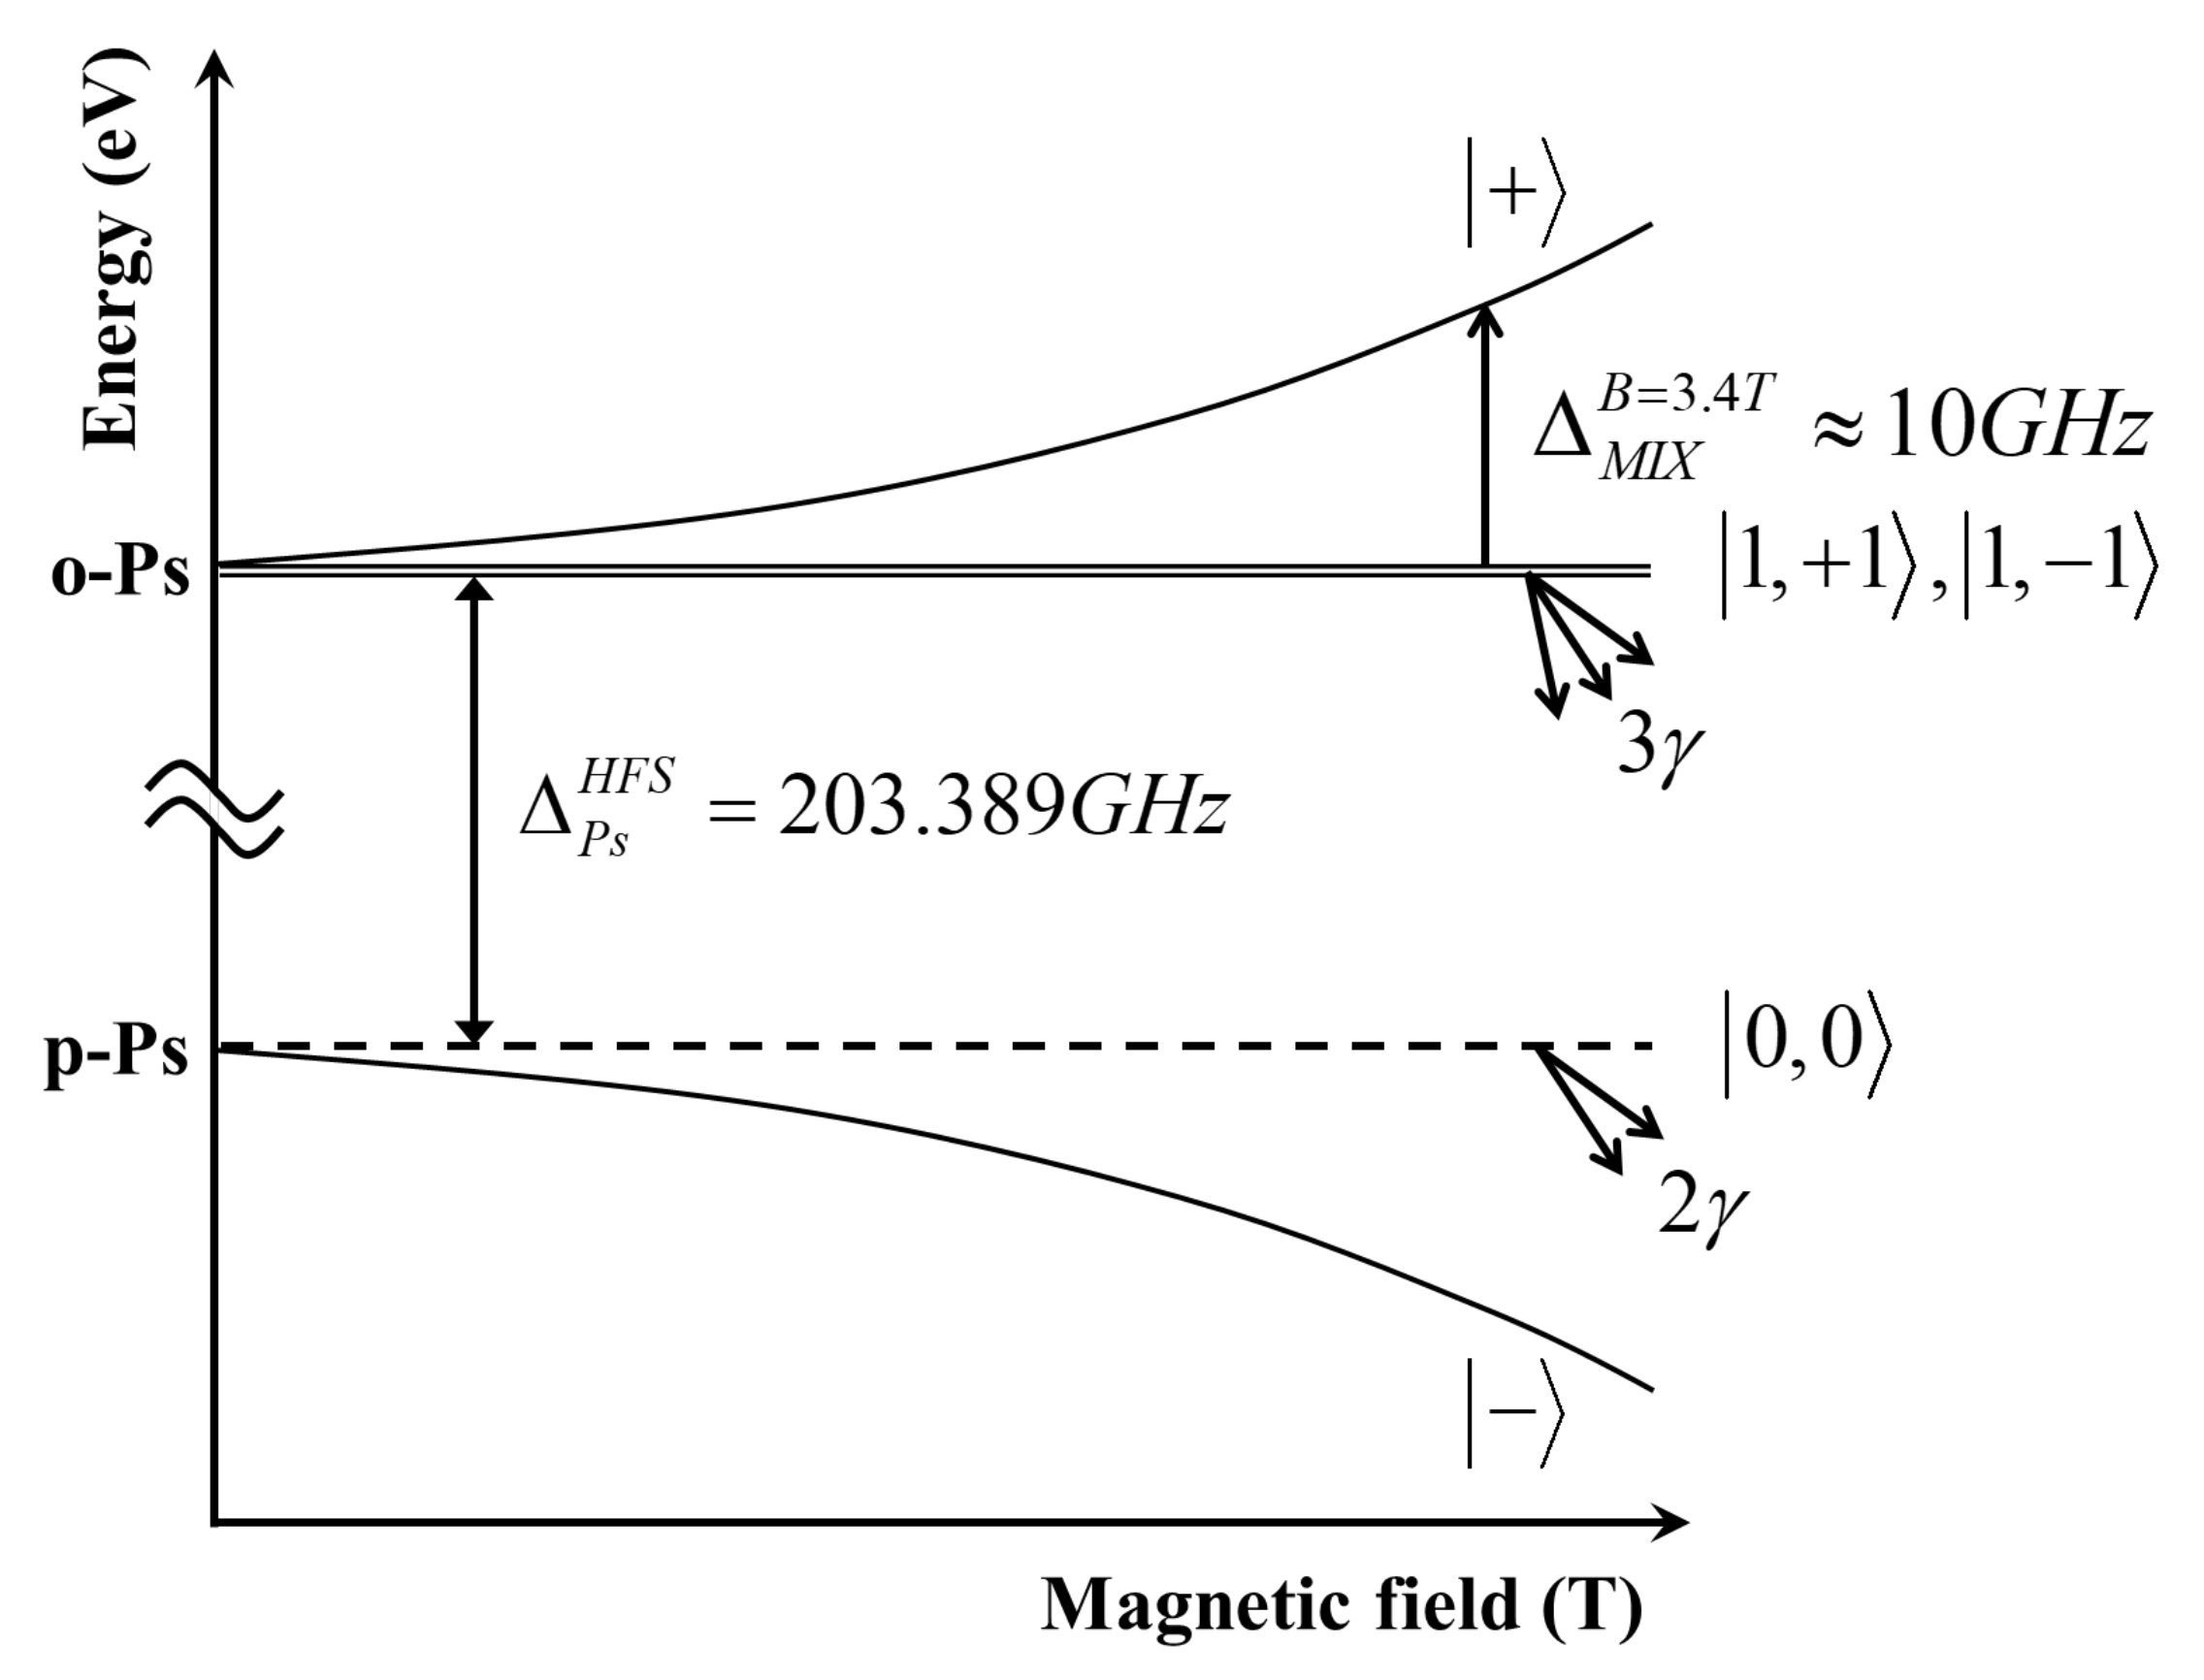
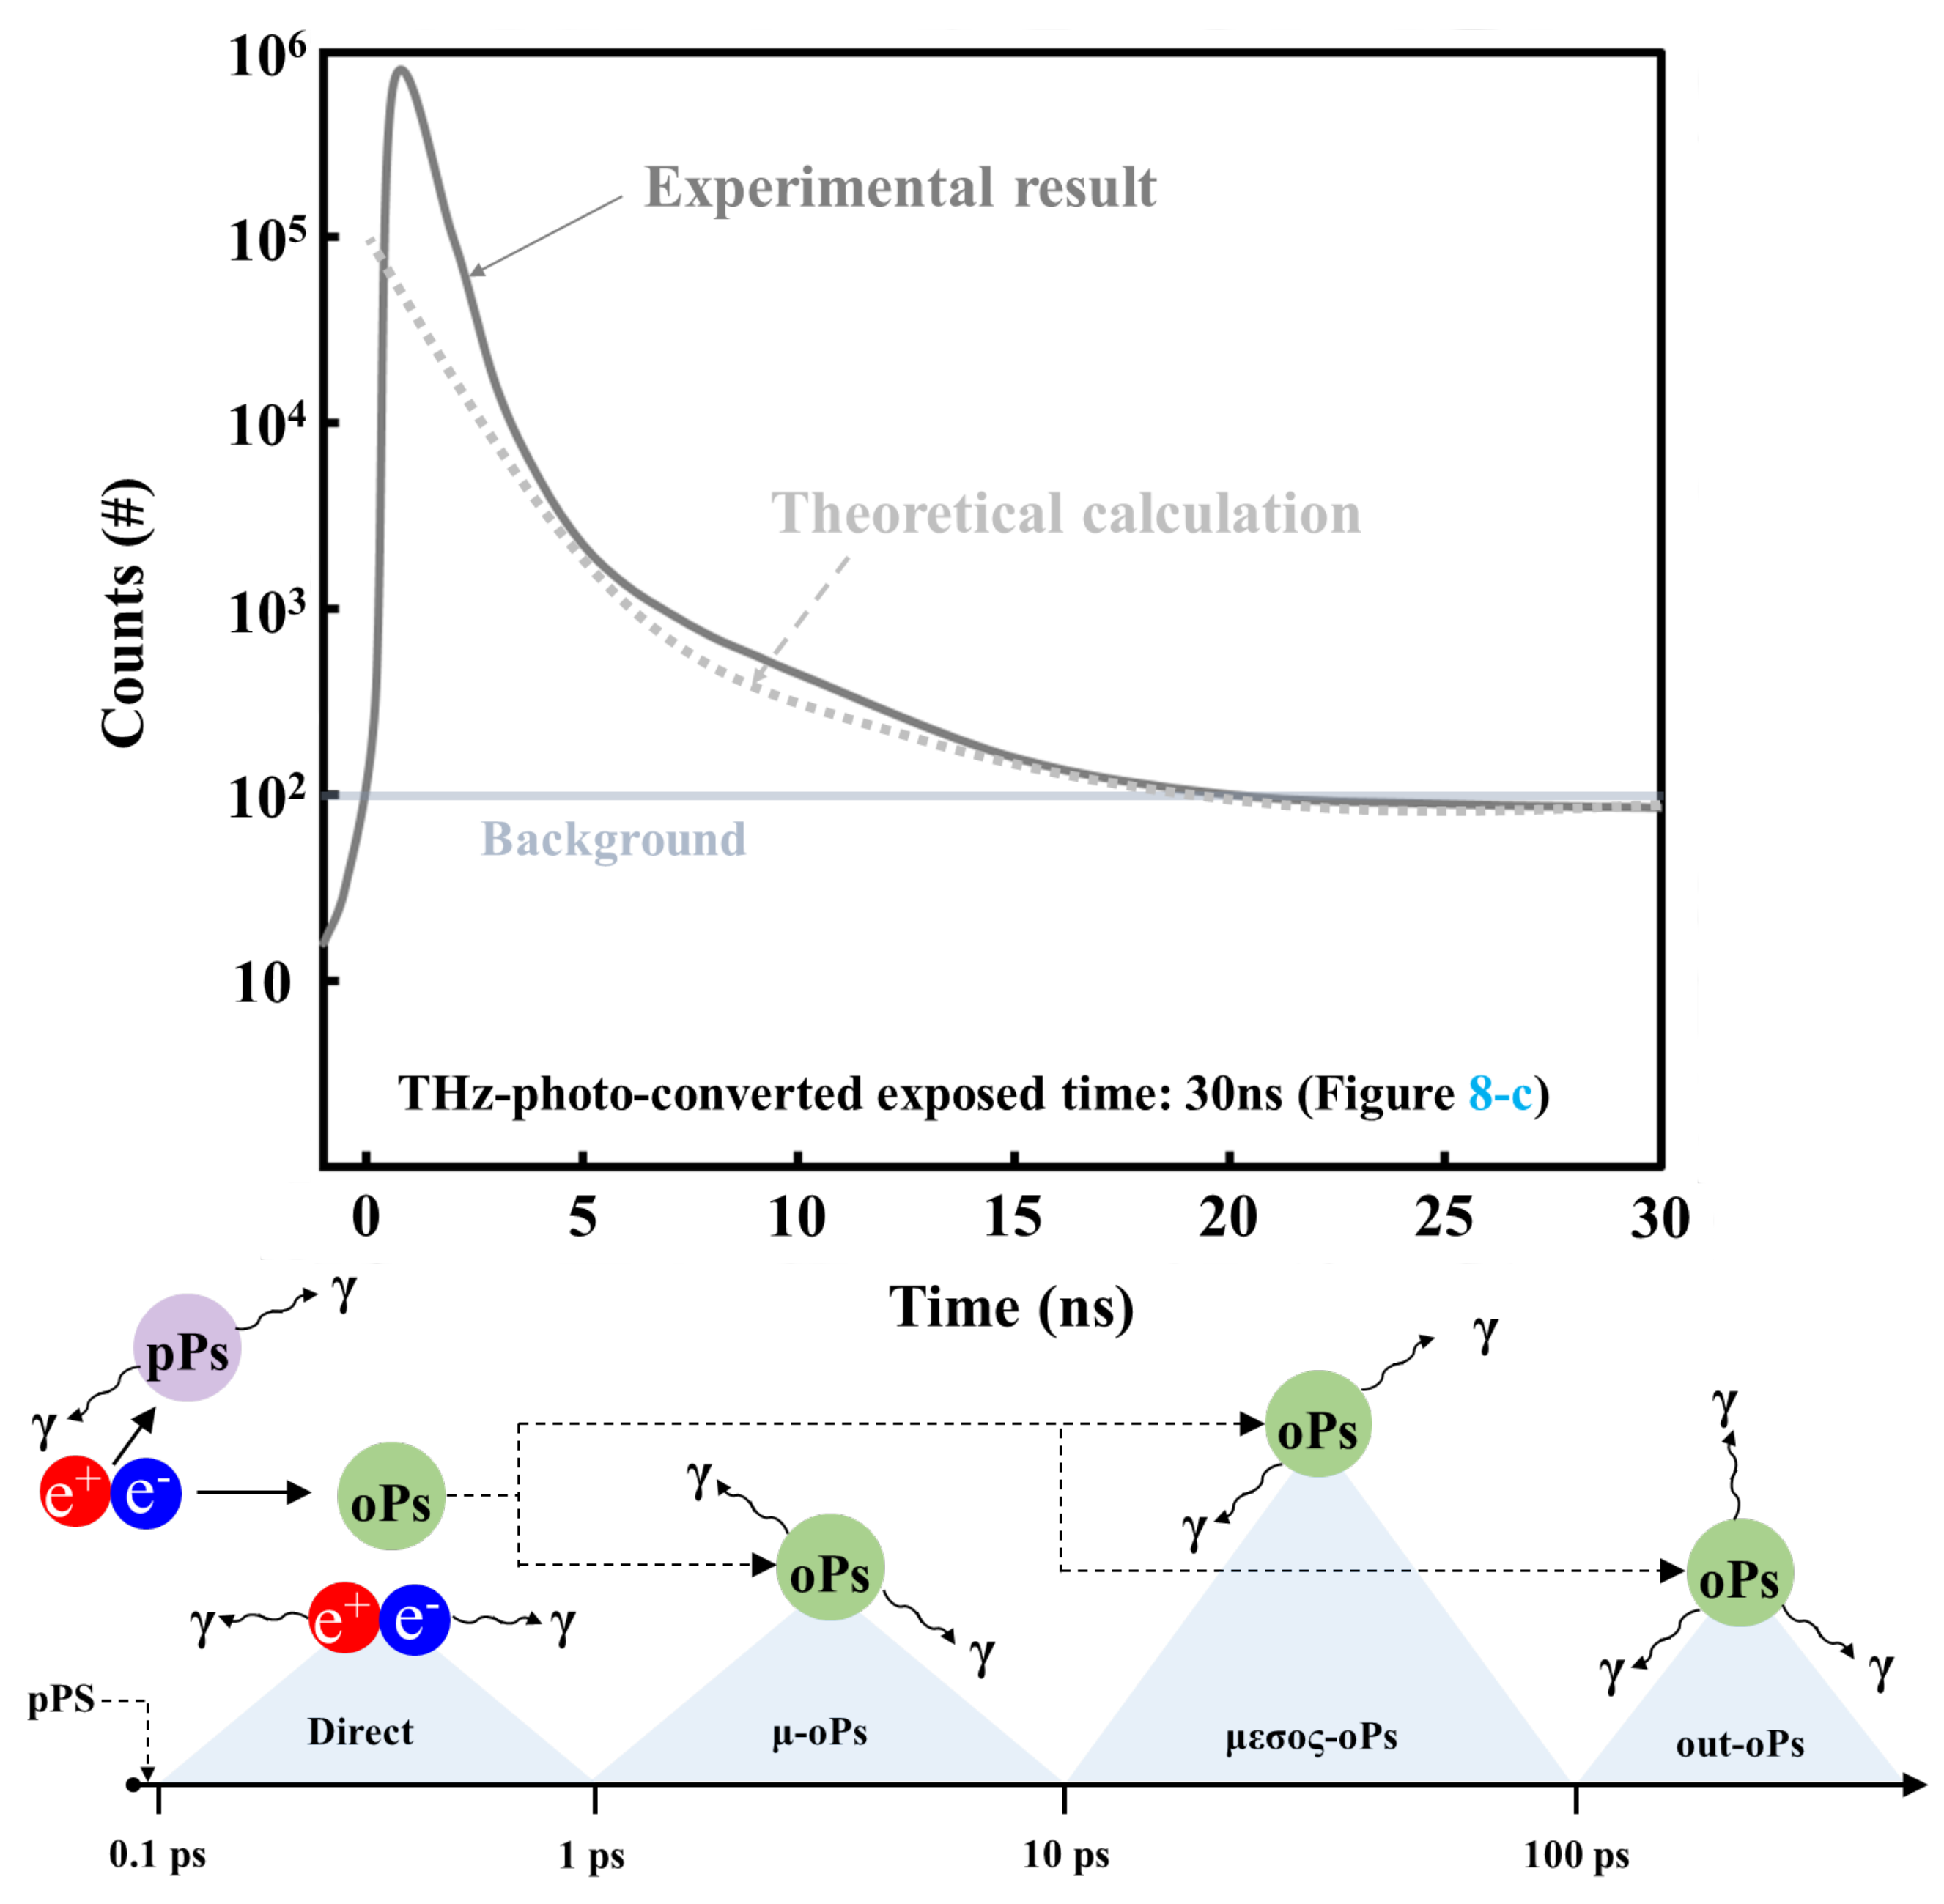
2.2. The Ps Hyperfine Structure (HFS) for Precisive Measurement Technologies of mmW Frequency

For a detailed description of the Ps hyperfine structure (Ps-HFS), we begin with the energy shift caused by the spin–spin interaction. The calculation of Ps-HFS completes the following equation by combining the spin exchange term and the annihilation term in Equation (2) [32,33,34].
Δ P s H F S = 1 3 m e α 4 + 1 4 m e α 4 = 7 12 m e α 4 203 ± Δ
where me is the mass of electrons (9.11 × 10⁻³¹ kg) and α is the fine structure constant, whose value is 1/137 (=2πe2/hc, h = Planck’s constant, c = speed of light).
Figure 3 shows the energy-level diagram of the hyperfine transition of the ground state of Ps with energy density radiation (d(ω)) per unit angular frequency. Incidental radiation is linearly polarized with oscillating magnetic field vectors parallel to |1, 1> and |1, –1>. In this situation, the states |1, 0> and |0, 0> are exclusively affected by radiation, and the angular momentum is conserved.
This shows that when an electromagnetic resonance condition is applied from the outside, the transition from o-Ps to p-Ps is induced, and energy and light are emitted. This is similar in principle to the resonance effect for energy-level splitting due to the Zeeman effect. The spin states associated with the ground state include the 1 3S1 (triplet) and 1 1S0 (single) states. When found in the triplet spin state, the Ps is o-Ps, and when found in the singlet state, the Ps is p-Ps. As a result of the spin–spin interaction, the energy levels of the lowest o-Ps state are determined by the HFS spacing in a spectroscopic relation rather than the corresponding p-Ps state, the resonance frequency, or its associated wavelength. The more accurate resonance frequency for the energy level transition from o-Ps to p-Ps in Figure 3 is 203.389 GHz, that is, 140 times larger than that of a hydrogen atom (H-HFS = 1.42 GHz). The frequency of 203.389 (=203 + Δ) GHz belongs to the millimeter wave frequency band (typically defined to include the mmW frequencies range). When combined with mmW photoconversion technology in this frequency band, it is possible to reduce the effect of radiation coating by γ-rays during PET (positron–electron pair annihilation (2γ generation)). It can last longer and has the potential for precise diagnosis by imaging with a resonance effect equivalent to the energy level of the mmW frequency band. The imaging implementation time, which depends on the lifetime of the γ-rays generated by conventional PET, is very short, at hundreds of picoseconds (ps) [35,36,37,38]. At hundreds of nanoseconds, it is possible to secure a much longer visualization time than at hundreds of picoseconds. By measuring the lifetime of Ps using positron annihilation lifetime spectroscopy, if the imaging time is longer, information on the fluorescence lifetime of each pixel can be included for each step.
The transition probability of o-Ps(3γ) was the same as that in Equation (3). The transition probability was measured by counting the number of γ-ray pairs emitted from the transition of o-Ps(3γ). Figure 4 shows the transition probabilities from zero to ∞ [3,32,33,34].
P o P s 3 γ = 4 3 π 2 α m e 2 c d ω 0 t N 1 , 0 e 4 3 α m e 2 c 4 2 Δ P s H F S 3 Γ t r a n s + Γ o P s t d t t
where N |1, 0> promptly decays and decouples from Equation (3), because the opposing transition from p-Ps to o-Ps can be ignored; Γtrans is the induced transition rate, which is ¾(π2αd(ω)/me2c) [39].
Figure 4a shows the transition probability of the maximum value of o-Ps(3γ) at the resonance frequency of 203.389 GHz, where the wavelength of the energy level difference between o-Ps and p-Ps is 1.47 mm. As shown in Figure 4b, as the power level increases, the transition probability of o-Ps(3γ) also tends to increase non-linearly because of the low Rabi frequency when the power is less than 100 kW (Γtrans << Γp–Ps; the induced transition rate for p-Ps). When the power reaches the MW level, the transition probability can theoretically increase to almost 50%. The probability of transition to the energy level state of o-Ps (1 3S1) corresponds to the energy absorption wavelength of 1.47 mm (Figure 4). This is to configure an MW-level vacuum electronic device (VED) system that can generate high-power millimeter waves under a resonance frequency condition of 203.389 GHz. This is possible by implementing a DWA–VED system, as presented in Figure 1. The transition probability is determined by the original width of 2πΓp–Ps (=1.15 GHz), and the mean of the transition is reduced, with a lifetime of 142 ns in the state of o-Ps. Therefore, high-power mmW (203 GHz radiation) at the MW level are required to induce p-Ps transitions to o-Ps (Γtrans >> Γp–Ps for MW-level power).
The method of measuring and analyzing the HFS of Ps using the Zeeman effect was first attempted by Deutsch and Brown in 1952 [40]. Subsequently, the measurement experiment for Ps-HFS was carried out in two ways: direct and indirect. In all the previous accurate measurements, the Ps-HFS was indirectly measured during the transition of the Zeeman effect under constant external magnetic fields. Our case was a similar indirect measurement. Direct measurement of Ps-HFS in the absence of a static field or other independent experiments have yet to attain a sufficient level of accuracy to resolve the discrepancy [41,42].
The eigenstate of Ps is expressed in four forms from Equation (4) as follows:
1 , + 1 = 1 , 0 = 1 2 + 1 , 1 = f o r o   P s 0 , 0 = 1 2 f o r p P s
The Ps spin eigenstate can be expressed as mz |S, mz⟩, where the total spin is represented by S, and the magnetic quantum number is mz. In addition, the eigenstates of the electron’s spin are |↑⟩ and |↓⟩, and the eigenstates of the positron’s spin are |⇑⟩ and |⇓⟩. In this case, the quantized axis was determined to be the z-axis. Figure 5 shows the energy levels of ground-state Ps in terms of terms dependent on the static magnetic field. Under the condition of a static magnetic field, the states of |1,0⟩ and |0,0⟩ are mixed. The energy eigenstates of Ps are |+⟩ and |–⟩ by the Zeeman effect, which is the energy split of ΔMIX and is the energy level difference between the eigenstates of Ps mixed by the Zeeman effect. The relationship between ΔPsHFS and ΔMIX in a static magnetic field B is approximated by the Breit–Rabi equation (Equation (5)) [3,43].
Δ M I X = Δ P s H F S 2 1 + 2 μ B B h Δ P s H F S 1 5 α 2 24 1
where g-factor is the bound-state electron in Ps, B is the magnetic field in the static condition such that ΔPsHFS can be determined by ΔMIX and B, h is the Planck constant, μB is the Bohr magneton, and ΔMIX is approximately 10 GHz for a static magnetic field of about 3.4 T in the experiment. Using DWA from Figure 1, which can generate hundreds of MW-level power with a resonance frequency of 203.389 GHz under an external magnetic field condition of 3.4 T, which can make ΔMIX at a higher energy level than 13S1, o-Ps 23S1 becomes an excited o-Ps eigenstate, which can jump immediately without going through the state of 23Pn (n = 0, 1, 2). In order to become stable again, the polarized photons corresponding to 3Υ are emitted for a lifetime of 1.14 μs, making it an o-Ps eigenstate of 13S1 again [3]. Unless Ps is polarized, the lowest energy levels, a singlet, and three triplet states will each be generated with equal likelihood. Otherwise, as several eigenstates of Ps polarization along the quantization z-axis are mixed, Ps may be more prevalent at S = +1 than at S = −1. The transition probability of o-Ps becomes 75% with spin S = 1, and only 25% with spin S = 0 in the case of p-Ps [3,4]. This corresponds to Equation (6) below.
2 × 142 n s + 142 n s × 3 4 + 142 n s × 3 4 2 + = 2 × 142 1 3 4 n s 1.14 μ s
The result of Equation (6) is the same as in the case of the polarized photons, corresponding to 3Υ, emitted for a lifetime of 1.14 μs. This can be more easily utilized for imaging by extending the lifetime of the polarized o-Ps to the level of microseconds (μs) rather than the time period of ps or ns, as mentioned above.

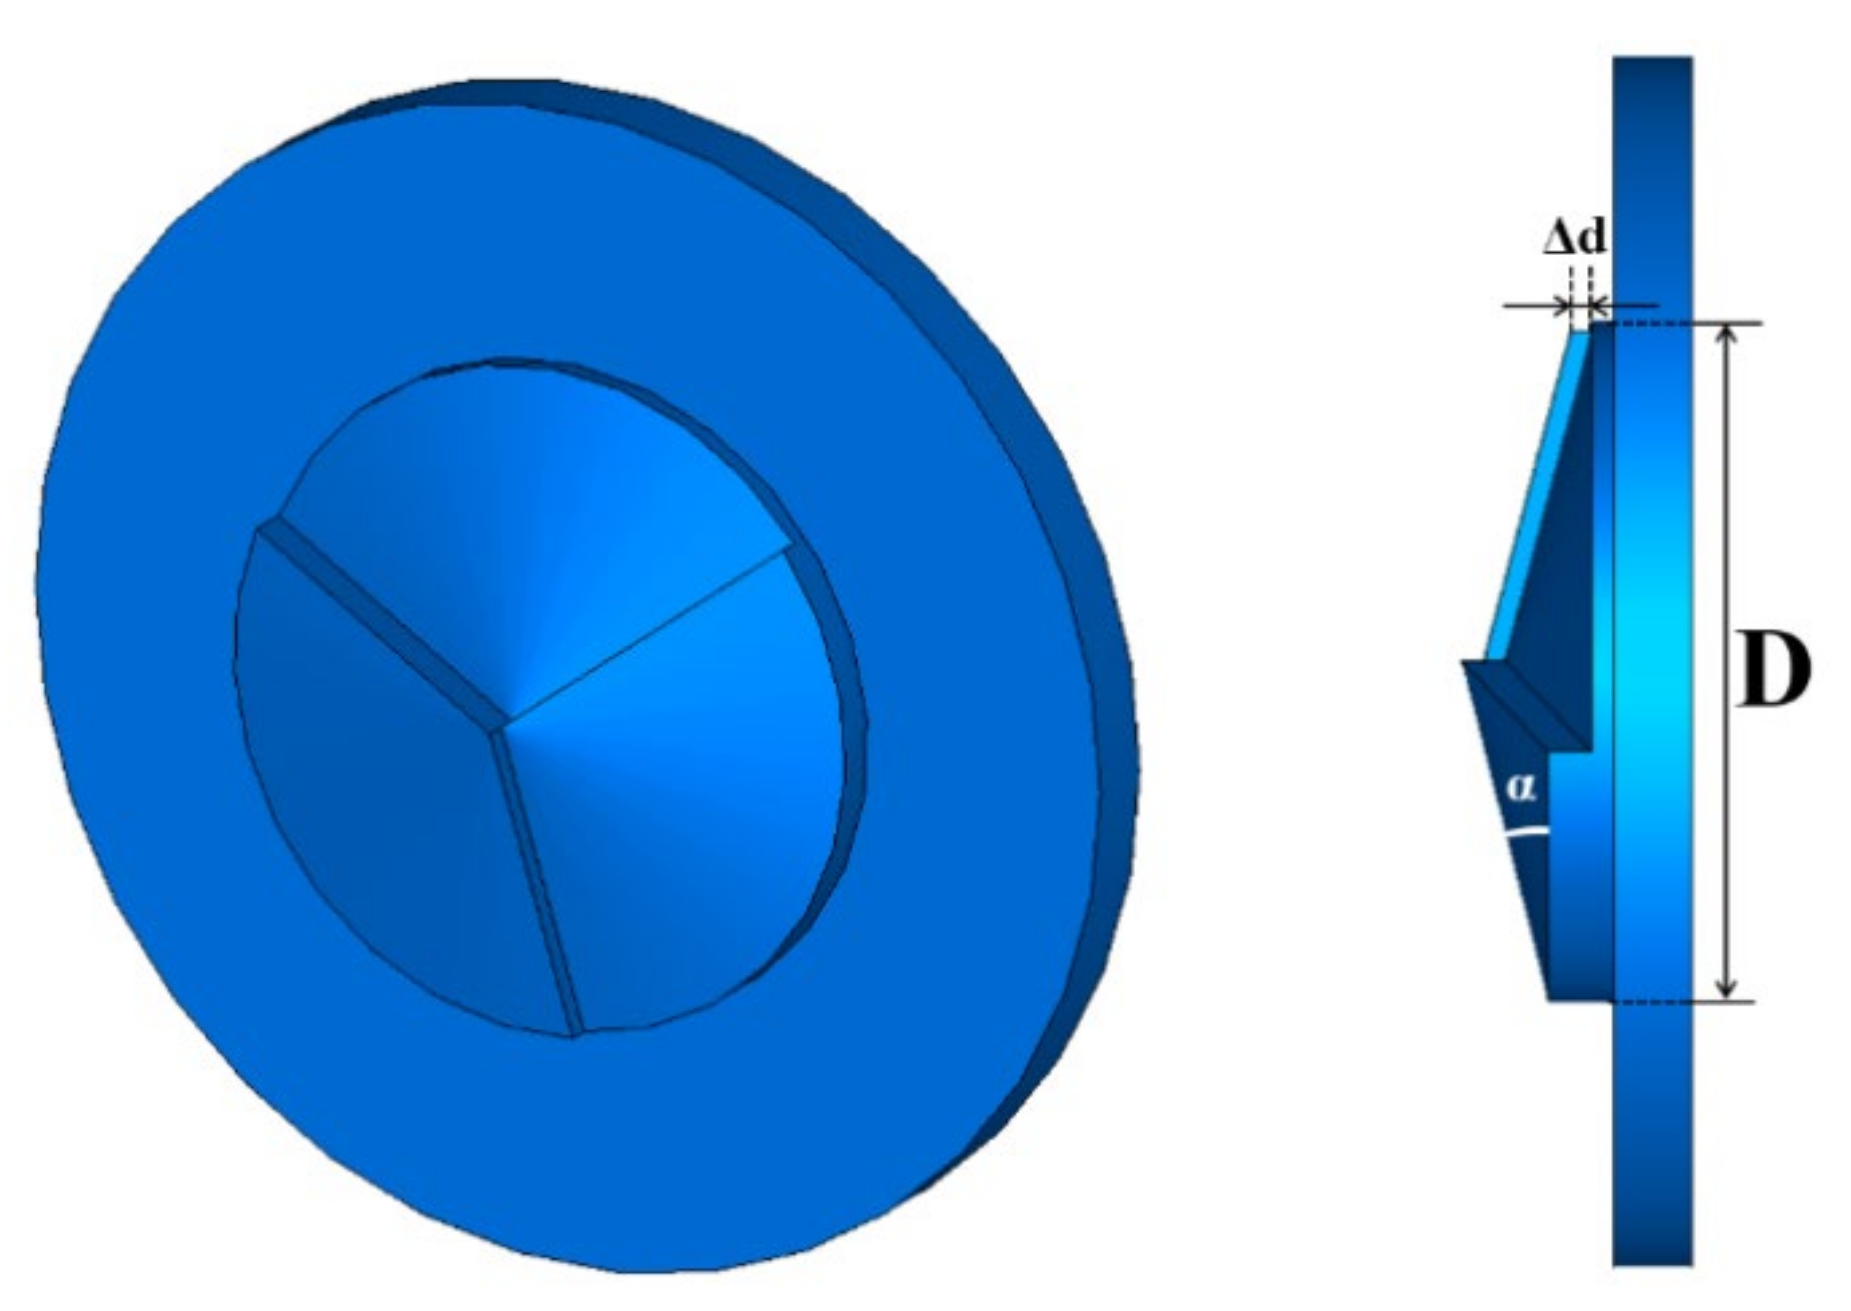
2.3. Photoconversion of mmW Generating Positronium States with Bessel Polarization

A three-stepped axicon lens was used, as shown in Figure 6, to apply the photoconversion technology together with the Bessel polarization mode of the mmW with a resonant frequency range for the energy level shift of the excited Ps. A three-stepped axicon lens generally has a simple conical structure rather than a step structure, and is widely used in spectroscopy, such as lasers. This lens can create various beam patterns in combination with convex or concave lenses. It can be used to convert annular relativistic electron beams or Gaussian beams into non-diffraction Bessel beams. It also functions as a mode conversion antenna that converts the transverse magnetic mode to the transverse electric mode in electromagnetic waves. Thus, under the electromagnetic mmW resonance condition (203.389 GHz), the Ps emits light in a light conversion mode through energy emission so that it can be radiated into the air through an axicon lens. It is also possible to target, such that the conditions for exposure to Ps can be created in the desired animal or object. Here, the gain of the three-stepped axicon lens is designed optimally to reach the maximum value on the center, and the distribution of the Bessel beam generated by all conversions is designed and manufactured in the form of an axicon lens with three phases of phase difference such that more than 90% of the distribution of the Bessel beam can be emitted from the center.
The design of a three-stepped axicon lens is calculated based on Equation (7) below.
D 2 l tan α ε r 1
where ℓ is the distance (0.2 m) required for the experiment, and α is a value calculated through the cone angle (=180°-α) of the three-stepped axicon lens.

3. Results

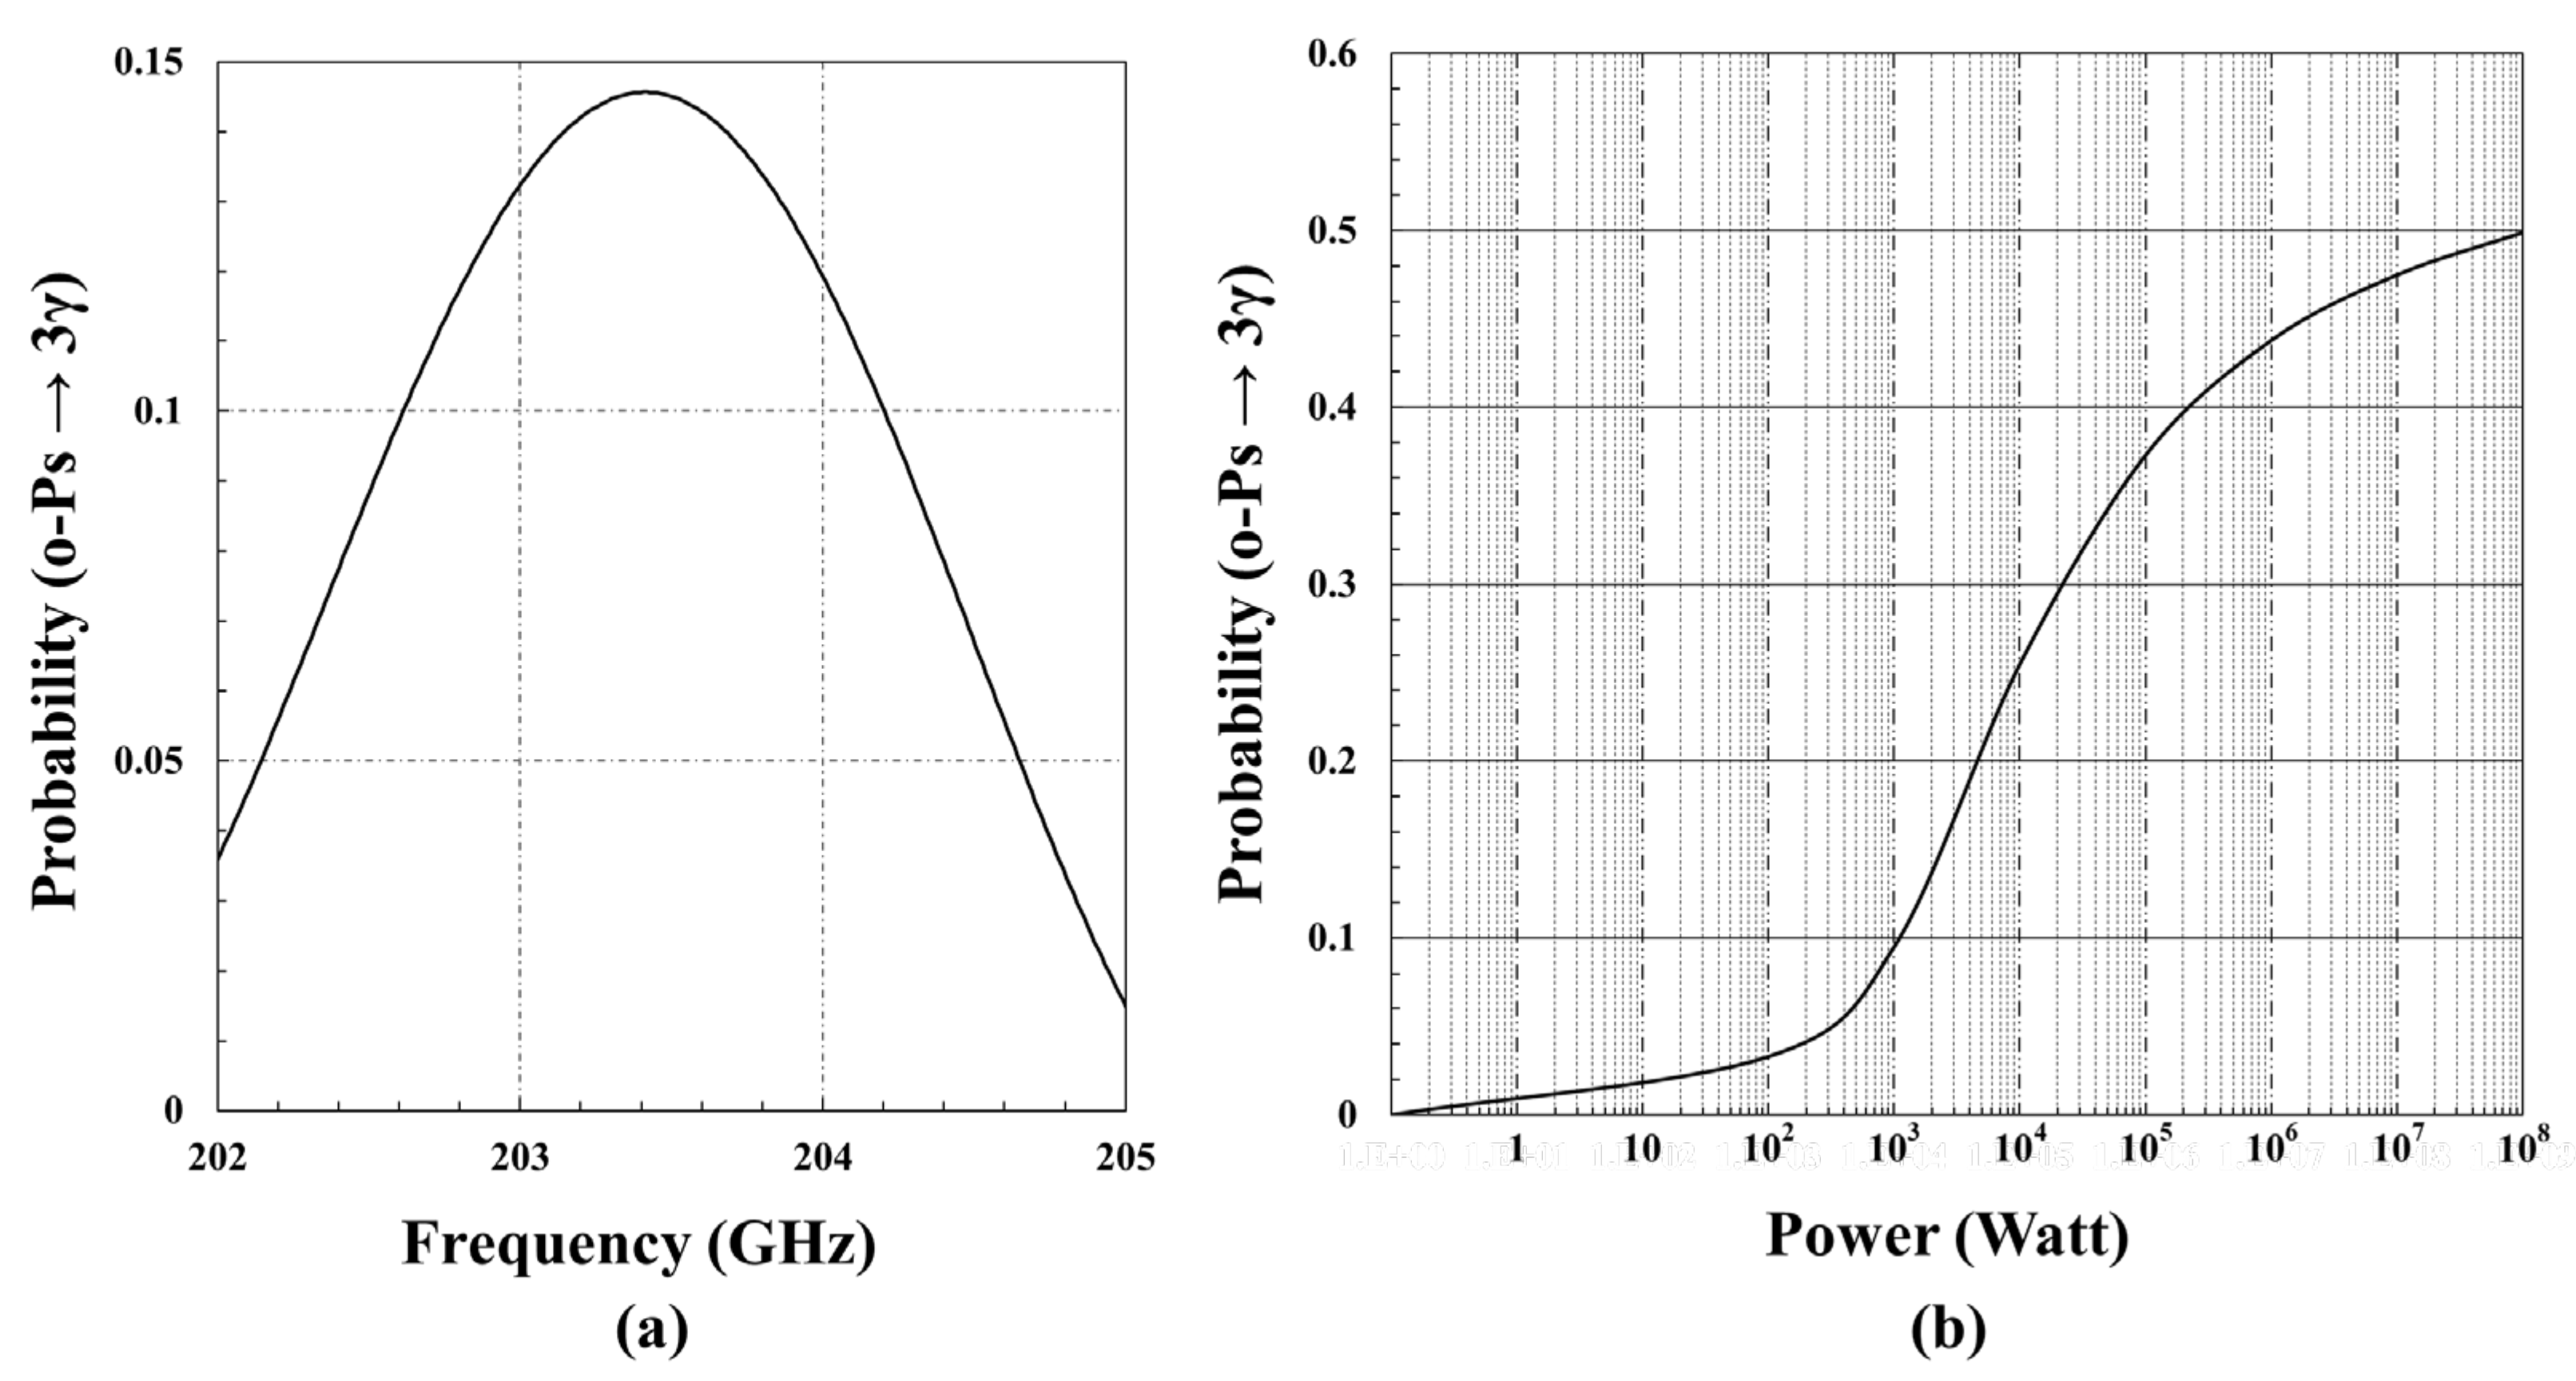
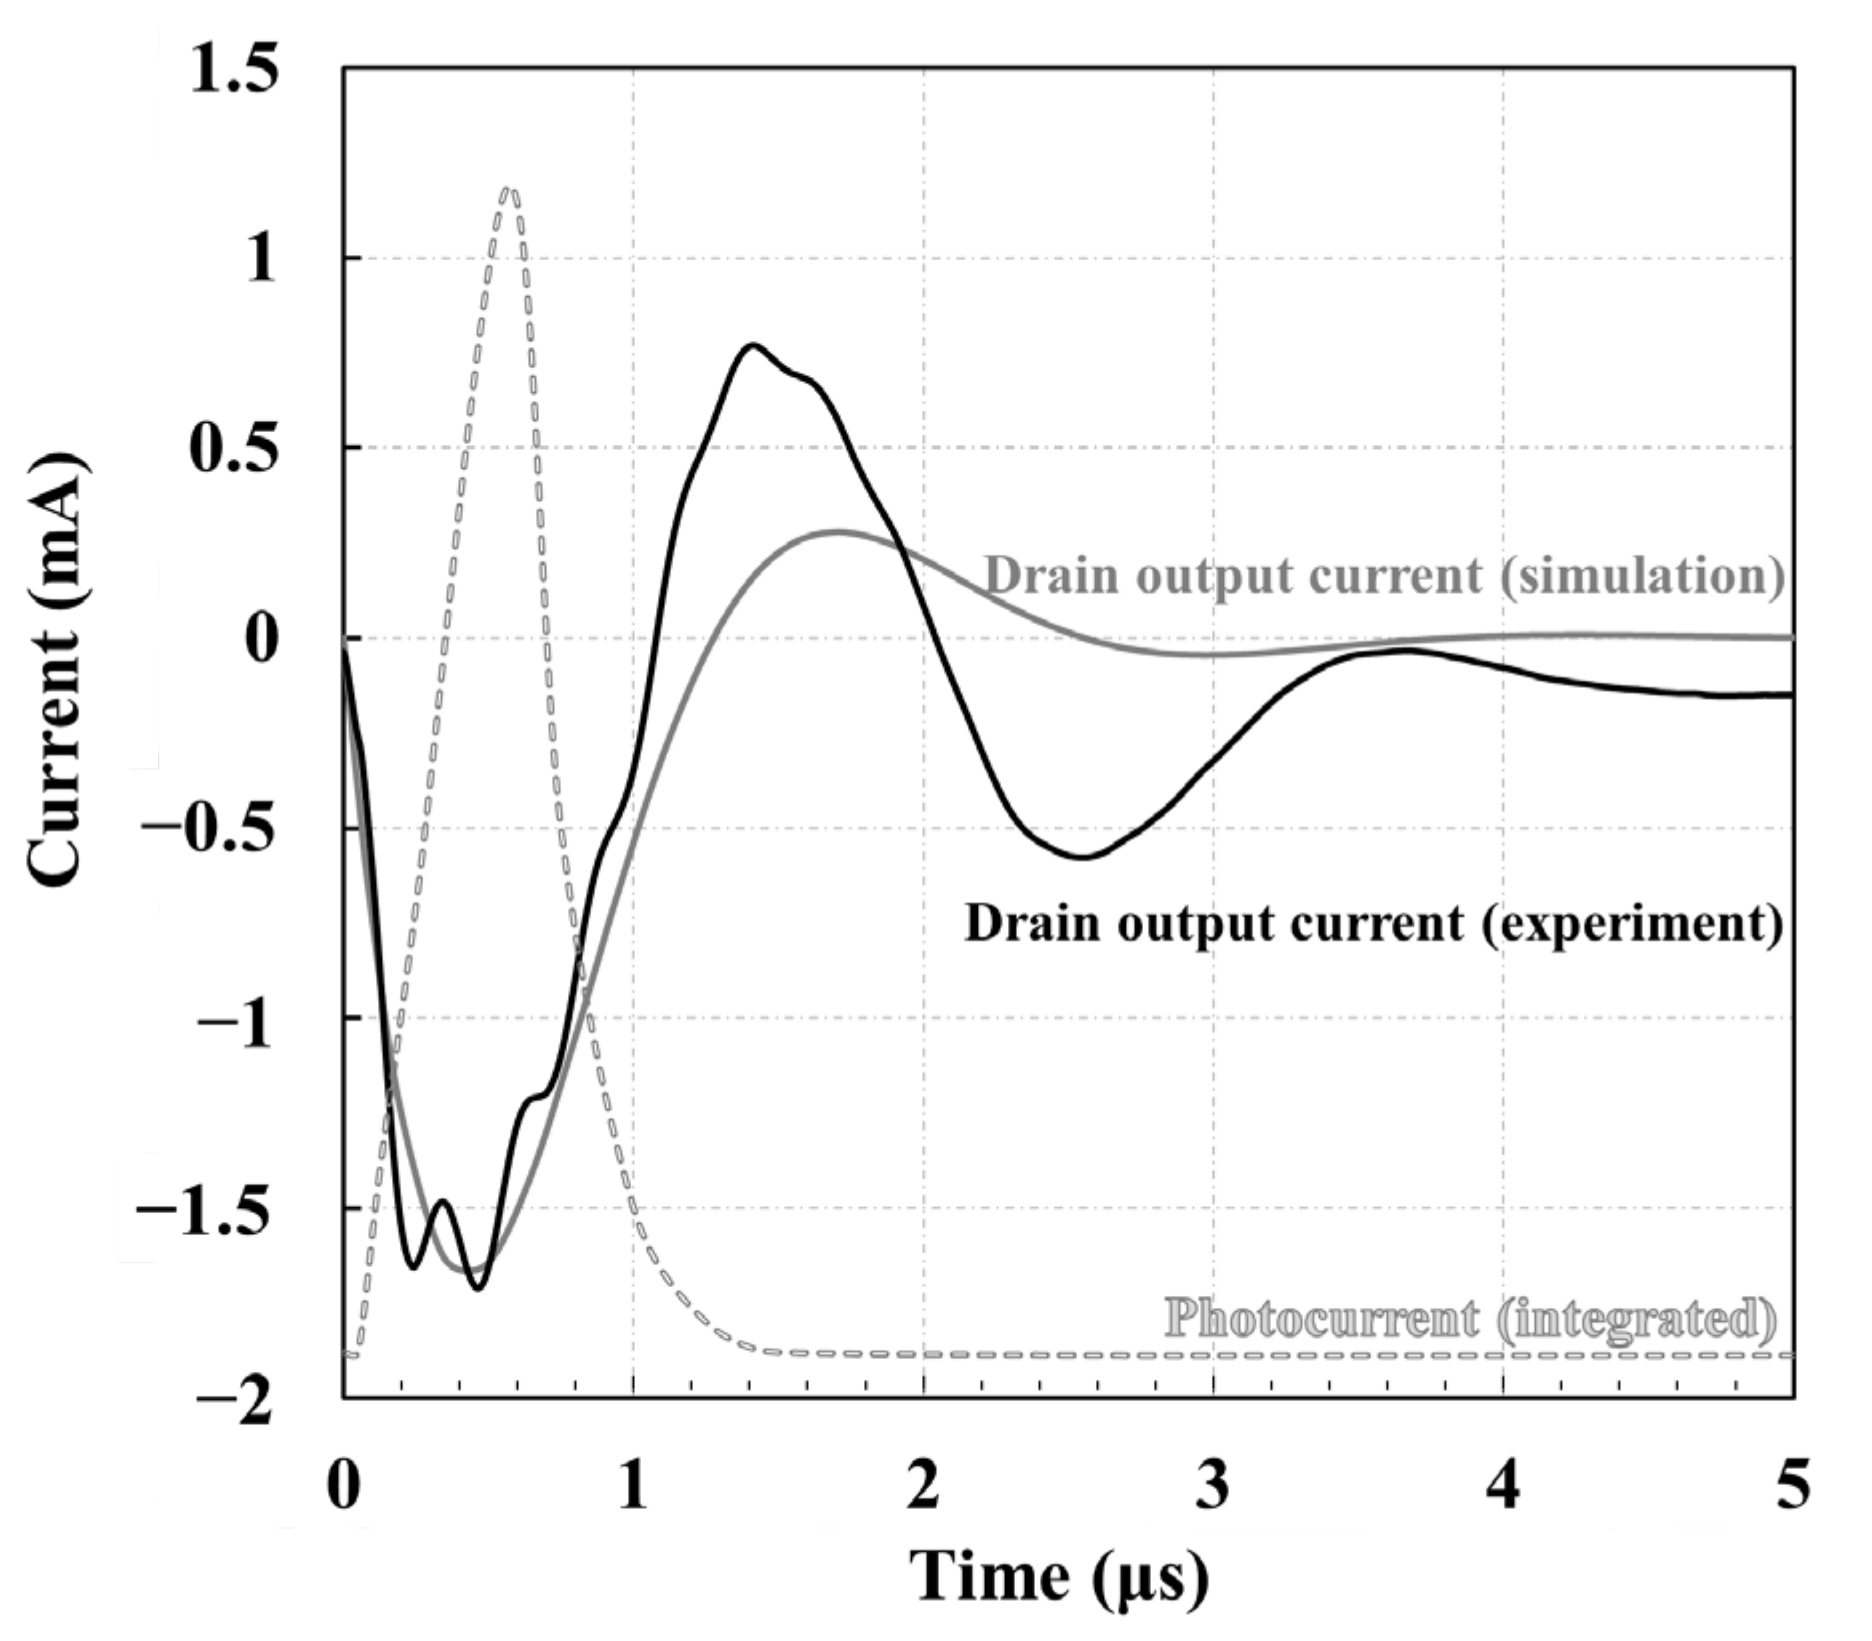
3.1. Detection of Ps States with Measurements for mmW and Bessel Polarization through the Three-Stepped Axicon Lens

In Ps detection, the detection system is configured by measuring the photocurrent when positrons and electrons react to emit γ-rays. To irradiate a single pulse of Ps, a shutter was created so that the shutter could be opened and irradiated according to the relativistic electron beam output trigger signal. In addition, because the noise signal from the mmW generator is large in the investigation facility, a signal-processing circuit was added for accurate photocurrent measurements. The output signal was measured using an oscilloscope by connecting a low-noise cable to the outside of the examination room.
Figure 7 shows the device under test (DUT) installed inside the γ-ray detector and the process of measuring the output signal from the outside (refer to the location of the DUT in Figure 2). For the analysis of transient radiation effects at the semiconductor device level, a single pMOSFET device was used in this experiment, with the process and structure parameters set by itself. The use of a pMOSFET in the actual test is based on the principle that γ-rays detected from Ps generation cause ionization when incident on a silicon medium. Figure 7 indicates the test results of the Ps pulse detection using a pMOSFET-based γ-ray detector. The waveform of the drain current obtained through the logic circuit operation process of a high-pass-filter (HPF) amplifier and low-pass-filter (LPF) amplifier is shown as an experimental result (black line). In addition, from the simulation results, only the drain output current waveform for the input pulse is extracted and shown, which is indicated by the gray line in Figure 7. It can be seen that the waveforms of the two pulses of the experimental result and the predicted simulation have a similar shape. The two output signals showed similar shapes, and these results confirmed that the overall modeling and simulation of the pMOSFET device for the pulsed input radiation signal were performed correctly. At the same time, pulse waveform measurement was also performed by detecting the photocurrent using an RC integrator (dashed line in Figure 7). This is based on the principle of measuring the current induced in response to a semiconductor device capable of photodetection when a Ps pulse is generated through a pMOSFET, for confirming whether the Ps pulse is detected properly. In Figure 7, the detected transient pulse time corresponding to the first half-wavelength of the sine wave is at a level of 1.1 μs, which is similar to the result of Equation (6).
Figure 8 shows the experimental results of measuring the physical quantity of the relativistic electron beam generated by the plasma wakefield accelerator. Figure 8a shows the relativistic electron beam current with time. The beam voltage was measured using a measuring device called a capacitive voltage probe to measure a pulse-type high voltage ranging from kV to MV. This is a measuring device composed of a resistor and capacitor based on the principle of conductor capacitive coupling occurrence. If the RC characteristic time (~100 μs) is much larger than the length of the pulse to be measured (~100 ns), it is possible to measure directly without an integrator. In the experiment, the electron beam acceleration voltage was measured to be 0.5 MV, which meant that the relativistic electron beam acceleration energy was 0.5 MeV. In this case, the relativistic electron beam speed was approximately 87% of the speed of light, and the γ-factor was about 2. Cherenkov radiation occurs because the phase velocity of the relativistic electron beam becomes faster than that of the electromagnetic wave generated through the dielectric, which functions as a slow-wave structure. Figure 8b shows the experimental results of the beam current measurement. It can be seen that the space diode impedance has a value of 100 Ω and the relativistic electron beams are traveling under the space charge limited current in the plasma wakefield accelerator. For the beam current, a B-dot probe using Faraday’s law and Rogowski coil was used. Figure 8c shows the results of measuring the output power of electromagnetic mmW through the waveguide RF coupler under the relativistic electron beam generation condition generated through the plasma wakefield accelerator. The slot size of the RF coupler of the mmW power to be measured was determined to be 1/4 wavelength in the G-band band, and the frequency mode was measured based on the transverse electric mode through the coupling reaction. High-power mmW frequency (G-band) measurement systems include signal generators, spectrum analyzers, harmonic mixers, active-frequency multipliers, and other waveguide components. The double-heterodyne method was used, based on commercial components, and the output power was measured to be 0.1 GW. Figure 8d shows the frequency of mmW by connecting a divider to the harmonic mixer, and additionally connecting a power meter when measuring the output power of Figure 8c was measured. By performing a fast Fourier transform (FFT) based on the signal generated by the oscilloscope, the operating frequency value of the mmW can be determined. As shown in Figure 8d, the operating frequency was measured to be approximately 203 GHz. Under the electromagnetic mmW resonance condition (203.389 GHz), it emits light in the photoconversion mode through the energy release of Ps and radiates into the air through an axicon lens. It has been confirmed through experiments that the relevant conditions can be created.

3.2. Measurement of the Radiated Ps for the Targeted Sample In Vivo

The lifetime of Ps is determined using positron annihilation lifetime spectroscopy (PALS). The advantage of using PALS to investigate structural modifications and micro-environmental changes in biological samples is that it is nondestructive and preserves the structural properties of the samples. In particular, PALS can be used to test structural changes in biomimetic systems assembled from biological polymer systems such as chitosan, bilayer interphase (emulsion, liposome, and micelle systems), or biological membranes. In terms of specific membrane diffusion and permeability, PALS is sensitive to nanostructure changes due to the formation of bioactive nanoparticles used in the drug delivery systems. In metabolic processes, the complex biological structures and structural stability of molecules inside living organisms are maintained by intracellular hydrogen bond interactions. For example, dehydration and rehydration processes are conserved by intracellular carbohydrate liberation, which preserves the integrity of biomolecules. The PALS technique can be used to evaluate the intermolecular pore size in amorphous and crystalline biological materials (so far studied in the polysaccharide trehalose) to show the correlation between intermolecular pore size and activated water diffusion.
For these biological systems, PALS may provide a unique opportunity to gain deeper insights into the nanostructures, concentrations of bioactive molecules, and dimensional pore spaces at the nanometer and sub-nanometer scales. This is the only technique that enables effective and nondestructive studies of the structure of matter at the nanoscale, allowing us to trace the detailed processes by which positron–electrons interact with a medium. This technique has not been used previously in PET [44,45,46,47].
Based on the basic schematic diagram of PALS, the PALS system was constructed under in vivo experimental conditions, as shown in Figure 9. Using this experimental system configuration, the lifetime of the Ps can be measured using the PALS measurement system. Through this, it is possible to detect photoconverted Ps through an axicon lens in the electromagnetic mmW resonance state.
As mentioned previously, PALS is the most widely used method for analyzing nanostructured materials using positrons. The basic principle was to tag the positrons entering the sample under study to define the start time of the measurement. The stop signal is given by the detection of a γ-ray photon emitted when the positron is annihilated together with the electron, which shows the distribution of the number of annihilated positrons over time, as shown in Figure 10. Because of the distinct timescale of the physical mechanism responsible for positron annihilation, information about the environment in which this occurs can be extracted from Figure 10. Because each process has a specific lifetime, the measured time distribution is complexly correlated with the sum of several exponential components and detector resolutions of up to 100 ps. It is important to use a fitting program to extract the strength and longevity of the various components.
In the lower part of Figure 10, the shortest lifetime during the 125 ps period is when positrons combine with electrons with opposite spins within a few picoseconds after degradation (loss of energy) through ionization or inelastic scattering to form a hydrogen-like atom called p-Ps. The second shortest lifetime is due to the direct annihilation of the material with electrons and does not involve the formation of bond states.
In the presence of atomic defects, the lifetime of the direct annihilation of positrons is different from the lifetime of positrons in the bulk form, which can be used to recognize the concentration of positrons and the structural bond type. It can be seen that μ-oPs (micro-ortho-positronium) and μεσος-oPs (meso-ortho-positronium) in the intermediate process were observed at the level of 10 ps and 100 ps, respectively. The longest lifetime observed was from 100 ps to 30 ns, where positrons combined with electrons in the same spin direction form a triplet spin state, out-ortho-positronium (out-oPs), which is comparable to that of p-Ps. Owing to its much longer lifetime (142 ns in vacuum), o-Ps exposed to air can diffuse omnidirectionally in vivo. Here, the so-called pick-off effect can occur when positrons are annihilated because of their interaction with electrons of opposite spins at the pore surface rather than where they are bound. The effect may be to shorten the lifetime of o-Ps related to the pore size and topology, in the case of spherical pores, an excited state that confines the particle to an infinite potential well, based on the Tao–Eldrup (TE model) and its rectangular extension. Therefore, the lifetime of out-oPs, which disappears in the nanostructured material, is in the range of 1–142 ns, the typical micropore value is 1–10 ns, and the value related to the mesopore ranges from 10 to 100 ns. The size-related extinction of each component in a biomolecule containing pores of a unique size is shown in the form of an exponential function in the time-dependent spectrum in Figure 10. Positrons generated in pore 22Na can diffuse during o-Ps generation and have a characteristic lifetime of 142 ns (if the experiment is in a vacuum). The amount of out-oPs escaping from the biological surface can be inferred to correlate with the pore structure, which influences the catalytic process. Based on these experimental results, from the results of Equation (6) and Figure 7, together with the characteristic lifetime of 142 ns, it is possible to induce the time-delay effect of the imaging implementation under the resonance frequency condition within the range of approximately 203 GHz.

4. Discussion

One of the biggest challenges in diagnostic medicine is the early recognition of diseases and the precise location of its cause. The study of mmW-photoconverted Ps supplemented with PET is expected to solve this problem by enabling the detection of cancers at an early stage of development prior to any morphological changes. The mmW-photoconverted Ps generation technology is a novel method that combines PALS and PET technologies into one tomography system to enable the in vivo imaging of positron properties. In addition, PALS has recently been applied to investigate differences in free volume pores at the sub-nanometer scale to detect cancer at various stages. The technology of mmW-photoconverted Ps generation combining PALS and PET in clinical use should be able to determine positron parameters in a position-sensitive manner and should be extended to work on living organisms. Comparing the characteristics of Ps in cancer and normal tissues through in vivo photoconversion, the average lifespan of o-Ps is correlated with the occurrence of metabolic disorders in cancer cells. To quantify this correlation more accurately, it is important that future studies demonstrate a correlation with oxygen concentration. Normally, cancer cells become hypoxic during the proliferation process, and as hypoxic cancer cells survive in an oxygen-deficient environment, their malignancy increases.
In the future, experimental studies using cell cultures grown in vitro that can classify the degree of malignancy according to cancer cell proliferation are needed. To reach clinically useful conclusions, multidisciplinary joint research efforts are needed to distinguish between normal and cancerous tissues through photoconversion and imaging processes based on Ps generation. The dependence of the o-Ps lifespan on bioactive molecules, such as whether the lifetime of Ps as a function of the accumulation of Ps in vivo depends on the type of cancer, and on the grade of malignancy for a given cancer type, should be experimentally confirmed in vivo, and the development of a more precise mmW photoconversion device with a Ps imaging function is required. Future research will investigate three-dimensional organoid and spheroid samples corresponding to the typical positron range emitted from β+ isotopes commonly available in laboratories, such as 22Na, by photonics via electromagnetic mmW resonance of the Ps. This is a simple and fast imaging analysis method based on the physical properties of the transformation.

5. Conclusions

Experimental research on imaging technology through photoconversion technology under resonance conditions using electromagnetic mmW in the Ps state, which is an unstable material created by the temporary bonding of positrons and electrons, is discussed in this paper. Ps can be observed when an unstable separate state remains even after the annihilation of electron and positron pairs in the PET process.
In this study, instead of PET imaging equipment, which is widely used in nuclear medicine, mmW and Cherenkov radiation (CR) were generated using the ponderomotive force principle in the plasma wakefield state, and electrons and positrons were generated simultaneously using a relativistic electron beam without using a PET device. We attempted to confirm the possibility of Ps photoconversion technology under electromagnetic mmW resonance conditions through experimental research where an unstable state is created and positrons occur simultaneously. Here, a relativistic electron beam energy of 0.5 ~ MeV was used, and the mmW frequency was in the G-band. A three-stepped axicon lens with a mode conversion function of electromagnetic mmW was used to apply optical conversion technology. Thus, it was possible to confirm light emission in the form of a light-converted Bessel beam.
The lifetime of Ps was measured using PALS. The exposure time of the mmW photoconverted BALB/c nu/nu through a three-step axicon lens was 30 ns, and the lifespan of Ps was determined by data cleaning using the PALS technique during the irradiation period. The results were obtained over time. The lifetime of mmW-photoconverted Ps is in five stages: para-Ps, direct annihilation with electrons, μ-oPs, μεσος-oPs, and out-oPs. It was found that it takes 125 ps until the previous four steps, and can exist up to 142 ns, which exceeds 30 ns of the maximum irradiation time in the last out-oPs step. Even if the exposure time is 30 ns, in the last stage of out-oPs, due to the mmW photoconversion mode, it is locally distributed to the decay mode of the evanescent wave mode (EM) state of the out-oPs, and 30 ns also exists for a certain amount of time. The light conversion at 203.389 GHz, which is the resonant frequency region of mmW, can be interpreted as a light wave that substantially does not involve energy because it decays exponentially depending on the distance from the interface of the locally distributed out-oPs. This is a common phenomenon in physics related to the exposure to electromagnetic mmW. This can be compared to the phenomenon of surface plasmons, which behave like quasiparticles, where the collective vibrations of electrons at the interface between the dielectric and metal are considered as particles: out-oPs is a metastable quasiparticle state. From the results of Equation (6), Figure 7, and Figure 10 it is possible to temporally level up the imaging time of 1.1 to 1.2 μs, which is longer than 142 ns, under the resonance frequency condition within the range of about 203 GHz.

Author Contributions

Conceptualization, S.-H.M.; methodology, S.-H.M. and C.P.; software, S.-H.M. and C.P.; validation, K.C.L. and Y.J.L.; formal analysis, S.-H.M., C.P., and M.S.; investigation, S.-H.M. and C.P.; resources, S.-H.M., M.S., and D.H.; data curation, S.-H.M., C.P., K.C.L., and Y.J.L.; writing—original draft preparation, S.-H.M.; writing—review and editing, S.-H.M., C.P., M.S., S.K., and D.H.; visualization, S.-H.M.; supervision, S.-H.M. and G.-S.P.; project administration, S.-H.M. and G.-S.P.; funding acquisition, S.-H.M. and G.-S.P. All authors have read and agreed to the published version of the manuscript.

Funding

This work was supported by the National Research Foundation of Korea (NRF) grant funded by the Korean government (MSIT) (No. NRF–2021M2E8A1038938, 2021R1F1A1048374, and 2016R1A3B1908336). This study was also supported by a grant of the Korea Institute of Radiological and Medical Sciences (KIRAMS), funded by the Ministry of Science and ICT (MSIT), Republic of Korea (No. 50051-2022, 50623-2022).

Institutional Review Board Statement

Not applicable.

Informed Consent Statement

Not applicable.

Data Availability Statement

The data that support the findings of this study are available from the corresponding author upon reasonable request.

Conflicts of Interest

The authors declare no conflict of interest.

References

  1. Brawley, S.J.; Armitage, S.; Beale, J.; Leslie, D.E.; Williams, A.I.; Laricchia, G. Electron–Like Scattering of Positronium. Science 2016, 330, 789. [Google Scholar] [CrossRef] [PubMed]
  2. Kaminska, D.; Gajos, A.; Czerwinski, E.; Alfs, D.; Bednarski, T.; Białas, P.; Curceanu, C.; Dulski, K.; Głowacz, B.; Gupta–Sharma, N.; et al. A feasibility study of ortho–positronium decays measurement with the J–PET scanner based on plastic scintillators. Eur. Phys. J. C 2016, 76, 445. [Google Scholar] [CrossRef] [PubMed] [Green Version]
  3. Miyazaki, A. Direct Measurement of the Hyperfine Structure Interval of Positronium Using High–Power Millimeter Wave Technology; Springer: Tokyo, Japan, 2015. [Google Scholar]
  4. Mohammed, M.; Białas, P.; Curceanu, C.; Czerwiński, E.; Dulski, K.; Gajos, A.; Głowacz, B.; Gorgol, M.; Hiesmayr, B.; Jasińska, B.; et al. A Method to Produce Linearly Polarized Positrons and Positronium Atoms with the J-PET Detector. Acta Phys. Pol. A. 2017, 132, 1486–1489. [Google Scholar] [CrossRef]
  5. Hugenschmidt, C. Positrons insurfacephysics. Surf. Sci. Rep. 2016, 71, 547–594. [Google Scholar] [CrossRef] [Green Version]
  6. Cassidy, D.B.; Mills, A.P., Jr. The production of molecular positronium. Nature 2007, 449, 195–197. [Google Scholar] [CrossRef] [PubMed]
  7. Moskal, P.; Jasińska, B.; Stępień, E.Ł.; Bass, S.D. Positronium in medicine and biology. Nat. Rev. Phys. 2019, 1, 527–529. [Google Scholar] [CrossRef]
  8. Jung, K.O.; Kim, T.J.; Yu, J.H.; Rhee, S.; Zhao, W.; Ha, B.; Red-Horse, K.; Gambhir, S.S.; Pratx, G. Whole–body tracking of single cells via positron emission tomography. Nat. Biomed. Eng. 2020, 4, 835–844. [Google Scholar] [CrossRef]
  9. Moskal, P.; Kisielewska, D.; Curceanu, C.; Czerwiński, E.; Dulski, K.; Gajos, A.; Gorgol, M.; Hiesmayr, B.; Jasińska, B.; Kacprzak, K.; et al. Feasibility study of the positronium imaging with the J–PET tomograph. Phys. Med. Biol. 2019, 64, 055017. [Google Scholar] [CrossRef]
  10. Moskal, P. Towards Total–Body Modular PET for Positronium and Quantum Entanglement Imaging. In Proceedings of the 2018 IEEE Nuclear Science Symposium and Medical Imaging Conference Proceedings (NSS/MIC), Sydney, Australia, 10–17 November 2018. [Google Scholar]
  11. Shaffer, T.M.; Pratt, E.C.; Grimm, J. Utilizing the power of Cerenkov light with nanotechnology. Nat. Nanotechnol. 2017, 12, 106–117. [Google Scholar] [CrossRef]
  12. Miyazaki, A.; Yamazaki, T.; Suehara, T.; Namba, T.; Asai, S.; Kobayashi, T.; Saito, H.; Tatematsu, Y.; Ogawa, I.; Idehara, T. sub–THz direct spectroscopy of positronium hyperfine splitting. J. Phys. Conf. Ser. 2013, 443, 012002. [Google Scholar] [CrossRef]
  13. Miyazaki, A.; Yamazaki, T.; Suehara, T.; Namba, T.; Asai, T.; Kobayashi, T.; Saito, H.; Idehara, T.; Ogawa, I.; Tatematsu, Y. The Direct Spectroscopy of Positronium Hyperfine Structure Using a Sub–THz Gyrotron. J. Infrared. Milli. Terahz. Waves 2014, 35, 91–100. [Google Scholar] [CrossRef] [Green Version]
  14. Planchon, T.A.; Gao, L.; Milkie, D.E.; Davidson, M.W.; Galbraith, J.A.; Galbraith, C.G.; Betzig, E. Rapid three–dimensional isotropic imaging of living cells using Bessel beam plane illumination. Nat. Methods 2011, 8, 417–426. [Google Scholar] [CrossRef] [Green Version]
  15. Duocastella, M.; Arnold, C.B. Bessel and annular beams for materials processing. Laser Photonics Rev. 2012, 6, 5. [Google Scholar] [CrossRef]
  16. Mosk, A.P.; Lagendijk, A.; Lerosey, G.; Fink, M. Controlling waves in space and time for imaging and focusing in complex media. Nat. Photonics 2012, 6, 283–292. [Google Scholar] [CrossRef] [Green Version]
  17. Zhu, X.L.; Yu, T.P.; Sheng, Z.M.; Yin, Y.; Turcu, I.C.E.; Pukhov, A. Dense GeV electron–positron pairs generated by lasers in near–critical–density plasmas. Nat. Commun. 2016, 7, 13686. [Google Scholar] [CrossRef] [Green Version]
  18. Ni, J.; Wang, C.; Zhang, C.; Hu, Y.; Yang, L.; Lao, Z.; Xu, B.; Li, J.; Wu, D.; Chu, J. Three–dimensional chiral microstructures fabricated by structured optical vortices in isotropic material. Light Sci. Appl. 2017, 6, e17011. [Google Scholar] [CrossRef] [Green Version]
  19. Wu, Z.; Wang, X.; Sun, W.; Feng, S.; Han, P.; Ye, J.; Zhang, Y. Vector characterization of zeroorder terahertz Bessel beams with linear and circular polarizations. Sci. Rep. 2017, 7, 13929. [Google Scholar] [CrossRef] [Green Version]
  20. Gu, Y.J.; Klimo, O.; Bulanov, S.V.; Weber, S. Brilliant gamma–ray beam and electron–positron pair production by enhanced attosecond pulses. Commun. Phys. 2018, 1, 93. [Google Scholar] [CrossRef] [Green Version]
  21. Vranic, M.; Klimo, O.; Korn, G.; Weber, S. Multi–GeV electron–positron beam generation from laser–electron scattering. Sci. Rep. 2018, 8, 4702. [Google Scholar] [CrossRef] [Green Version]
  22. Kulya, M.S.; Semenova, V.A.; Bespalov, V.G.; Petrov, N.V. On terahertz pulsed broadband Gauss–Bessel beam free–space propagation. Sci. Rep. 2018, 8, 1390. [Google Scholar] [CrossRef]
  23. Meng, Y.; Yi, J.; Burokur, S.N.; Kang, L.; Zhang, H.; Werner, D.H. Phase–modulation based transmitarray convergence lens for vortex wave carrying orbital angular momentum. Opt. Express 2018, 26, 17. [Google Scholar] [CrossRef]
  24. Gong, L.; Zhao, Q.; Zhang, H.; Hu, X.Y.; Huang, K.; Yang, J.M.; Li, Y.M. Optical orbital–angular–momentum multiplexed data transmission under high scattering. Light Sci. Appl. 2019, 8, 27. [Google Scholar] [CrossRef] [Green Version]
  25. Doche, A.; Beekman, C.; Corde, S.; Allen, J.M.; Clarke, C.I.; Frederico, J.; Gessner, S.J.; Green, S.Z.; Hogan, M.J.; O’Shea, B.; et al. Acceleration of a trailing positron bunch in a plasma wakefield accelerator. Sci. Rep. 2017, 7, 14180. [Google Scholar] [CrossRef] [Green Version]
  26. Min, S.H.; Kwon, O.; Sattorov, M. Effects on electronics exposed to high–power microwaves on the basis of a relativistic backward wave oscillator operating on the X–band. J. Electromagn. Waves Appl. 2017, 31, 1875–1901. [Google Scholar] [CrossRef]
  27. Naji, A.; Stupakov, G.; Huang, Z.; Bane, K. Field analysis for a highly overmoded iris line with application to THz radiation transport. Phys. Rev. Accel. 2022, 5, 043501. [Google Scholar] [CrossRef]
  28. Hummelt, J.S.; Jawla, S.; Kowalski, E.J.; Shapiro, M.A.; Temkin, R.J. Overmoded Traveling Wave Tubes for MM and THz Applications. In Proceedings of the 2015 40th International Conference on Infrared, Millimeter, and Terahertz Waves (IRMMW–THz), Hong Kong, China, 23–28 August 2015. [Google Scholar]
  29. Min, S.H.; Kwon, O.; Sattorov, M. Design study of gw–thz wave transmission without mode competition in an oversized relativistic backward wave oscillator. IEEE Trans. Plasma Sci. 2017, 45, 610–622. [Google Scholar] [CrossRef]
  30. Thompson, M.C.; Badakov, H.; Cook, A.M.; Rosenzweig, J.B.; Tikhoplav, R.; Travish, G.; Blumenfeld, I.; Hogan, M.J.; Ischebeck, R.; Kirby, N.; et al. Breakdown Limits on Gigavolt–per–Meter Electron–Beam–Driven Wakefields in Dielectric Structures. Phys. Rev. Lett. 2008, 100, 214801. [Google Scholar] [CrossRef] [PubMed] [Green Version]
  31. Cook, A.M.; Tikhoplav, R.; Tochitsky, S.Y.; Travish, G.; Williams, O.B.; Rosenzweig, J.B. Observation of Narrow–Band Terahertz Coherent Cherenkov Radiation from a Cylindrical Dielectric–Lined Waveguide. Phys. Rev. Lett. 2009, 103, 095003. [Google Scholar] [CrossRef] [PubMed] [Green Version]
  32. Foot, C.J. Atomic Physics, 1st ed.; Oxford University Press: Oxford, UK, New York, NY, USA, 2005. [Google Scholar]
  33. Itzykson, C.; Zuber, J.B. Quantum Field Theory, 1st ed.; Dover Publications, GF Books, Inc.: Hawthorne, CA, USA, 2006. [Google Scholar]
  34. Loudon, R. The Quantum Theory of Light, 3rd ed.; Oxford University Press, Oxford University Press Inc.: New York, NY, USA, 2001. [Google Scholar]
  35. Wilmink, G.J.; Grundt, J.E. Invited Review Article: Current State of Research on Biological Effects of Terahertz Radiation. J. Infrared Milli Terahz Waves 2011, 32, 1074–1122. [Google Scholar] [CrossRef] [Green Version]
  36. Rahman, A.; Rahmana, A.K.; Tomalia, D.A. Engineering dendrimers to produce dendrimer dipole excitation based terahertz radiation sources suitable for spectrometry, molecular and biomedical imaging. Nanoscale Horiz. 2017, 2, 127–134. [Google Scholar] [CrossRef]
  37. Luo, L.; Men, L.; Liu, Z.; Mudryk, Y.; Zhao, X.; Yao, Y.; Joong, M.; Park, J.M.; Shinar, R.; Shinar, J.; et al. Ultrafast terahertz snapshots of excitonic Rydberg states and electronic coherence in an organometal halide perovskite. Nat. Commun. 2016, 8, 15565. [Google Scholar] [CrossRef] [Green Version]
  38. Yamakawa, H.; Miyamoto, T.; Morimoto, T.; Takamura, N.; Liang, S.; Yoshimochi, H.; Terashige, T.; Kida, N.; Suda, M.; Yamamoto, H.M.; et al. Terahertz–field–induced polar charge order in electronic–type dielectrics. Nat. Commun. 2021, 12, 953. [Google Scholar]
  39. Mower, L. Decay theory of closely coupled unstable states. Phys. Rev. 1966, 142, 799. [Google Scholar] [CrossRef]
  40. Deutsch, M.; Brown, S.C. Zeeman effect and hyperfine splitting of positronium. Phys. Rev. 1952, 85, 1047. [Google Scholar] [CrossRef]
  41. Sasaki, Y.; Miyazaki, A.; Ishida, A.; Namba, T.; Asai, S.; Kobayashia, T.; Saitob, H.; Tanaka, K.; Yamamoto, A. Measurement of positronium hyperfine splitting with quantum oscillation. Phys. Lett. B 2011, 697, 121–126. [Google Scholar] [CrossRef] [Green Version]
  42. Cassidy, D.B.; Hisakado, T.H.; Tom, H.W.K.; Mills, A.P., Jr. Positronium hyperfine interval measured via saturated absorption spectroscopy. Phys. Rev. Lett. 2012, 109, 073401. [Google Scholar] [CrossRef] [Green Version]
  43. Ishida, A. New precise measurement of the hyperfine splitting of positronium. J. Phys. Chem. Ref. Data 2015, 44, 031212. [Google Scholar] [CrossRef]
  44. Kilburn, D.; Townrow, S.; Meunier, V.; Richardson, R.; Alam, A.; Ubbink, J. Organization and mobility of water in amorphous and crystalline trehalose. Nat. Mater. 2006, 5, 632–635. [Google Scholar] [CrossRef]
  45. Fong, C.; Dong, A.W.; Hill, A.J.; Boyd, B.J.; Drummond, C.J. Positron annihilation lifetime spectroscopy (PALS): A probe for molecular organisation in self–assembled biomimetic systems. Phys. Chem. Chem. Phys. 2015, 17, 17527–17540. [Google Scholar] [CrossRef]
  46. Shibuya, K.; Saito, H.; Nishikido, F.; Takahashi, M.; Taiga Yamaya, T. Oxygen sensing ability of positronium atom for tumor hypoxia imaging. Commun. Phys. 2020, 3, 173. [Google Scholar] [CrossRef]
  47. Mitchell, S.; Lars Gerchow, L.; Warringham, R.; Paolo Crivelli, P.; Javier Pérez–Ramírez, J. Shedding New Light on Nanostructured Catalysts with Positron Annihilation Spectroscopy. Small Methods 2018, 2, 1800268. [Google Scholar] [CrossRef]
Figure 1. Millimeter wave (mmW) plasma wakefield accelerator system generating hyperfine energy-level splitting of positronium (Ps): (a) 3D modeling for outline, (b) beam trajectory interacting with mmW, (c) distribution of the gradient potential with the beam bunched adjacent to the dielectric material caused by the ponderomotive force induced via the non-uniform electromagnetic field applied to the plasma, (d) wakefields generated on the surface of a polycarbonate dielectric under conditions where Cherenkov radiation occurs, (e) the dispersion relation of a mmW plasma dielectric wakefield source, and (f) fabricated circuit components and plasma dielectric wakefield accelerator system.
Electronics 11 03178 g001
Figure 2. Experimental setup for positronium (Ps) generation with the arrangement of gamma-ray detector using semiconductor components.
Electronics 11 03178 g002
Figure 3. The hyper-fine split of positronium (Ps).
Electronics 11 03178 g003
Figure 4. Transition probabilities for o-Ps(3γ) by using theoretical calculations according to (a) operating frequencies and (b) output powers.
Electronics 11 03178 g004
Figure 5. The splitting of Ps energy-levels under Zeeman effect.
Electronics 11 03178 g005
Figure 6. Three-stepped axicon lens.
Electronics 11 03178 g006
Figure 7. Detection for Ps with comparison of current results based on photocurrent measurement process by noise canceling circuit.
Electronics 11 03178 g007
Figure 8. Measured parameters in the plasma wakefield accelerator: (a) beam voltage, (b) beam current, (c) output power, (d) operating frequency (fast Fourier transform, FFT).
Electronics 11 03178 g008
Figure 9. Setup of PALS system in vivo (the positron lifetime of a single event can be measured by detecting the time difference between the birth γ-quantum of the β+-decay in the 22Na source and one of the annihilation γ-quanta of an energy of 511 keV).
Electronics 11 03178 g009
Figure 10. Lifetime of Ps in the air-saturated sample (a semilog histogram of the time lag between the start and stop signals from the air-saturated sample whose slope was fitted with a single exponential function (theoretical calculation) and a flat background (background) to determine the o-Ps lifetime; the detailed fit range was from 0.1 ns to 100 ps).
Electronics 11 03178 g010
Publisher’s Note: MDPI stays neutral with regard to jurisdictional claims in published maps and institutional affiliations.

