
A State of Art Review on Methodologies of Occupancy Estimating in Buildings from 2011 to 2021


Abstract
:1. Introduction
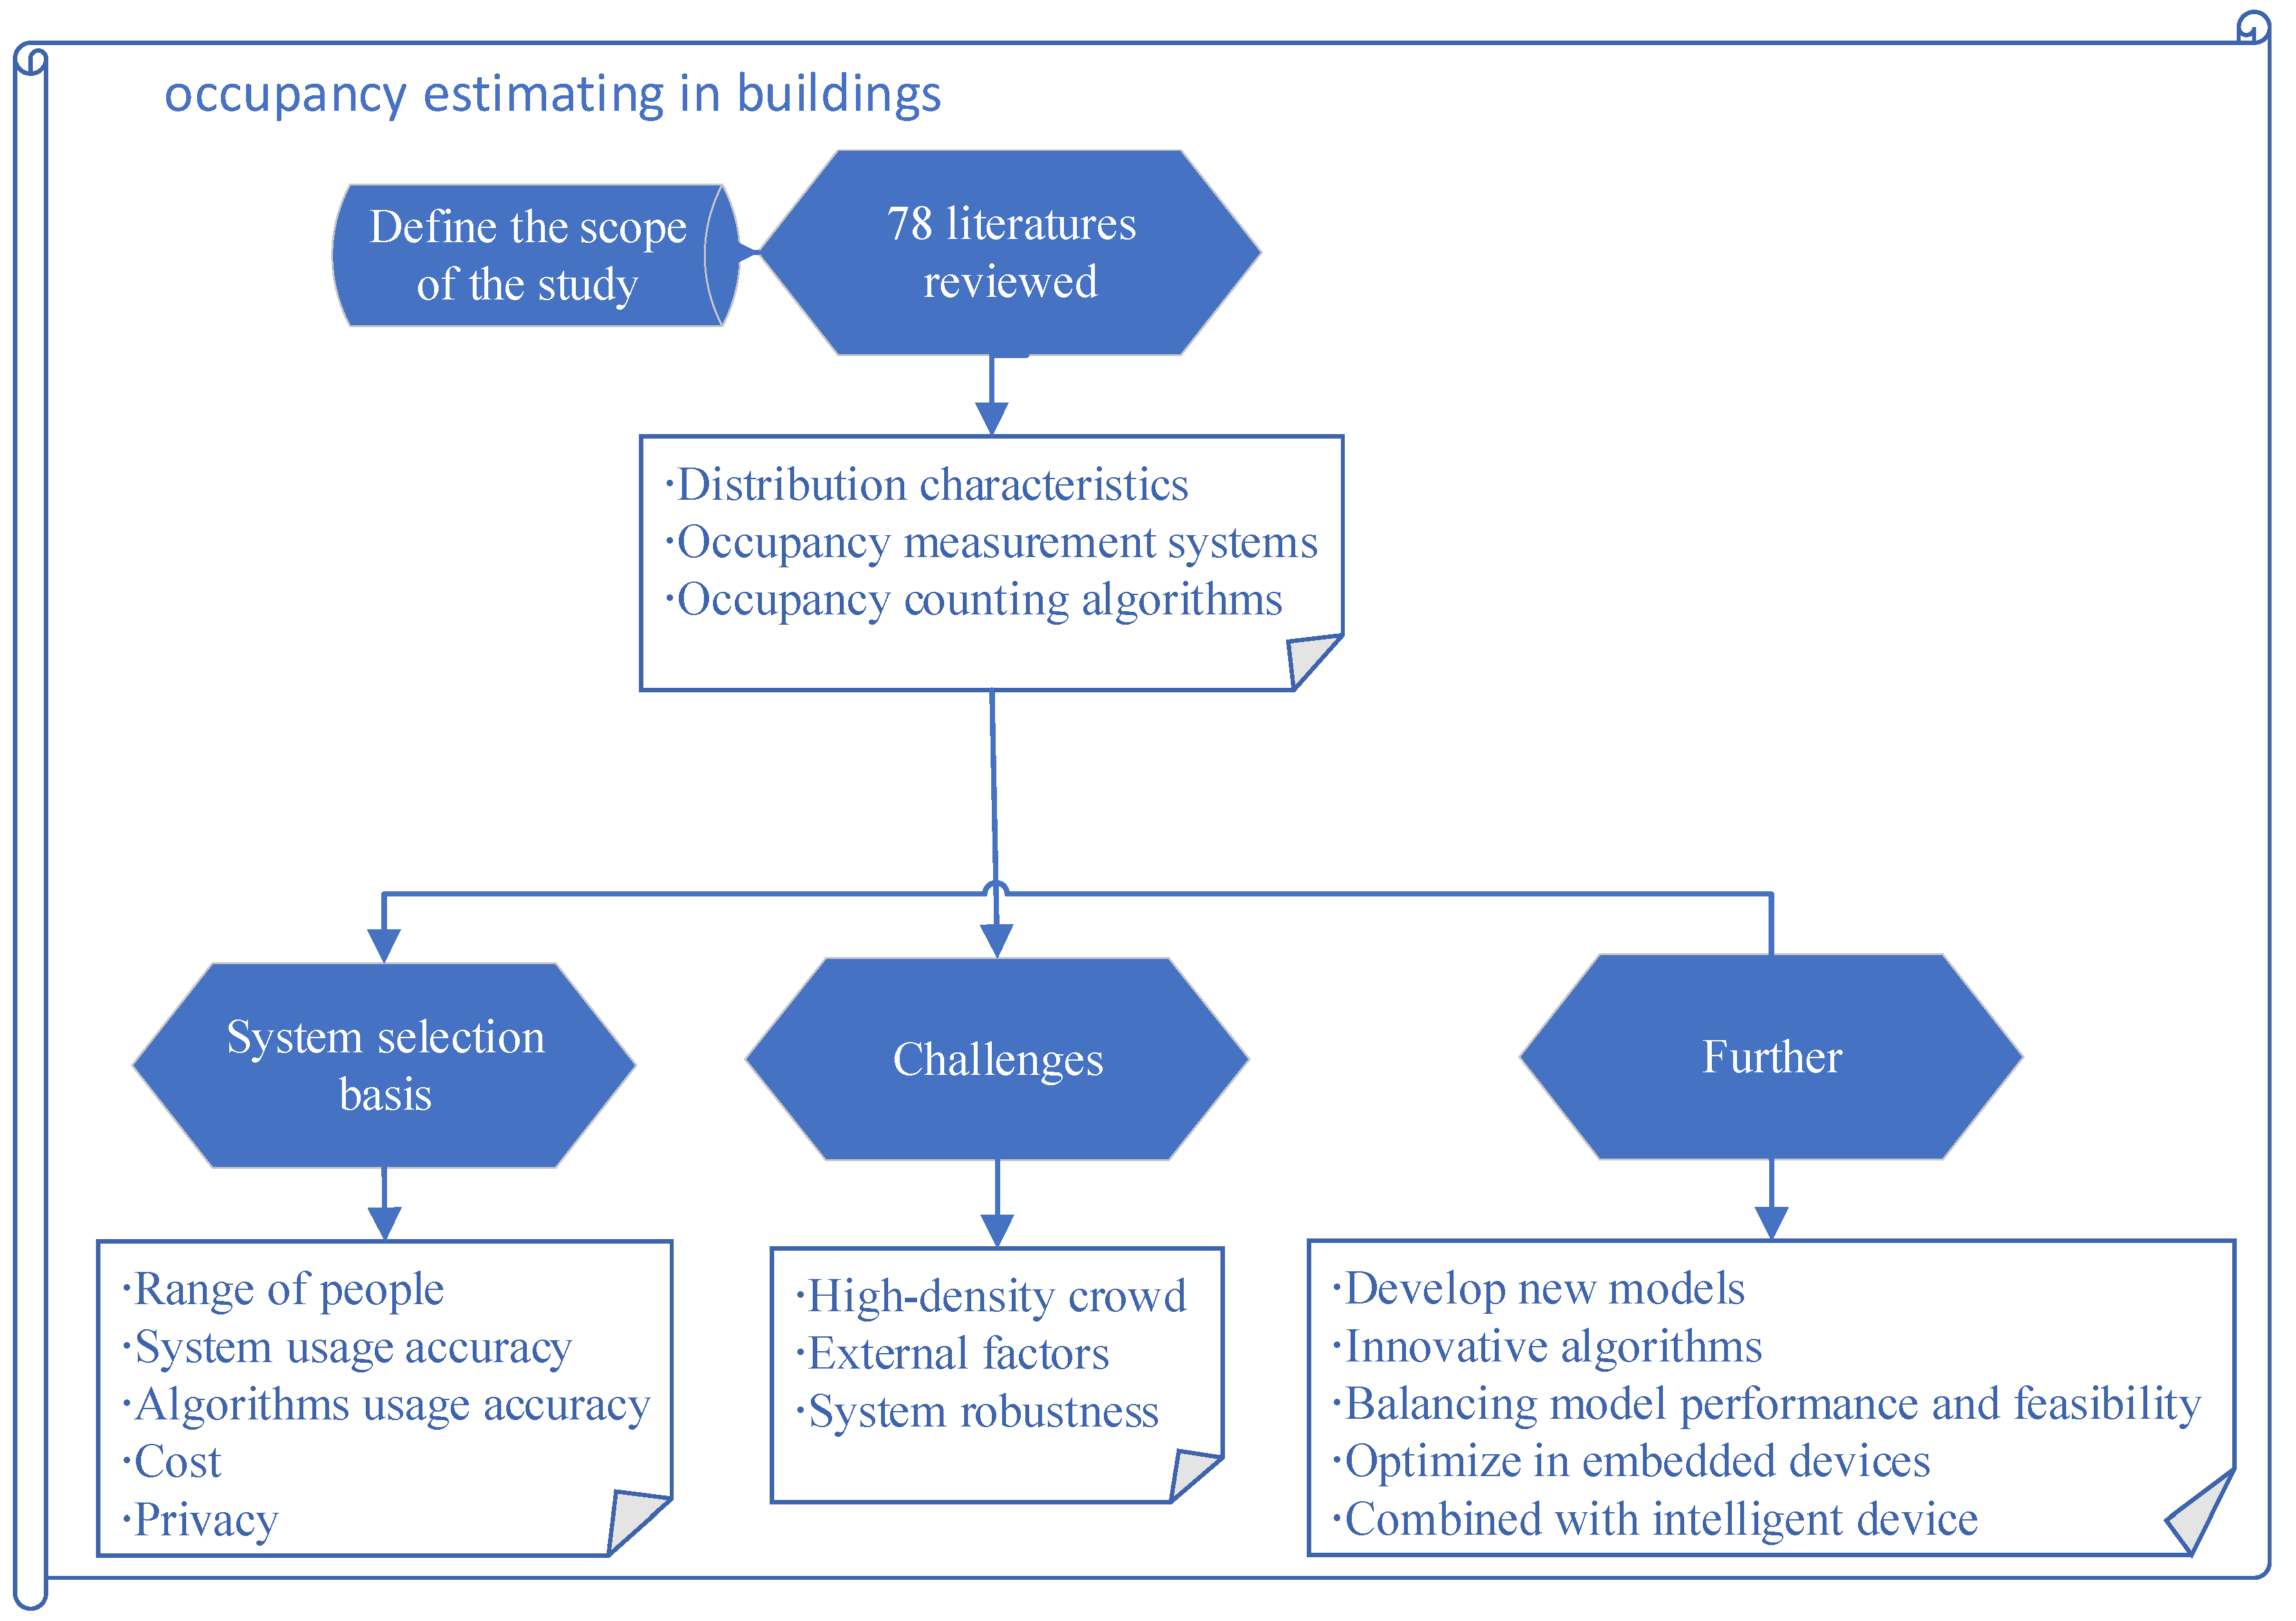
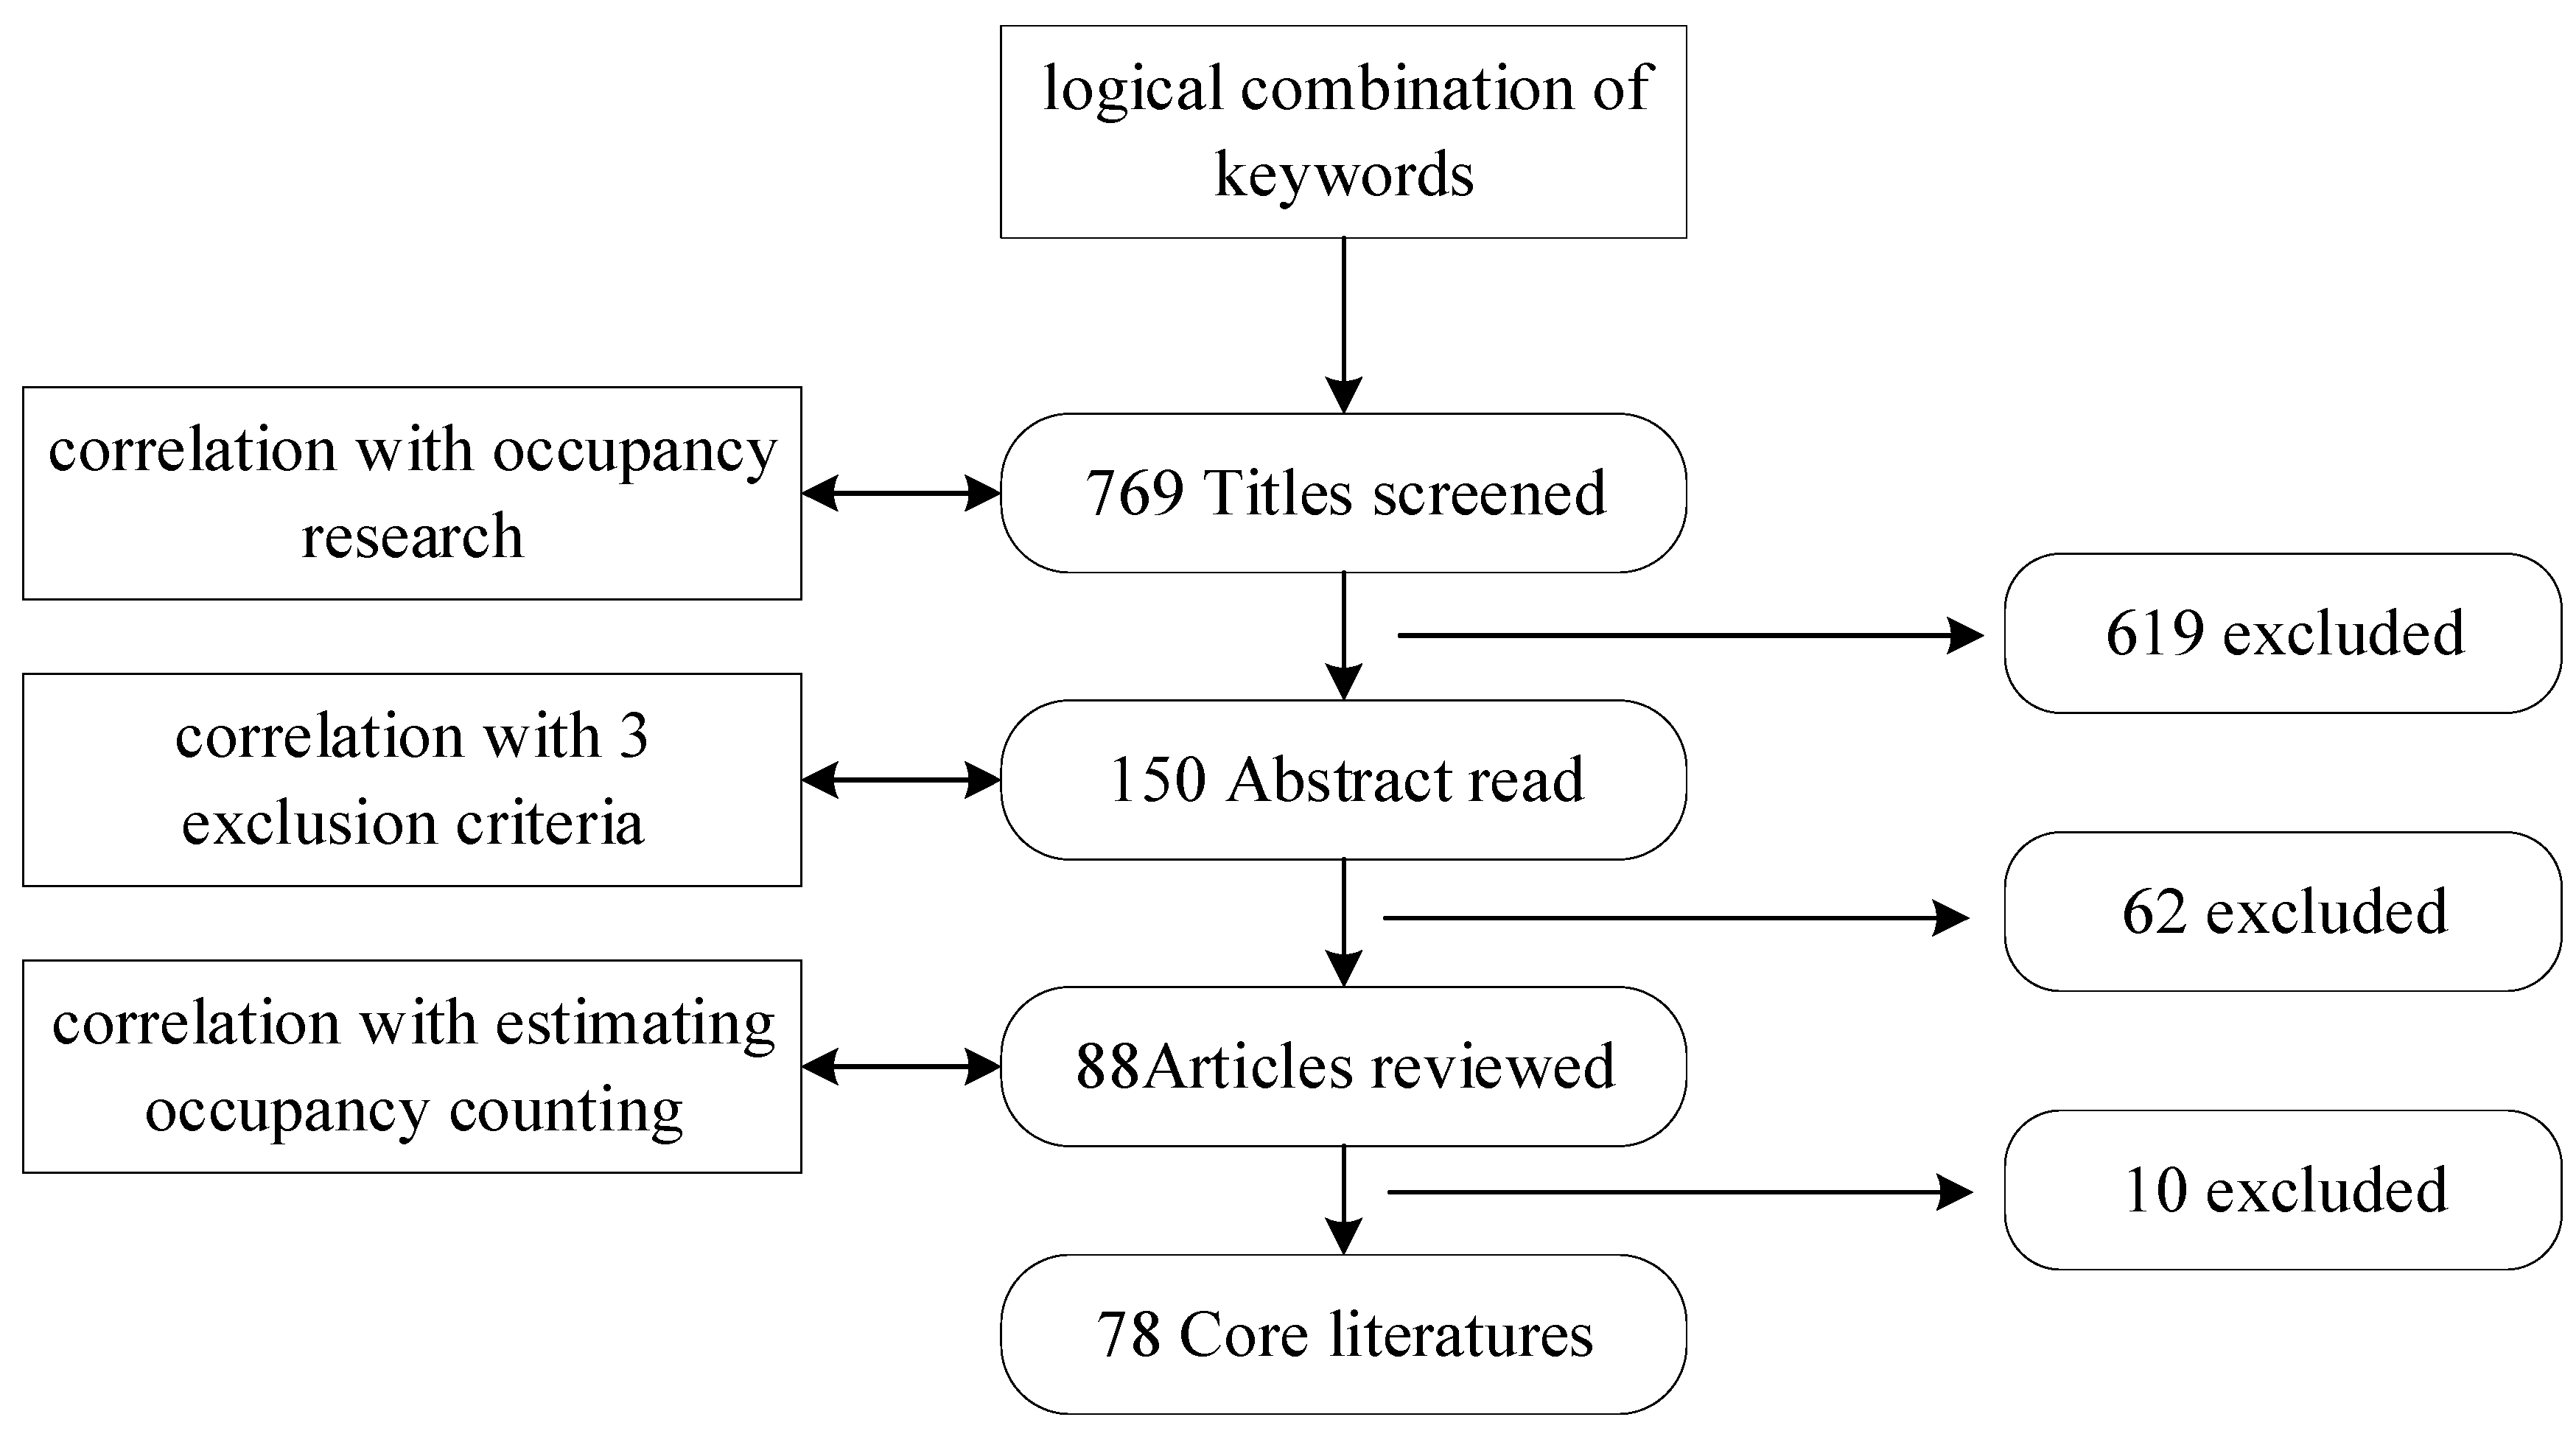
2. Methodology
3. Review Results
3.1. Distribution Characteristics
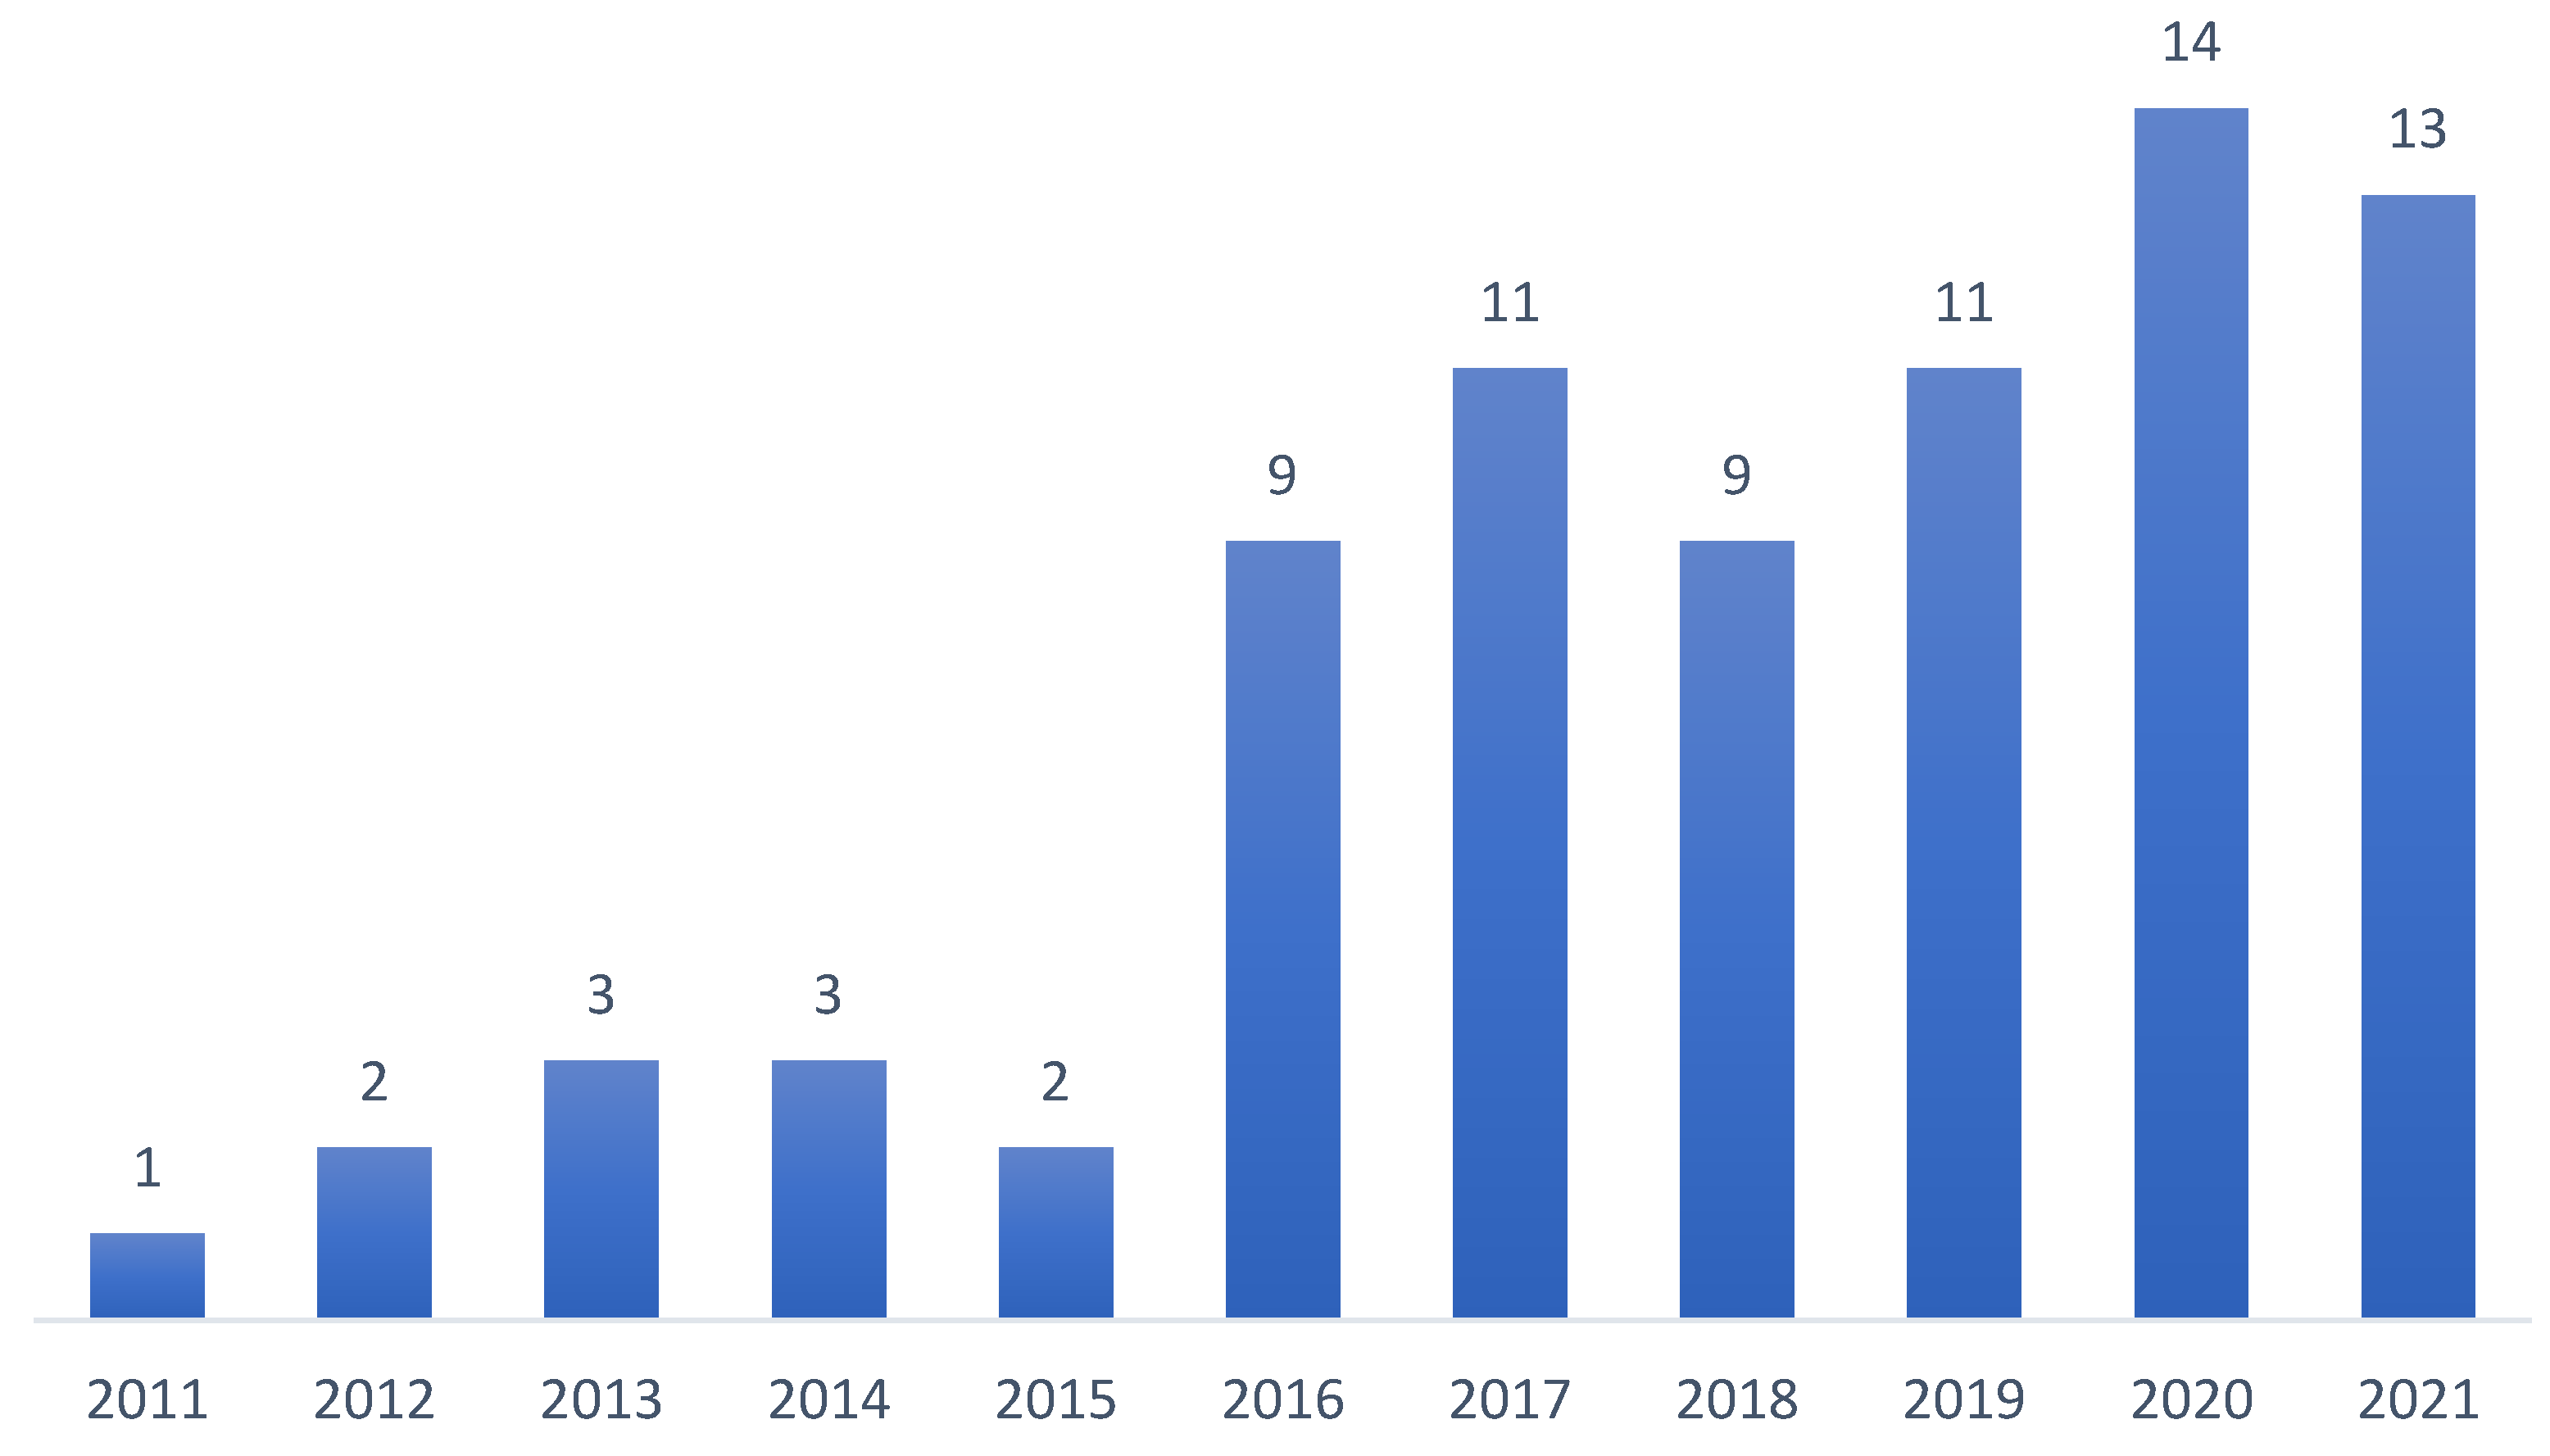
3.1.1. Distribution by Year of Publication
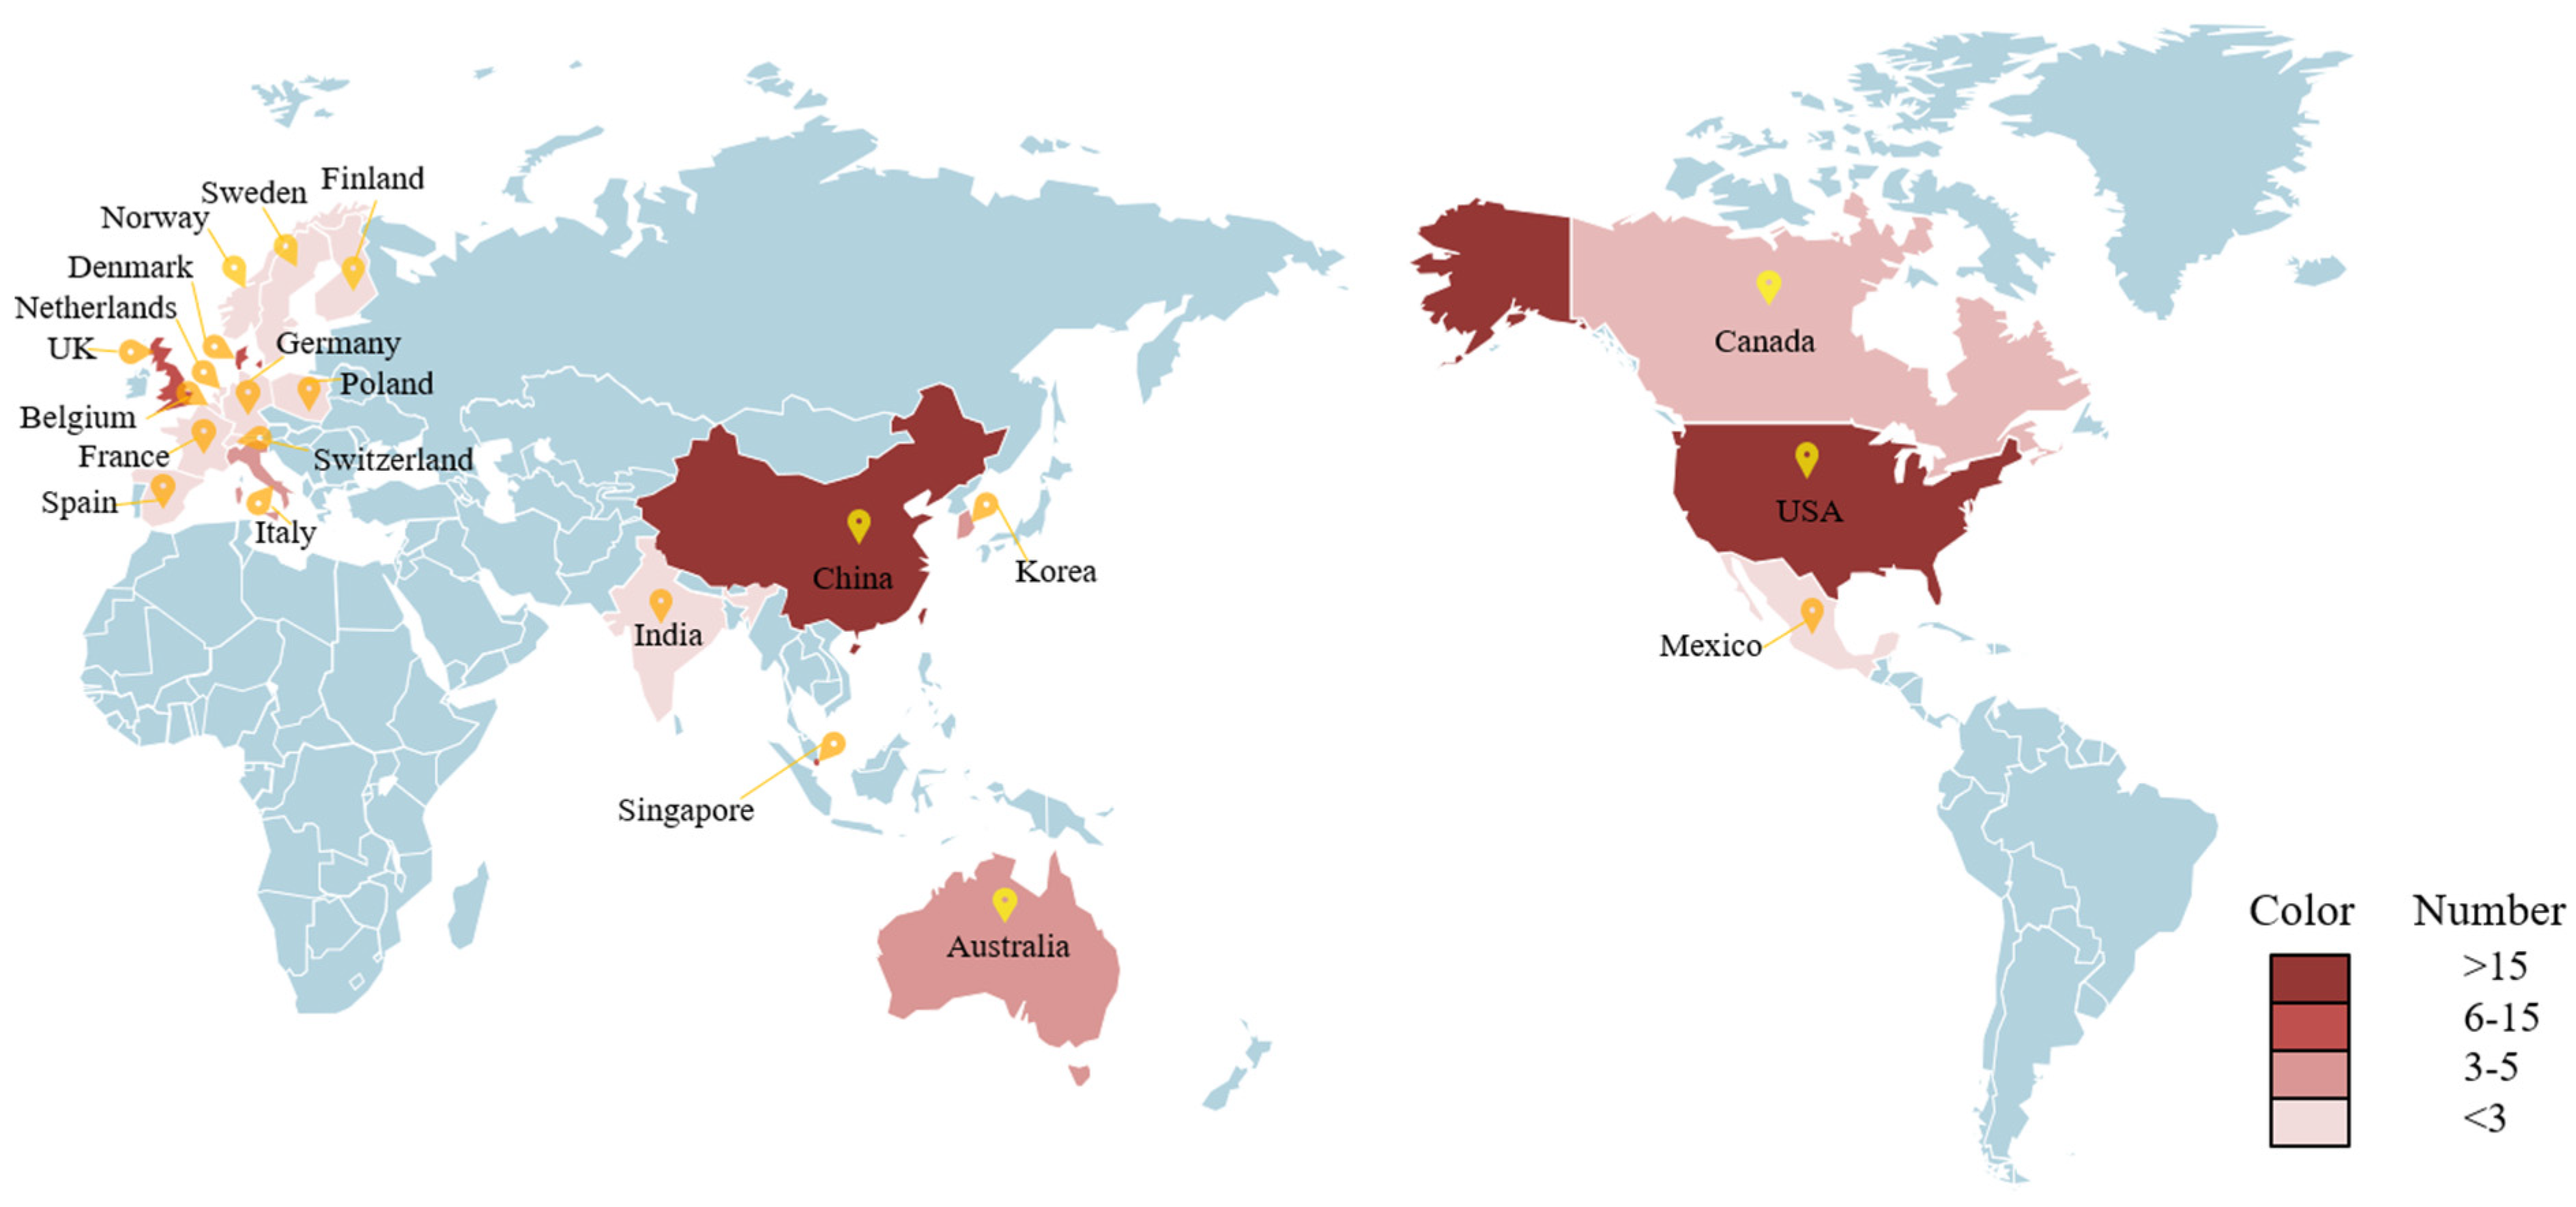
3.1.2. Distribution by Authors’ Nationality
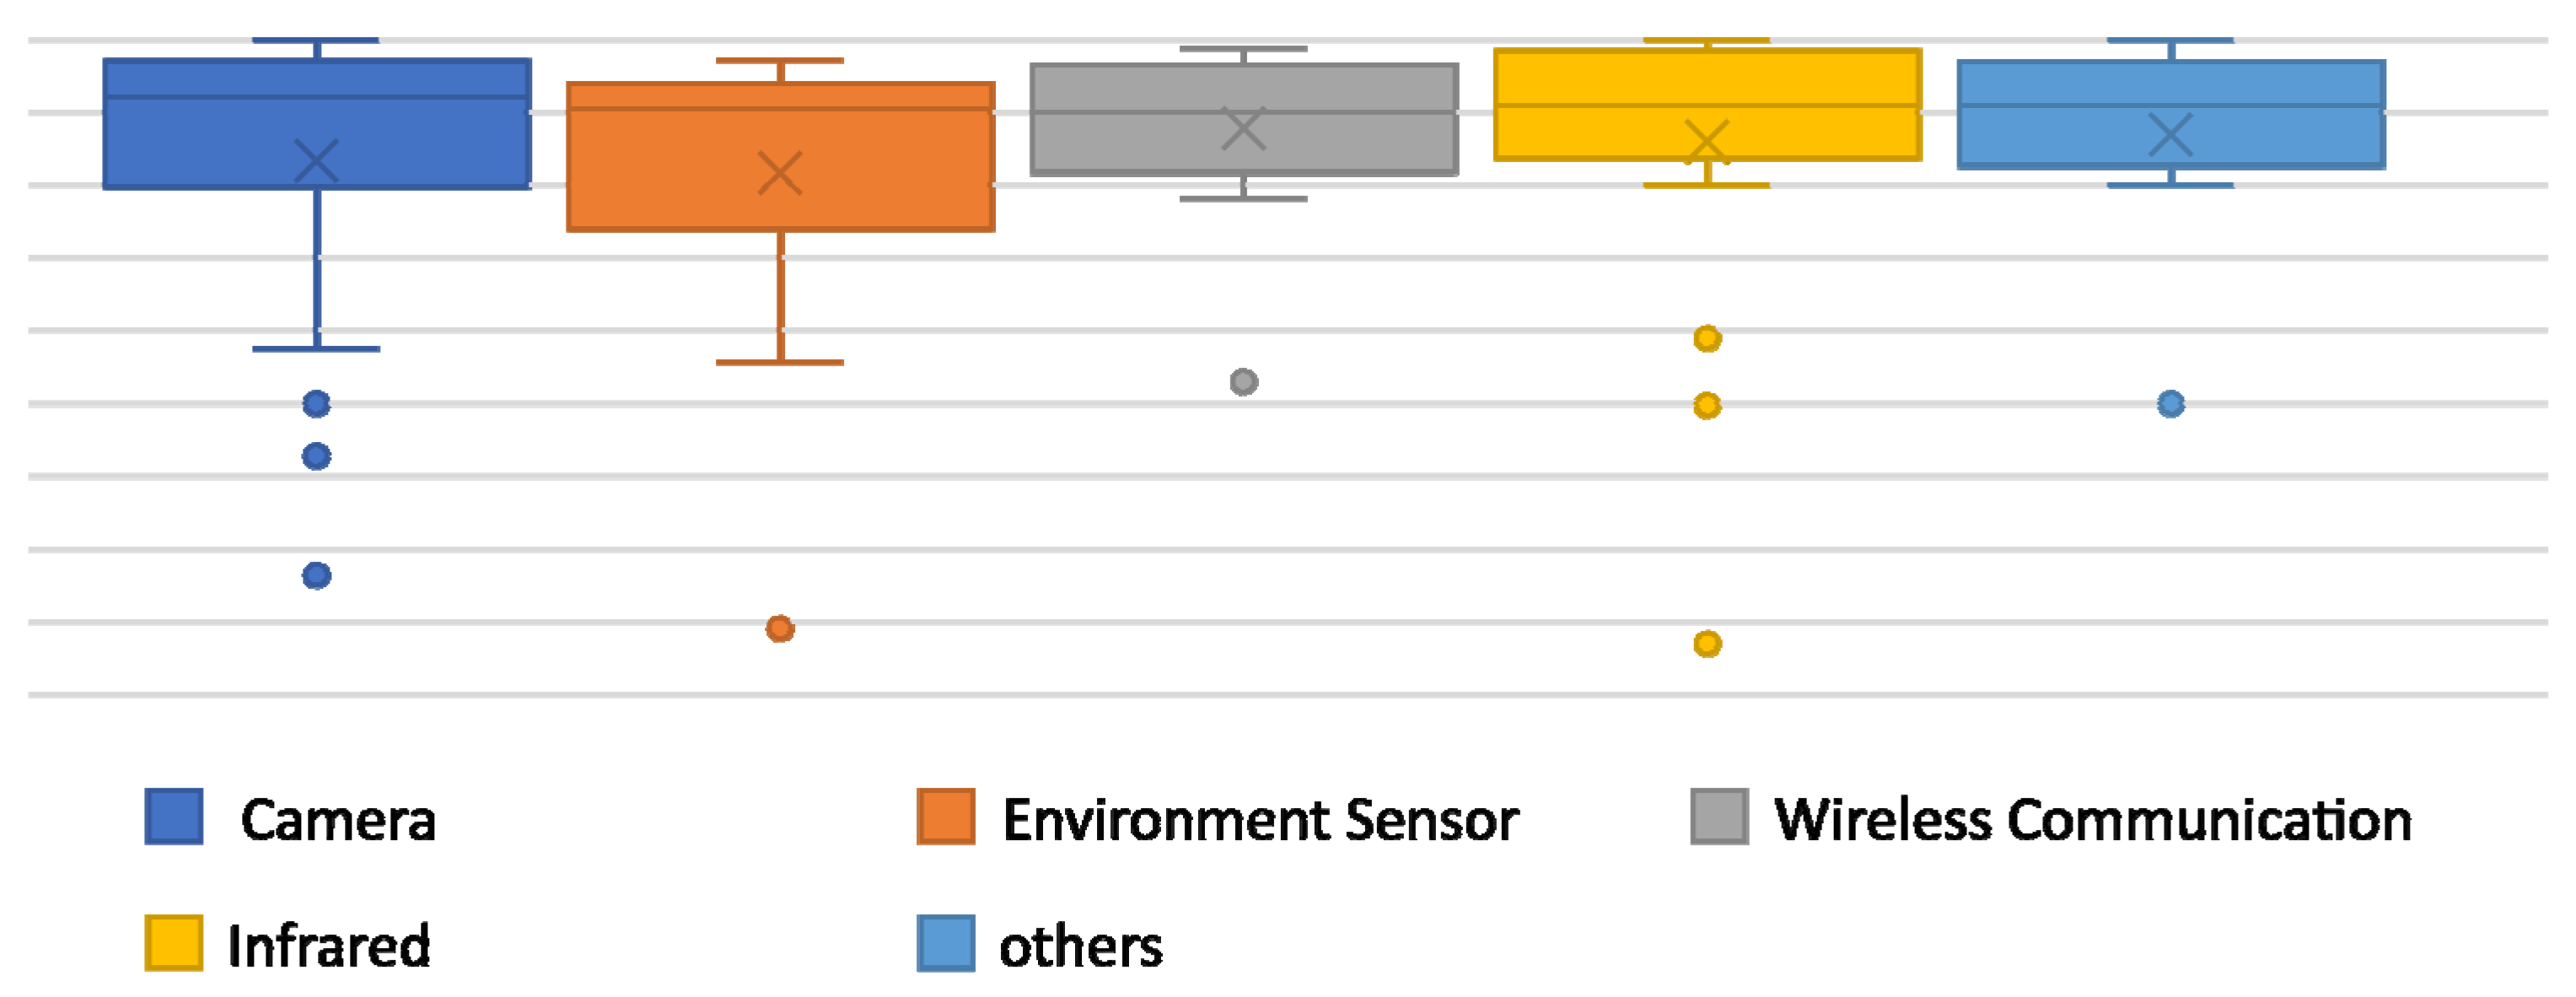
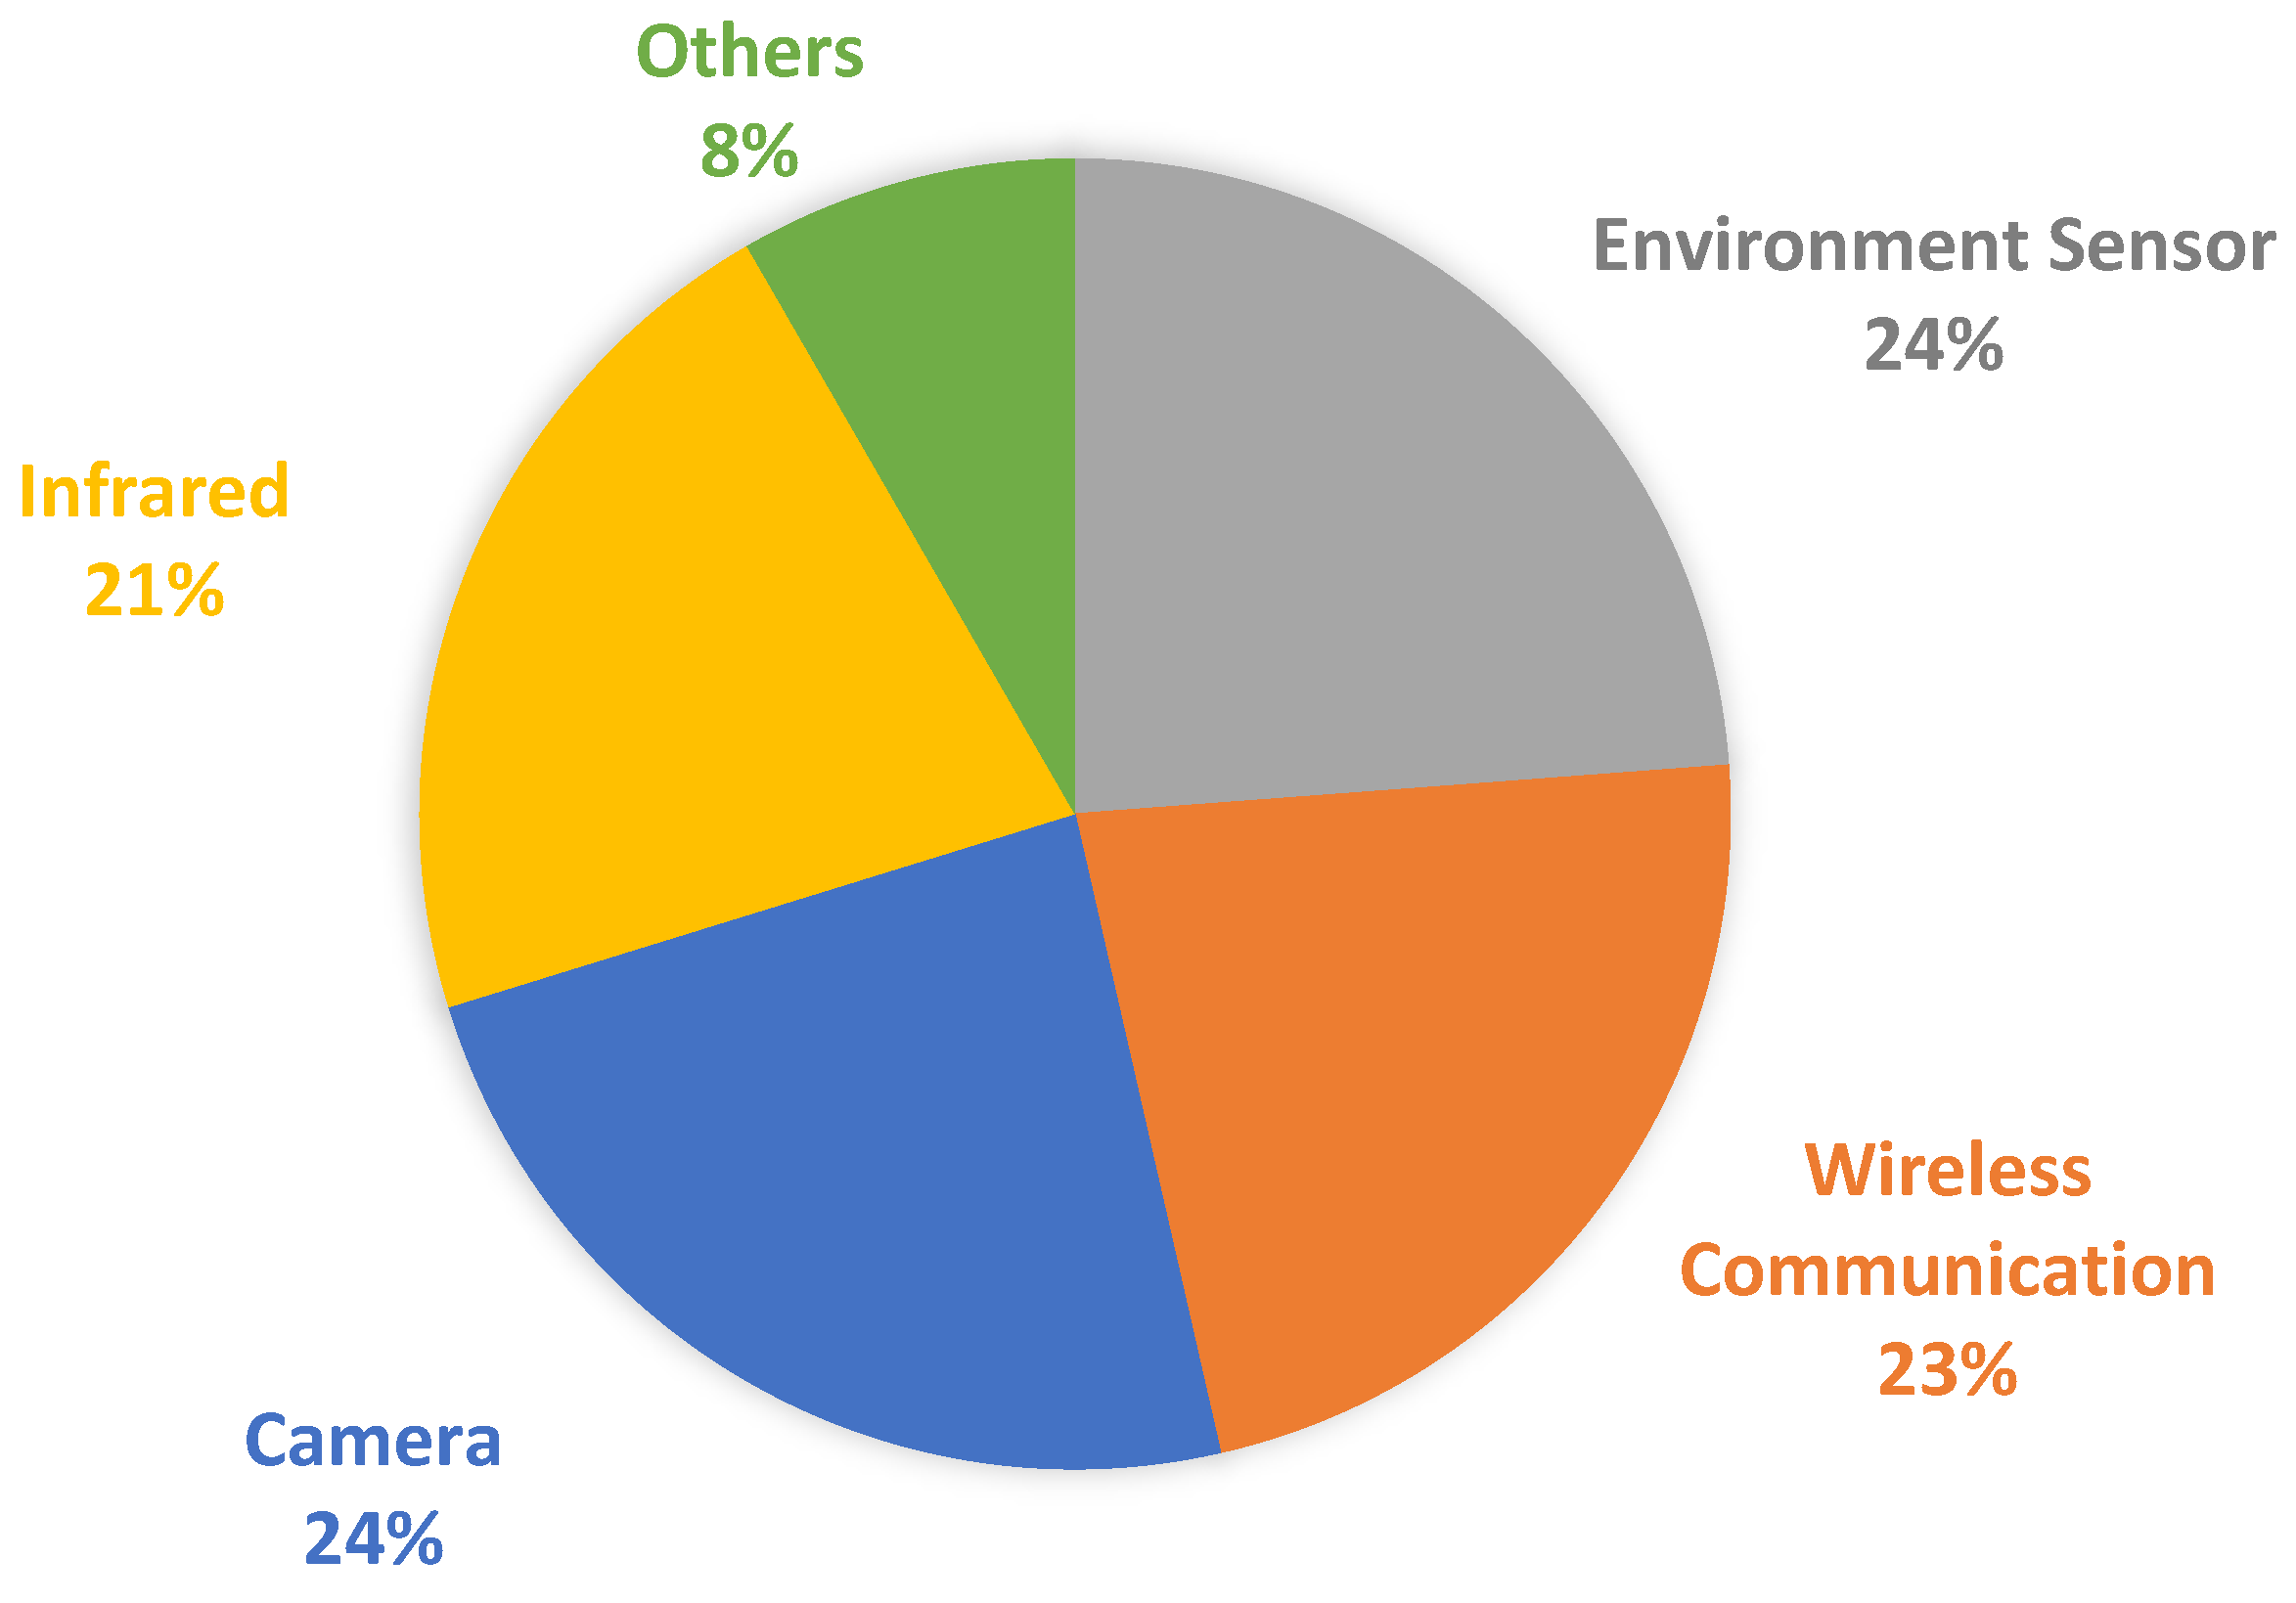
3.2. Review of Occupancy Measurement Systems
3.2.1. Camera
3.2.2. Environmental Sensors
3.2.3. Wireless Communication
3.2.4. Infrared
3.2.5. Others
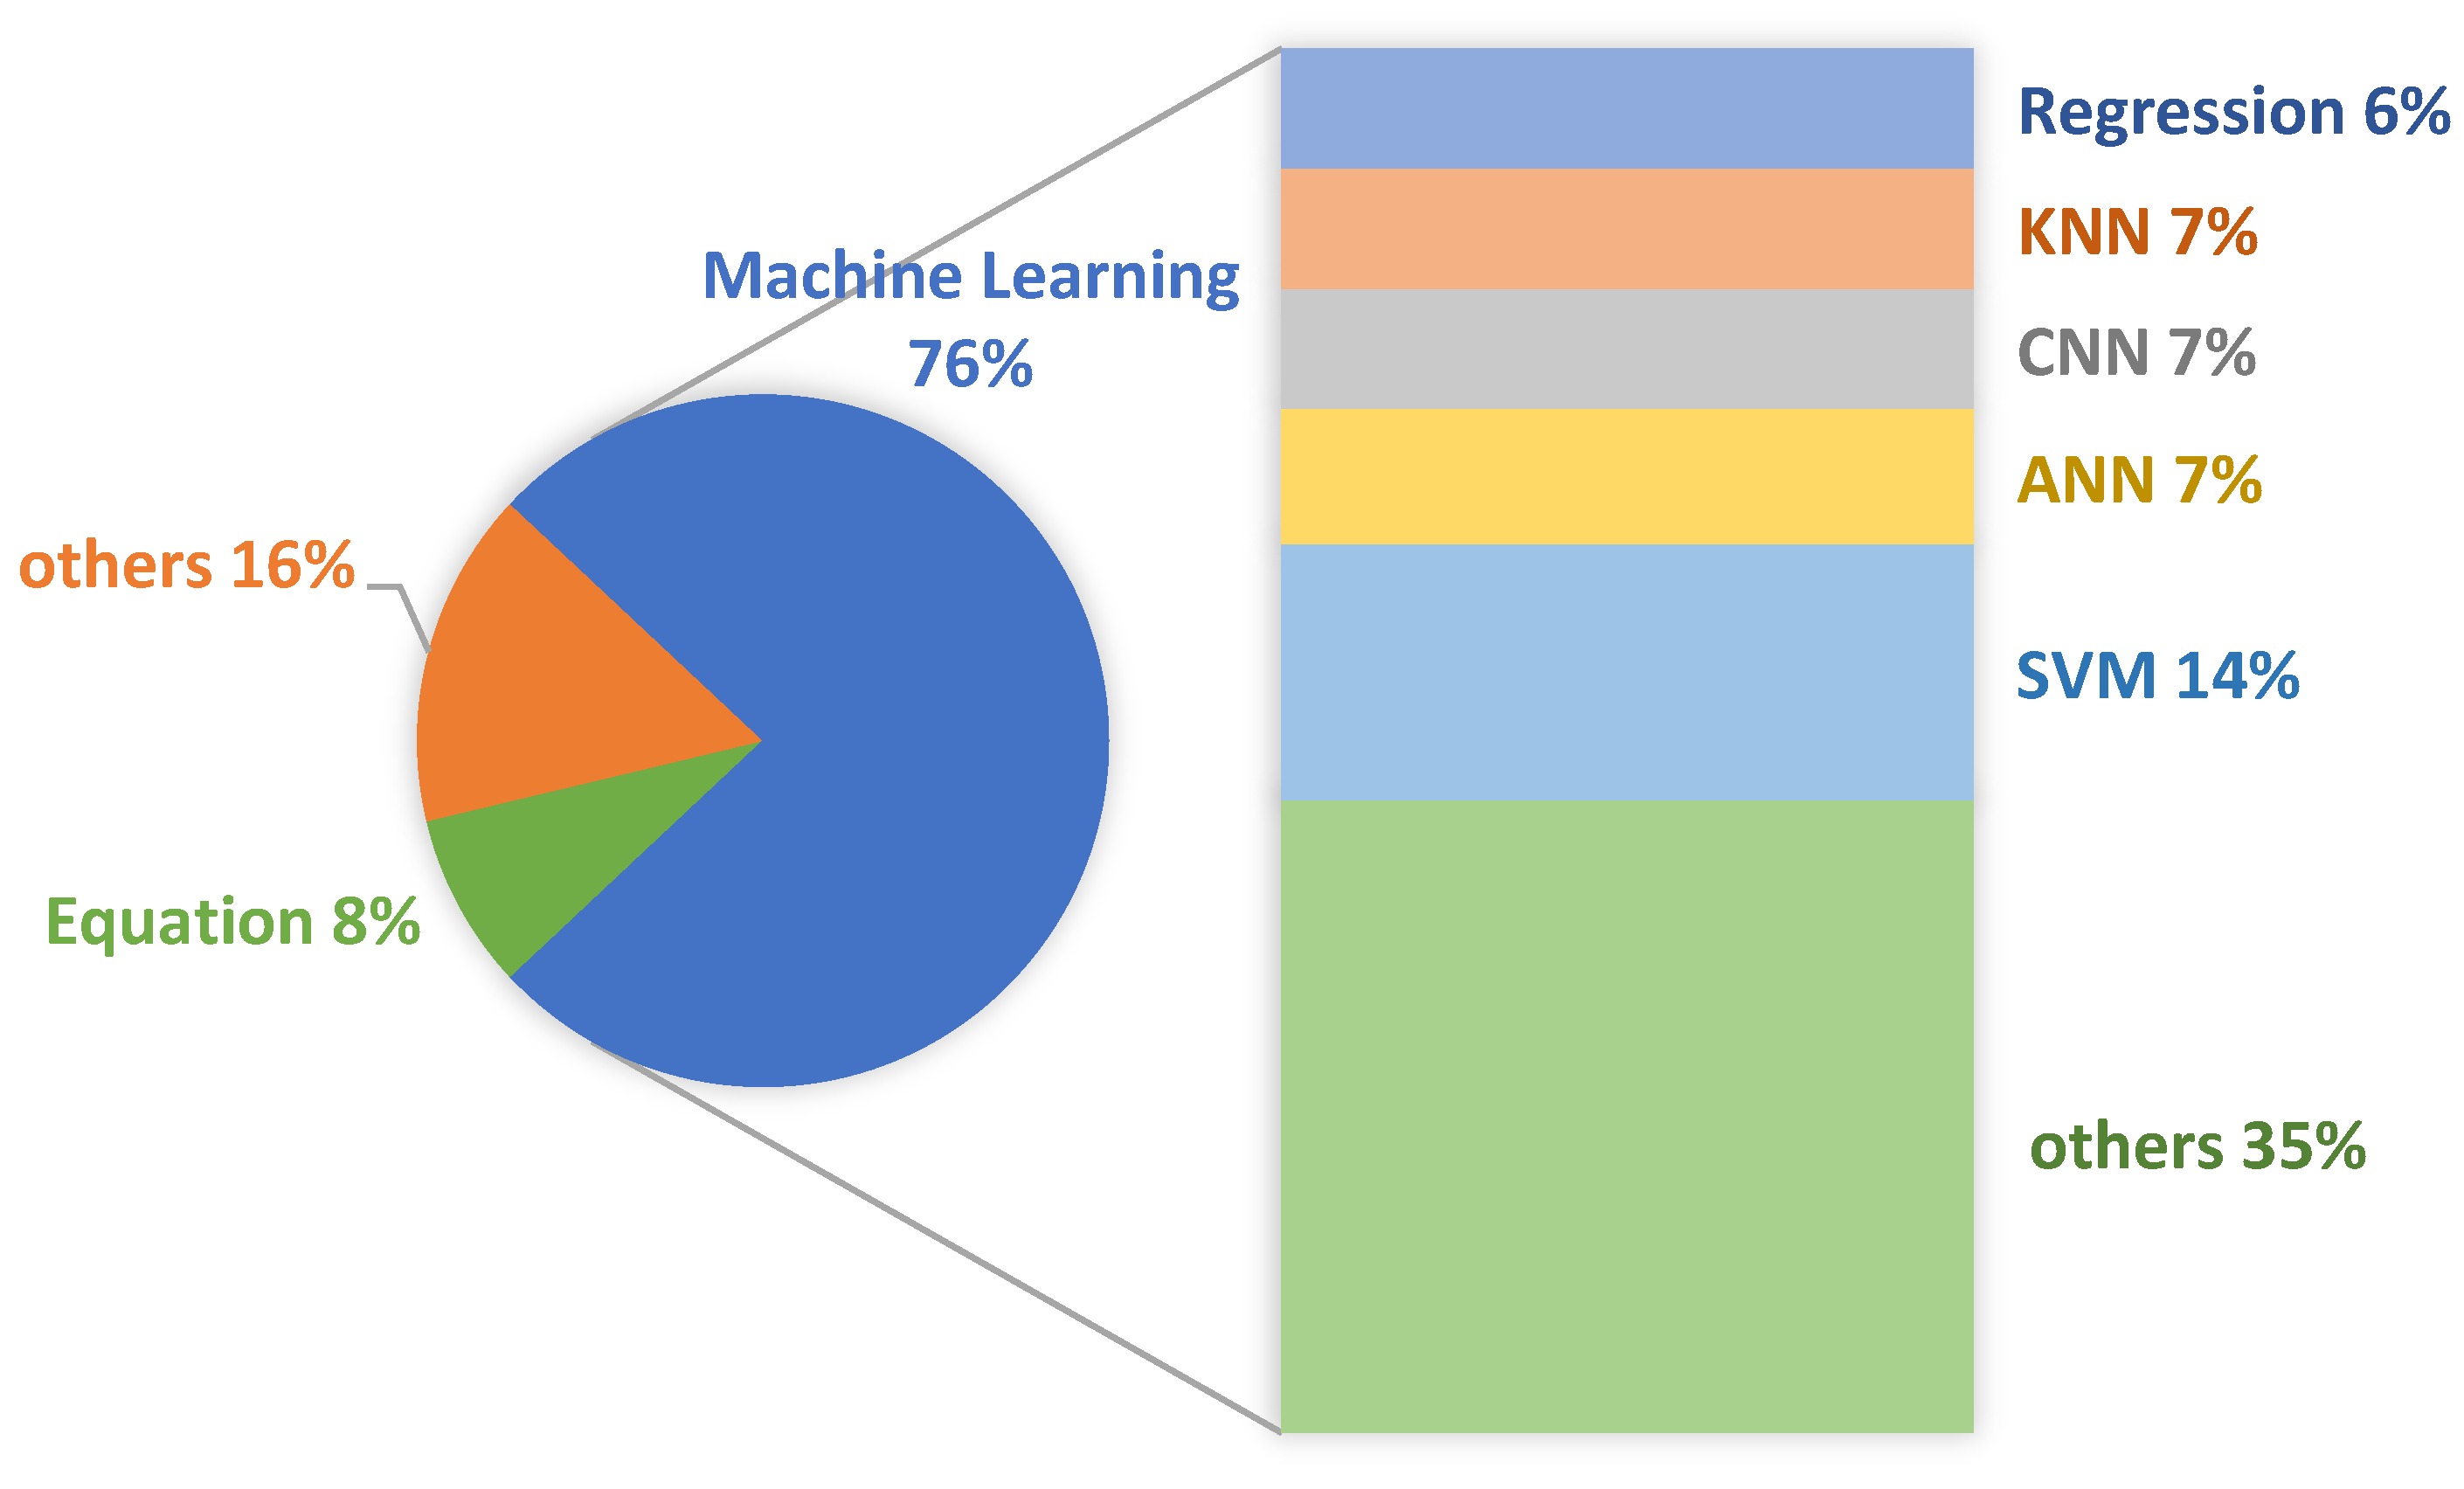
3.3. Review of Estimating Occupancy Counting Algorithms
3.3.1. SVM
3.3.2. ANN
3.3.3. CNN
3.3.4. KNN
3.3.5. Regression
4. Discussion
4.1. Choices in Estimating Occupancy Counting
4.1.1. Range of People
4.1.2. System Usage Accuracy
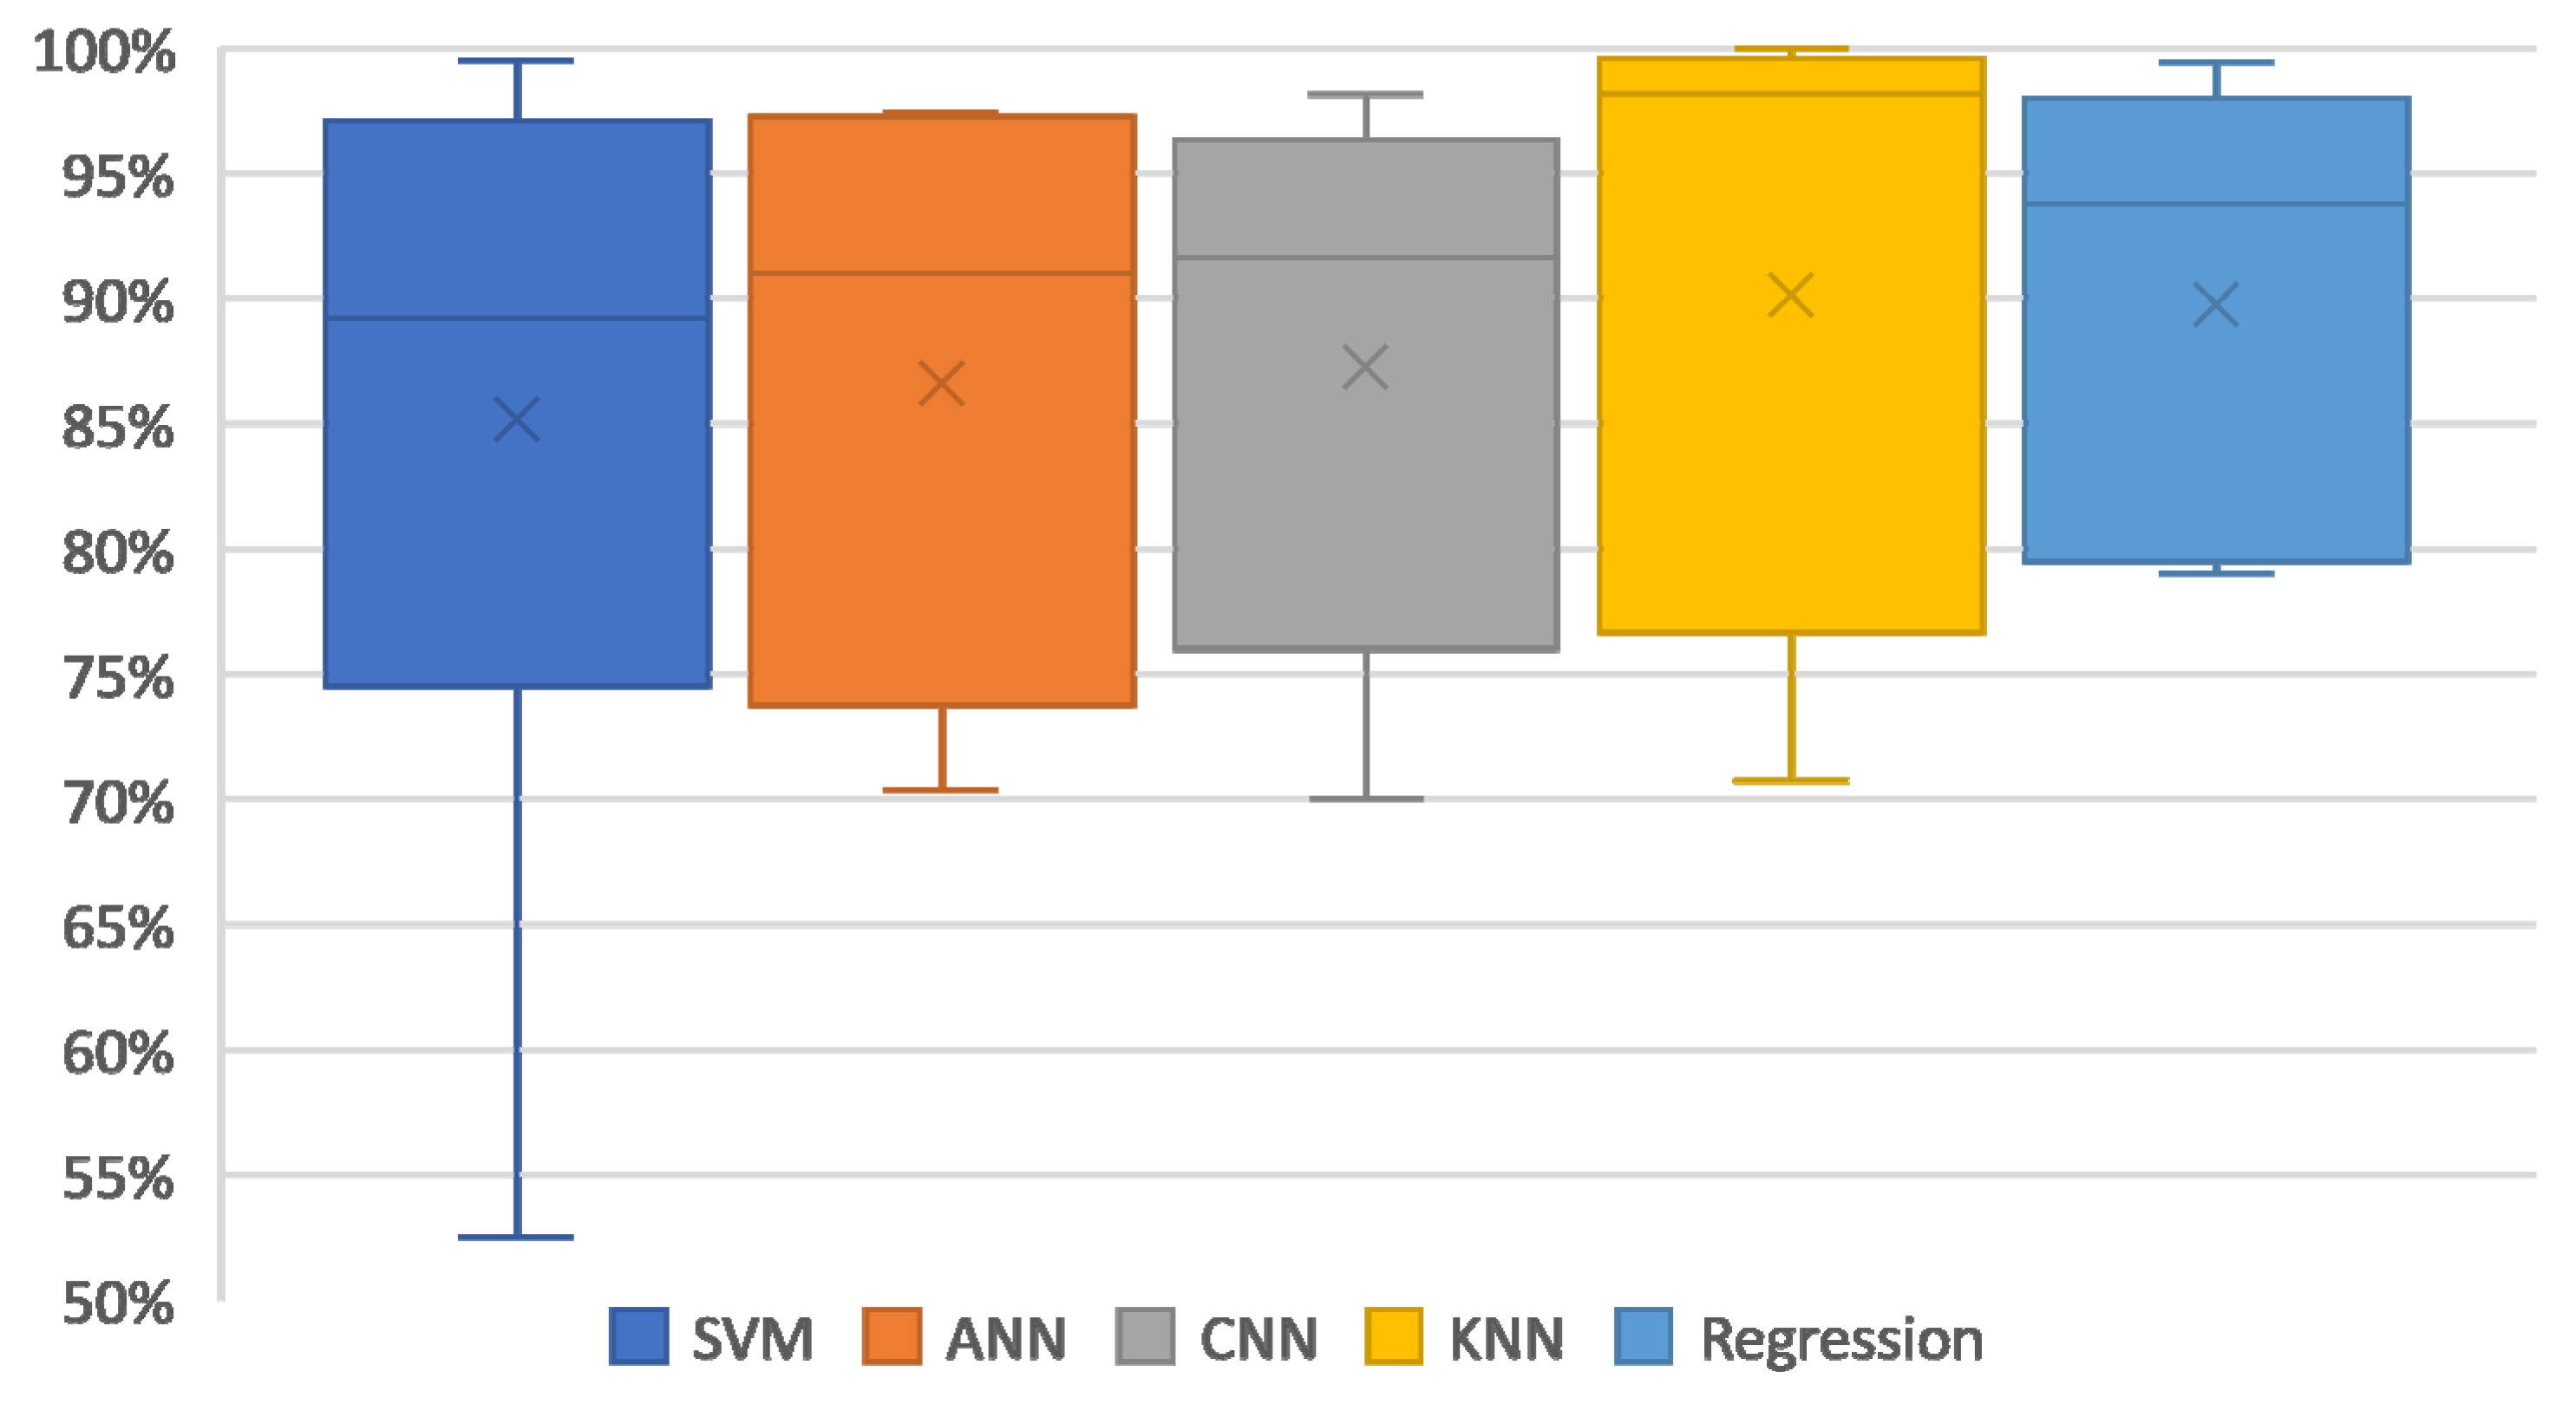
4.1.3. Algorithms Usage Accuracy
4.1.4. Cost and Privacy
4.2. Challenges
4.2.1. Challenges of High-Density Crowd
4.2.2. Challenges of External Factors
4.2.3. Challenges of System Robustness
5. Conclusions and Future Directions
Author Contributions
Funding
Institutional Review Board Statement
Informed Consent Statement
Data Availability Statement
Acknowledgments
Conflicts of Interest
Abbreviations
| ANN | Artificial Neural Network | IoT | Internet of Things |
| BLE | Bluetooth Low Energy | KNN | K-Nearest Neighbor |
| CART | Classification and Regression Trees | LDA | Linear Discriminant Analysis |
| CRF | Conditional Random Field | LSTM | Long Short-Term Memory |
| CNN | Convolutional Neural Network | MCMC | Markov Chain Monte Carlo |
| COTS | Commercial Off-The-Shelf | MLP | Multilayer Perceptron |
| DNN | Deep Neural Network | PTZ | Pan-Tilt-Zoom |
| ELM | Extreme Learning Machine | RFID | Radio-Frequency Identification |
| GEP | Gene Expression Programming | RIR | Passive Infrared |
| HMM | Hidden Markov Models | RLS | Recursive Least Squares |
| HVAC | Heating, Ventilation and Air Conditioning | SVM | Support Vector Machine |
| IEQ | Indoor Environment Quality | ToF | Time-of-Flight |
References
- Gao, C.; Li, P.; Zhang, Y.; Liu, J.; Wang, L. People counting based on head detection combining Adaboost and CNN in crowded surveillance environment. Neurocomputing 2016, 208, 108–116. [Google Scholar] [CrossRef]
- Tyndall, A.; Cardell-Oliver, R.; Keating, A. Occupancy Estimation Using a Low-Pixel Count Thermal Imager. IEEE Sens. J. 2016, 16, 3784–3791. [Google Scholar] [CrossRef]
- Chen, X.; Wang, Q.; Srebric, J. Occupant feedback based model predictive control for thermal comfort and energy optimization: A chamber experimental evaluation. Appl. Energy 2016, 164, 341–351. [Google Scholar] [CrossRef]
- Castilla, M.; Álvarez, J.D.; Berenguel, M.; Rodríguez, F.; Guzmán, J.L.; Pérez, M. A comparison of thermal comfort predictive control strategies. Energy Build. 2011, 43, 2737–2746. [Google Scholar] [CrossRef]
- Hattori, S.; Shinohara, Y. Actual Consumption Estimation Algorithm for Occupancy Detection Using Low Resolution Smart Meter Data. In Proceedings of the 6th International Conference on Sensor Networks, Porto, Portugal, 19–21 February 2017; SciTePress: Porto, Portugal, 2017. [Google Scholar]
- Pedersen, T.H.; Nielsen, K.U.; Petersen, S. Method for room occupancy detection based on trajectory of indoor climate sensor data. Build. Environ. 2017, 115, 147–156. [Google Scholar] [CrossRef]
- Jeon, Y.; Cho, C.; Seo, J.; Kwon, K.; Park, H.; Oh, S.; Chung, I. IoT-based occupancy detection system in indoor residential environments. Build. Environ. 2018, 132, 181–204. [Google Scholar] [CrossRef]
- Akbar, A.; Nati, M.; Carrez, F.; Moessner, K. Contextual Occupancy Detection for Smart Office by Pattern Recognition of Electricity Consumption Data. In Proceedings of the 2015 IEEE International Conference on Communications (ICC), London, UK, 8–12 June 2015; Institute of Electrical and Electronics Engineers Inc.: London, UK, 2015. [Google Scholar]
- Ahmed, I.; Ahmad, A.; Piccialli, F.; Angaiah, A.K.; Jeon, G. A Robust Features-Based Person Tracker for Overhead Views in Industrial Environment. IEEE Internet Things J. 2018, 5, 1598–1605. [Google Scholar] [CrossRef]
- Chandran, A.K.; Poh, L.A.; Vadakkepat, P. Real-time identification of pedestrian meeting and split events from surveillance videos using motion similarity and its applications. J. Real-Time Image Process. 2019, 16, 971–987. [Google Scholar] [CrossRef]
- Guan, Y.; Huang, Y. Multi-pose human head detection and tracking boosted by efficient human head validation using ellipse detection. Eng. Appl. Artif. Intell. 2015, 37, 181–193. [Google Scholar] [CrossRef]
- Munaro, M.; Lewis, C.; Chambers, D.; Hvass, P.; Menegatti, E. RGB-D Human Detection and Tracking for Industrial Environments. In Intelligent Autonomous Systems 13; Springer International Publishing: Cham, Switzerland, 2015; pp. 1655–1668. [Google Scholar]
- Liu, J.; Liu, Y.; Zhang, G.; Zhu, P.; Chen, Y.Q. Detecting and tracking people in real time with RGB-D camera. Pattern Recognit. Lett. 2015, 53, 16–23. [Google Scholar] [CrossRef]
- Sun, K.; Zhao, Q.; Zou, J. A review of building occupancy measurement systems. Energy Build. 2020, 216, 109965. [Google Scholar] [CrossRef]
- Chen, Z.; Jiang, C.; Xie, L. Building occupancy estimation and detection: A review. Energy Build. 2018, 169, 260–270. [Google Scholar] [CrossRef]
- Yang, J.; Pantazaras, A.; Chaturvedi, K.A.; Chandran, A.K.; Santamouris, M.; Lee, S.E.; Tham, K.W. Comparison of different occupancy counting methods for single system-single zone applications. Energy Build. 2018, 172, 221–234. [Google Scholar] [CrossRef]
- Hobson, B.W.; Lowcay, D.; Gunay, H.B.; Ashouri, A.; Newsham, G.R. Opportunistic occupancy-count estimation using sensor fusion: A case study. Build. Environ. 2019, 159, 106154. [Google Scholar] [CrossRef]
- Shen, W.; Newsham, G.; Gunay, B. Leveraging existing occupancy-related data for optimal control of commercial office buildings: A review. Adv. Eng. Inform. 2017, 33, 230–242. [Google Scholar] [CrossRef] [Green Version]
- Dong, B.; Kjærgaard, M.B.; De Simone, M.; Gunay, H.B.; O Brien, W.; Mora, D.; Dziedzic, J.; Zhao, J. Sensing and Data Acquisition. In Exploring Occupant Behavior in Buildings; Springer International Publishing: Cham, Switzerland, 2017; pp. 77–105. [Google Scholar]
- Choi, H.; Um, C.Y.; Kang, K.; Kim, H.; Kim, T. Review of vision-based occupant information sensing systems for occupant-centric control. Build. Environ. 2021, 203, 108064. [Google Scholar] [CrossRef]
- Kouyoumdjieva, S.T.; Danielis, P.; Karlsson, G. Survey of Non-Image-Based Approaches for Counting People. IEEE Commun. Surv. Tutor. 2020, 22, 1305–1336. [Google Scholar] [CrossRef]
- Saha, H.; Florita, A.R.; Henze, G.P.; Sarkar, S. Occupancy sensing in buildings: A review of data analytics approaches. Energy Build. 2019, 188–189, 278–285. [Google Scholar] [CrossRef]
- Rafsanjani, H.; Ahn, C.; Alahmad, M. A Review of Approaches for Sensing, Understanding, and Improving Occupancy-Related Energy-Use Behaviors in Commercial Buildings. Energies 2015, 8, 10996–11029. [Google Scholar] [CrossRef] [Green Version]
- Ding, Y.; Han, S.; Tian, Z.; Yao, J.; Chen, W.; Zhang, Q. Review on occupancy detection and prediction in building simulation. In Building Simulation; Tsinghua University Press: Beijing, China, 2021. [Google Scholar]
- Rueda, L.; Agbossou, K.; Cardenas, A.; Henao, N.; Kelouwani, S. A comprehensive review of approaches to building occupancy detection. Build. Environ. 2020, 180, 106966. [Google Scholar] [CrossRef]
- Yang, J.; Santamouris, M.; Lee, S.E. Review of occupancy sensing systems and occupancy modeling methodologies for the application in institutional buildings. Energy Build. 2016, 121, 344–349. [Google Scholar] [CrossRef]
- Kraft, M.; Aszkowski, P.; Pieczyński, D.; Fularz, M. Low-Cost Thermal Camera-Based Counting Occupancy Meter Facilitating Energy Saving in Smart Buildings. Energies 2021, 14, 4542. [Google Scholar] [CrossRef]
- Choi, H.; Um, C.Y.; Kang, K.; Kim, H.; Kim, T. Application of vision-based occupancy counting method using deep learning and performance analysis. Energy Build. 2021, 252, 111389. [Google Scholar] [CrossRef]
- Naser, A.; Lotfi, A.; Zhong, J. Adaptive Thermal Sensor Array Placement for Human Segmentation and Occupancy Estimation. IEEE Sens. J. 2021, 21, 1993–2002. [Google Scholar] [CrossRef]
- Rabiee, R.; Karlsson, J. Multi-Bernoulli Tracking Approach for Occupancy Monitoring of Smart Buildings Using Low-Resolution Infrared Sensor Array. Remote Sens. 2021, 13, 3127. [Google Scholar] [CrossRef]
- Anand, P.; Deb, C.; Yan, K.; Yang, J.; Cheong, D.; Sekhar, C. Occupancy-based energy consumption modelling using machine learning algorithms for institutional buildings. Energy Build. 2021, 252, 111478. [Google Scholar] [CrossRef]
- Lu, H.; Tuzikas, A.; Radke, R.J. A zone-level occupancy counting system for commercial office spaces using low-resolution time-of-flight sensors. Energy Build. 2021, 252, 111390. [Google Scholar] [CrossRef]
- Ding, Y.; Chen, W.; Wei, S.; Yang, F. An occupancy prediction model for campus buildings based on the diversity of occupancy patterns. Sustain. Cities Soc. 2021, 64, 102533. [Google Scholar] [CrossRef]
- Vega-Barbas, M.; Álvarez-Campana, M.; Rivera, D.; Sanz, M.; Berrocal, J. AFOROS: A Low-Cost Wi-Fi-Based Monitoring System for Estimating Occupancy of Public Spaces. Sensors 2021, 21, 3863. [Google Scholar] [CrossRef]
- Kampezidou, S.I.; Ray, A.T.; Duncan, S.; Balchanos, M.G.; Mavris, D.N. Real-time occupancy detection with physics-informed pattern-recognition machines based on limited CO2 and temperature sensors. Energy Build. 2021, 242, 110863. [Google Scholar] [CrossRef]
- Hagenaars, E.; Pandharipande, A.; Murthy, A.; Leus, G. Single-Pixel Thermopile Infrared Sensing for People Counting. IEEE Sens. J. 2021, 21, 4866–4873. [Google Scholar] [CrossRef]
- Sheikh Khan, D.; Kolarik, J.; Anker Hviid, C.; Weitzmann, P. Method for long-term mapping of occupancy patterns in open-plan and single office spaces by using passive-infrared (PIR) sensors mounted below desks. Energy Build. 2021, 230, 110534. [Google Scholar] [CrossRef]
- Korany, B.; Mostofi, Y. Counting a stationary crowd using off-the-shelf wifi. In Proceedings of the 19th Annual International Conference on Mobile Systems, Applications, and Services, Virtual, 24 June 2021–2 July 2021. [Google Scholar]
- Chidurala, V.; Li, X. Occupancy Estimation using Thermal Imaging Sensors and Machine Learning Algorithms. IEEE Sens. J. 2021, 21, 8627–8638. [Google Scholar] [CrossRef]
- Wang, F.; Zhang, F.; Wu, C.; Wang, B.; Ray Liu, K.J. Passive People Counting Using Commodity WiFi. In Proceedings of the 2020 IEEE 6th World Forum on Internet of Things (WF-IoT), New Orleans, LA, USA, 2–16 June 2020; IEEE: Piscataway, NJ, USA, 2020. [Google Scholar]
- Mutis, I.; Ambekar, A.; Joshi, V. Real-time space occupancy sensing and human motion analysis using deep learning for indoor air quality control. Autom. Constr. 2020, 116, 103237. [Google Scholar] [CrossRef]
- Zhang, L.; Zhang, Y.; Wang, B.; Zheng, X.; Yang, L. WiCrowd: Counting The Directional Crowd with A Single Wireless Link. IEEE Internet Things J. 2020, 8, 8644–8656. [Google Scholar] [CrossRef]
- Weib, J.; Perez, R.; Biebl, E. Improved People Counting Algorithm for Indoor Environments Using 60 GHz FMCW Radar. In Proceedings of the 2020 IEEE Radar Conference (RadarConf20), Florence, Italy, 21–25 September 2020; Institute of Electrical and Electronics Engineers Inc.: Florence, Italy, 2020. [Google Scholar]
- Sharma, P.; Xu, G.; Hui, X.; Hysell, D.L.; Kan, E.C. Deep-Learning Based Occupant Counting by Ambient RF Sensing. IEEE Sens. J. 2020, 21, 8564–8574. [Google Scholar] [CrossRef]
- Yang, Y.; Cao, J.; Liu, X.; Liu, X. Door-Monitor: Counting In-and-Out Visitors With COTS WiFi Devices. IEEE Internet Things J. 2020, 7, 1704–1717. [Google Scholar] [CrossRef]
- Tang, C.; Li, W.; Vishwakarma, S.; Chetty, K.; Julier, S.; Woodbridge, K. Occupancy Detection and People Counting Using WiFi Passive Radar. In Proceedings of the 2020 IEEE Radar Conference (RadarConf20), Florence, Italy, 21–25 September 2020. [Google Scholar]
- Andrews, J.; Kowsika, M.; Vakil, A.; Li, J. A Motion Induced Passive Infrared (PIR) Sensor for Stationary Human Occupancy Detection. In Proceedings of the 2020 IEEE/ION Position, Location and Navigation Symposium (PLANS), Portland, OR, USA, 23–26 April 2020. [Google Scholar]
- Yuan, Y.; Li, X.; Liu, Z.; Guan, X. Occupancy Estimation in Buildings Based on Infrared Array Sensors Detection. IEEE Sens. J. 2020, 20, 1043–1053. [Google Scholar] [CrossRef]
- Zhou, Y.; Chen, J.; Yu, Z.J.; Li, J.; Huang, G.; Haghighat, F.; Zhang, G. A novel model based on multi-grained cascade forests with wavelet denoising for indoor occupancy estimation. Build. Environ. 2020, 167, 106461. [Google Scholar] [CrossRef]
- Naser, A.; Lotfi, A.; Zhong, J.; He, J. Heat-Map Based Occupancy Estimation Using Adaptive Boosting. In Proceedings of the 2020 IEEE International Conference on Fuzzy Systems (FUZZ-IEEE), Glasgow, UK, 19–24 July 2020; Institute of Electrical and Electronics Engineers Inc.: Glasgow, UK, 2020. [Google Scholar]
- Cokbas, M.; Ishwar, P.; Konrad, J. Low-Resolution Overhead Thermal Tripwire for Occupancy Estimation. In Proceedings of the IEEE/CVF Conference on Computer Vision and Pattern Recognition Workshops, Nashville, TN, USA, 14–19 June 2020. [Google Scholar]
- Vela, A.; Alvarado-Uribe, J.; Davila, M.; Hernandez-Gress, N.; Ceballos, H.G. Estimating Occupancy Levels in Enclosed Spaces Using Environmental Variables: A Fitness Gym and Living Room as Evaluation Scenarios. Sensors 2020, 20, 6579. [Google Scholar] [CrossRef]
- Meng, Y.; Li, T.; Liu, G.; Xu, S.; Ji, T. Real-time dynamic estimation of occupancy load and an air-conditioning predictive control method based on image information fusion. Build. Environ. 2020, 173, 106741. [Google Scholar] [CrossRef]
- Wang, Z.; Hong, T.; Piette, M.A.; Pritoni, M. Inferring occupant counts from Wi-Fi data in buildings through machine learning. Build. Environ. 2019, 158, 281–294. [Google Scholar] [CrossRef] [Green Version]
- Sangogboye, F.C.; Kjargaard, M.B. Scalable and Accurate Estimation of Room-Level People Counts from Multi-Modal Fusion of Perimeter Sensors and WiFi Trajectories. In Proceedings of the 2019 20th IEEE International Conference on Mobile Data Management (MDM), Hong Kong, China, 10–13 June 2019. [Google Scholar]
- Callemein, T.; Van Beeck, K.; Goedeme, T. Anyone here? Smart Embedded Low-Resolution Omnidirectional Video Sensor to Measure Room Occupancy. In Proceedings of the 2019 18th IEEE International Conference On Machine Learning And Applications (ICMLA), Boca Raton, FL, USA, 16–19 December 2019. [Google Scholar]
- Huang, Q.; Rodriguez, K.; Whetstone, N.; Habel, S. Rapid Internet of Things (IoT) prototype for accurate people counting towards energy efficient buildings. J. Inf. Technol. Constr. 2019, 24, 1–13. [Google Scholar] [CrossRef] [Green Version]
- Taha, A.; Krabicka, J.; Wu, R.; Kyberd, P.; Adams, N. Design of an Occupancy Monitoring Unit: A Thermal Imaging Based People Counting Solution for Socio-Technical Energy Saving Systems in Hospitals. In Proceedings of the 2019 11th Computer Science and Electronic Engineering (CEEC), Colchester, UK, 18–20 September 2019. [Google Scholar]
- Wolf, S.; Calì, D.; Krogstie, J.; Madsen, H. Carbon dioxide-based occupancy estimation using stochastic differential equations. Appl. Energy 2019, 236, 32–41. [Google Scholar] [CrossRef]
- Longo, E.; Redondi AE, C.; Cesana, M. Accurate occupancy estimation with WiFi and bluetooth/BLE packet capture. Comput. Netw. 2019, 163, 106876. [Google Scholar] [CrossRef]
- Singh, S.; Aksanli, B. Non-Intrusive Presence Detection and Position Tracking for Multiple People Using Low-Resolution Thermal Sensors. J. Sens. Actuator Netw. 2019, 8, 40. [Google Scholar] [CrossRef] [Green Version]
- Li, H.; Hong, T.; Sofos, M. An inverse approach to solving zone air infiltration rate and people count using indoor environmental sensor data. Energy Build. 2019, 198, 228–242. [Google Scholar] [CrossRef] [Green Version]
- Kim, S.; Sung, Y.; Sung, Y.; Seo, D. Development of a Consecutive Occupancy Estimation Framework for Improving the Energy Demand Prediction Performance of Building Energy Modeling Tools. Energies 2019, 12, 433. [Google Scholar] [CrossRef] [Green Version]
- Liu, D.; Yuan, S. Indoor occupancy estimation method based on carbon dioxide. Ordnance Ind. Autom. 2018, 37, 43–47. [Google Scholar]
- Arief-Ang, I.B.; Hamilton, M.; Salim, F.D. A Scalable Room Occupancy Prediction with Transferable Time Series Decomposition of CO2 Sensor Data. ACM Trans. Sens. Netw. 2018, 14, 21. [Google Scholar] [CrossRef]
- Mohottige, I.P.; Moors, T. Estimating Room Occupancy in a Smart Campus Using WiFi Soft Sensors. In Proceedings of the 2018 IEEE 43rd Conference on Local Computer Networks (LCN), Chicago, IL, USA, 1–4 October 2018; IEEE: Piscataway, NJ, USA, 2018. [Google Scholar]
- Wang, W.; Chen, J.; Hong, T.; Zhu, N. Occupancy prediction through Markov based feedback recurrent neural network (M-FRNN) algorithm with WiFi probe technology. Build. Environ. 2018, 138, 160–170. [Google Scholar] [CrossRef]
- Totada, B.S.; Cabrera, S.D. Detection of People from Time-of-Flight Depth Images Using a Cell-Tracking Methodology. In Proceedings of the 2018 IEEE International Symposium on Signal Processing and Information Technology (ISSPIT), Louisville, KY, USA, 6–8 December 2018. [Google Scholar]
- Zou, H.; Zhou, Y.; Yang, J.; Spanos, C.J. Device-free occupancy detection and crowd counting in smart buildings with WiFi-enabled IoT. Energy Build. 2018, 174, 309–322. [Google Scholar] [CrossRef]
- Rahman, H.; Han, H. Bayesian estimation of occupancy distribution in a multi-room office building based on CO2 concentrations. Build. Simul. 2018, 11, 575–583. [Google Scholar] [CrossRef]
- Wang, W.; Chen, J.; Hong, T. Occupancy prediction through machine learning and data fusion of environmental sensing and Wi-Fi sensing in buildings. Autom. Constr. 2018, 94, 233–243. [Google Scholar] [CrossRef] [Green Version]
- Kim, Y.; Srebric, J. Impact of occupancy rates on the building electricity consumption in commercial buildings. Energy Build. 2017, 138, 591–600. [Google Scholar] [CrossRef]
- Newsham, G.R.; Xue, H.; Arsenault, C.; Valdes, J.J.; Burns, G.J.; Scarlett, E.; Kruithof, S.G.; Shen, W. Testing the accuracy of low-cost data streams for determining single-person office occupancy and their use for energy reduction of building services. Energy Build. 2017, 135, 137–147. [Google Scholar] [CrossRef] [Green Version]
- Chandran, A.K.; Subramaniam, A.; Wong, W.C.; Yang, J.; Chaturvedi, K.A. A PTZ camera based people-occupancy estimation system (PCBPOES). In Proceedings of the 2017 Fifteenth IAPR International Conference on Machine Vision Applications (MVA), Nagoya, Japan, 8–12 May 2017. [Google Scholar]
- Wang, F.; Feng, Q.; Chen, Z.; Zhao, Q.; Cheng, Z.; Zou, J.; Zhang, Y.; Mai, J.; Li, Y.; Reeve, H. Predictive control of indoor environment using occupant number detected by video data and CO2 concentration. Energy Build. 2017, 145, 155–162. [Google Scholar] [CrossRef]
- Zuraimi, M.S.; Pantazaras, A.; Chaturvedi, K.A.; Yang, J.J.; Tham, K.W.; Lee, S.E. Predicting occupancy counts using physical and statistical CO2-based modeling methodologies. Build. Environ. 2017, 123, 517–528. [Google Scholar] [CrossRef]
- Masood, M.K.; Soh, Y.C.; Jiang, C. Occupancy estimation from environmental parameters using wrapper and hybrid feature selection. Appl. Soft Comput. 2017, 60, 482–494. [Google Scholar] [CrossRef]
- Szczurek, A.; Maciejewska, M.; Pietrucha, T. Occupancy determination based on time series of CO2 concentration, temperature and relative humidity. Energy Build. 2017, 147, 142–154. [Google Scholar] [CrossRef]
- Candanedo, L.M.; Feldheim, V.; Deramaix, D. A methodology based on Hidden Markov Models for occupancy detection and a case study in a low energy residential building. Energy Build. 2017, 148, 327–341. [Google Scholar] [CrossRef]
- Walmsley-Eyre, L.; Cardell-Oliver, R. Hierarchical Classification of Low Resolution Thermal Images for Occupancy Estimation. In Proceedings of the 2017 IEEE 42nd conference on local computer networks workshops (LCN Workshops), Singapore, 9–12 October 2017. [Google Scholar]
- Zou, J.; Zhao, Q.; Yang, W.; Wang, F. Occupancy detection in the office by analyzing surveillance videos and its application to building energy conservation. Energy Build. 2017, 152, 385–398. [Google Scholar] [CrossRef]
- Zou, H.; Jiang, H.; Yang, J.; Xie, L.; Spanos, C. Non-intrusive occupancy sensing in commercial buildings. Energy Build. 2017, 154, 633–643. [Google Scholar] [CrossRef]
- Ryu, S.H.; Moon, H.J. Development of an occupancy prediction model using indoor environmental data based on machine learning techniques. Build. Environ. 2016, 107, 1–9. [Google Scholar] [CrossRef]
- Jiang, C.; Masood, M.K.; Soh, Y.C.; Li, H. Indoor occupancy estimation from carbon dioxide concentration. Energy Build. 2016, 131, 132–141. [Google Scholar] [CrossRef] [Green Version]
- Petersen, S.; Pedersen, T.H.; Nielsen, K.U.; Knudsen, M.D. Establishing an image-based ground truth for validation of sensor data-based room occupancy detection. Energy Build. 2016, 130, 787–793. [Google Scholar] [CrossRef]
- Lu, X.; Wen, H.; Zou, H.; Jiang, H.; Xie, L.; Trigoni, N. Robust occupancy inference with commodity WiFi. In Proceedings of the 2016 IEEE 12th International Conference on Wireless and Mobile Computing, Networking and Communications (WiMob), New York, NY, USA, 17–19 October 2016. [Google Scholar]
- Raykov, Y.; Ozer, E.; Dasika, G.; Boukouvalas, A.; Little, M. Predicting Room Occupancy with a Single Passive Infrared (PIR) Sensor through Behavior Extraction. In Proceedings of the 2016 ACM International Joint Conference on Pervasive and Ubiquitous Computing, Heidelberg, Germany, 12–16 September 2016; ACM: New York, NY, USA, 2016. [Google Scholar]
- Chen, Z.; Masood, M.K.; Soh, Y.C. A fusion framework for occupancy estimation in office buildings based on environmental sensor data. Energy Build. 2016, 133, 790–798. [Google Scholar] [CrossRef]
- Chandran, A.K.; Wong, W. Pedestrian Crowd Level Estimation by Head Detection Using Bio-Inspired Retina Model. In Proceedings of the 2016 IEEE Region 10 Conference (TENCON), Singapore, 22–25 November 2016; Institute of Electrical and Electronics Engineers Inc.: Singapore, 2016. [Google Scholar]
- Diraco, G.; Leone, A.; Siciliano, P. People occupancy detection and profiling with 3D depth sensors for building energy management. Energy Build. 2015, 92, 246–266. [Google Scholar] [CrossRef]
- Labeodan, T.; Zeiler, W.; Boxem, G.; Zhao, Y. Occupancy measurement in commercial office buildings for demand-driven control applications—A survey and detection system evaluation. Energy Build. 2015, 93, 303–314. [Google Scholar] [CrossRef] [Green Version]
- Kuutti, J.; Blomqvist, K.; Sepponen, R. Evaluation of Visitor Counting Technologies and Their Energy Saving Potential through Demand-Controlled Ventilation. Energies 2014, 7, 1685–1705. [Google Scholar] [CrossRef] [Green Version]
- Shih, H. A robust occupancy detection and tracking algorithm for the automatic monitoring and commissioning of a building. Energy Build. 2014, 77, 270–280. [Google Scholar] [CrossRef]
- Conti, F.; Pullini, A.; Benini, L. Brain-Inspired Classroom Occupancy Monitoring on a Low-Power Mobile Platform. In Proceedings of the 2014 IEEE Conference on Computer Vision and Pattern Recognition Workshops, Columbus, OH, USA, 23–28 June 2014. [Google Scholar]
- Liu, D.; Guan, X.; Du, Y.; Zhao, Q. Measuring indoor occupancy in intelligent buildings using the fusion of vision sensors. Meas. Sci. Technol. 2013, 24, 74023. [Google Scholar] [CrossRef]
- Beltran, A.; Erickson, V.; Cerpa, A. ThermoSense: Occupancy Thermal Based Sensing for HVAC Control; ACM: New York, NY, USA, 2013.
- Gade, R.; Jorgensen, A.; Moeslund, T.B. Long-term occupancy analysis using graph-based optimisation in thermal imagery. In Proceedings of the IEEE Conference on Computer Vision and Pattern Recognition, Portland, OR, USA, 23–28 June 2013. [Google Scholar]
- Gade, R.; Jorgensen, A.; Moeslund, T.B. Occupancy analysis of sports arenas using thermal imaging. In Proceedings of the International Conference on Computer Vision Theory and Applications, Rome, Italy, 24–26 February 2012. [Google Scholar]
- Wahl, F.; Milenkovic, M.; Amft, O. A Distributed PIR-based Approach for Estimating People Count in Office Environments. In Proceedings of the 2012 IEEE 15th International Conference on Computational Science and Engineering, Washington, DC, USA, 5–7 December 2012. [Google Scholar]
- Benezeth, Y.; Laurent, H.; Emile, B.; Rosenberger, C. Towards a sensor for detecting human presence and characterizing activity. Energy Build. 2011, 43, 305–314. [Google Scholar] [CrossRef]
- Franco, A.; Leccese, F. Measurement of CO2 concentration for occupancy estimation in educational buildings with energy efficiency purposes. J. Build. Eng. 2020, 32, 101714. [Google Scholar] [CrossRef]
- Weekly, K.; Bekiaris-Liberis, N.; Jin, M.; Bayen, A.M. Modeling and Estimation of the Humans’ Effect on the CO2 Dynamics Inside a Conference Room. IEEE Trans. Control Syst. Technol. 2015, 23, 1770–1781. [Google Scholar] [CrossRef] [Green Version]
- Li, Y.; Tseng, W.; Hsieh, N.; Chen, S. Assessing the seasonality of occupancy number-associated CO2 level in a Taiwan hospital. Environ. Sci. Pollut. Res. 2019, 26, 16422–16432. [Google Scholar] [CrossRef]
- Dai, X.; Liu, J.; Zhang, X. A review of studies applying machine learning models to predict occupancy and window-opening behaviours in smart buildings. Energy Build. 2020, 223, 110159. [Google Scholar] [CrossRef]
- Bao, R.; Yang, Z. CNN-Based Regional People Counting Algorithm Exploiting Multi-Scale Range-Time Maps With an IR-UWB Radar. IEEE Sens. J. 2021, 21, 13704–13713. [Google Scholar] [CrossRef]
- Ilyas, N.; Shahzad, A.; Kim, K. Convolutional-Neural Network-Based Image Crowd Counting: Review, Categorization, Analysis, and Performance Evaluation. Sensors 2020, 20, 43. [Google Scholar] [CrossRef] [Green Version]
- Kim, Y.; Lee, Y.; Pyo, C. Accurate Occupancy Detection via Label Noise Filtering Technique. In Proceedings of the 2020 International Conference on Information and Communication Technology Convergence (ICTC), Jeju Island, Korea, 21–23 October 2020. [Google Scholar]
- Chrysler, A.; Gunarso, R.; Puteri, T.; Warnars, H.L.H.S. A literature review of crowd-counting system on convolutional neural network. IOP Conf. Ser. Earth Environ. Sci. 2021, 729, 012029. [Google Scholar] [CrossRef]
- Al-Aghbari, A.A.; Elrabaa ME, S. Cloud-Based FPGA Custom Computing Machines for Streaming Applications. IEEE Access 2019, 7, 38009–38019. [Google Scholar] [CrossRef]


| Study | Years | Location | Sensors | Methods | Accuracy | People Number | Remarks |
|---|---|---|---|---|---|---|---|
| [27] | 2021 | Poland | Camera | CNN | 94.1% | 5 | |
| [28] | 2021 | Korea | Camera | YOLO | NRMSE H: 0.0918 L: 0.0435 | 13 | major over/under counting cases |
| [29] | 2021 | UK | Infrared | Boosting algorithm Regression | H: 98.43% L: 93.75% | 4 | thermal sensor |
| [30] | 2021 | Sweden | Infrared | Multi-Bernoulli Target Tracking Approach | H: 98% L: 86% | - | IR cameras |
| [31] | 2021 | India Singapore Switzerland | Wireless Communication | 87% | 97 | ||
| [32] | 2021 | USA | Time-Of-Flight Sensors | Zone Counting | H: 100% L: 91.7% | 3 | |
| [33] | 2021 | China | Infrared | Gaussian Distribution Model | 85% | 65 | enter or leave in turn |
| [34] | 2021 | Spain | Wireless Communication | Footprint Calculation Algorithm | 95% | 700 | |
| [35] | 2021 | USA | Environment Sensor | Physics-Informed Pattern-Recognition Machine | 97% | 2 | |
| [36] | 2021 | Infrared | RLS | 89% | 4 | thermopile infrared sensing | |
| [37] | 2021 | Denmark | Infrared | Binarization | 87.5% | 19 | passive-infrared |
| [38] | 2021 | USA | Wireless Communication | Probability Distribution Function | 96.3% | 27 | stationary crowd |
| [39] | 2021 | USA | Infrared | Gaussian Naive Bayes KNN SVM Random Forest | 99% | 8 | thermal imaging sensors |
| [40] | 2020 | USA | Wireless Communication | Iterative Dynamic Programming Algorithm Trace Concatenating Algorithm | 86% | 4 | static crowd counting |
| [41] | 2020 | USA | Camera | YOLO | H: 83.95% L: 57.52% | 25 | |
| [42] | 2020 | China | Wireless Communication | SVM | H: 86.4% L: 78.2% | - | without upper bound of people counted |
| [43] | 2020 | Germany | Radar Sensor | Adaptive OS-CFAR Peak Detection Algorithm Vital Sign Verification Algorithm | 85.4% | 4 | 60 GHz mm-wave radar |
| [44] | 2020 | USA | Wireless Communication | CNN | 82% | 5 | RFID |
| [45] | 2020 | China | Wireless Communication | CNN | 94.5% | 6 | visitor counting system |
| [46] | 2020 | UK | Wireless Communication | CNN | 98.14% | 4 | low-cost passive Wi-Fi radar |
| [47] | 2020 | USA | Infrared | ANN | 91% | 3 | PIR sensors |
| [48] | 2020 | China | Infrared | HMM Softmax Regression Model | H: 99.44% L: 80% | 7 | |
| [49] | 2020 | China Canada | Environment Sensor | Multi-Grained Scanning Cascade Forests | MAE: 0.153 | 4 | |
| [50] | 2020 | UK | Infrared | Adaboost | 98.2% | 4 | infrared thermal sensor array |
| [51] | 2020 | USA | Infrared | Baseline Algorithm Multi-Person Algorithm | MAE H: 1.431 L: 0.003 | 133 | low-resolution thermal sensor |
| [52] | 2020 | Mexico UK | Environment Sensor | Decision Tree KNN SVM | 97% | 4 | |
| [53] | 2020 | China | Camera | CNN | 70% | 80 | estimate the real-time load complex scenes a small size and a fast model inference speed |
| [54] | 2019 | USA | Wireless Communication | Random Forest ANN LSTM | RMSE H: 4.62 L: 1.20 | 74 | protect privacy. |
| [55] | 2019 | Denmark | Wireless Communication | Multi-Modal Fusion Algorithm | RMSE H: 1.39 L: 0.87 | 600 | |
| [56] | 2019 | Belgium | Camera | Deep Learning | H: 96.7% L: 42.8% | 4 | privacy preserving |
| [57] | 2019 | USA | Wireless Communication | 97% | - | the first intelligent IoT sensor platform | |
| [58] | 2019 | UK | Infrared | Human Detection and Direction Algorithm | occupancy monitoring unit thermal imaging | ||
| [59] | 2019 | Denmark Norway | Environment Sensor | Stochastic Differential Equations | 77% | 5 | influence of window openings has not been investigated |
| [60] | 2019 | Italy | Wireless Communication | Logistic Regression Classifier | H: 97% L: 53% | 132 | low cost different levels of crowding |
| [17] | 2019 | Canada | Environment Sensor Wireless Communication Infrared | Linear Regression ANN | H: 97.5% L: <0.1% | 72 | sensor fusion |
| [61] | 2019 | USA | Infrared | Window Size Algorithm Connected Component Algorithm | H: 100% L: 17% | 3 | low-resolution thermal sensors without causing any discomfort or privacy issues |
| [62] | 2019 | USA | Environment Sensor | Inverse Modeling Algorithm | - | - | develops a novel inverse modeling method |
| [63] | 2019 | Korea | Environment Sensor | Decision Tree SVM ANN | H: 97.19% L: 90.52% | - | reselection of input variables each season and situation |
| [64] | 2018 | China | Environment Sensor | Parameter Model Kalman Filtering | H: 88.81% L: 71.22% | 4 | |
| [65] | 2018 | Australia | Environment Sensor | Semi-supervised Domain Adaptation Method | H: 75.25% L: 55.74% | 230 | minimal training data |
| [16] | 2018 | Singapore Australia | Environment Sensor Camera | SVM Physical and Statistical Model | H: 97.2% L: 26.4% | 200 | four different occupancy estimation methods |
| [66] | 2018 | Australia | Wireless Communication | Logistic Regression SVM LDA | H: 84% L: 79% | 250 | without incurring cost and effort |
| [67] | 2018 | China USA | Wireless Communication | Markov Based Feedback Recurrent Neural Network Algorithm | H: 93.9%. L: 80.9% | 19 | more reliable and sensitive |
| [68] | 2018 | USA | Camera | Cell-tracking Methodology | 98.12% | 8 | the CellProfiler image processing software |
| [69] | 2018 | USA Singapore | Wireless Communication | Transfer Kernel Learning Based Classifier | 92.8% | 11 | IoT preserve the privacy robust to temporal and environmental |
| [70] | 2018 | Korea | Environment Sensor | MCMC | RMSE H: 3.91 person L: 0.11 person | 25 | inter-connected rooms multi-room office building |
| [71] | 2018 | China USA | Environment Sensor Wireless Communication | KNN SVM ANN | MAE H: 3.0 L: 1.7 | 25 | data fusion |
| [72] | 2017 | USA | Device | Linear Regression | 50–80% | 350 | electricity consumption |
| [73] | 2017 | Canada | Device | GEP | >90% | - | data collected by PC single-person office occupancy |
| [74] | 2017 | Singapore | Camera | SVM | 92% | 220 | people-occupancy estimation system |
| [75] | 2017 | China | Camera Environment Sensor | Conservation Equation | - | - | CO2 data revise the results of video detection |
| [76] | 2017 | Singapore | Environment Sensor | Dynamic Physical Models SVM ANN | RMSE H: 12.8 L: 12.1 | 200 | prediction of occupancy counts in a large space |
| [77] | 2017 | Singapore | Environment Sensor | ELM | >96% | 14 | high accuracy faster |
| [78] | 2017 | Poland | Environment Sensor | KNN LDA | ME H: 0.79 L: 0.45 | 42 | determine the duration of occupancy periods |
| [79] | 2017 | Belgium | Environment Sensor | HMM | H: 92.54% L: 19.1%. | - | |
| [80] | 2017 | Australia | Infrared | K* C4.5 MLP | H: 98.15% L: 83.68% | 3 | K* is an adaption of KNN thermal images low-resolution thermal sensors |
| [81] | 2017 | China | Camera | SVM CNN K-means | 95.3% | 12 | low computational cost high precision |
| [82] | 2017 | China USA Singapore | Wireless Communication | ELM | 98.85% | 32 | accurate, reliable, cost-effective and non-intrusive |
| [2] | 2016 | Australia | Infrared | K*(KNN) C4.5 ANN SVM Linear Regression Naive Bayes | H: 82.56% L: 49.74% | 3 | thermal detector array privacy-preserving low-cost non-invasive energy efficient |
| [83] | 2016 | Korea | Environment Sensor | Decision Tree HMM | H: 93.2% L: 85.0% | 5 | occupancy prediction |
| [84] | 2016 | Singapore | Environment Sensor | ELM | 94% | 28 | locally smoothed data |
| [85] | 2016 | Denmark | Camera | Waterfilling Algorithm | H: 100% L: 98.4% | 3 | |
| [86] | 2016 | UK Singapore China | Wireless Communication | CRF SVM | ME: H: 1.615 L: 0.560 | 25 | inference accuracy and robustness |
| [1] | 2016 | China | Camera | Adaboost Algorithm CNN SVM | H: 97% L: 50% | 82 | low resolution body occlusion unconstrained imaging viewpoints |
| [87] | 2016 | UK USA | Infrared | HMM | H: 99% L: 59% | 14 | low-cost |
| [88] | 2016 | Singapore | Environment Sensor | ELM SVM ANN KNN LDA CART | H: 0.7390 L: 0.6100 | 10 | |
| [89] | 2016 | Singapore | Camera | SVM | 99% | - | public locations |
| [90] | 2015 | Italy | Depth Sensor | Adaboost Classifier | MRE H: 6.4% L: 1.4% | 40 | higher level of privacy preservation |
| [91] | 2015 | Netherlands | Device | 100% | 13 | chair sensors viable, low cost, reliable | |
| [92] | 2014 | Finland | Device Camera | H: 97% L: 80% | 150 | ||
| [93] | 2014 | China | Camera | SVM | 8 | PTZ camera detection and tracking robust for counting people | |
| [94] | 2014 | Italy Switzerland | Camera | CNN | RMSE H: 8.55 L: 6.46 | 80 | |
| [95] | 2013 | China | Camera | Haar–Adaboost Classifiers SVM | H: 92.03% L: 86.21% | 8 | fusion of vision sensors |
| [96] | 2013 | USA | Infrared | KNN ANN Linear Regression | RMSE 0.35 persons | 3 | low-cost low-power thermal sensor |
| [97] | 2013 | Denmark | Infrared | Automatic Threshold Method Based on Maximum Entropy | 95.56% | 13 | thermal camera |
| [98] | 2012 | Denmark | Infrared | Automatic Threshold Method Based on Maximum Entropy | H: 99.83% L: 88.24% | 15 | thermal camera prevent privacy |
| [99] | 2012 | Eindhoven | Infrared | Direction-based Algorithm Probabilistic Distance-based Algorithm | 3 | inexpensive and easily installed | |
| [100] | 2011 | France | Camera | Classifiers | H: 93% L: 83% | 2 | detect human |
Publisher’s Note: MDPI stays neutral with regard to jurisdictional claims in published maps and institutional affiliations. |
© 2022 by the authors. Licensee MDPI, Basel, Switzerland. This article is an open access article distributed under the terms and conditions of the Creative Commons Attribution (CC BY) license (https://creativecommons.org/licenses/by/4.0/).
Share and Cite
Zhao, L.; Li, Y.; Liang, R.; Wang, P. A State of Art Review on Methodologies of Occupancy Estimating in Buildings from 2011 to 2021. Electronics 2022, 11, 3173. https://doi.org/10.3390/electronics11193173
Zhao L, Li Y, Liang R, Wang P. A State of Art Review on Methodologies of Occupancy Estimating in Buildings from 2011 to 2021. Electronics. 2022; 11(19):3173. https://doi.org/10.3390/electronics11193173
Chicago/Turabian StyleZhao, Liang, Yuxin Li, Ruobing Liang, and Peng Wang. 2022. "A State of Art Review on Methodologies of Occupancy Estimating in Buildings from 2011 to 2021" Electronics 11, no. 19: 3173. https://doi.org/10.3390/electronics11193173
APA StyleZhao, L., Li, Y., Liang, R., & Wang, P. (2022). A State of Art Review on Methodologies of Occupancy Estimating in Buildings from 2011 to 2021. Electronics, 11(19), 3173. https://doi.org/10.3390/electronics11193173