Article

A Deep Learning-Based Approach for the Diagnosis of Acute Lymphoblastic Leukemia

1
Department of Computer Science, Lahore Leads University, Lahore 054990, Pakistan
2
National Center for Bioinformatics, Quaid-i-Azam University, Islamabad 15320, Pakistan
3
Software College, Northeastern University, Shenyang 110169, China
4
Shenzhen Institute of Advanced Technology, Chinese Academy of Sciences, Shenzhen 518000, China
5
Cybersecurity Department, College of Computer Science and Engineering, University of Jeddah, Jeddah 23218, Saudi Arabia
6
Deanship of Scientific Research, Umm Al-Qura University, Makkah 21955, Saudi Arabia
7
Zoology Department, Faculty of Science, Mansoura University, Mansoura 35516, Egypt
8
Electrical Engineering Department, Faculty of Engineering and Technology, Future University, New Cairo 11835, Egypt
*
Authors to whom correspondence should be addressed.
Electronics 2022, 11(19), 3168; https://doi.org/10.3390/electronics11193168
Submission received: 3 September 2022 / Revised: 23 September 2022 / Accepted: 26 September 2022 / Published: 2 October 2022
(This article belongs to the Special Issue Intelligent Data Sensing, Processing, Mining, and Communication)

Abstract

:
Leukemia is a deadly disease caused by the overproduction of immature white blood cells (WBS) in the bone marrow. If leukemia is detected at the initial stages, the chances of recovery are better. Typically, morphological analysis for the identification of acute lymphoblastic leukemia (ALL) is performed manually on blood cells by skilled medical personnel, which has several disadvantages, including a lack of medical personnel, sluggish analysis, and prediction that is dependent on the medical personnel’s expertise. Therefore, we proposed the Multi-Attention EfficientNetV2S and EfficientNetB3 state-of-the-art deep learning architectures using transfer learning-based fine-tuning approach to distinguish the normal and blast cells from microscopic blood smear images that both are pretrained on large-scale ImageNet database. We simply modified the last block of both models and added additional layers to both models. After including this Multi-Attention Mechanism, it not only reduces the model’s complexities but also generalizes its network quite well. By using the proposed technique, the accuracy has improved and the overall loss is also minimized. Our Multi-Attention EfficientNetV2S and EfficientNetB3 models achieved 99.73% and 99.25% accuracy, respectively. We have further compared the proposed model’s performance to other individual and ensemble models. Upon comparison, the proposed model outclassed the existing literature and other benchmark models, thus proving its efficiency.

1. Introduction

Both children and adolescents are affected by leukemia, which is a malignancy of blood cells in the bone marrow [1]. Bone marrow is a soft fatty tissue found inside bone cavities. Hematopoietic cells, fat cells, blood vessels, fibrous tissue, and fluid are all found in the bone marrow. Blood cells were created by stem cells. The growth of blood stem cells leads to the formation of myeloid or lymphoid stem cells. Lymphocytes are a type of WBC produced by lymphoid stem cells. Myeloid stem cells, on the other hand, create platelets, granulocytes, red blood cells, and monocytes. WBC also includes monocytes and granulocytes. Leukemia is caused by the immature production of WBC by stem cells. A single immature or blast cell can generate billions of other blast cells [2].
Leukemia is classified as acute or chronic depending on how quickly it progresses. Based on the kind of blood cell involved, acute leukemia is split into acute lymphoblastic leukemia (ALL) and acute myeloid leukemia (AML). ALL is the most frequent form of leukemia in children. In ALL, lymphocytes, a kind of white blood cell (WBC), do not mature properly into normal cells and replicate uncontrollably in the bone marrow [3]. By invading blood cells, cancerous cells can spread to other organs and cause harm to the entire body [4].
According to [5], new cases of acute lymphoblastic leukemia in 2022 are estimated at 6660 of which 1660 can die from this disease in the United States, including both children and adults. Early detection of ALL greatly improves treatment options and the likelihood of the patient surviving. Different treatment options are available based on the patient’s symptoms and risk level, including chemotherapy, radiation, anti-cancer drugs, or a combination of these [6]. Treatment options are determined by a number of criteria, including the kind and severity of the condition, the patient’s age, and his or her overall health. In addition, people in remission may benefit from stem cell transplantation. Chemotherapy is the most common treatment for ALL, intending to prevent the disease from causing damage to the central nervous system (CNS) [7]. Cell morphology, cytochemistry, cytogenetics, and molecular characteristics are all examined. The differentiation of healthy and non-healthy cells from each other includes the shape, size, and texture of the cell nucleus, cytoplasm size, and cytoplasm condition, number of nucleoli in the nucleus and color spreading in the nucleus [8]. The signs and symptoms of ALL can range from minor to severe life-threatening symptoms, such as fever, gum bleeding, exhaustion, dizziness, and bone pain, which show the amount of bone marrow involvement. A bone marrow aspiration and biopsy, a complete blood count (CBC), and a peripheral blood smear are required to confirm an ALL diagnosis [9].
Nowadays Convolution Neural Networks are a very optimal choice for the diagnosis and classification of normal and blast cells in medicinal imaging applications [10,11]. To use CNNs architecture requires a significant amount of data and computer resources to train. The dataset may be insufficient to train a CNN from scratch in many circumstances. Transfer learning is a well-defined technique to use CNN models in this situation and also minimize the computational cost [12]. Transfer learning is a method for using a previously trained machine learning model on a new dataset, while assuming that the original model’s discriminative abilities will still be helpful. Because most high-performing models have previously gone through a comprehensive training procedure, adapting to a new dataset will likely take less time. For the same reasons, fewer data will be required to fine-tune the model on a target dataset, hence big data sets may not be required to attain high performance. Furthermore, since the rebirth of deep learning, there have been several publicly available pre-trained machine learning models for a range of applications that have been rigorously evaluated and benchmarked [13]. Finding new methods to apply these models to new challenges can thus be a cost-effective way to create high-performing models.
A.
CONTRIBUTIONS
The main contributions of our study are as follows:
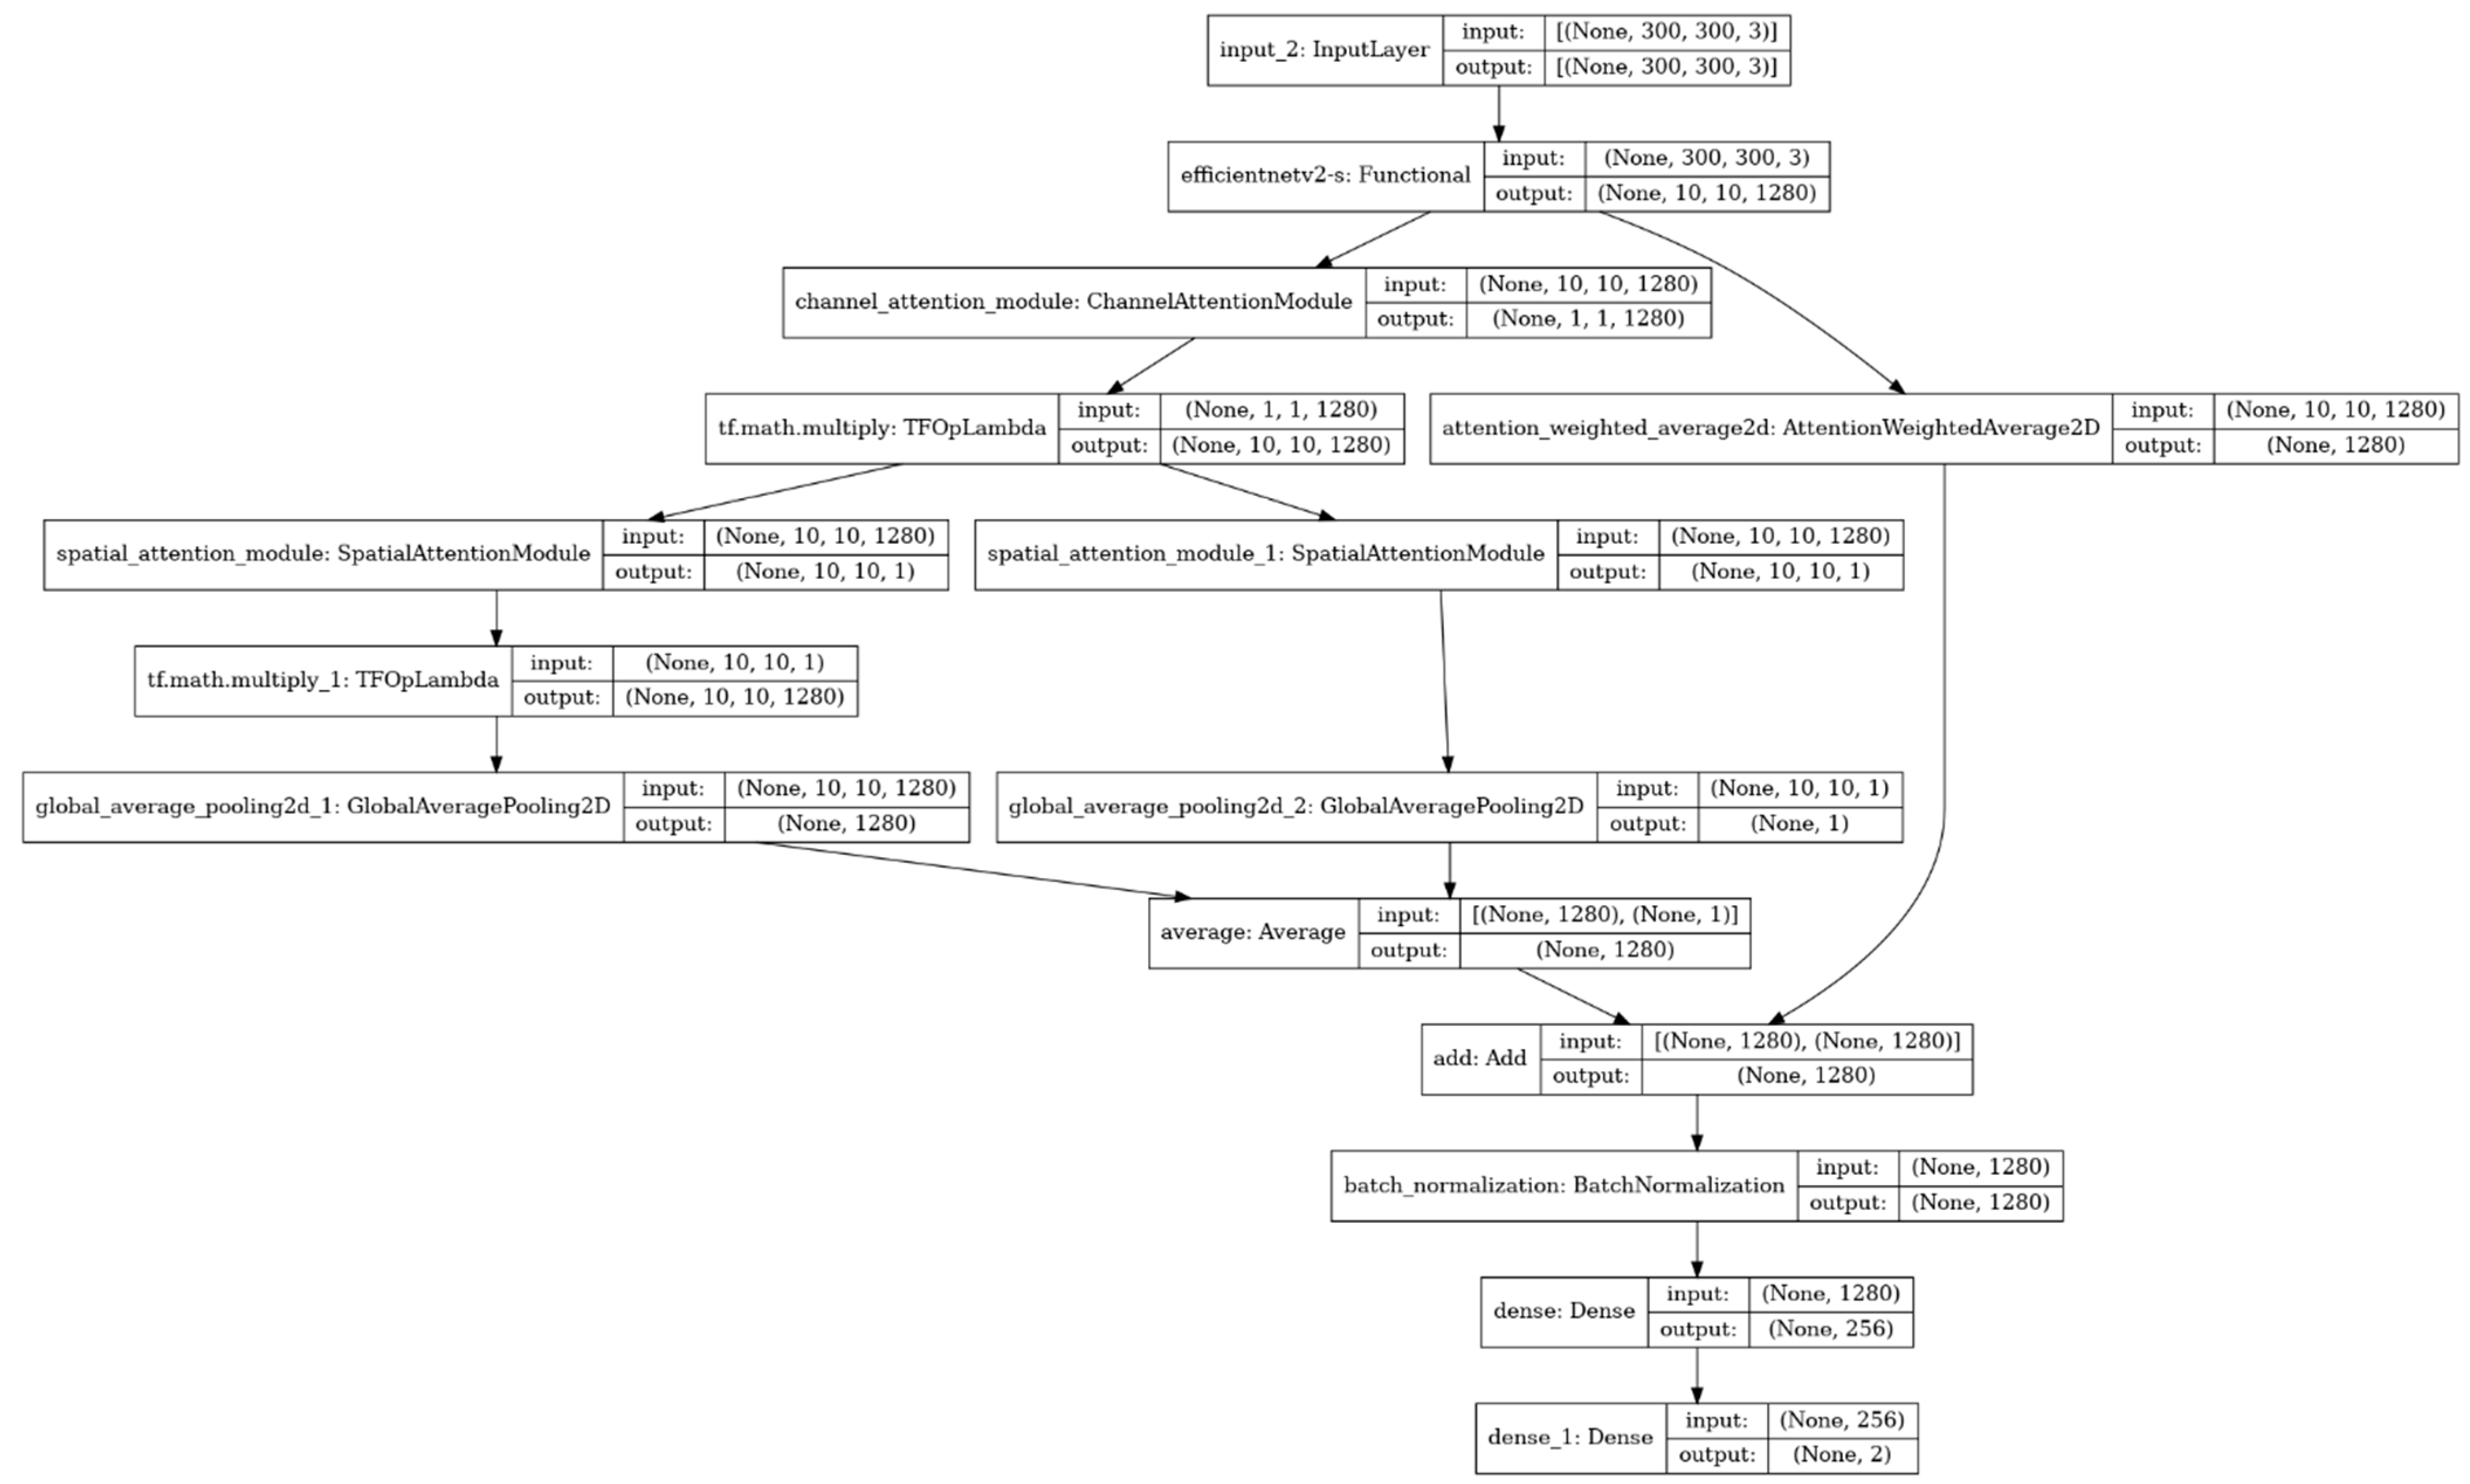
    • We proposed the Multi-Attention EfficientNetB3 and EfficientNetV2S models to distinguish the ALL (unhealthy cells) and hem (healthy cells) in this article;
    • We simply modified the last block of both models and added the Multi-Attention Layers in both models. After including this Multi-Attention mechanism not only reduces the model’s complexities but also generalizes its network quite well;
    • We added a crop function to reduce the unwanted part of the image;
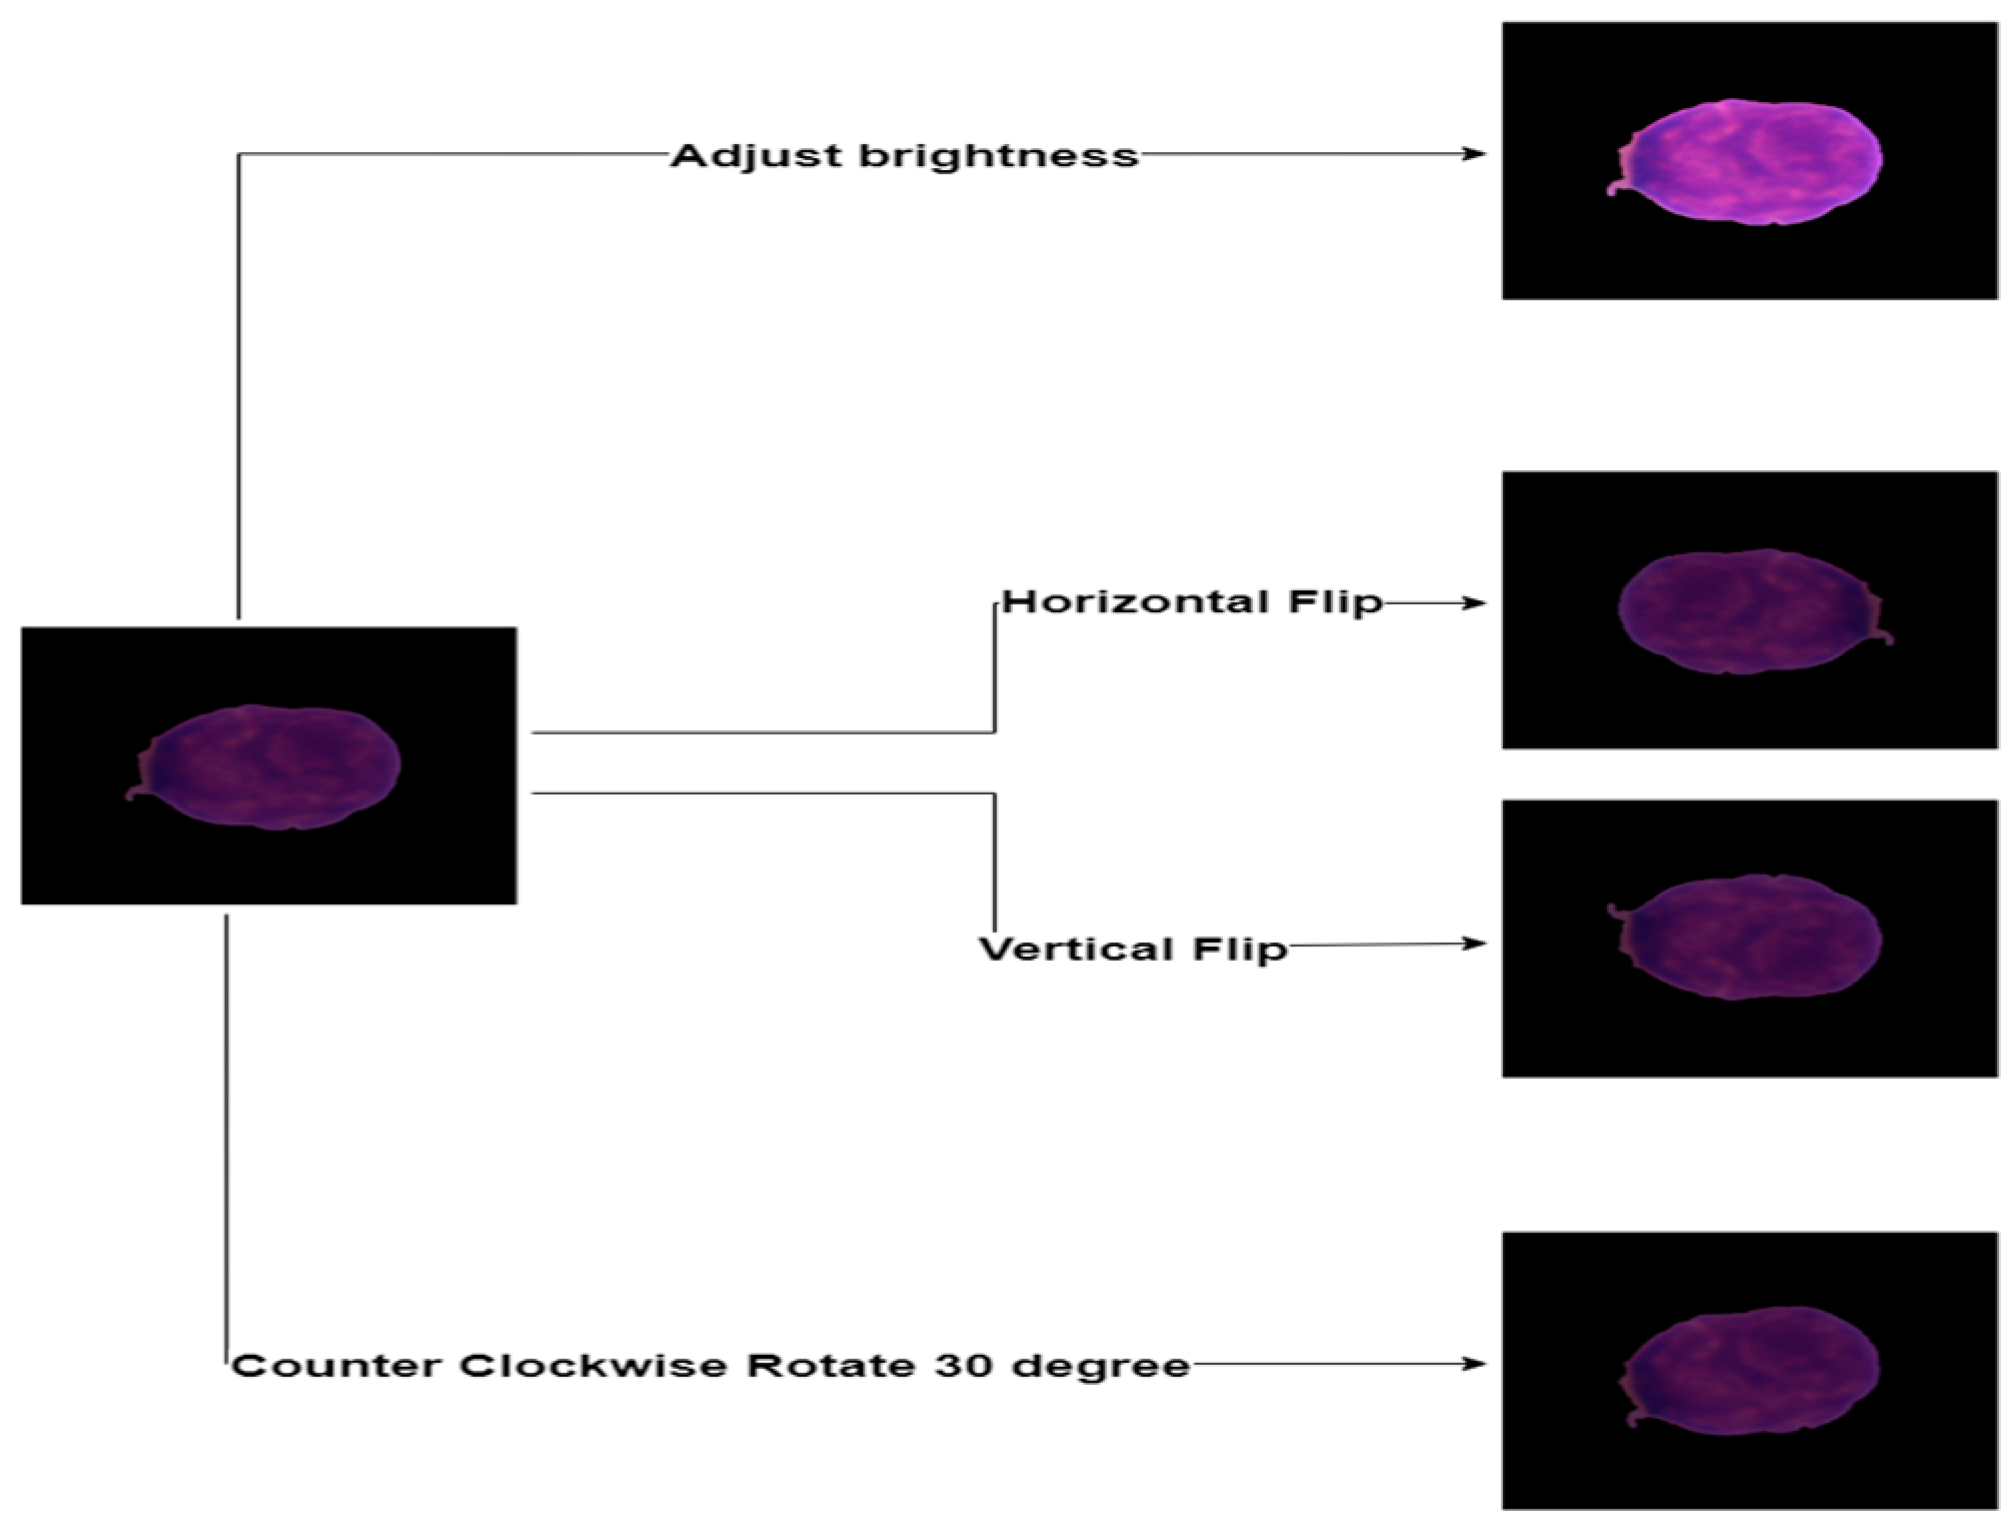
    • To address the issue of unbalanced data, we also applied the augmentation technique to expand the dataset;
    • Our Multi-Attention EfficientNetV2S and EfficientNetB3 models achieved the 99.73% and 99.25% accuracy, respectively, on the test dataset for ALL and hem cells;
    • We also compared our model to other CNN models that were previously used for the detection of normal cells and cancerous cells from blood smear images but our Multi-Attention EfficientNetV2S and EfficientNetB3 models provided a higher classification accuracy.
B.
ORGANIZATION
Our Section 2 includes the literature review of previously used techniques to classify the ALL from microscopic blood smear images. The Section 3 includes the data set description, data preprocessing, augmentation techniques and also a brief discussion of EfficientNetB3 and EfficientNetV2S pre-trained CNN models. The Section 4 of our research paper includes the experiment results and discussion. Finally, in Section 5, we concluded this this research article along with future work.

2. Related Work

Deep learning has gained the attention of the world through its application in different sectors: braintumor detection [14], intrusion detection [15,16,17,18], and multi-object fuse detection problems [19]. Kasani et al. [9] presented the ensemble approach to classifying cancerous cells and normal cells based on transfer learning. They also applied the normalization technique to change the pixel value between 0 and 1 to overcome the error during training. They used different data augmented techniques to solve the problem of imbalanced data. The ensemble model that consisted of NASNetLarge and VGG16 achieved 96.58% overall accuracy. Zakir Ullah et al. [20] proposed the state-of-the-art VGG16 architecture to detection of healthy and blast cells from blood smear images. They used the Efficient Channel Attention (ECA) module with VGG16 to learn the semantic features that concentrates on the image’s instructive region. They used different image preprocessing steps like data augmentation, image resizing and data normalization. VGG16 + ECA model obtained an overall accuracy 91%.
Computers can directly interpret FFR values from coronary pictures obtained from CT angiography thanks to a revolutionary deep neural network approach suggested by the researchers [21], known as TreeVes-Net. Their proposed system recorded coronary geometric information regarding blood fluid-related data with the help of a tree-structured recurrent neural network (RNN). With tests on 13,000 artificial coronary trees and 180 actual coronary trees from clinical patient data, they obtained 0.92 and 0.93 in the area under the ROC curve AUC.
To create an LGE-equivalent image segment for diagnosis-related tissues, the author [22] presented Progressive Sequential Causal GANs. For this, PSGAN presented three matchless characteristics, i.e., a progressive framework, a sequential casual learning network and two specifically self-learning loss terms (synthesis and segmentation). The researchers obtained an overall 97.17% segmented accuracy with a 0.96 correlation coefficient for scar ratio.
A new method that named PMD, was suggested as a medicalmodality in a research study [23] to initially permit the VBDI in each of the several intracoronary imaging modalities. The PMD allows the use of a MIMT to solve a typical SIST learning issue, a plan for enhancing vessel environment adaptation heterogeneity. The PMD is introduced by the use of a specifically created structure-deformable neural network that broadens the information base for system learning due to the lack of clinical data and the perception that areas of vessels with varying sizes using a new bidirectional pyramidal network. Results of the wide experiments can exemplify the efficacy of the PMD approach in intracoronary photographs.
Jing et al. [24] introduced the VIT-CNN ensemble approach that combines the EfficientNetB0 and vision transfer model to deal with b-lymphoblast detection. They convert the size of the image and also normalize the image to avoid overfitting. They used a different enhancement data sampling (DEDS) technique to increase the images in the dataset. VIT-CNN ensemble network attained 99.03% accuracy on the test set. Sahlol et al. [2] presented a hybrid technique that combines a CNN-based VGGNet model with the Salp Swarm algorithm (SASSA). In this hybrid approach, a pre-trained VGG-Net model was used to extract features, while the SASSA was used to not only pick significant features but also to eliminate noisy features and to improve the model’s accuracy. For classification of normal and abnormal cells, SVM was used. SVM classifier achieved 96.11% accuracy on the ALL-IDB2 dataset and achieved 87.9% accuracy on the ISBI-2019 dataset.
For the segmentation purpose of the WBC nucleus, UNET and UNET++-based techniques was introduced in recent years to get a better classification of normal and blast cells [25,26]. Using microscopic pictures obtained from the ALL-IDB dataset, Genovese et al. [27] introduced a traditional machine learning strategy on the CNN VGG-16 model for ALL detection. The authors of [28,29] proposed the AlexNet model for the detection of ALL from microscopic blood smear images based on transfer learning. Techniques for enhancing data are also presented to address the issue of insufficient data.
Mustafa et al. [30] proposed a majority voting ensemble technique that combines the four models (InceptionV3, ResNet-V2, Xception, DesNet121) to classify the normal and blast cells from the ISBI-2019 dataset. After preprocessing and augmentation, the ensemble model achieved 98.5% accuracy. Genovese et al. [31] introduced two HistoCNN and HistoNet models that is based on CNN (VGG-16, ResNet-18) architectures. The HistoNet model adopted the features of the HistoCNN model based on transfer learning and applied it to the ALL-IDB dataset to classify the normal and blast cells. K-mean clustering, C-mean, Marker Controlled Watershed and histogram-based thresholding techniques were used for segmentation of the nucleus from WBC [32,33]. Authors proposed both individual and ensemble models for detection of ALL cancer from microscopic blood smear images but ensemble models attained a higher accuracy than individual models. ResNet101-9 ensemble model [34] achieved 85.11% accuracy and the weighted ensemble of network model [35] achieved 88.3% accuracy.

3. Methods and Materials

A.
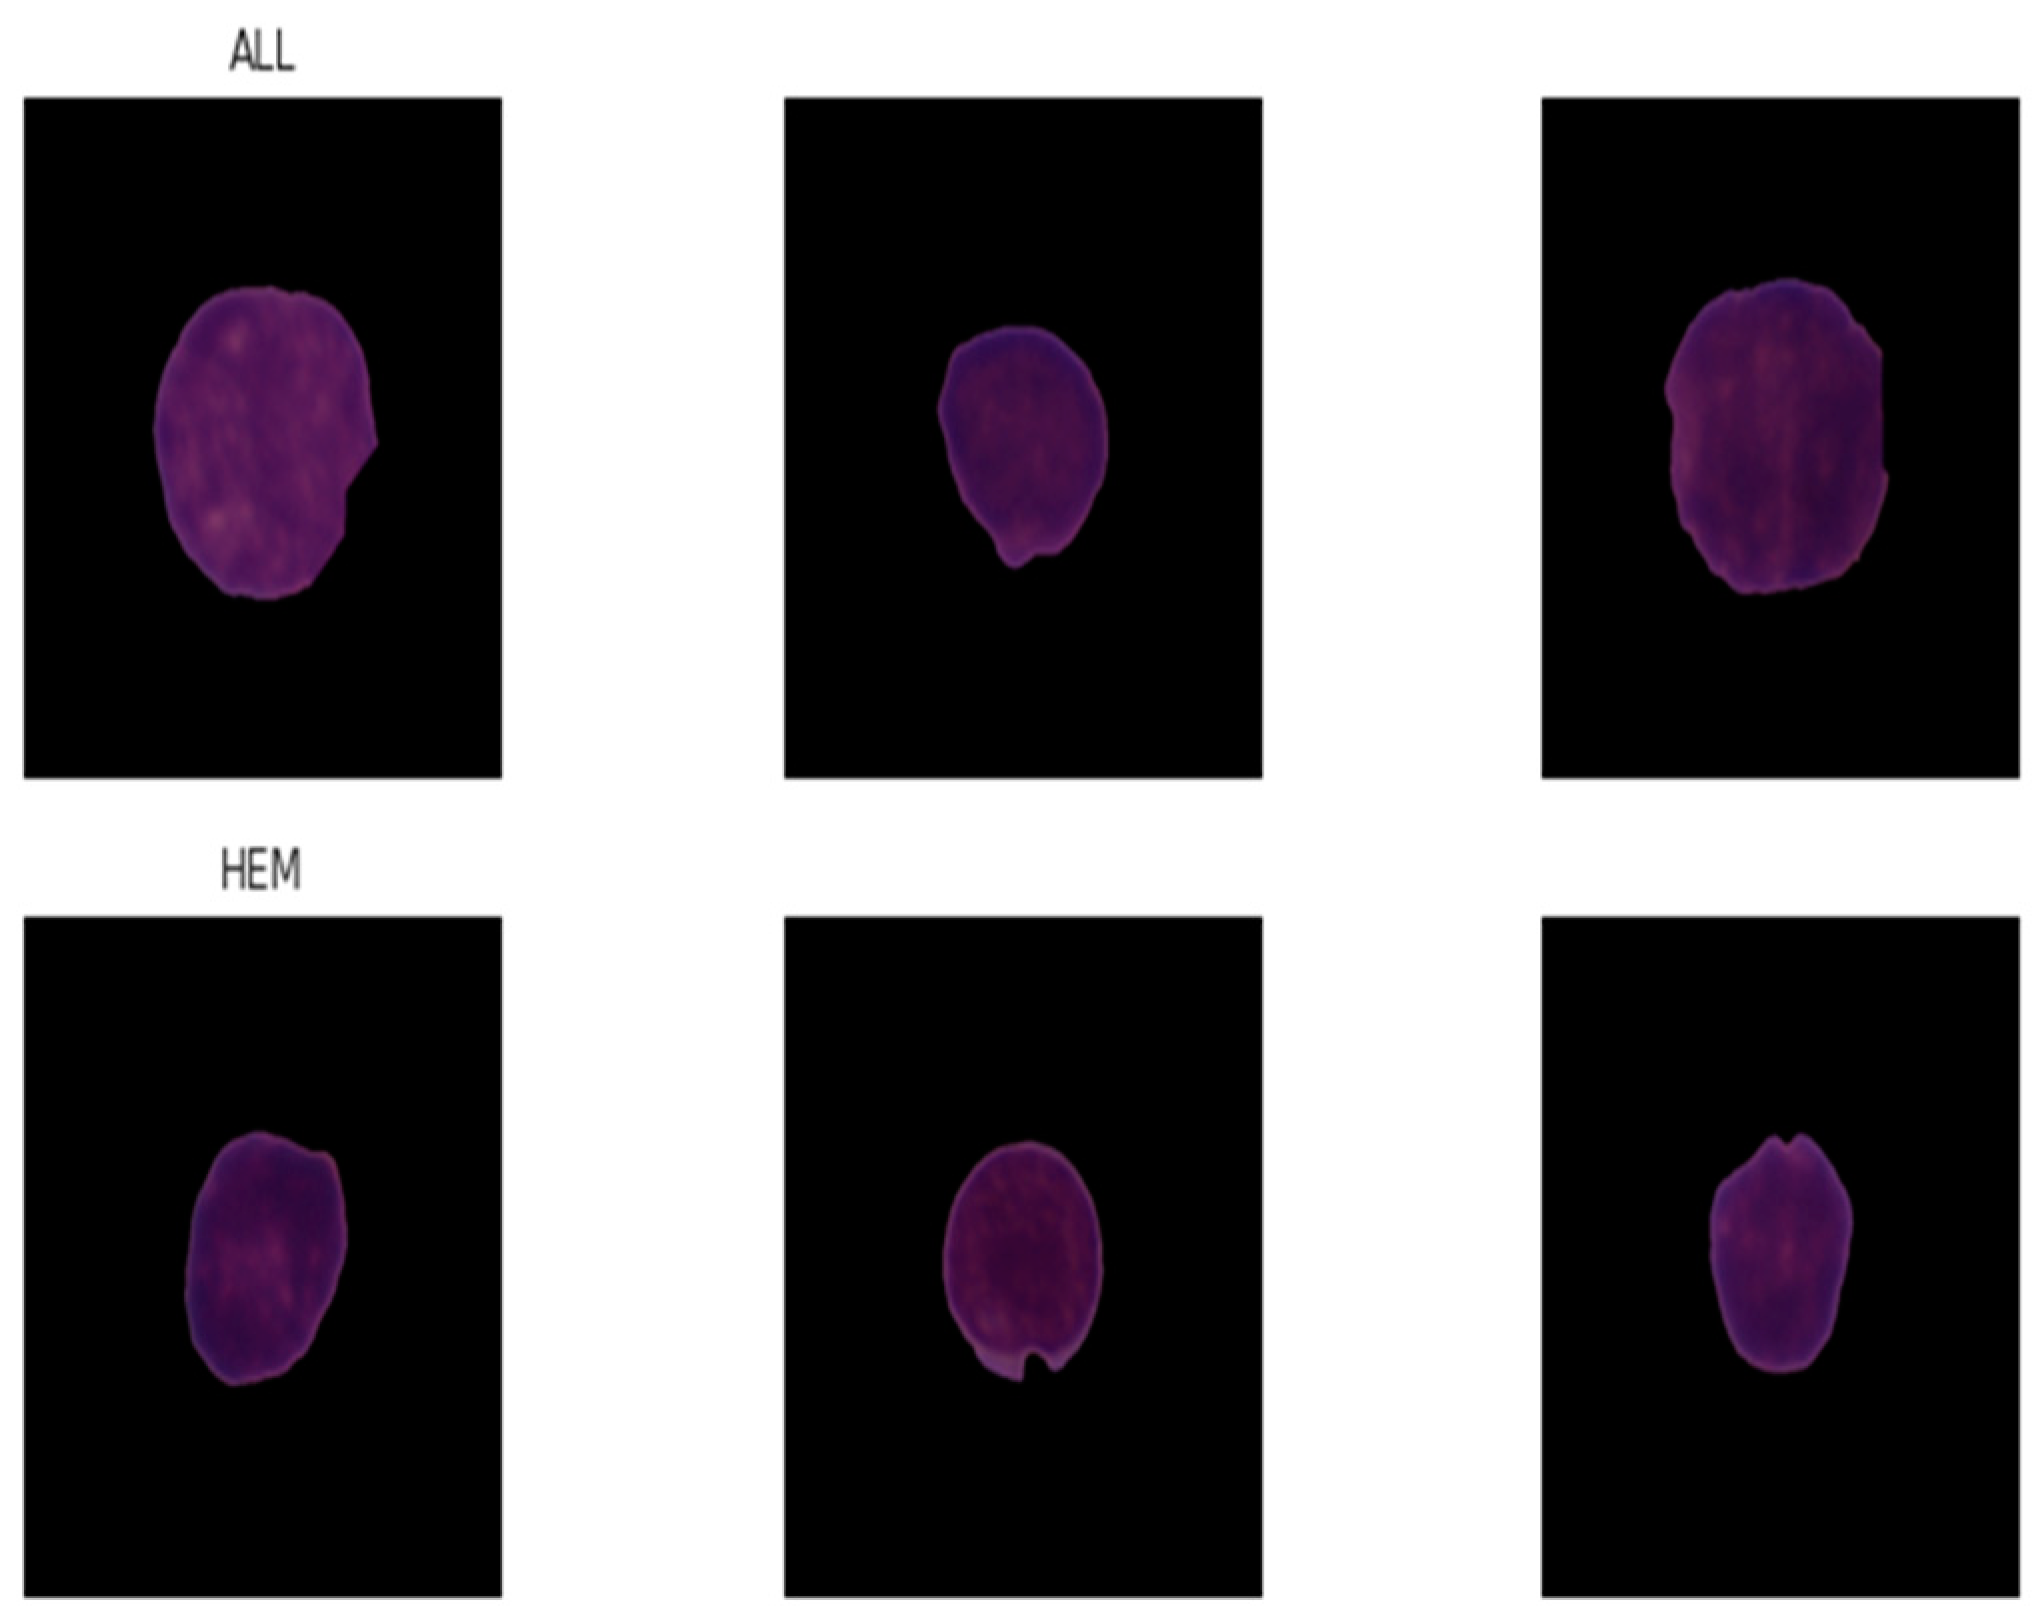
DATASET PREPROCESSING AND AUGMENTATION
The size of the images in the dataset is 450 × 450 pixels. We used the crop function to minimize the unwanted part of the image. After cropping and resizing, the size of the image was reduced to 300 × 300 resolution. We have not applied the normalized technique to the image database because the EfficientNet model expects a pixels range of 0 to 255 so no scaling is required. The dataset is imbalanced because cancer images have doubled to healthy images that can cause problems during training. The class of small quantity of images learn fewer features than the class of large quantity of images that not a good choice to create the best model.
Data augmentation is a very popular technique that is not only used to increase the data images but also to produce variations in the dataset, such as rotation, contrast enhancement, the mirror of the image using horizontal and vertical flips, zooming the image and much more. We used different augmentation techniques to solve the problem of imbalanced data. We rotated the image counter-clockwise by 30 and 20 degrees and adjusted brightness randomly [0.2 to 1.2]. We also applied horizontal and vertical flips to increase our dataset. Figure 1 shows the augmented techniques that apply on the dataset. After augmentation, our dataset was balanced and each class contained 20,000 images.
B.
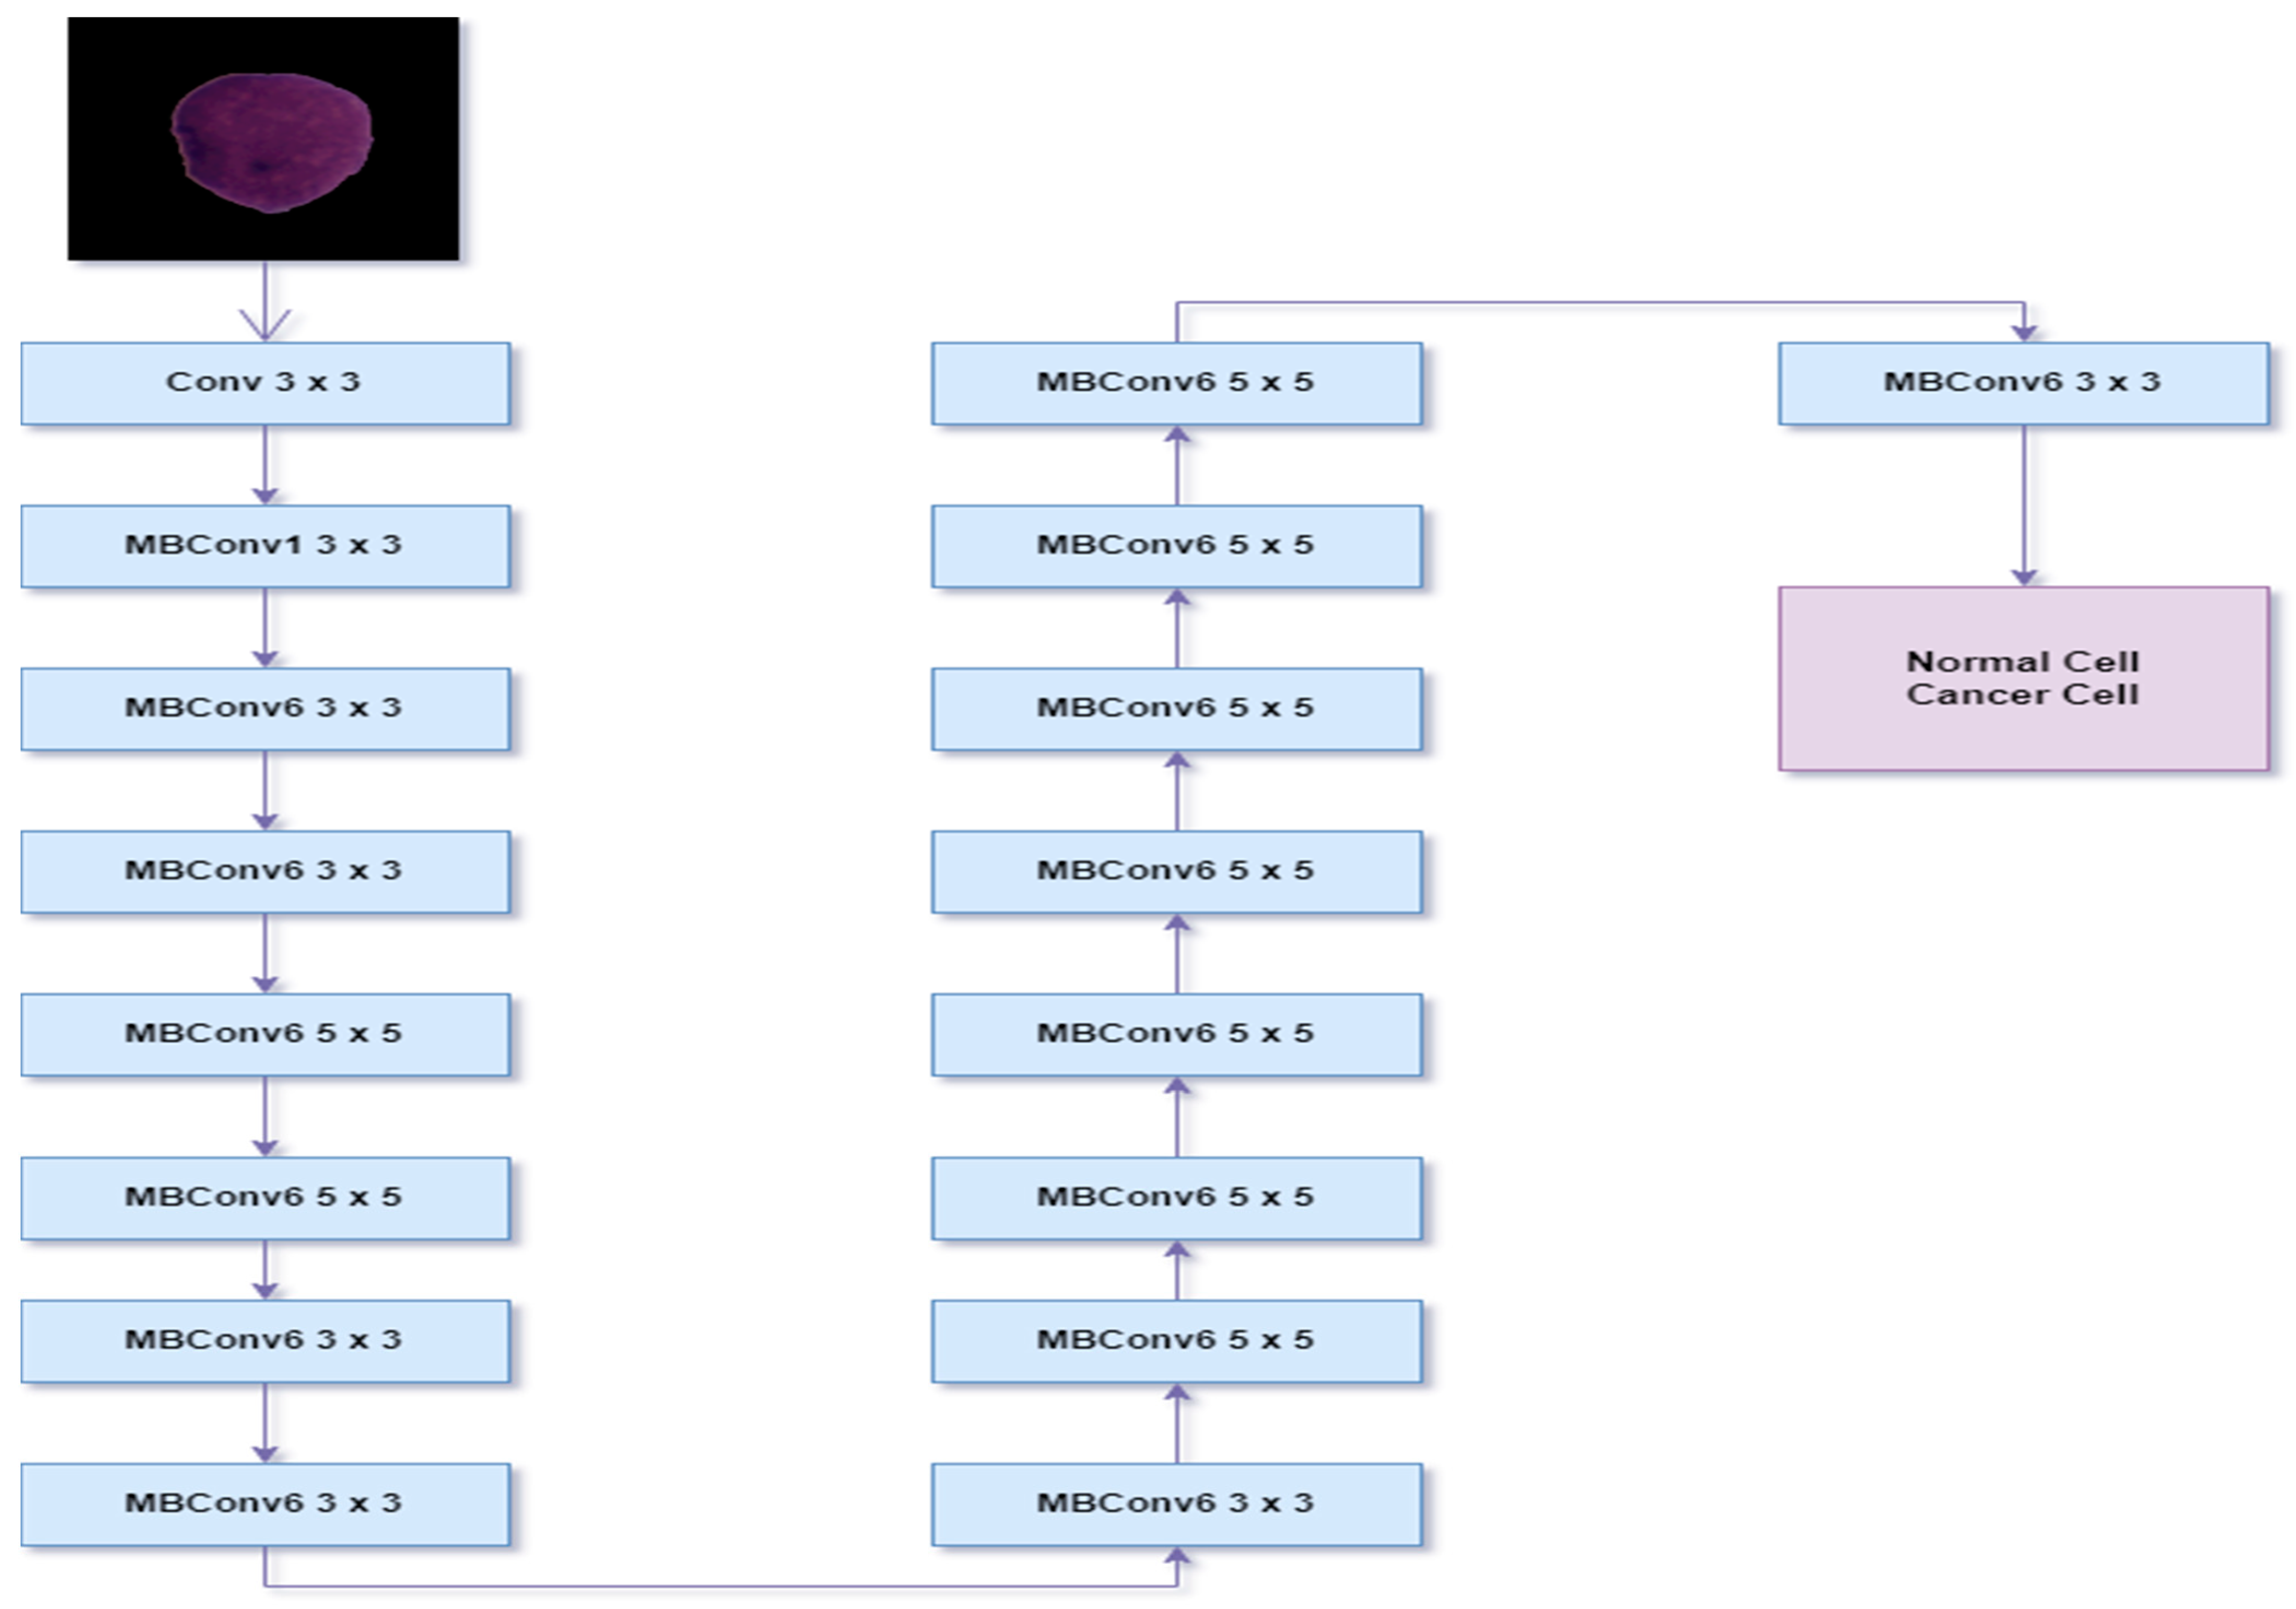
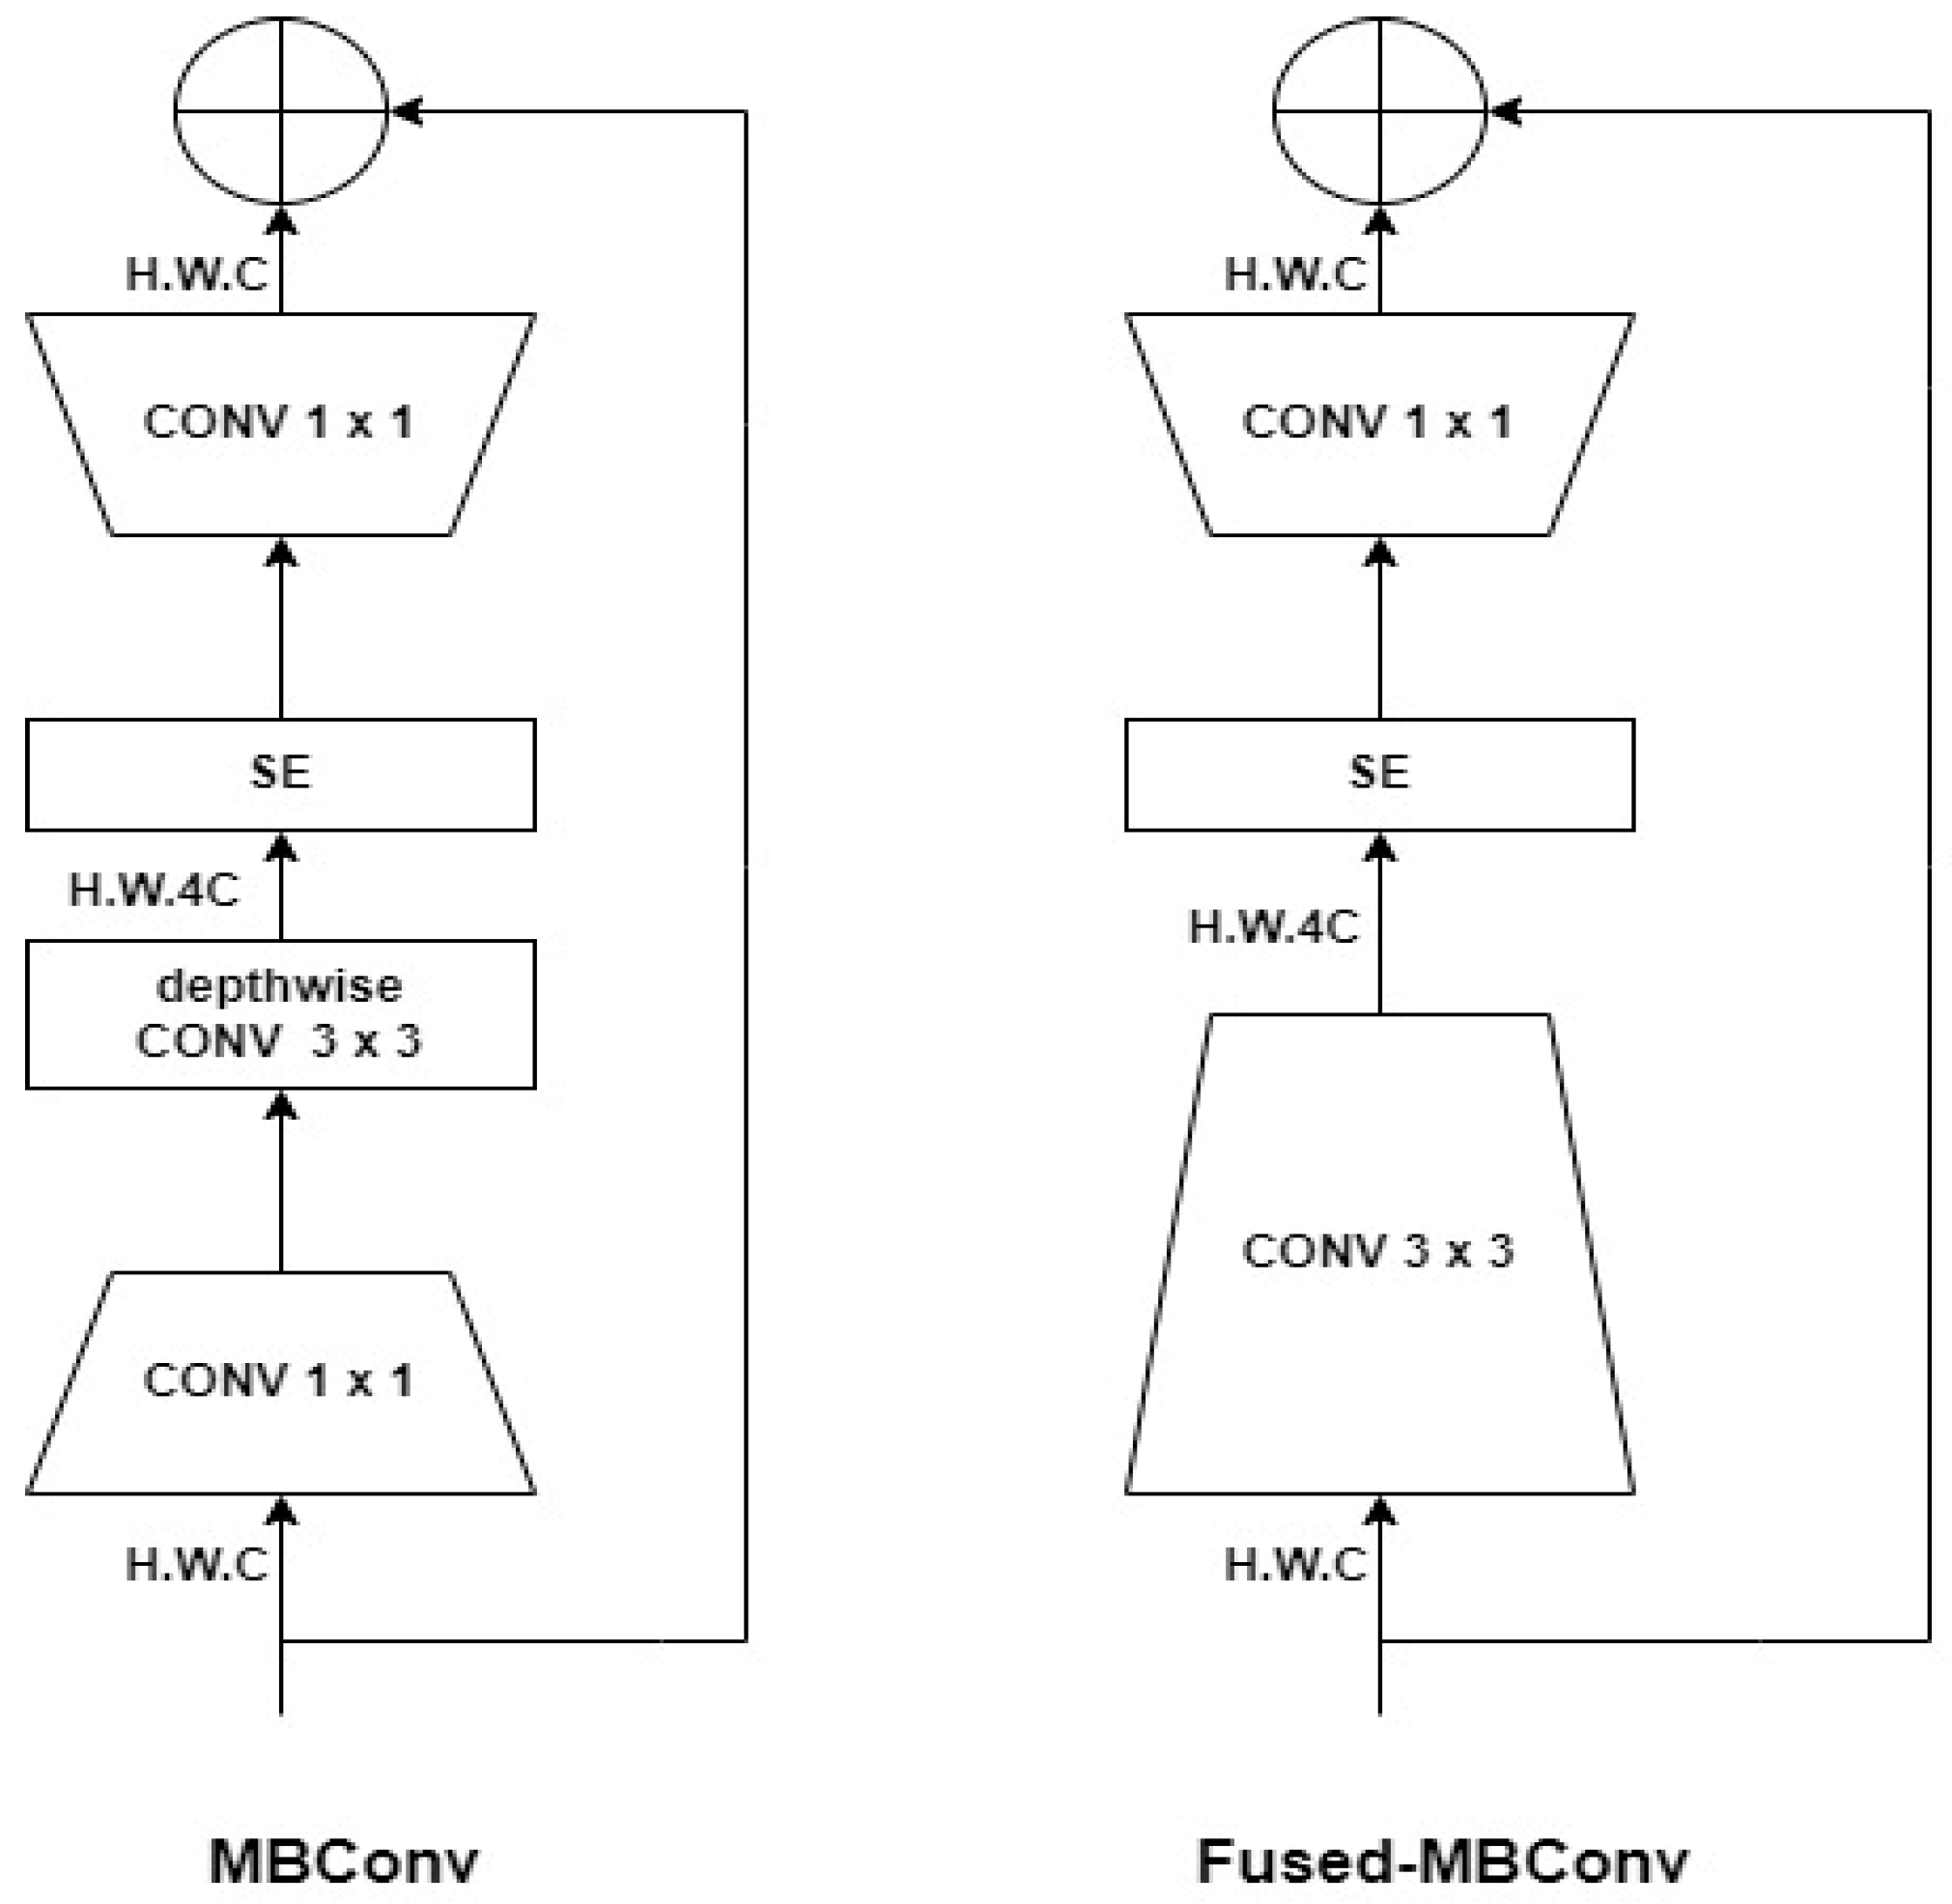
EFFICIENTNET CNN MODEL
Mingxing Tan et al. [36] introduced EfficientNet in their paper “EfficientNet: Rethinking Model Scaling for Convolutional Neural Networks” in 2019. The purpose of this paper was to look at how to scale neural network architectures to improve accuracy. The depth, width, and resolution of convolutional neural networks can all be adjusted to increase or decrease their size. The number of concealed layers is referred to as depth, and it can be changed to meet the problem.
The EfficientNet is based on a revolutionary CNN model scaling method. It makes use of an easy compound coefficient that works well. EfficientNet equally scales each dimension with a set of scaling factors, unlike traditional techniques that scale network characteristics, such as width, depth, and resolution. In practice, scaling individual dimensions improves model performance, but balancing all network dimensions concerning available resources improves overall model performance greatly. The given equations were devised by the authors to evenly scale up the depth, width, and resolution of the coefficient.
depth:d = αφ
width:w = βφ
resolution:r = γφ
s.t.α · β2 · γ2 ≈ 2
α ≥ 1, β ≥ 1, γ ≥ 1
The coefficient φ is a user-specified coefficient that regulates how various novel resources are accessible for model scaling, and α, β, and γ are constants that can be discovered by a brief grid search and define how these additional resources should be assigned to the network depth, width, and resolution, accordingly.
The EfficientNet model family’s basic building piece is mobile inverted bottleneck convolution (MBConv). MB Conv is built on MobileNet [37] model concepts. EfficientNet provides same accuracy on ImageNet database with small in size than other models. In this research, we used the EfficientNet-B3 CNN model. This EfficientNet variant was chosen because it offers a good combination of processing resources and precision. Furthermore, instead of employing the ReLU activation function, this network employs the Swish activation function, as shown in Figure 2, which has a shape that is similar to the ReLU and Leaky ReLU functions, and so shares some of their performance benefits. Its activation function is smoother than that of the other two.
The equation of the Swish function is shown in Equation (6):
f s w i s h x   =   x 1 +   e β x
where β ≥ 0 is a parameter that can be learned when the CNN model is being trained. As can be seen in Figure 2, f s w i s h becomes the linear activation function if β is equal to 0, and as, β goes to ∞, f s w i s h resembles the ReLU function but is smoother. Figure 3 shows the complete procedure of our Multi-Attention Mechanism. However, Figure 4 depicts a complete structure of the EfiicientNetB3 Model.
C.
EFFICIENTNET V2S
Mingxin Tan and Quoc V. Le [38] introduced EfficientNetV2, a high-class model that is a significant increase over EfficientNet in terms of training speed and a modest improvement in terms of accuracy over EfficientNet.
EfficientNetV2 employs progressive learning, which implies that although the image sizes are initially tiny when the training begins, they gradually rise in size. This approach is based on the observationthatas mage size is increases, EfficientNets’ training rates slow down. Progressive learning, on the other hand, is not a novel notion; it has been utilized before. The issue is that, in its prior usage, the same regularization technique was applied to images of various sizes. According to the authors of EfficientNetV2, this reduces network capacity and performance. To address this issue, they dynamically increase the regularization along with the image sizes.
EfficientNets use a convolution layer known as the “depth-wise convolution layer,” which has fewer parameters and FLOPS but cannot fully exploit modern accelerators (GPU/CPU). To address this issue, recent research titled “MobileDets: Searching for Object Detection Architectures for Mobile Accelerators” proposes a new layer called“Fused-MB Conv layer” to overcome the problem. In this case, EfficientNetV2 employs this new layer. However, because the fused layers have a larger number of parameters, they cannot simply replace all of the old MB Conv layers with the fused. To dynamically determine the best mix of fused and conventional MB Conv layers, they deploy training-aware NAS. The results of NAS reveal that early on, replacing portions of the MB Conv layers with fused layers improves performance with smaller models. It also shows that it is advantageous to have a lower expansion ratio for the MB Conv layers (across the network). Finally, smaller kernel sizes with more layers are preferable.
A complete structure of MBConv and Fused-MBConv is given in Figure 5. EfficientNet [36] grows up all phases uniformly by employing a straightforward compound scaling approach. According to the authors of EfficientNetV2, this is unnecessary because not all of these stages require scaling to increase performance. That’s why, in subsequent phases, they accept non-uniform scaling method to gradually add more layers. Since EfficientNets have a propensity to aggressively scale up image sizes, they also incorporate a scaling rule to set a maximum image size limit. Despite being 6.8 times smaller, EfficientNetV2 trains up to 11 times more quickly than EfficientNetV1.

Multi-Attention Mechanism

The machine learning field uses the attention technique to pay attention to various components of an input vector to identify long-term dependencies. We introduced a Multi-Attention Module that is inspired by Convolutional Block Attention Module (CBAM) and another weighted Attention Average Module. Both attention module works parallel and merges at the end. We simply modified the last block of both models and added the attention layers in both models. Including this Multi-Attention Mechanism not only reduces the model’s complexities and also generalizes its network quite well. After merging the Multi-Attention Layers, we passed the output into another layer that called fully-connected layer (256 elements)withelu as the activation function. The final layer of our model has included 2 outputs with softmax as an activation function.
In 2018, the authors [39] introduced a CBAM that is based on a dual attention mechanism. By combining channel-wise attention with spatial attention, it learns the informative features. The modules are arranged sequentially, starting with the channel-wise module and moving on to the spatial module.
Channel attention works on the image to produce meaningful information that utilizes the inter-channel relationship of features. Channel attention is computed after a little modification as:
  M c   F =   δ   ( W 0 ( F a v g c ) + W 0 ( F m a x c )   )
  M c   F is the final output of our channel attention module. δ   is denoted as sigmoid function, where W 0 is the weight of the multi-layer perception (MLP) with one hidden layer. Both F a v g c and F m a x c are denoted as average pooling and max pooling features.
The spatial attention module works differently from the channel attention and concentrates on the image’s instructive region. The spatial attention is computed after a little modification as:
  M s   F = δ   ( f 3 × 3 ( [ F a v g c ; F m a x c ] ) )
f 3 × 3 is the convolutional operation with 3 × 3 filter size, δ   is denoted as sigmoid function and both F a v g c and F m a x c are denoted as average pooling and max pooling features.
We also modified the end part of its spatial module by integrating the Global Weighted Average Pooling (GWAP) method, which is computed as:
G W A P ( x , y , d ) = x   y   A t t e n t i o n ( x , y , d ) F e a t u r e ( x , y , d ) x   y   A t t e n t i o n ( x , y , d )
where (x, y) is denoted as weights at the spatial location in the spatial attention and d represented the height, width, and number of channels. For feature aggregating, the average score of weights (x, y) is calculated.
Additionally, the second attention layer named weighted Attention Average was presented by Felbo et al. [40] in their paper. The Weighted Attention Average module is computed as:
e t     =     h t w a
    a t =   e x p ( e t ) i = 1 T e x p ( e t )
v = i = 1 T a i h i
where h t denoted as the image at timestamp t and w a denoted as a weight matrix for the attention layer, The representations are multiplied by the weight matrix to create the attention important scores for each time step, a t , and then the results are normalized to create a probability distribution over the images. Last but not least, using the attention importance scores as weights, a weighted summation of all the time steps yields the representation vector for the image.
D.
DATASET DESCRIPTION
In this research paper, we used the C-NMC_2019 dataset prepared by ISBI and presented in the health imaging challenge [9,20,24,41]. This dataset consists of 10,661 cell images with which 7272 cancer images obtained from 47 acute lymphoblastic leukemia patients and 3389 normal images obtained from 26 healthy persons. ALL and healthy cells had nucleus-to-cytoplasm ratios of approximately 1/5 and 2/5, respectively. As shown in the bottom row of Figure 6, healthy cells on a blood smear seem homogenous and uniform, round-to-ovoid-shaped, tiny in size, and with a normal nuclear shape. The form and size of all cells are different. ALL cells are elongated and unusual in shape, with a considerable quantity of chromatin (a mass of genetic material). The size of ALL lymphoblasts varies, and the nuclei’s form is quite uneven, as seen in the top row of Figure 4, these cells were segmented from microscopic photos, and each cell image was collected as an actual image. To a considerable extent, some staining noise and lighting faults that occurred during the collection procedure have been rectified.

4. Results and Discussion

A.
PERFORMANCE EVALUATION METRICS
We evaluated our model’s performance with different parameters, which include accuracy, precision, F1-Score, Sensitivity, and Specificity. The formulas of these parameters are [42]:
Accuracy   = Detected   ALL   Cells   +   Detected   Healthy   Cells Total   Instance
Precision = Detected   ALL   Cells Detected   ALL   Cells   +   Wrongly   Detected   ALL   Cells
Sensitivity /   Recall ( R ) = Detected   ALL   Cells Total   ALL   Cells   Instance
Specificity = Detected   Healthy   Cells Total   Healthy   Cells   Instance
F 1 Score = 2 × ( P   ×   R ) ( P   +   R )
B.
EXPERIMENTAL SETUP AND HYPERPARAMETERS
The machine learning engineer can modify many parameters that govern how the network will train or even its design while aiming to attain optimal accuracy and performance of a neural network model. These characteristics are known as hyperparameters, and they play a critical role in the overall performance of any Convolutional Neural Network. Although there are some guidelines for determining the ideal value for various hyperparameters, hyperparameter tuning is largely an exploratory procedure. Figure 7 depicts a complete structure of the EfficientNetV2S model.
  • The learning rate hyperparameter determines how much change will be made to the network’s weights after each backpropagation pass. We set a learning rate of 0.001 for both models. The learning rate is reduced to a 0.5 factor if the monitor value does not improve;
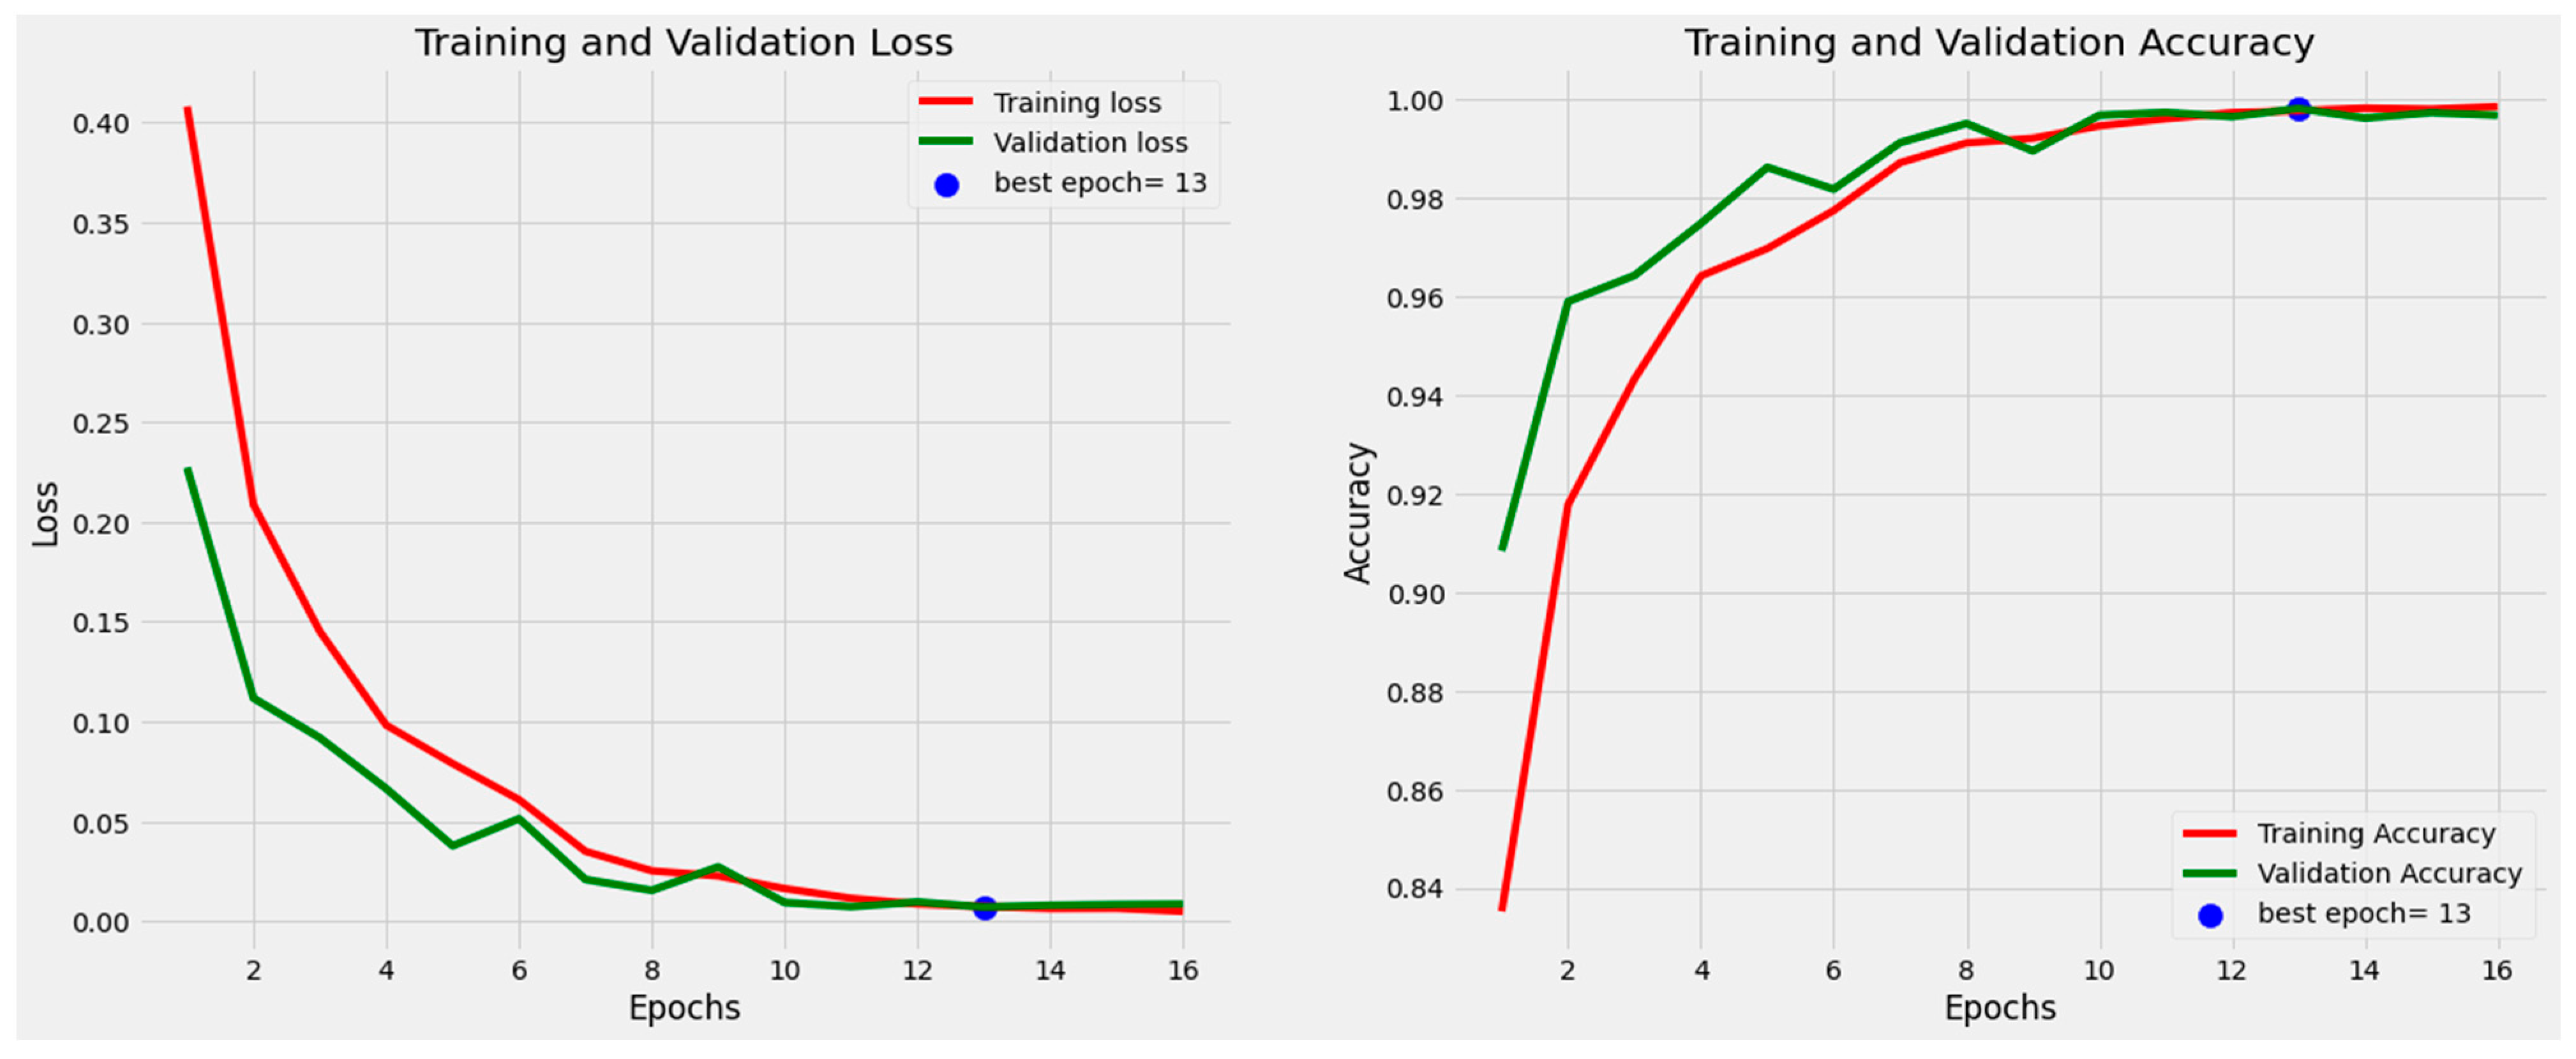
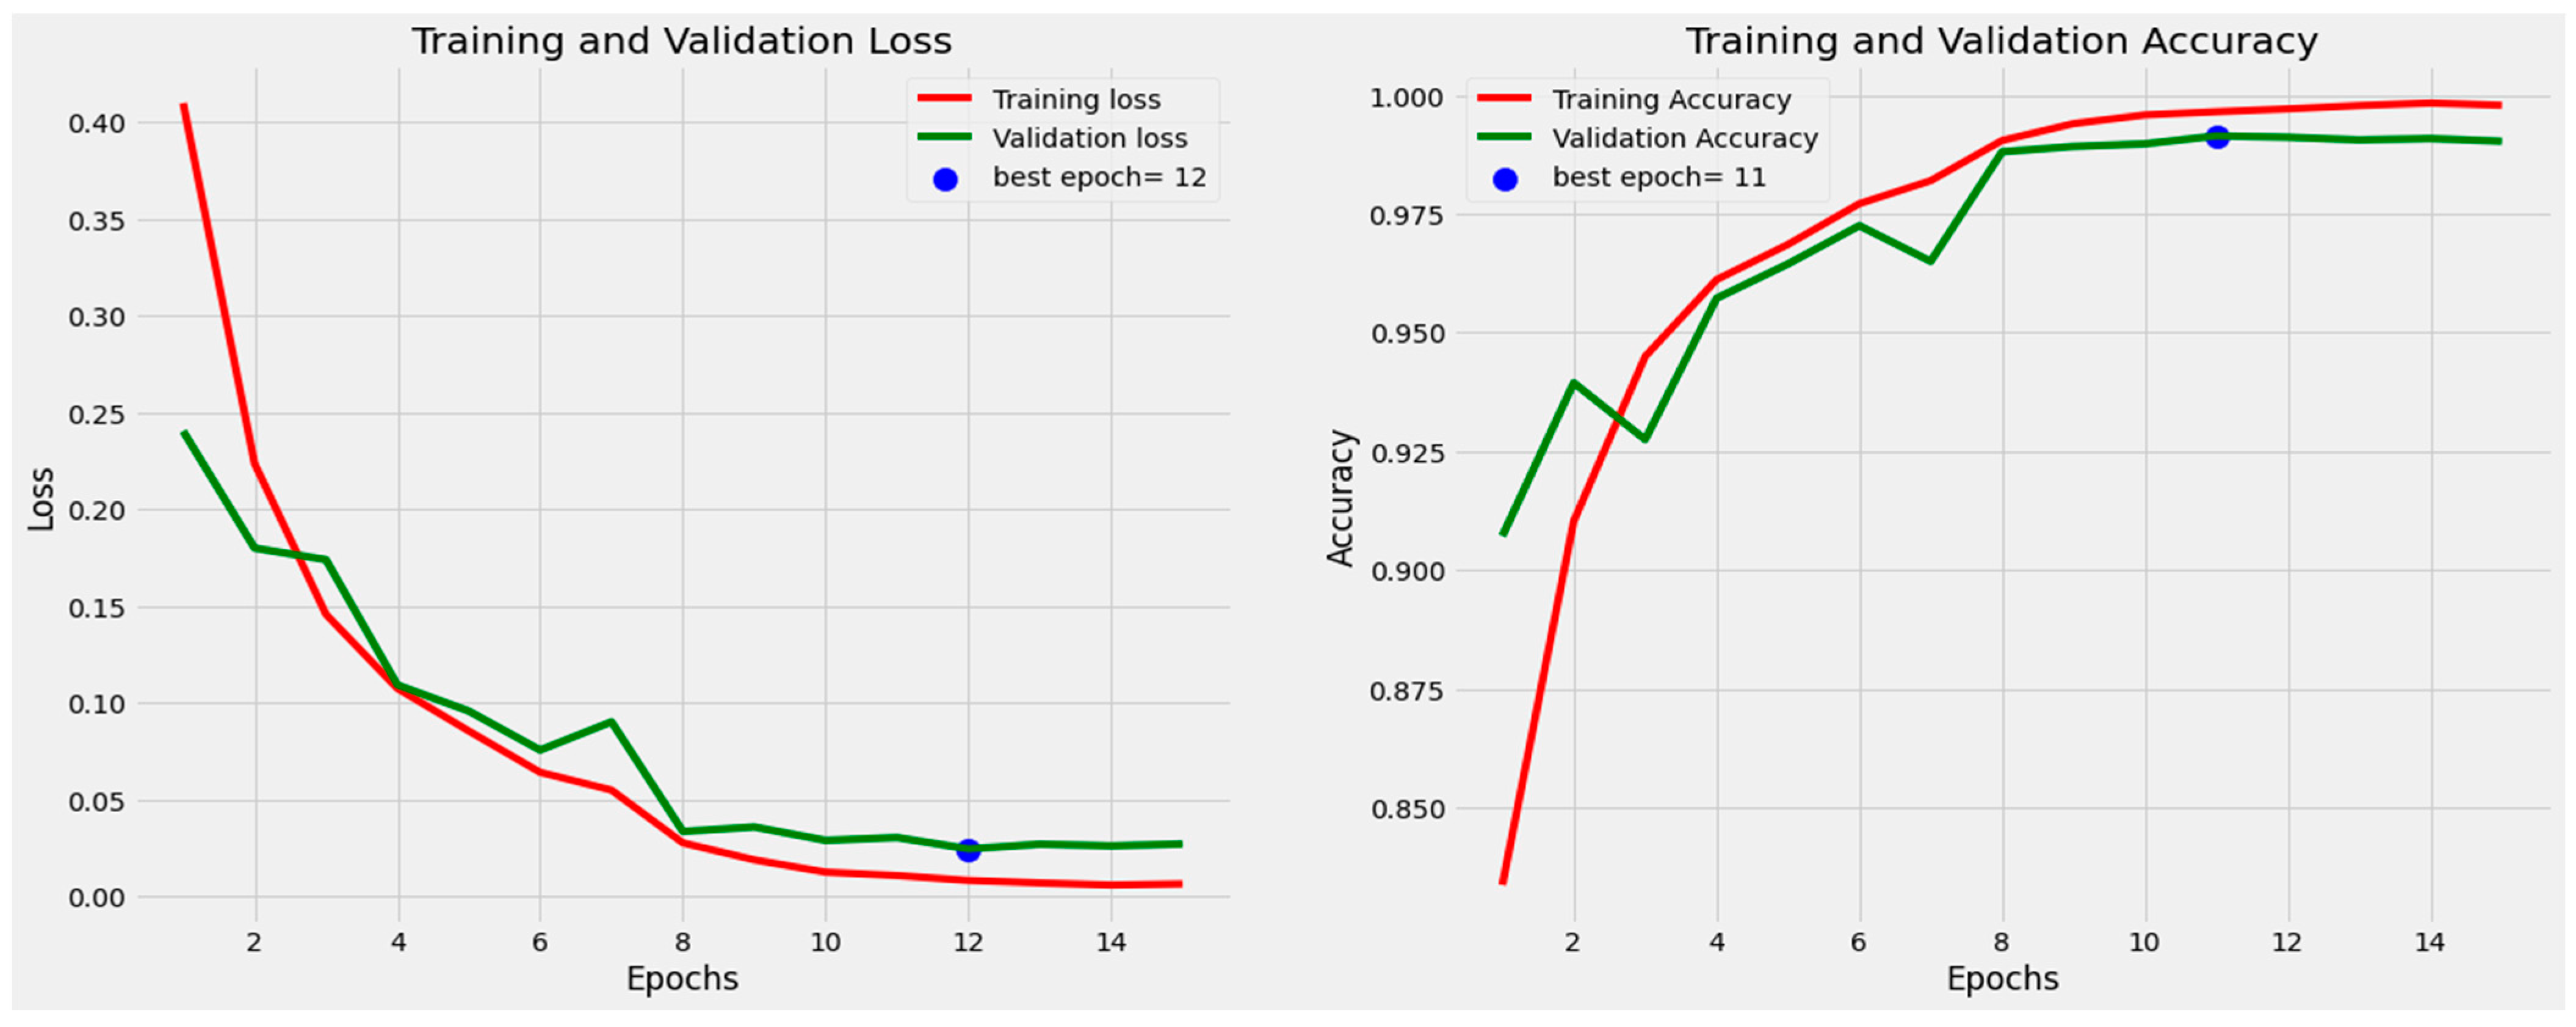
  • Epochs are set to 20 for both efficietNetB3 and efficientNetV2S;
  • The batch size is set to 16 for both models;
  • The patience parameter is set to 1 and the stop patience parameter is set to 3;
  • Both models are saved with the highest accuracy in the validation set;
  • Adamax optimizer is used for training purposes with extension of Adam that try to combine the best part of the RMSProp and momentum optimizer. In some scenarios, the Adamax optimizer provides the better optimization than the Adam optimizer;
  • Categorical cross-entropy is used to calculate the loss during training that is well-suited for the categorical problem;
  • We added an additional batch norm [43] layer before fully connected layers;
  • The TensorFlow [44] framework and Python 3.7 were used to implement the experiments;
C.
DISCUSSION
The ISBI-2019 data set is divided by an 8:1:1 ratio in the train, valid, and test datasets respectively. The basic purpose of using a validation dataset is to estimate the performance of training data and tune the hyperparameters to optimize the model. For results, the test data set has used for overall accuracy, which was not a part of our training procedure. The Multi-Attention EfficientNetB3 model attained 99.25% accuracy on the test set and the Multi-Attention EfficientNetV2S model achieved 99.73% accuracy.
EfficientNetV2S model achieved 0.70% more accuracy than EfficientNetB3, which can also be seen in Table 1.The EfficientNetV2S model training had been terminated at epoch 16 after 3 adjustments of learning rate with no improvement that can also be seen in Figure 8. The EfficientNetB3 model had been training terminated after completing the 15 epochs, which can also be seen in Figure 9. According to Figure 8 and Figure 9, training and validation loss curves gradually decrease and try to combine with an optimal point. In Figure 8 and Figure 9 training and validation curves show clearly no overfitting in our models.
A confusion matrix can also be the best choice to measure the performance of the model. All of the diagonal elements indicate outcomes that have been accurately categorized. On the off diagonals of the confusion matrix, misclassified outcomes are depicted. Therefore, the confusion matrix of the best classifier will only contain diagonal elements and have zero values for all other elements. Following the categorization procedure, a confusion matrix produces actual and expected values. According to Figure 10, our Multi-Attention EfficientNetV2S model misclassified only 11 images from 4000 images, which include 8 ALL images and 3 normal images. Multi-Attention EfficientNetB3 model misclassified 30 images from 4000 images, which include 10 ALL and 20 normal images. Our Multi-Attention EfficientNetV2S model has 19 images less misclassified than EfficientNetB3 shows a better ability to classify the correct predictions.
Figure 11 shows the comparison graph of both models with different parameters. Our Multi-Attention EfficientNetV2S model achieved a 99.85% precision score that is 0.85% more than Multi-Attention EfficientNetB3 model. Similarly, F1-Score, Sensitivity and Specificity of the Multi-Attention EfficientNetV2S and Multi-Attention EfficientNetB3 are 99.72%, 99.60%, 99.85%, and 99.25%, 99.50%,99.00%, respectively, in the comparison graph.
We also compared our models result to other previously individual and ensemble model results, that were used for detection of acute lymphoblastic leukemia from microscopic blood smear images. If we compare our Multi-Attention EfficientNetB3 of with its family member EffcientNetB0, our model has almost a 4% better accuracy with the same dataset. Similarly, compared to individual models our Multi-Attention EfficientNetB3 achieved a 0.35% higher accuracy than the vision transfer model. Compared to ensemble models, our multi-Attention efficientNetB3 model achieved 2.67%, 0.75%, 0.22% higher accuracy, which can also be seen in Table 2.
EfficientNetV2S also belong to the EfficientNetB3 family but it is an upgraded version. If we compare the Multi-Attention EfficientV2S model with its family members then EfficientNetV2S achieved 0.48%, and 4.55% higher accuracy than Multi-Attention EfficientNetB3 and EfficientNetB0, respectively, which proves the model’s ability for detection of leukemia. Similarly, compared to individual models Multi-Attention EfficientNetV2S achieved 0.83% higher accuracy than vision transfer models, which can also be seen in Table 2. Similarly, compared to ensemble models Multi-Attention EfficientNetV2S achieved a 3.15%, 1.23%, and 0.70% higher accuracy, which can also be seen in Table 2.
EfficientNetV2S and EfficientNetB3 with Multi-Attention module compare to another model [20] VGG16 + Efficient Channel Attention (ECA), even then our models have performed better and achieved almost a 9 to 10% higher accuracy with the same dataset, which also can be seen in Table 2.

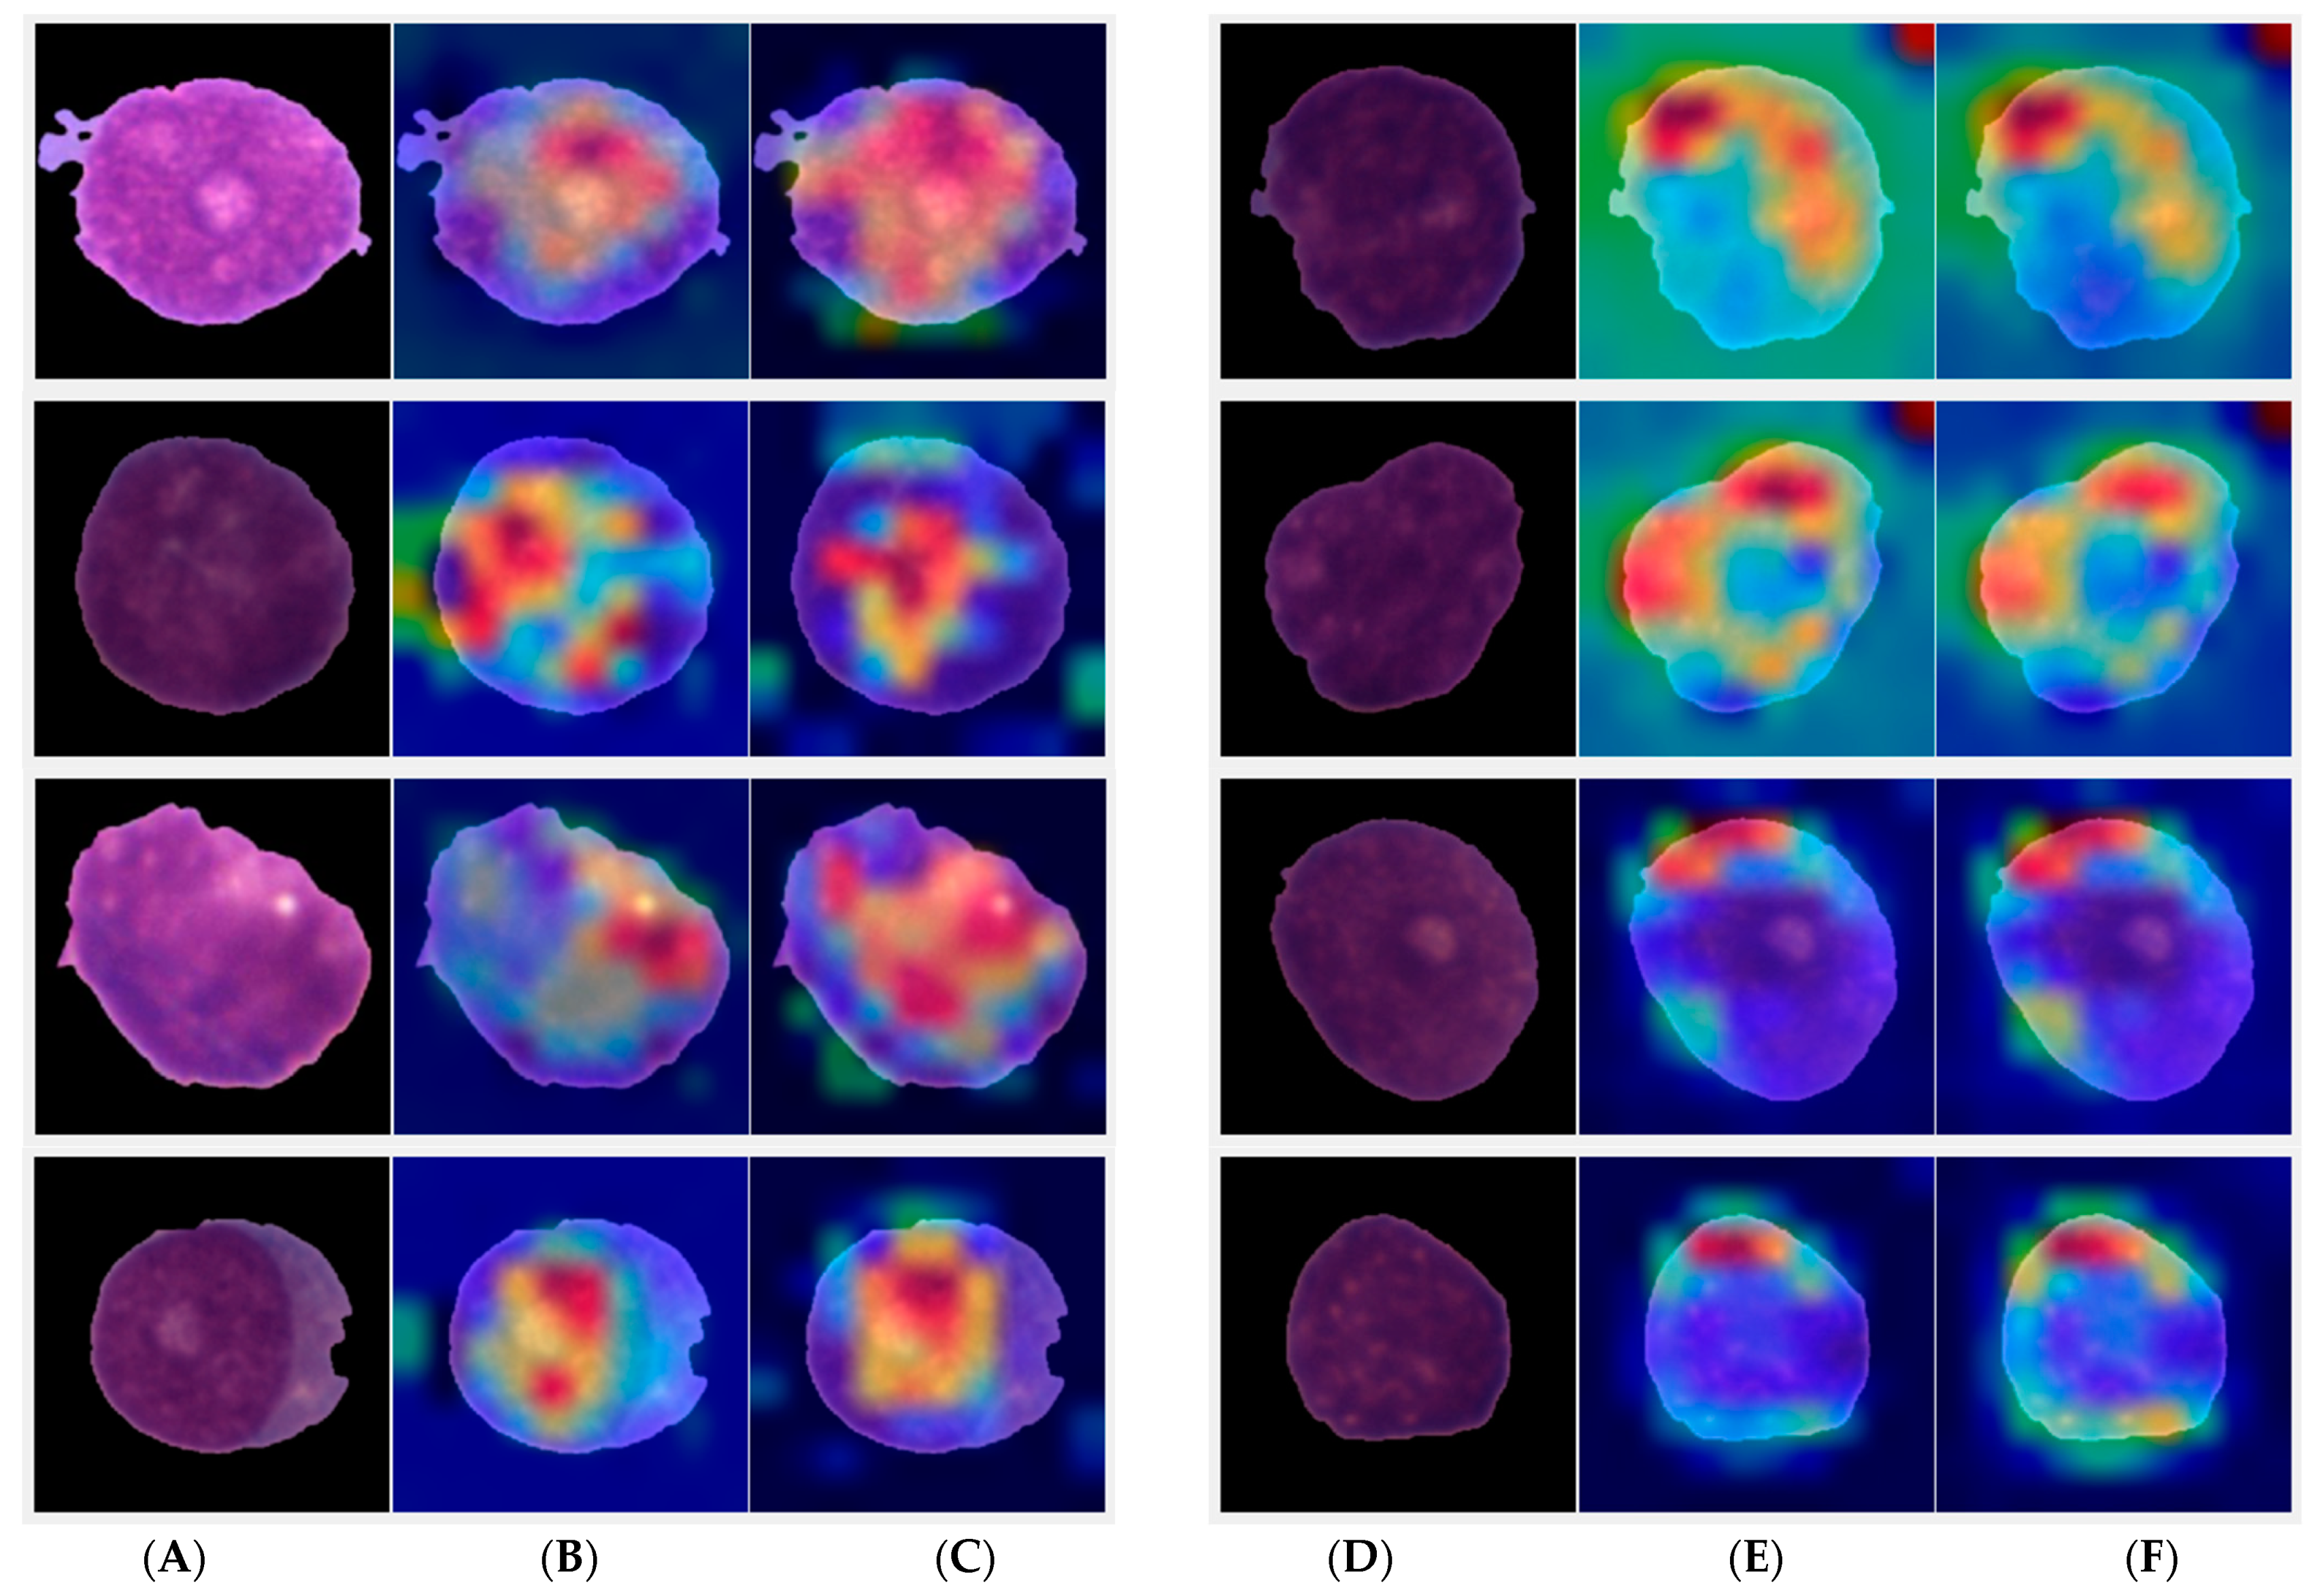
5. Grad-Cam Analysis

We used images from the testing set in the Grad-CAM analysis for the qualitative analysis. Grad-CAM is a well-known proposed visualization technique that makes use of gradients to determine the significance of specific spatial positions within convolutional layers. Gradients are calculated as they are Grad-CAM results for Healthy and Blast classes clearly display attendance regions. We attempt to examine how well this network utilizes features by looking at the locations that both networks have deemed crucial for class prediction. In this study, we compare the visualization outcomes of the multi-Attention networks (EfficientNetV2S + multi-Attention) and (EfficientNetB3 + multi-Attention) with their respective baselines (EfficientNetB3) and (EfficientNetV2S). Figure 12 illustrates the visualization result.
In Figure 12, we can clearly see the multi-Attention network gave batter result to identify the target object than baseline networks. This proves that our multi-Attention-integrated network learned well to identify the target object in the image dataset. If we compare C and F images in Figure 12, then EfficientNetV2S with Multi-Attention Layers focus more precisely on the target than EfficientNetB3 with Multi-Attention Layers and shows a better ability to target the image.

6. Conclusions and Future Work

In our research paper, we presented a study in which we use pre-trained models and a transfer learning-based fine-tuning strategy to forecast acute lymphoblastic Leukemia to overcome the death rate at an early stage in the medical field. For this, we used the ISBI-2019 dataset, which included both healthy and unhealthy cells. We have also included augmentation techniques to overcome the problem of imbalanced data that deals with the minimization of the error rate during training procedures and is necessary for the improvement of the model accuracy. Both Multi-Attention EfficientNetV2S and EfficientNetB3 achieved the 99.73% and 99.25% classification accuracies, respectively. We compared our model’s accuracy to other deep learning and ensemble models to prove its efficiency. Upon comparison, it has been concluded that our proposed two models provide better outcomes than existing literature, thus proving their efficiency.

Author Contributions

Conceptualization, A.S. and S.S.; methodology, S.S.; software, K.S. and I.A.; validation, A.S., S.S. and K.S.; formal analysis, A.A.E. and A.H.A.; original draft preparation, A.S., S.S. and K.S., writing—review and editing, S.S. and K.S., visualization, A.S. and K.S.; supervision, S.S., E.T.-E. and I.A.; funding acquisition, E.T.-E. All authors have read and agreed to the published version of the manuscript.

Funding

This project is supported by Deanship of Scientific Research at Umm Al-Qura University for supporting this work by Grant Code: (22UQU4331100DSR25).

Acknowledgments

The author would like to thank the Deanship of Scientific Research at Umm Al-Qura University for supporting this work by Grant Code: (22UQU4331100DSR25).

Conflicts of Interest

The authors declare no conflict of interest.

References

  1. Das, P.K.; Meher, S. An efficient deep Convolutional Neural Network based detection and classification of Acute Lymphoblastic Leukemia. Expert Syst. Appl. 2021, 183, 115311. [Google Scholar] [CrossRef]
  2. Sahlol, A.T.; Kollmannsberger, P.; Ewees, A.A. Efficient Classification of White Blood Cell Leukemia with Improved Swarm Optimization of Deep Features. Sci. Rep. 2020, 10, 2536. [Google Scholar] [CrossRef] [Green Version]
  3. Alagu, S.; Bagan, K. Chronological Sine Cosine Algorithm Based Deep CNN for Acute Lymphocytic Leukemia Detection. Available online: https://www.researchgate.net/publication/353659892 (accessed on 4 April 2022).
  4. Rehman, A.; Abbas, N.; Saba, T.; Rahman, S.I.U.; Mehmood, Z.; Kolivand, H. Classification of acute lymphoblastic leukemia using deep learning. Microsc. Res. Tech. 2018, 81, 1310–1317. [Google Scholar] [CrossRef] [PubMed]
  5. Key Statistics for Acute Lymphocytic Leukemia. Available online: https://www.cancer.org/cancer/acute-lymphocytic-leukemia/about/key-statistics (accessed on 4 April 2022).
  6. American Cancer Society What’s New in Acute Lymphocytic Leukemia (ALL) Research? Available online: https://www.cancer.org/cancer/acute-lymphocytic-leukemia/about/new-research.html (accessed on 4 April 2022).
  7. Chang, J.H.; Poppe, M.M.; Hua, C.; Marcus, K.J.; Esiashvili, N. Acute lymphoblastic leukemia. Pediatr. Blood Cancer 2021, 68, e28371. [Google Scholar] [CrossRef]
  8. Cho, P.; Dash, S.; Tsaris, A.; Yoon, H.-J. Image transformers for classifying acute lymphoblastic leukemia. In Proceedings of the Medical Imaging 2022: Computer-Aided Diagnosis, San Diego, CA, USA, 4 April 2022. [Google Scholar] [CrossRef]
  9. Kasani, P.H.; Park, S.-W.; Jang, J.-W. An Aggregated-Based Deep Learning Method for Leukemic B-lymphoblast Classification. Diagnostics 2020, 10, 1064. [Google Scholar] [CrossRef]
  10. Papiththira, S.; Kokul, T. Melanoma Skin Cancer Detection Using EfficientNet and Channel Attention Module. In Proceedings of the International Conference on Industrial and Information Systems (ICIIS), Kandy, Sri Lanka, 9–11 December 2021; pp. 227–232. [Google Scholar] [CrossRef]
  11. Claro, M.; Vogado, L.; Veras, R.; Santana, A.; Tavares, J.; Santos, J.; Machado, V.M. Convolution Neural Network Models for Acute Leukemia Diagnosis. In Proceedings of the 2020 International Conference on Systems, Signals and Image Processing (IWSSIP), Niteroi, Brazil, 1–3 July 2020; pp. 63–68. [Google Scholar] [CrossRef]
  12. Duong, L.T.; Nguyen, P.T.; Di Sipio, C.; Di Ruscio, D. Automated fruit recognition using EfficientNet and MixNet. Comput. Electron. Agric. 2020, 171, 105326. [Google Scholar] [CrossRef]
  13. Ali, S.; Javaid, N.; Javeed, D.; Ahmad, I.; Ali, A.; Badamasi, U.M. A Blockchain-Based Secure Data Storage and Trading Model for Wireless Sensor Networks. In International Conference on Advanced Information Networking and Applications; Springer: Cham, Switzerland; Caserta, Italy, 2020; pp. 499–511. [Google Scholar] [CrossRef]
  14. Raza, A.; Ayub, H.; Khan, J.A.; Ahmad, I.; Salama, A.S.; Daradkeh, Y.I.; Javeed, D.; Rehman, A.U.; Hamam, H. A Hybrid Deep Learning-Based Approach for Brain Tumor Classification. Electronics 2022, 11, 1146. [Google Scholar] [CrossRef]
  15. Javeed, D.; Gao, T.; Khan, M. SDN-Enabled Hybrid DL-Driven Framework for the Detection of Emerging Cyber Threats in IoT. Electronics 2021, 10, 918. [Google Scholar] [CrossRef]
  16. Al Razib, M.; Javeed, D.; Taimoor Khanet, M.; Alkanhel, R.; Ali Muthanna, M.S. Cyber Threats Detection in Smart Environments Using SDN-Enabled DNN-LSTM Hybrid Framework. IEEE Access 2022, 10, 53015–53026. [Google Scholar] [CrossRef]
  17. Javeed, D.; Gao, T.; Khan, M.T.; Shoukat, D. A Hybrid Intelligent Framework to Combat Sophisticated Threats in Secure Industries. Sensors 2022, 22, 1582. [Google Scholar] [CrossRef] [PubMed]
  18. Ahmad, I.; Liu, Y.; Javeed, D.; Ahmad, S. A decision-making technique for solving order allocation problem using a genetic algorithm. IOP Conf. Ser. Mater. Sci. Eng. 2020, 853, 012054. [Google Scholar] [CrossRef]
  19. Javeed, D.; Gao, T.; Khan, M.; Ahmad, I. A Hybrid Deep Learning-Driven SDN Enabled Mechanism for Secure Communication in Internet of Things (IoT). Sensors 2021, 21, 4884. [Google Scholar] [CrossRef] [PubMed]
  20. Ullah, M.Z.; Zheng, Y.; Song, J.; Aslam, S.; Xu, C.; Kiazolu, G.D.; Wang, L. An Attention-Based Convolutional Neural Network for Acute Lymphoblastic Leukemia Classification. Appl. Sci. 2021, 11, 10662. [Google Scholar] [CrossRef]
  21. Xu, C.; Xu, L.; Ohorodnyk, P.; Roth, M.; Chen, B.; Li, S. Contrast agent-free synthesis and segmentation of ischemic heart disease images using progressive sequential causal GANs. Med. Image Anal. 2020, 62, 101668. [Google Scholar] [CrossRef]
  22. Gao, Z.; Wang, X.; Sun, S.; Wu, D.; Bai, J.; Yin, Y.; Liu, X.; Zhang, H.; de Albuquerque, V.H.C. Learning physical properties in complex visual scenes: An intelligent machine for perceiving blood flow dynamics from static CT angiography imaging. Neural Netw. 2020, 123, 82–93. [Google Scholar] [CrossRef]
  23. Gao, Z.; Chung, J.; Abdelrazek, M.; Leung, S.; Hau, W.K.; Xian, Z.; Zhang, H.; Li, S. Privileged Modality Distillation for Vessel Border Detection in Intracoronary Imaging. IEEE Trans. Med. Imaging 2019, 39, 1524–1534. [Google Scholar] [CrossRef] [PubMed]
  24. Jiang, Z.; Dong, Z.; Wang, L.; Jiang, W. Method for Diagnosis of Acute Lymphoblastic Leukemia Based on ViT-CNN Ensemble Model. Comput. Intell. Neurosci. 2021, 2021, 7529893. [Google Scholar] [CrossRef] [PubMed]
  25. Alagu, S.; Bagan, K. A Novel Segmentation Approach for Acute Lymphocytic Leukemia Detection Using Deep Learning. 2021. Available online: https://www.researchgate.net/publication/353659988 (accessed on 3 September 2022).
  26. Alagu, S. Automatic Detection of Acute Lymphoblastic Leukemia Using UNET Based Segmentation and Statistical Analysis of Fused Deep Features. Appl. Artif. Intell. 2021, 35, 1952–1969. [Google Scholar] [CrossRef]
  27. Genovese, A.; Hosseini, M.S.; Piuri, V.; Plataniotis, K.N.; Scotti, F. Acute Lymphoblastic Leukemia Detection Based on Adaptive Unsharpening and deep Learning. In Proceedings of the ICASSP 2021–2021 IEEE International Conference on Acoustics, Speech and Signal Processing (ICASSP), Toronto, ON, Canada, 6–11 June 2021; pp. 1205–1209. [Google Scholar]
  28. Shafique, S.; Tehsin, S. Acute Lymphoblastic Leukemia Detection and Classification of Its Subtypes Using Pretrained Deep Convolutional Neural Networks. Technol. Cancer Res. Treat. 2018, 17, 1–7. [Google Scholar] [CrossRef] [PubMed] [Green Version]
  29. Loey, M.; Naman, M.; Zayed, H. Deep Transfer Learning in Diagnosing Leukemia in Blood Cells. Computers 2020, 9, 29. [Google Scholar] [CrossRef] [Green Version]
  30. Ghaderzadeh, M.; Hosseini, A.; Asadi, F.; Abolghasemi, H.; Bashash, D.; Roshanpoor, A. Automated Detection Model in Classification of B-Lymphoblast Cells from Normal B-Lymphoid Precursors in Blood Smear Microscopic Images Based on the Majority Voting Technique. Sci. Program. 2022, 2022, 4801671. [Google Scholar] [CrossRef]
  31. Genovese, A.; Hosseini, M.S.; Piuri, V.; Plataniotis, K.N.; Scotti, F. Histopathological Transfer Learning for Acute Lymphoblastic Leukemia Detection. In Proceedings of the 2021 IEEE International Conference on Computational Intelligence and Virtual Environments for Measurement Systems and Applications (CIVEMSA), Di Milano, Italy, 1 September 2021; pp. 1–6. [Google Scholar] [CrossRef]
  32. Gebremeskel, K.D.; Kwa, T.C.; Raj, K.H.; Zewdie, G.A.; Shenkute, T.Y.; Maleko, W.A. Automatic Early Detection and Classification of Leukemia from Microscopic Blood Image. AbyssiniaJ. Sci. Technol. 2021, 3, 1–10. Available online: https://journals.wu.edu.et/index.php/ajec/article/view/160 (accessed on 20 April 2022).
  33. Kandhari, R.; Bhan, A.; Bhatnagar, P.; Goyal, A. Computer based diagnosis of Leukemia in blood smear images. In Proceedings of the 2021 Third International Conference on Intelligent Communication Technologies and Virtual Mobile Networks (ICICV), Tirunelveli, India, 4–6 February 2021; pp. 1462–1466. [Google Scholar] [CrossRef]
  34. Bodzas, A.; Kodytek, P.; Zidek, J. Automated Detection of Acute Lymphoblastic Leukemia From Microscopic Images Based on Human Visual Perception. Front. Bioeng. Biotechnol. 2020, 8, 1005. [Google Scholar] [CrossRef]
  35. Chen, Y.-M.; Chou, F.-I.; Ho, W.-H.; Tsai, J.-T. Classifying microscopic images as acute lymphoblastic leukemia by Resnet ensemble model and Taguchi method. BMC Bioinform. 2021, 22, 615. [Google Scholar] [CrossRef]
  36. Tan, M.; Le, Q.V. EfficientNet: Rethinking model scaling for convolutional neural networks. In Proceedings of the International Conference on Machine Learning, Long Beach, CA, USA, 11 September 2019; pp. 10691–10700. [Google Scholar]
  37. Sandler, M.; Howard, A.; Zhu, M.; Zhmoginov, A.; Chen, L. MobileNetV2: Inverted residuals and linear bottlenecks. In Proceedings of the IEEE/CVF Conference on Computer Vision and Pattern Recognition (CVPR), Salt Lake City, UT, USA, 18–23 June 2018; pp. 4510–4520. [Google Scholar] [CrossRef]
  38. Tan, M.; Le, Q.V. EfficientNetV2: Smaller Models and Faster Training. In Proceedings of the 38th International Conference on Machine Learning, Virtual, CA, USA, 23 June 2021; Available online: http://arxiv.org/abs/2104.00298 (accessed on 6 June 2022).
  39. Woo, S.; Park, J.; Lee, J.Y.; Kweon, I.S. Cbam: Convolutional block attention module. In Proceedings of the European Conference on Computer Vision (ECCV), Munich, Germany, 8–14 September 2018; pp. 3–19. [Google Scholar] [CrossRef]
  40. Ahmad, I.; Wang, X.; Zhu, M.; Wang, C.; Pi, Y.; Khan, J.; Li, G. EEG-Based Epileptic Seizure Detection via Machine/Deep Learning Approaches: A Systematic Review. Comput. Intell. Neurosci. 2022, 2022, 6486570. [Google Scholar] [CrossRef] [PubMed]
  41. Mondal, C.; Hasan, K.; Ahmad, M.; Awal, A.; Jawad, T.; Dutta, A.; Islam, R.; Moni, M.A. Ensemble of Convolutional Neural Networks to diagnose Acute Lymphoblastic Leukemia from microscopic images. Inform. Med. Unlocked 2021, 27, 100794. [Google Scholar] [CrossRef]
  42. Khan, T.U. Internet of Things (IOT) systems and its security challenges. Int. J. Adv. Res. Comput. Eng. Technol. (IJARCET) 2019, 8, 12. [Google Scholar]
  43. Ahmad, I.; Ullah, I.; Khan, W.U.; Ur Rehman, A.; Adrees, M.S.; Saleem, M.Q.; Shafiq, M. Efficient algorithms for E-healthcare to solve multiobject fuse detection problem. J. Healthc. Eng. 2021, 2021, 9500304. [Google Scholar] [CrossRef]
  44. Abaddi, M.; Barham, P.; Chen, J.; Chen, Z.; Davis, A.; Dean, J.; Devin, M.; Ghemawat, S.; Irving, G.; Isard, M.; et al. TensorFlow: A system for large-scale machine learning. In Proceedings of the 12th USENIX Symposium on Operating Systems Design and Implementation, Savannah, GA, USA, 2 November 2016; pp. 265–283. [Google Scholar]
Figure 1. After data Augmentation generation of Normal and Cancer cells.
Electronics 11 03168 g001
Figure 2. Comparison of different activation functions.
Electronics 11 03168 g002
Figure 3. Modified Part of our EfficientNetV2S Model with Multi-Attention Layers and Fully-Connected Layers.
Electronics 11 03168 g003
Figure 4. The Structure of the EfficientNetB3 Model.
Electronics 11 03168 g004
Figure 5. The structure of MBConv and Fused-MBConv.
Electronics 11 03168 g005
Figure 6. Cancer(ALL) and Normal (HEM) cells in the ISBI-2019 dataset.
Electronics 11 03168 g006
Figure 7. The structure of the EfficientNetV2S Model.
Electronics 11 03168 g007
Figure 8. Training and validation accuracy andloss of Multi-Attention EfficientNetV2S model.
Electronics 11 03168 g008
Figure 9. Training and validation accuracy andloss of Multi-Attention EfficientNetB3 model.
Electronics 11 03168 g009
Figure 10. (a) Confusion matrix of Multi-Attention EfficientNetV2S. (b) Confusion matrix of Multi-Attention EfficientNetB3.
Electronics 11 03168 g010
Figure 11. Overall Comparison of EfficientNetV2S and EfficientNetB3.
Electronics 11 03168 g011
Figure 12. Grad-Cam Analysis of both our EfficientNetV2S and EfficientNetB3 (AD)are original images (BE)that belong to our baseline EfficientNetV2S and EfficientNetB3 models visualization respectively (CF) belong to modified our both models’ visualization (EfficientNetV2S + multi-Attention Module) and (EfficientNetB3 + multi-Attention Module), respectively.
Electronics 11 03168 g012
Table 1. Results of our proposed models (best values in bold).
ModelAccuracy %Precision %Sensitivity %Specificity %F1-Score
EfficientNetV2S99.7399.8599.6099.8599.72
EfficientNetB399.2599.0099.5099.0099.25
Table 2. Comparison of accuracy of other individual and ensemble models with ISBI-2019 Dataset.
RefYearMethodsAccuracy
[20]2021VGG16 + ECA module91%
[24]2021EfficientNetB095.18%
[24]2021Vision Transformer 98.90%
[9]2020NasNetLarge + VGG1996.58%
[30]2022Ensemble model based on majority voting technique98.50%
[24]2021VIT-CNN Ensemble Model
(EfficientNetB0 + Vision Transformer)
99.03%
Proposed2022Multi-Attention EfficientNetB399.25%
Multi-Attention EfficientNetV2S99.73%
Publisher’s Note: MDPI stays neutral with regard to jurisdictional claims in published maps and institutional affiliations.

