Abstract
Software size is a significant input for software cost estimation, and the implementation of software size estimation dramatically affects the results and efficiency of cost estimation. Traditionally, the software size estimation is implemented by strictly trained experts and is more labor-intensive for large software projects, which is relatively expensive and inefficient. Function Point Analysis is a widely used method for software size estimation, supported by several international standards. We propose a structured and automated function point extraction method based on event extraction in natural language processing to address the problem of complex and inefficient manual recognition for function point recognition. This approach has been validated in 10 industrial cases. Experimental results show that our method can identify more than 70% of the function points, which significantly improves the efficiency of Function Point Analysis implementation. This paper could be a guide on the application of artificial intelligence techniques to software cost estimation.
1. Introduction
Software cost estimation is one of the most important tasks in software project management, which is widely concerned by the industry and academia. However, Standish group, an authoritative organization engaged in IT project investigation in the United States, pointed out in its 2015 report that only one-third of software development can be completed on schedule. Software cost estimation is a method of estimating development effort, schedule, and cost through a series of processes and models [1]. Software size is an important input in software cost evaluation. Software size estimation splits, adjusts, and summarizes the software project through measurement units to realize the estimation of software size, which has an important effect on the result and efficiency of software cost evaluation [2]. There have been many studies on software size estimation, such as the Source Lines of Code (SLOC) and Function Points Analysis (FPA) used in the information system [3,4], Story Point (SP) analysis used in agile development [5], and Use Case Points (UCP) analysis used in the model-based development [6]. Among these, FPA is a widely used software workload estimation method since it can be applied to different life stages of software development and is supported by various international standards.
Although FPA is a feasible software size estimation method, there are still some challenges in industrial practice. The first one is that the implementation of FPA mainly relies on some highly trained experts, it is expensive to train experts who can carry out practical applications. The second one is that there are more large-scale software projects in industrial practice, and the inefficiency of manual function point (FP) identification leads to the high time cost of software cost estimation. Therefore, it is necessary to find an improved software size estimation method that can be applied in industrial practice. With the development of natural language processing technology, information extraction techniques are being widely used in different fields. For instance, named entity recognition techniques are used to solve the extraction of entities such as symptoms and drugs in electronic medical records [7]. Relationship extraction techniques are used to construct domain knowledge graphs [8]. Event extraction techniques can be used in the detection of events in biomedical texts [9]. It is meaningful to explore the application of natural language processing techniques in software size estimation.
In this study, we propose an automated FP extraction method based on event extraction for the structured identification of each component of FPs. This method applies the event extraction technique in natural language processing to FPA to improve execution efficiency. In this approach, we treat the extraction of FPs as an event extraction task, where the FPs is a unit that describes a functional event. We define the action component of the FPs as the event trigger, the action participation component of the FPs as the event argument, and the category of the FPs as the event attribution. We propose a set of pipelined event extraction methods to accomplish structured identification of FPs. Specifically, the BERT (Bidirectional Encoder Representations from Transformers)-BiLSTM (Bidirectional Long Short-Term Memory)-CRF (Conditional Random Field) method is adopted to achieve FPs triggers extraction. The BERT-CLN (Conditional Layer Norm)-CRF method is adopted to fuse triggers information and achieve the extraction of FPs arguments. The BERT-DP (Dynamic Pooling) method is adopted to extract FPs attributions by using triggers and surrounding information as features. The final result of structural extraction of FPs is to output FPs triples: {FPs trigger, FPs arguments, FPs attribution}. This approach has been validated in 10 industrial cases, and experimental results show that our method can extract more than 70% of the FPs, which can substantially improve the efficiency of FPs extraction.
The remainder of this paper is as follows: Section 2 describes the related work and defines the problem. Section 3 describes the research methodology used in this study. The experiment design and its results are described in Section 4, and the discussion on the research analysis is discussed in Section 5. Section 6 summarizes our conclusion and indicates future directions.
2. Related Work
2.1. Software Size Estimation Methods
There are many methods for software size estimation, including SLOC, SP, UCP, FPA, and improved estimation models combined with algorithms such as machine learning [10].
The SLOC method estimates the software size based on the length of code lines, while it cannot be applied in the early phase of software development. Robles G et al. proposed a workload estimation model that depends on the threshold value of open-source software projects, and on the analysis of its publicly available project code data on version control systems [11]. Moreover, the number of code lines mainly depends on the programming language, which leads to inconsistent results in different programming environments. The FPA approach focuses on the functionality to be implemented in a software project. It can be used without knowledge of specific development processes, technology, and other factors. The results can be translated into lines of code to estimate the software size according to the specific development technology. Therefore, the FPA can be applied to multiple stages of software development and has been widely used. UCP is an improved method proposed by Gustav Karner for FPA, which calculates use case points based on the complexity classification of identified use cases and executors. It is widely used in object-oriented software projects [12,13]. Based on UCP, Daud et al. proposed ADAFs (Analysis-to-Design Adjustment Factors) model to estimate software size by calculating four different class diagram metrics [14]. However, UCP is not suitable for the early stage of a software project because detailed use case documentation is often available in the middle or late stages of a project [15]. The SP method estimates software size by measuring story points, which could rapidly access customer requirements and has been applied in agile development projects [16,17]. Coelho et al. describe the steps of an agile software work estimation method based on story points and highlight the areas that need further research [14]. Sharma et al. constructed a software size estimation model based on story points and lines of code, which significantly improved the estimated results [18].
Several scholars have explored the application of neural networks in software cost estimation [19,20,21]. Rankovic et al. proposed a software effort estimation method based on artificial neural networks and Taguchi orthogonal arrays. Singh et al. proposed homeostasis-adaption-based mutation operator differential evolution, which can be applied in software cost estimation and improve the convergence rate [22]. Ali et al. combined the bio-inspired feature selection algorithm with five widely used machine learning techniques and found that the feature selection algorithm helped improve the prediction accuracy in software cost estimation [23]. Suresh Kumar et al. used integrated learning methods for algorithm optimization based on multiple machine learning algorithms and achieved better estimation results [24].
2.2. Function Point Analysis
At present, the FPA method is more mature and widely used. The ISO organization has approved a variety of FP estimation methods as international standards: (1) IFPUG Function Points, proposed by the International Function Point Users’ Group (IFPUG) [25]; (2) Mark II FP Function Points, proposed by the British Software Metrics Association; (3) NESMA Function Points, proposed by the Netherlands Function Point Users Group (NEFPUG) [26]; and (4) Software Metrics COSMIC-FFP method, proposed by the Common Software Metrics Consortium (COSMIC).
The IFPUG method decomposes the software system into two types of basic FPs, namely transaction FPs, and data FPs, defining the complexity to adjust each FP and introducing 14 adjustment factors to adjust the results globally. The NESMA method proposes a classification rule based on the software logic model, which makes up for the shortcoming that IFPUG does not apply to early project estimation, and proposes a fast calculation method, which improves the efficiency of FP estimation. Meanwhile, COSMIC-FP is an extension of the IFPUG method. The method incorporates the analysis rules of control processes in real-time software systems to handle a large amount of single occurrence data in real-time systems, where the total FPs of the system are the sum of management FP and control FP. The Mark II method focuses on the lowest-level business processes of the application software and consists of three basic functional components: input, output, and reference. By not decomposing the application software in modules during the analysis, the computational errors caused by decomposing the system in IFPUG can be avoided.
Many scholars have optimized FPA to improve the software size estimation accuracy. Based on FPA, Silhavy et al. found that the segmentation method using categorical variables can improve the estimation accuracy more than the clustering method [27]. Frank Vijay et al. added a fuzzy algorithm to FPA to optimize the performance of the function point identification model [28]. Zhang et al. designed a deep-learning-based named entity recognition (NER) model to replace manual function point recognition, which improved the estimation accuracy [29].
2.3. Event Extraction
The event extraction task belongs to the field of information extraction in natural language processing, which focuses on the extraction of individual elements of events from the unstructured text for structured representation. It is a fundamental technique for practical applications such as knowledge mapping and information retrieval [30].
The traditional machine learning approach defines event extraction task modeling as a multi-classification problem. It requires the manual design of features and may generate errors in the extraction process of various features, resulting in the accumulation and propagation of errors. Ahn divided event extraction into multiple subtasks, using lexical features, dictionary features, syntactic features, and entity features to complete the trigger word classification subtask. Event types, trigger word features, entity features, and syntactic features are used to complete the event element classification subtask [31]. Deep learning-based methods use word vectors containing rich linguistic features as input to automatically extract features, significantly improving the prediction results. Chen et al. proposed an event extraction method based on a dynamic multi-pooling convolutional neural network, which can learn multiple events contained in a sentence using the dynamic multi-pooling method [32]. Nguyen et al. used Bi-LSTM to extract semantic features in a sentence, and combine it with the sentence structure features to extract both event trigger words and event elements [33].
3. Problem Definition
The FPA method is widely used in software size estimation due to the advantages mentioned above. FPA includes three components: information processing scale, technical complexity, and environmental factors. The information processing scale is the result of FP identified from the requirement documents according to the rules. Technical complexity is the difficulty of technical implementation of the software project, which is used as a local feature to adjust the individual FP weights. Environmental factors serve to integrate all factors to adjust all FPs from a global perspective. Among these three processes, the information processing scale occupies the largest workload and faces problems such as the high training cost of experts and long estimation time for large-scale projects, limiting the improvement of estimation efficiency. Therefore, it is necessary to find a method that can improve the efficiency of the information processing scale.
As shown in Table 1, each statement in the software requirements document is broken down into several columns for further analysis. Usually, the components of FP are distributed in the requirements statement and do not exist in the form of one entity. It is necessary to identify and merge the components to get the complete FP. The named entity recognition method in natural language processing can only identify the components of FP but cannot get the complete FP. Therefore, finding a method to automatically and structurally extract the FP from the requirement statements is the key issue of this paper.

Table 1.
Requirement sample from industry.
4. Method
The process of FP extraction method based on event extraction is shown in Figure 1. We mainly focus on the FP recognition tasks for the three transaction classes, EI (External Input), EO (External Output), and EQ (External Query), which are covered by the transaction function. Because the two data function transaction classes, ILF (Internal Logical File) and EIF (External Interface File), need to be identified manually and the data function transaction class already exists in the transaction function transaction class, the data function transaction class is no longer extracted. A transactional FP describes an operation or state change of data, the individual components of FP are manually identified from redundant requirement documents and constructed into an FP phrase. This task can be transformed into an event extraction task in natural language processing. The FP phrases can be considered as descriptions of events. The verb components of the FP phrase are equivalent to event triggers. FP components such as nouns and modifiers can be regarded as arguments of events. Categories of FP are equivalent to attribution of events. Therefore, FP can be extracted from requirement documents described in natural language, and be outputted in the form of a triplet {trigger, argument, attribution}.
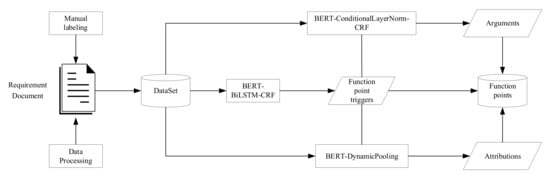
Figure 1.
Function point extraction process.
4.1. Dataset Construction
Before constructing the FP extraction model, we process and annotate the Chinese software requirement documents to construct the dataset for the model. The requirement statements are obtained from the original requirement document through document splitting and statement filtering. The event extraction method, which consists of an Event Trigger and Argument that describes the structure of the event, is used to process the requirement statement. Event Trigger is the word that can trigger the occurrence of an event, and it is also the most critical feature word that determines the event type and the event category/subcategory. Manually identify and classify FP phrases from requirement statements, split the FP phrases into trigger and argument, and next annotate the obtained individual components. FP phrases are obtained from requirement statements manually and split into Trigger and Argument.
We developed a method for labeling task features. To simplify the FP extraction task, we divide FP parameters into two categories: noun parameter and modifier parameter. And then annotate the triggers and parameters using the BIO annotation method, which labels each element as “B_trigger”, “I_trigger”, or “O”. “B_trigger” means that the element is in a fragment of type trigger and the element is at the beginning of the component. “I_trigger” means that the element is in a fragment of type trigger and the element is in the middle of the segment. “O” means it is not of any type. We use the category of FP phrases as event attribution. The annotation of the data is accomplished by the above rules.
4.2. Extraction of FP Triggers
The FP triggers extraction model proposed in this paper can be divided into three parts: BERT, BiLSTM, and CRF. The model takes the constructed trigger dataset as input. Word vectors are generated through the BERT layer, and input to the BiLSTM layer to further learn the dependency relationships in sentence sequences. Then inputs to the CRF layer to learn the relationships of state sequences, and finally predicts the FP trigger tagging sequences. The model structure is shown in Figure 2.
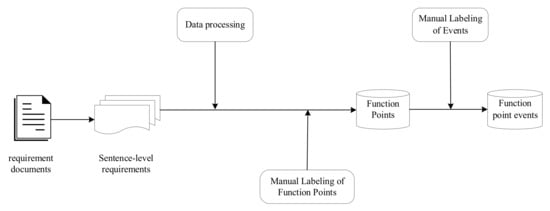
Figure 2.
Flowchart of dataset construction.
One of the main goals of the BERT layer is to extract rich semantic information from the input text. For the input text sequence, BERT will form the final embedding representation by adding the word embedding, segment embedding, and location embedding results into the corresponding embedding result sequence by matrix addition. Among them, the purpose of word embedding is to convert individual characters into a vector with fixed dimensions. Segment embedding is used to represent the sentence to which each word in the input text belongs. Location embedding adds the order information of the input sequence for the transformer in BERT. Then, the final sequence of text representation results and Text_representation is obtained by semantic feature extraction of transformer in BERT.
The word vector sequence obtained from the BERT layer is fed into the BiLSTM layer to obtain the output of the hidden layer. The function of BiLSTM is:
where is the word vector, denotes the parameter matrix, and denotes the output of BiLSTM. The vectors of the hidden layer are passed to the output layer of the BiLSTM model. And the feature matrix of the entire sequence is obtained:
where n and k are the size of the input sequence and the size of the label set, respectively.
is input to the CRF layer for the next step of classification labeling.
is denoted as the i-th word in the
-th label. The score of the whole BiLSTM-CRF model can be obtained by the followed formula:
where
is the label sequence corresponding to the input sequence.
is the score of the adjacent state transition matrix in the CRF model.
is the score of the output vector of the BiLSTM model.
After the normalization of
, the final probability formula of the model can be obtained:
where
denotes all possible labeling sequences.
CRF uses logarithmic probability to optimize the correct label sequence. For the training sample
and
, we have the following equation:
And CRF uses the maximum likelihood estimation function for the prediction of labeling, as shown in the following equation:
Finally, the predicted values of the function point triggers are obtained by the global feature constraints of CRF.
4.3. Extraction and Classification of FP Arguments
We use the BERT-CLN-CRF method to realize the task of FP argument extraction and classification. At first, the FP argument dataset is inputted to the BERT layer to generate the word vector representation. Then, the text is allowed to incorporate the semantic information of the trigger through the CLN layer, while the distance between the text and the trigger is incorporated into the word vector as a feature. Finally, it is input to the CRF layer to learn the state sequence relationship to obtain the recognized function point arguments. The general architecture of the model is shown in Figure 3.
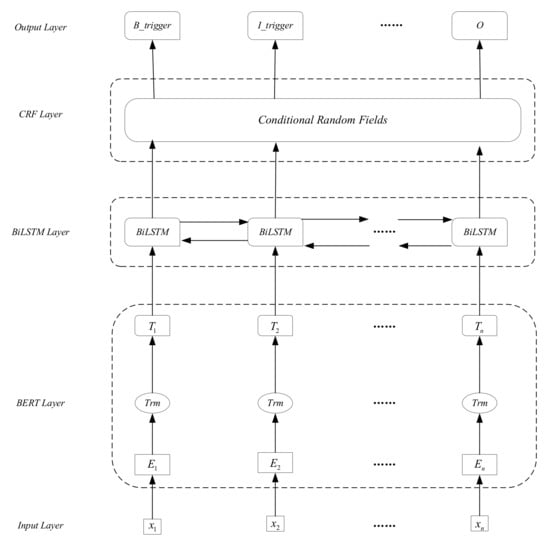
Figure 3.
Structure of triggers recognition model.
In models such as BERT and Transformer, the primary normalization method is LN (Layer Normalization). LN is a horizontal normalization that combines the inputs of all dimensions of a layer, calculates the mean and variance of that layer, and then transforms the inputs of each dimension using the same normalization operation with the following equation:
where
is all dimensions of the
-th sample,
and
are both network layer parameters obtained by back-propagation of the loss function. After calculating the mean
and standard deviation
, the distribution of
is normalized to a standard distribution in a fixed interval range by translating and telescoping the data through Equation (8). The final data obtained conform to a distribution with mean
and variance .
As shown in Figure 4, the CLN model transforms the input conditions to the same dimensions as
and
by two different transformation matrices, and then adds the two transformation results to
and
, respectively, to incorporate the information in the conditions. In this paper, we use the trigger information in the word vector output from the BERT layer as the input condition and transform the dimension to make the text incorporate the semantic information of the triggers.
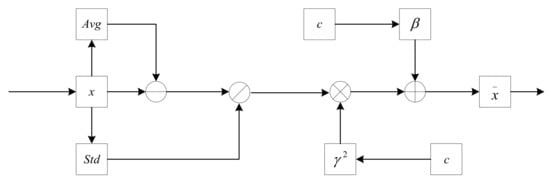
Figure 4.
Structure of CLN model.
Since the distribution of FP arguments in requirement description statements is usually related to FP triggers, fusing the location information of triggers in the input can provide rich syntactic information for the extraction of FP arguments. As shown in
Figure 5, we encode the distance between the text and the trigger and splice it into the word vector output by CLN, as an input to CRF. Based on the semantic and syntactic features extracted by BERT and CLN, the feature constraints are formed on the entire input sequence, which is used to determine the most reasonable set of label prediction values.
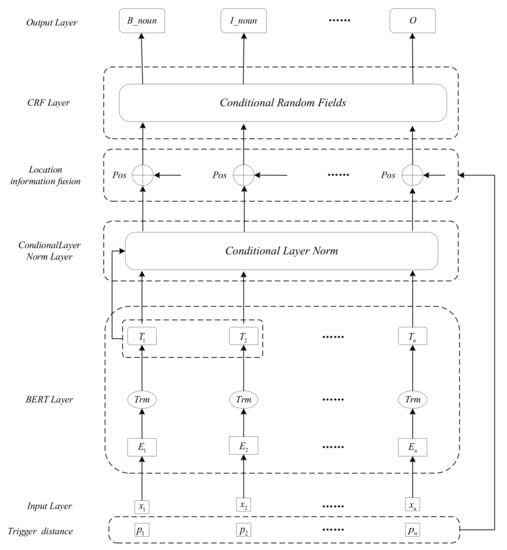
Figure 5.
Structure of arguments recognition model.
4.4. Classification of FP Attributions
We construct the BERT-DP model to realize the classification of FP attributions. This task is performed after the FP trigger identification and FP argument element identification tasks. The attribution of an FP is influenced mainly by the FP trigger word and the information around it. There may be two levels of cascading errors if the FP attribution classification task is based on the results of the first two tasks. Therefore, we keep the information near the trigger by setting the size of the window while masking off the redundant part and then input it to the BERT layer to get the vector Hidden_mask. The vector obtained by pooling operation classifies the FP attributions such as EI, EO, and EQ. The model is shown in Figure 6.
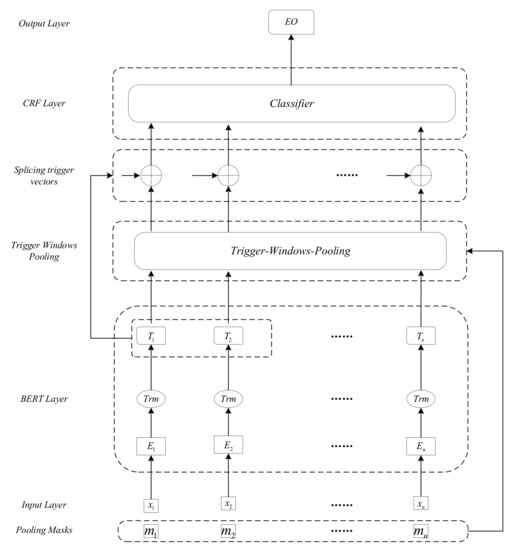
Figure 6.
Structure of attribution classification model.
5. Experiment
The experiment is designed to validate the feasibility and effectiveness of the proposed approach. We present the structure and parameters of the optimal model in each experiment and show the results of the experiments. The named entity recognition and manual recognition methods are also used for comparison.
5.1. Data Sources and Descriptions
In order to realize the digital government, the Chinese government has made great efforts in the overall management of the information systems of digital government, including the cost assessment of information systems. In practical application, there are many large-size government information systems. The estimation of software size is mainly realized by trained experts, which limits the application of software cost estimation in the field of government. Therefore, we chose the industrial case of government information systems to validate the effectiveness of our approach.
This paper constructs the dataset required for the experiment based on 10 government information system projects provided by X department. After data processing, the required documents of these projects contained 1432 available requirement statements. 1132 requirement statements were used as the training set, 150 requirement statements were used as the validation set, and 150 requirement statements were used as the test set. The identification of FPs was realized by five people specializing in software engineering. 5943 FPs were extracted, and the EI, EO, and EQ were 1394, 2361, and 2188, respectively.
5.2. Case Experiment
In software requirement statements, there are many cases where a statement has multiple FPs as well as a trigger or argument exists in multiple FPs. It is necessary to correctly match each component to extract the correct FP. To solve this problem, we construct the dataset as the input of the argument extraction model based on the identified triggers and construct the dataset as the input of the attribution classification model based on the set of the number of noun arguments, as shown in Table 2 and Table 3.
Table 2.
Construction of argument dataset.
Table 3.
Construction of attribution dataset.
5.2.1. FP Trigger Extraction
The BERT-BiLSTM-CRF model is used to extract triggers, and its network structure is shown in Table 4. In the BERT layer, the text and labels of the requirements statement are transformed into vectors and input to BERT for preprocessing to obtain a vector representation of the data, whose dimension is 768. In the BiLSTM layer, the number of inputs in the network and the output dimension of the embedding layer are the same, the dimensions of backward propagation and forward propagation are both 384. The identification of triggers is divided into three BIO kinds of labels, hence the output of the CRF layer is the same as the number of labels.
Table 4.
BERT-BiLSTM-CRF network structure.
5.2.2. FP Argument Extraction and Classification
The BERT-CLN model is used to extract the arguments, and its network structure is shown in Table 5. The BERT model transforms the input data into a vector of 768∗max_seq_len∗batch size to represent hidden. The trigger vector is extracted from hidden, whose dimension is converted to (trigger_len∗768) ∗ batch size, the trigger vector is incorporated into hidden through the CLN layer, and the result of the fused hidden dimension remains unchanged. The identification of the arguments is divided into three types: noun arguments, modifier arguments, and non-arguments, which can be classified into five types using the BIEO labeling method, and the output of the CRF layer has the same number of categories as the labels.
Table 5.
BERT-CLN network structure.
5.2.3. FP Attribution Classification
The BERT- DP model is used to implement the attribution classification of FPs, its network structure is shown in Table 6. The BERT model transforms the input data into a vector of 768∗max_seq_len∗batch size to represent hidden. The trigger vector is extracted from hidden, whose dimension is converted to (trigger_len∗768) ∗batch size. The window is set to five words each for the left and right of the trigger to keep the information around the trigger and mask off the rest. The max_seq_len dimension is converted to one dimension by pooling operation and then spliced with the trigger vector to obtain the vector dimension (768+trigger_len∗768) ∗batchsize needed for classification. The output of the fully connected layer NN is consistent with the number of tag categories of attribution, including EI, EO, and EQ.
Table 6.
BERT-DP network structure.
5.2.4. Experiment Environment
The experimental environment of this paper is shown in Table 7.
Table 7.
Experimental environment.
5.2.5. Evaluation Metrics
The evaluation criteria of the experiment consist of two parts, one is to judge the correctness of the task results, and the other is to calculate the metrics based on the evaluation criteria. Among them, the correctness of the task result is judged as follows: I. The FP triggers are considered correctly identified if the results match the annotated dataset. II. The identification of FP arguments is based on the results of FP triggers identification. When the trigger is identified correctly, we consider the result correct if the FP arguments identified by the model agree with the actual label. III. The identification of FP attributions is based on the results of FP triggers identification. When the trigger is identified correctly, we consider the result correct if the FP attributions identified by the model agree with the actual label.
The evaluation metrics for the FP extraction task include Precision, Recall and F1 (F1-score), which are defined as:
5.3. Results of the Experiment
We carried out three tasks to finalize the output for the FP phrases, and a sample of the predicted results is shown in Table 8. The first column is the input labeled data, including requirement text, triggers, arguments, and attributions of each FP, and the second column is the model output prediction data, including the predicted triggers, arguments, and attributions of each FP.
Table 8.
Samples of model predictions.
The task of trigger extraction actually uses the named entity identification technique to identify the trigger entities in the requirement statements. The verbs in the requirement statements are trigger words of FPs under a high probability, hence the accuracy rate of this task is high, as shown in Table 9, and the F1 value reaches 90.1%.
Table 9.
Results of FP trigger extraction.
The task of FP argument extraction and classification needs to fuse the trigger word information obtained in the previous step, which is relatively low affected by the propagation of trigger extraction errors. The arguments are divided into modified arguments (Arg_mod) and noun arguments (Arg_noun). As shown in Table 10, the modified arguments are less annotated and unevenly distributed, hence the results are poor, whose F1 value is 78.0%. The noun arguments are the main body of the arguments and are more evenly distributed, whose F1 value is 82.3%.
Table 10.
Results of FP attribution extraction.
The classification of FP attributions is based on the results of the trigger extraction task and arguments extraction task, which are affected by the errors of the two tasks. The FP attributions heavily depend on the trigger words and the surrounding information. But the task is a simpler classification task compared to the two sequence labeling tasks, hence the classification results of FP attributions can still reach an acceptable level. As shown in Table 11, the F1 values of EI, EO, and EQ are 71.1%, 75.6%, and 74.9%, respectively.
Table 11.
Results of FP attribution classification.
5.4. Compare Experiment
To test the function identification method based on event extraction (EE). We add a functional recognition method based on named entity recognition (NER) and a manual recognition method for the comparison experiment. Since the label labeling of the dataset is completed by the manual recognition method, the accuracy and other indicators of the manual recognition method are no longer displayed, only the time consumption of manual recognition is shown. The experimental results are shown in Table 12.
Table 12.
FP recognition and classification results.
The experimental results show that the function point recognition method based on NER achieves high accuracy, but the recall rate is low, leading to a low F1 of 65%. The function point recognition method based on EE has already included the function of named entity recognition in essence and added the technology of relation extraction, and the F1 reached 74%. The accuracy of NER and EE methods is the same, but the recall rate is quite different. We attribute this to the situation that multiple trigger words correspond to one entity. Compared with the NER method, the event extraction method can identify the function of the corresponding point according to the number of trigger words for all events, which avoids the function point missing and leads to a higher recall rate.
In order to verify the hypothesis, we split the existing dataset and divide it into two sub-datasets: one-to-one and many-to-many according to the correspondence between trigger words and entities. One-to-one refers to the relationship between one trigger word and one entity in the requirement statement, such as “query account balance”, which triggers only one event and corresponds to one function point. Many-to-many refers to the relationship in which multiple trigger words correspond to one or more entities. For example, “query and transfer account balance”. The two trigger words “query” and “transfer out” correspond to the same entity “account balance”, triggering two events corresponding to two function points. We conducted experiments on two sub-datasets, the results are shown in Table 13.
Table 13.
FP recognition and classification results on different datasets.
According to the experimental results in Table 13, both methods have achieved high accuracy and F1 value on the one-to-one dataset. However, the recall rate of the method based on NER on the many-to-many dataset is only 36.4%, which leads to a sharp drop of F1. The F1 of the event extraction method also declines but maintains a relatively stable performance. The results confirmed that our previous hypothesis was correct.
6. Discussion
In this study, a structured extraction method of FPs based on event extraction is proposed. The FP identification task is divided into four parts, and the model is trained with historical data to predict each component of FPs, which finally completes the structured recognition method for FPs. In the actual requirement documents, a requirement statement often has multiple FPs. The proposed method reduces the error by constructing the dataset in stages so that the model can identify only one FP phrase at a time. The FPs extracted from the requirement statements also need to be classified to calculate the number of unadjusted FPs. The attributions of FP events are primarily affected by the triggers and surrounding words, hence this paper takes the information of trigger words and their surrounding words as features to identify FP attributions. The experiment results show that our method can correctly identify more than 70% of FPs, which vastly reduces the working time of FP identification.
7. Conclusions
Software cost estimation techniques have been widely researched to solve software cost overruns and schedule delays. However, most of the academic studies are based on shared datasets to construct prediction models, which is challenging to practice. Usually, software cost estimation requires a lot of actual data to construct the prediction models, but the efficiency of manual software size estimation cannot meet this demand.
To achieve the automated estimation of software size, a structured approach that extracts transactional FPs based on event extraction is proposed. The BERT-BiLSTM-CRF method is used to identify FP triggers, the BERT-CLN-CRF method is used to extract FP arguments, and the BERT-DP model is used for the classification of FP attributions to achieve the structured extraction of FP phrases. The proposed method is validated using actual data from the government in recent years. The results show that our method has achieved acceptable accuracy in FP identification, which can significantly improve the efficiency of FP analysis.
However, the research in this paper still has some shortcomings that can be a direction for further research. On the one hand, compared with the fundamental techniques in natural language processing, the event extraction techniques are more complex, and the accuracy of prediction results is lower. Although it can substantially improve efficiency, there is still room for further improvement. On the other hand, the FP analysis method considers that the scale of the whole project consists of three parts: information processing scale, technical complexity, and environmental factors. The proposed method improves the efficiency of manual identification of FPs and solves the problem of the information processing scale. However, 14 system characteristic factors in technical complexity and factors such as system development efficiency in environmental factors are also essential parts of software size estimation, hence achieving a comprehensive software size estimation is a further research direction.
Author Contributions
Methodology, D.H. and G.L.; data and experiment, C.Z. and X.G.; writing—original draft preparation, D.H. and X.G.; writing—review and editing, G.L.; funding acquisition, G.L. and D.H. All authors have read and agreed to the published version of the manuscript.
Funding
This research was supported in part by the Shandong Provincial Natural Science Foundation of China under Grant ZR2020MG075, and in part by the Plan of Youth Innovation Team Development of Colleges and Universities in Shandong Province under Grant SD2019-161.
Data Availability Statement
The data presented in this study are not publicly available due to privacy issues.
Acknowledgments
The authors would like to thank the reviewers for their constructive comments.
Conflicts of Interest
The authors declare no conflict of interest.
References
- Heemstra, F.J. Software cost estimation. Inf. Softw. Technol. 1992, 34, 627–639. [Google Scholar] [CrossRef]
- Ren, A.; Yun, C. Research of software size estimation method. In Proceedings of the 2013 International Conference on Cloud and Service Computing, Kyoto, Japan, 4–6 November 2013; pp. 154–155. [Google Scholar] [CrossRef]
- Albrecht, A.J.; Gaffney, J.E. Software function, source lines of code, and development effort prediction: A software science validation. IEEE Trans. Softw. Eng. 1983, SE-9, 639–648. [Google Scholar] [CrossRef]
- Salmanoglu, M.; Hacaloglu, T.; Demirors, O. Effort estimation for agile software development: Comparative case studies using COSMIC functional size measurement and story points. In Proceedings of the 27th International Workshop on Software Measurement and 12th International Conference on Software Process and Product Measurement, Gothenburg, Sweden, 25–27 October 2017; pp. 41–49. [Google Scholar] [CrossRef]
- Mohagheghi, P.; Anda, B.; Conradi, R. Effort estimation of use cases for incremental large-scale software development. In Proceedings of the 27th International Conference on Software Engineering, St. Louis, MO, USA, 15–21 May 2005; pp. 303–311. [Google Scholar] [CrossRef]
- Saxena, V.; Shrivastava, M. Performance of function point analysis through UML modeling. ACM SIGSOFT Softw. Eng. Notes 2009, 34, 1–4. [Google Scholar] [CrossRef]
- Qin, Q.; Zhao, S.; Liu, C. A BERT-BiGRU-CRF model for Entity Recognition of Chinese Electronic Medical Records. Complexity 2021, 2021, 6631837. [Google Scholar] [CrossRef]
- Yu, H.; Li, H.; Mao, D.; Cai, Q. A relationship extraction method for domain knowledge graph construction. World Wide Web 2020, 23, 735–753. [Google Scholar] [CrossRef]
- Björne, J.; Salakoski, T. Biomedical event extraction using convolutional neural networks and dependency parsing. In Proceedings of the BioNLP 2018 Workshop, Melbourne, Australia, 19 July 2018; pp. 98–108. [Google Scholar] [CrossRef]
- Rashid, J.; Nisar, M.W.; Mahmood, T.; Rehman, A.; Syed, Y.A. A study of software development cost estimation techniques and models. Mehran Univ. Res. J. Eng. Technol. 2020, 39, 413–431. [Google Scholar] [CrossRef]
- Robles, G.; Capiluppi, A.; Gonzalez-Barahona, J.M.; Lundell, B.; Gamalielsson, J. Development effort estimation in free/open source software from activity in version control systems. Empir. Softw. Eng. 2022, 27, 135. [Google Scholar] [CrossRef]
- Heričko, M.; Živkovič, A. The size and effort estimates in iterative development. Inf. Softw. Technol. 2008, 50, 772–781. [Google Scholar] [CrossRef]
- Da Silva, C.M.B.; Loubach, D.S.; da Cunha, A.M. Applying the use case points effort estimation technique to avionics systems. In Proceedings of the 2008 IEEE/AIAA 27th Digital Avionics Systems Conference, St. Paul, MN, USA, 26–30 October 2008; pp. 5.B.4-1–5.B.4-10. [Google Scholar] [CrossRef]
- Daud, M.; Malik, A.A. Improving the accuracy of early software size estimation using analysis-to-design adjustment factors (ADAFs). IEEE Access 2021, 9, 81986–81999. [Google Scholar] [CrossRef]
- Coelho, E.; Basu, A. Effort estimation in agile software development using story points. Int. J. Appl. Inf. Syst. 2012, 3, 7–10. [Google Scholar] [CrossRef]
- Kang, S.; Choi, O.; Baik, J. Model-based dynamic cost estimation and tracking method for agile software development. In Proceedings of the 2010 IEEE/ACIS 9th International Conference on Computer and Information Science, Yamagata, Japan, 18–20 August 2010; pp. 743–748. [Google Scholar]
- Rankovic, N.; Rankovic, D.; Ivanovic, M.; Lazic, L. A new approach to software effort estimation using different artificial neural network architectures and Taguchi orthogonal arrays. IEEE Access 2021, 9, 26926–26936. [Google Scholar] [CrossRef]
- Sharma, A.; Chaudhary, N. Analysis of Software Effort Estimation Based on Story Point and Lines of Code using Machine Learning. Int. J. Comput. Digit. Syst. 2021, 12, 131–140. [Google Scholar] [CrossRef]
- Rankovic, D.; Rankovic, N.; Ivanovic, M.; Lazic, L. Convergence rate of Artificial Neural Networks for estimation in software development projects. Inf. Softw. Technol. 2021, 138, 106627. [Google Scholar] [CrossRef]
- Mohsin, Z.R. Investigating the use of an adaptive neuro-fuzzy inference system in software development effort estimation. Iraqi J. Comput. Sci. Math. 2021, 2, 18–24. [Google Scholar] [CrossRef]
- Rashid, J.; Kanwal, S.; Wasif Nisar, M.; Kim, J.; Hussain, A. An Artificial Neural Network-Based Model for Effective Software Development Effort Estimation. Comput. Syst. Sci. Eng. 2023, 44, 1309–1324. [Google Scholar] [CrossRef]
- Singh, S.P.; Singh, V.P.; Mehta, A.K. Differential evolution using homeostasis adaption based mutation operator and its application for software cost estimation. J. King Saud Univ.—Comput. Inf. Sci. 2021, 33, 740–752. [Google Scholar] [CrossRef]
- Ali, A.; Gravino, C. Improving software effort estimation using bio-inspired algorithms to select relevant features: An empirical study. Sci. Comput. Program. 2021, 205, 102621. [Google Scholar] [CrossRef]
- Suresh Kumar, P.; Behera, H.S.; Nayak, J.; Naik, B. A pragmatic ensemble learning approach for effective software effort estimation. Innov. Syst. Softw. Eng. 2022, 18, 283–299. [Google Scholar] [CrossRef]
- Garmus, D. A Guide to Sizing and estimating Projects Using international Function Point Users Group Function Points. In The IFPUG Guide to IT and Software Measurement, 1st ed.; Auerbach Publications: Boca Raton, FL, USA, 2012; pp. 30–39. [Google Scholar] [CrossRef]
- Board, N. Software Measurement in the Netherlands-The 25th Anniversary of Nesma. In Proceedings of the 2014 Joint Conference of the International Workshop on Software Measurement and the International Conference on Software Process and Product Measurement, Rotterdam, The Netherlands, 6–8 October 2014; pp. 125–126. [Google Scholar]
- Silhavy, P.; Silhavy, R.; Prokopova, Z. Categorical variable segmentation model for software development effort estimation. IEEE Access 2019, 7, 9618–9626. [Google Scholar] [CrossRef]
- Frank Vijay, J. Enrichment of accurate software effort estimation using fuzzy-based function point analysis in business data analytics. Neural Comput. Appl. 2019, 31, 1633–1639. [Google Scholar] [CrossRef]
- Zhang, K.; Wang, X.; Ren, J.; Liu, C. Efficiency improvement of function point-based software size estimation with deep learning model. IEEE Access 2020, 9, 107124–107136. [Google Scholar] [CrossRef]
- Wang, Q.; Mao, Z.; Wang, B.; Guo, L. Knowledge graph embedding: A survey of approaches and applications. IEEE Trans. Knowl. Data Eng. 2017, 29, 2724–2743. [Google Scholar] [CrossRef]
- Ahn, D. The stages of event extraction. In Proceedings of the Workshop on Annotating and Reasoning about Time and Events, Sydney, Australia, 23 July 2006; pp. 1–8. [Google Scholar] [CrossRef]
- Chen, Y.; Xu, L.; Liu, K.; Zeng, D.; Zhao, J. Event extraction via dynamic multi-pooling convolutional neural networks. In Proceedings of the 53rd Annual Meeting of the Association for Computational Linguistics and the 7th International Joint Conference on Natural Language Processing, Beijing, China, 26–29 July 2015; pp. 167–176. [Google Scholar]
- Nguyen, T.H.; Cho, K.; Grishman, R. Joint event extraction via recurrent neural networks. In Proceedings of the 2016 Conference of the North American Chapter of the Association for Computational Linguistics: Human Language Technologies, San Diego, CA, USA, 12–17 June 2016; pp. 300–309. [Google Scholar]
Publisher’s Note: MDPI stays neutral with regard to jurisdictional claims in published maps and institutional affiliations. |
© 2022 by the authors. Licensee MDPI, Basel, Switzerland. This article is an open access article distributed under the terms and conditions of the Creative Commons Attribution (CC BY) license (https://creativecommons.org/licenses/by/4.0/).