Abstract
This article presents a heuristic model to find the optimal route or layout of a subway electrical distribution network, obtaining full coverage of users in different scenarios and respecting technical criteria such as maximum distance to avoid voltage drop and capacity. In this way, the location of the transformer substations is achieved through an analysis of candidate sites. The medium voltage network will connect each transformer to a minimum spanning tree (MST), reducing the cost of materials associated with constructing the electrical grid. This work considers the latitude and longitude of each house and electrical count. Georeferenced scenario information is taken from the OpenStreetMap platform to provide an authentic context for distance and location calculations in the deployment of the power grid. The heuristic model offers to decrease time in solving the electrical network layout. As input variables, different powers of the "multi-transformer" transformers are considered to minimize the number of transformers and solve the power supply, reducing the transformers’ oversizing and minimizing the transformers’ idle capacity. The experimentation showed that none exceeded the limit allowed in an urban area of 3.5%.
1. Introduction
As the last link with the consumers, the electric distribution systems have the responsibility to comply with a safe and sufficient electric supply under resilience, quality, and reliability standards [1]. They guarantee having enough electrical energy available at all times to meet future demands [2].
The projection of electrical distribution systems that integrates the restrictions inherent to georeferencing [3,4] becomes a valuable tool for performance in electrical engineering.
In addition to contemplating technical criteria, the designs add optimization criteria to minimize the deployment cost [5]. The electrical distribution networks present technical and geographical limitations of an actual deployment; in this context, geographical information is obtained from OpenStreetMap of the city of Camagüey-Cuba for its simulation in Matlab. The code shows the performance of the modified Floyd–Warshall algorithm for routing the medium voltage network to feed the transformer stations selected in the heuristic, choosing the shortest path. The time taken to process the information and obtain results is small, according to the literature reviewed.
The code will meet the objectives of establishing an optimal model for distribution network routing. A model based on heuristics and graph theory is presented, as shown in Ref. [6], that can be incorporated into the computational language to perform applied research over time. This model considers variables not found in simulators; constraints used in distribution network designs are analyzed to minimize routing cost and user coverage without disregarding technical criteria such as voltage drop [7]. We compare the results obtained to establish the performance of the model presented and the reliability it offers; see the abstract image in Figure 1.
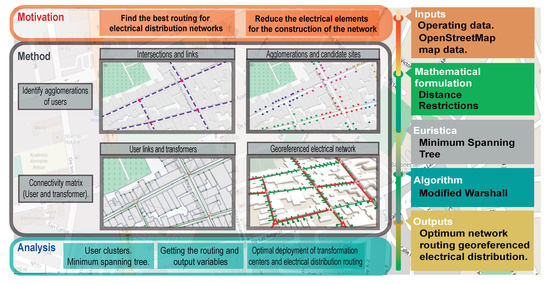
Figure 1.
Model for the optimal routing of electrical networks.
The work comprises two stages: The first stage is based on minimizing the number of transformers required to satisfy the demand of all users in the sample, identifying candidate sites when there is a more significant agglomeration of users. The users left without a link to the transformer are called stragglers and are reunited with the nearest transformer with sufficient capacity and respecting distances to avoid voltage drop.
The second stage starts from the location of the georeferenced transformers to obtain the shortest path connecting each transformer station; with the help of the Floyd–Warshall algorithm, it is possible to compare all possible routes and their distances.
It is noted that literature on the optimal routing of electrical networks generally uses a single power for the transformer stations, restricting the capacity of the transformers and the number of users to be connected in each station, which is far from reality. Consequently, varying the power of each transformer station gives a closer approach to reality; in the largest concentrations of users, a higher transformer power is installed, and in less agglomerated places, the transformer capacity is lower, saving on the cost of each equipment and in oversizing.
Due to the complexity of the problem, it has been considered as NP-Complete, but it can be evaluated in polynomial time by searching the local solution, so a heuristic is proposed to solve it. This heuristic is based on an algorithm using graph theory in which an initial connectivity matrix is generated with the only weight being the maximum distance allowed to avoid voltage drop, and other consequences, such as transformer capacity, are added. It is taken to the optimization field so that a set of candidate sites for the location of the transformers is obtained; these sites are street corners and street lighting poles.
The contribution of this paper is related to presenting a georeferenced scenario as opposed to traditional IEEE models. The distance restrictions in a model based on graph theory will be the weight that avoids connections that exceed the established value and thus avoid voltage drop; additionally, the costs in terms of meters of the conductor are reduced. On the other hand, the location of the transformers from a set of candidate sites is optimally chosen considering the transformer capacity restriction; in this sense, the resource used is optimized, avoiding oversizing or limited use in the transformers.
Henceforth, this article is organized as follows: Section 2 presents a brief state of the art with relevant works and the contribution of the present work. Section 3 presents the formulation of the problem and the methodology used in the research. Section 4 contains the results’ analysis and the proposed model’s validation. Finally, Section 5 presents the conclusions of this article.
2. Related Works
When reading about the routing of electrical distribution networks, planning, scalability, and reliability are criteria that motivate the state-of-the-art to support the heuristic model of this work. The literature indicates various ways to deal with the problem of optimal routing of electrical distribution networks, most of them based on graph theory. Additionally, solutions such as the Prim algorithm [8], Dijkstra [9], Kruskal [7], Floyd–Warshall [10], method mixed-integer linear programming [11], probabilistic techniques, ant colony [12], and slime mold algorithm [13], among others, are found.
Thus, to understand the load behavior in a georeferenced environment, the work of [1] was considered, with a GIS-based approach and machine learning to estimate the load profiles of a secondary substation. Three machine learning algorithms, regression tree, impulse, and random, are considered forests and geographic information system (GIS) information.
With the idea of finding the minimum spanning tree for the distribution network and understanding the different algorithms used, a look is made to [9]. It presents a mixed-integer programming (MIP) approach for the design of a new network configuration that satisfies the so-called two-step ladder design required by the planner, electrical constraints, such as power flow equations, high-voltage substation thermal transformers (HV/MV) limits, line thermal limits and a maximum number of customers per feeder.
In [10], the authors present a planning-based heuristic capable of providing near-optimal bidirectional communication if we talk about heuristics for solving multivariable problems. The model follows the structure of a hybrid Fiber-Wireless (FiWi) network to obtain electrical parameter information to help us manage energy usage by integrating the conventional electrical system with smart microgrids.
Intending to couple the electrical distribution with less distance and the geographical location of the elements, we have, as a reference [14,15], presented a way to insert the reliability in the planning models of the electrical network expansion from the georeferenced database of the (GIS) software developed with a friendly interface.
Other works using geographic location as an input variable are [16], which presents a GIS approach to map the power distribution network of Phuentsholing city. The digitized distribution network would be informative in effective network management, fast restoration of power lines, and finding new route maps for network expansions.
The heuristics presented in the paper and different decision making influenced by the work [17] proposed a combined multi-attribute decision-making method. The job found a more compromised configuration and compared it with other decision-making methods, such as weighted sum (WSM) and weighted product (WPM), and preference order technique by similarity with Ideal Solution Plan (TOPSIS).
The calculations and the development of the work are performed under limits or restrictions of the electrical distribution; taking into consideration [18], this paper deals with a methodology that can obtain a reasonable load and the generation profiles of the network fed by each substation. The results are synthetic networks, which do not correspond to real networks but are characterized in a realistic way to be used for all types of optimization studies that need to verify the constraints of the network.
Minimizing elements is directly proportional to reducing costs, as we can observe in [19], which presents a linear optimization model that considers these elements to identify the system design that minimizes costs and achieves a given CO2 emission limit. Consequently, the optimization results are analyzed by reducing the spatial resolution to increase the model’s scalability to larger systems.
The possibility of linking heuristics with databases or platforms that allow realistic simulation is studied in [20], which presents a methodology for planning using actual data, such as GIS, SCADA, and OMS; the optimization of the investment is addressed by a genetic algorithm that considers multiple study regions. Demand growth demands scalable heuristics and forward planning of the power grid, as seen in [21], which presents a methodology for load planning and feeder switching capable of restoring interrupted service. The restoration switching analysis moves from a multi-objective model, where the operator chooses the most suitable switching plan, to a single-objective optimization model for mechanical restoration.
Ref. [22] presents a single-step methodology for optimal microgrid design based on the virtual segmentation of a distribution system. The proposed method focuses on the optimal allocation and sizing of distributed generation and the determination of virtual cutoff lines to form an optimized set of microgrids.
The importance of grid impedance for calculating maximum distances are observed in [23], where he presents a case for GIS, Web, and 3D Web GIS-based power grid planning to create a smart grid, which is a tool for decision making. In addition, an analysis of the impedance of the network allowed different scenarios to optimize performance and obtain more efficient routes and better maintenance of the power grid and for future urban planning.
In the current work, a heuristic model is presented based on the diversification of the power of the transformers; when the agglomeration of users is more significant, the greater the power of the transformer to be selected, and the connection in medium voltage is achieved using graph theory and a modified Floyd–Warshall algorithm under a georeferenced scenario, as shown in Table 1.

Table 1.
Summary of proposals for optimal routing of electrical networks.
3. Problem Formulation
The first restriction [8] is that the heuristics must respect the allowed limits of transformer load and voltage drop on low voltage lines, medium voltage, and 100% coverage of users.
This sum of variables that work and complicate the choice of the best routing for the network poses an NP-complete combinatorial problem [21]; the literature presents heuristic methods and minimum spanning tree techniques [10]. The variables we will use to feed the heuristic model are shown in Table 2.
Table 2.
Input variables and constants.
The input variable was taken as a single unit demand for all users; the loads for public lighting are small compared to the load of users. For this reason, these are not considered in this study. The single-phase voltage () is the one measured from line to neutral, and () is the one taken from line to line, while () is of medium voltage [23].
The power factor will be designated by the typical consumption of the users [24], the resistance and reactance will be of the low-voltage conductor and the medium-voltage conductor, and the percentage of voltage drop corresponds to whether it is an urban or rural area.
The capacity of the transformers () is due to the most known commercial powers in the electrical distribution; the more variety of capabilities, the more options the code will have to choose the adequate capacity of the transformer for a concentration of users.
The transformer capacity established by the manufacturer must be evaluated according to the number of users. It is contemplated until the percentage of the transformer capacity decided by the distribution company by norm or standard is met. Then, to provide the code with an actual perspective on the simulation scenarios, information was obtained from OpenStreetMap [25], user locations, streets with their attributes, street intersections, and the latitude and longitude limits of the scenarios.
When calculating the distances between candidate sites, the law of semi versus spherical trigonometry is used; the Haversine Equation (1) or formula includes the average radius of the earth, offering an adequate calculation compared to the one used in the simulation and a more accurate and adequate calculation than the one it would have from Euclidean geometry.
The distance obtained between the users and the candidate sites was measured with the Manhattan [26] and Haversine, as shown in Equation (2), considering the second Theorem of Thales, as it indicates in Figure 2 when dealing with the low voltage network, whether subway or aerial.
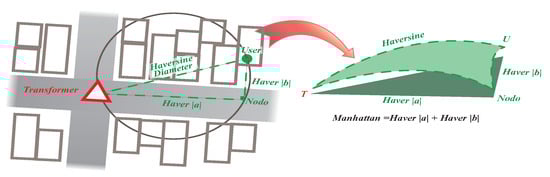
Figure 2.
Thales’ Second Theorem, Manhattan, Haversine.
It will have a node that will connect the user’s connection, forming an approximate angle of 90 degrees; the sum of the legs included will be the maximum distance the user can have concerned the transformer to avoid the voltage drop.
Depending on the power of the transformer, it obtains the maximum number of users that each transformation center can feed, as shown in Equation (3). To find the maximum distance from the transformer to the users, it calculates the intensity that passes through the conductor according to the loads arranged uniformly in each georeferenced lot, distinguishing if it is a three-phase or single-phase supply Equation (4).
The voltage variation between the transformer terminals and the load is the voltage drop [27,28] for the distance it travels through the conductor, which includes the resistance and reactance of the same that can be obtained from the manufacturing information of the conductors, in which k is a constant if it is a three-phase or single-phase power supply, as shown in Equation (5).
The maximum distance avoiding the voltage drop is given by Equation (6), and it is the product of the percentage voltage drop with the ratio of line voltage and voltage variation shown as a result of the distance in kilometers; the calculations are saved (), and a summary table for the five commercial powers in Table 3. Figure 3 shows the methodological process used in this work.
Table 3.
Power transformer properties ().
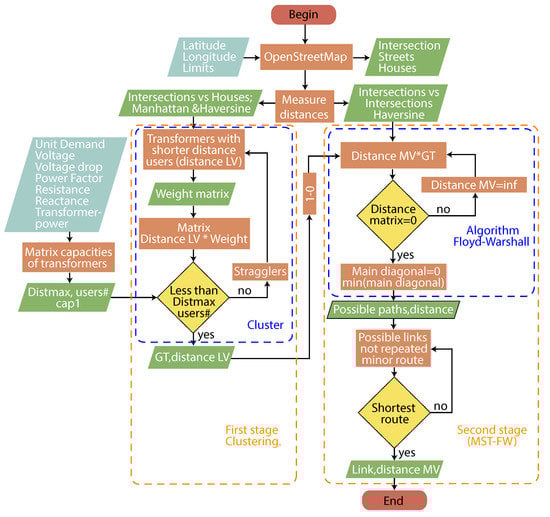
Figure 3.
Optimal routing flowchart.
3.1. First Stage—Clustering
In consequence, having an optimization vision, the objective function of the Equation (7) model is to minimize the number of transformers and the elements of the network (conductors, insulators, connectors, poles or boxes, protections) for its energy supply [29], therefore reducing the cost of construction, operation, and maintenance of the projected electrical distribution network, variables, and parameters as displayed in Table 4.
Table 4.
Parameter and variables.
To calculate the maximum distance that can have the link between the transformer and the user, using the lengths of candidate sites versus users (), a survey is made of the areas with the highest concentration of users; these sites are the ones that head a vector list to perform filtering of the location of the transformers.
The location of the transformers servicing the highest number of users (), and achieving that the ability, had a minimal distance, as shown in Equation (8).
Subject to:
Based on the practical method of locating the transformers with the largest capacity in the largest concentrations of users, a vector of probabilities that the users have for each candidate site is formed, giving priority to the users that have fewer connection possibilities, optimizing the capacity of the transformer to be deployed, complying with 100% coverage of the users, and forming a connection matrix between users and transformers (), as shown in Equations (9) and (10).
Supplies that do not connect to the transformers due to distance because voltage drop is avoided, on the other hand, were beyond the capacity of the nearest transformers. The algorithm identifies them as disconnected and then searches for the best alternative to ensure connectivity while meeting the allowed distance constraint.
Examining Scenario 2, the transformation centers are identified from the intersections of the streets obtained from OpenStreetMap. The relationship of the junctions with the users is by distance, and which users are closer to each corner can be seen in Figure 4a. Meanwhile, the lengths will be determined by the capacity of the transformer in uniform load distribution in descending order to the transformer with the lowest ability. The users will have at least one intersection nearby that complies with the maximum distance to avoid voltage drop and will have priority when selecting the links; the users that present more connection possibilities with the intersections will be in descending order to higher connection probability, as shown in Figure 4b, and the candidate sites for the transformers are shown in Figure 4c.
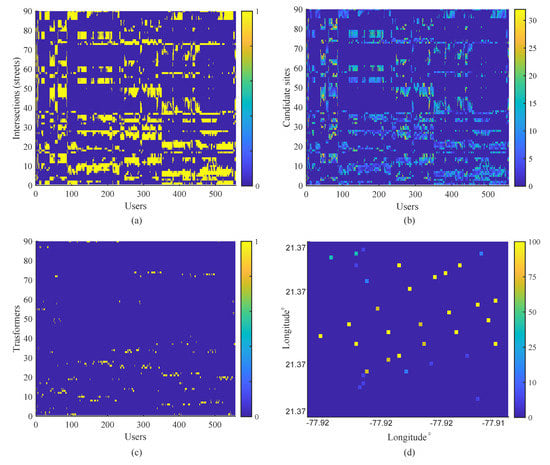
Figure 4.
Matrices from graph theory including distance variation.
The grouping of users is vast; the transformers with greater capacity of users are chosen, allowing optimizing the use of their own elements for the electrical deployment. Depending on where the candidate sits, the ability of each transformer will arrange, as shown in Figure 4d, and the georeferenced transformers are shown in Figure 5.
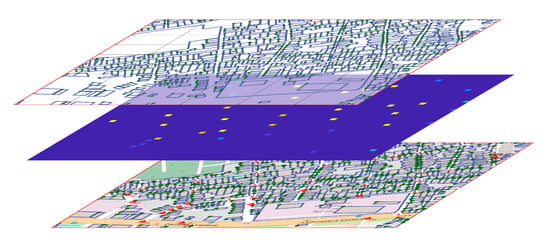
Figure 5.
Transformers (kVA) georeferenced - Cross layer in a georeferenced area.
3.2. Second Stage (MST-FW)
Then, we start with the transformers’ optimal local location in what was previously used as candidate sites. In the literature studied to find a minimum spanning tree, many algorithms allow us to connect all the transformers; this work is focused on the Floyd–Warshall algorithm [10] as shown in Equation (11), which was modified to find the shortest path between selected vertices of a graph. Not all vertices will be connected: only those identified as transformers and vertices on the path for routing.
Subject to:
The first constraint will be 100% of the transformers connected in a three-phase distribution line, as shown in Equation (12). Then, taking the name of (), these paths will be chosen by the heuristic model, selecting the links that allow the optimal routing complying with the criteria of maximum distance for voltage drop. The links established between transformers cannot be repeated; there will only be links when there is a street between the two candidate sites, thus respecting the geographical restrictions of not passing an electrical distribution network over houses, parks, and restricted areas.
4. Analysis of Results
Case Study Parameters
The model of optimal routing of electrical distribution networks considering heuristic methods and geo-positioning constraints was performed under the MATLAB numerical computation system; the four simulated scenarios are performed on a Dell Precision 7510 laptop computer with an Intel Xeon 2.9 GHz, 64 GB RAM, Windows 10 64-bit operating system.
The parameters and technical values were selected according to the literature of articles related to electrical distribution networks, as shown in Table 5.
Table 5.
Parameters for scenarios.
Four simulations of the optimal routing model were carried out with the same parameters, with a more significant number of users and geographical areas in different scenarios. The georeferenced samples were taken from the city of Camagüey-Cuba for integrated mapping; a network deployment in MV [30,31] is shown with a red line and the LV network is shown in green, the connections with broken green lines are observed, and the users are represented as green dots.
In the first scenario, we optimized ten candidate sites to 6 transformer stations of different capacities distinguishing single-phase transformers from three-phase transformers, with a medium voltage network of 0.354 km and a low voltage network of 3 km, with total coverage for the 98 users of the sample, as shown in Figure 6 Stage 1.
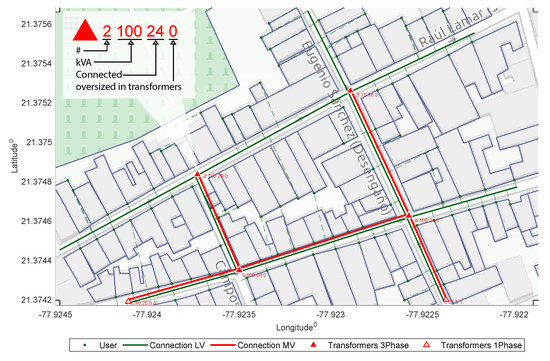
Figure 6.
Stage 1 - Electrical deployment.
In the second scenario, Stage 2, as shown in Figure 7, the optimization goes from 90 candidate sites to 40 transformer stations of different capacities, as shown in Table 6, with a medium voltage network of 2.4 and a low voltage network of 21 km, with total coverage of the 557 users of the sample. The blue box in the scenarios identifies the previous design with fewer users to appreciate the scalability of the model.
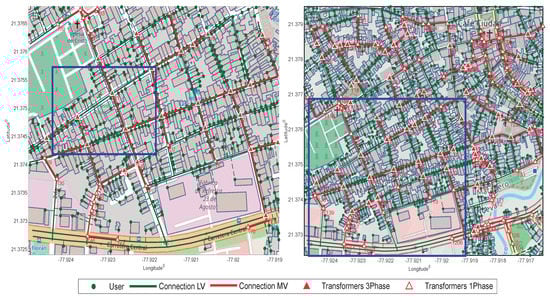
Figure 7.
Stage 2 & Stage 3 - Electrical deployment.
Table 6.
Number of transformers for each scenario.
In the third scenario, Stage 3, as shown in Figure 7, the optimization goes from 258 candidate sites to 108 transformer stations, with a medium voltage network of 6 km and a low voltage network of 56 km, with total coverage of 1356 users.
In the fourth scenario, Stage 4, as shown in Figure 8, the optimization goes from 858 candidate sites to 337 transformer stations, with a medium voltage network of 18 km and a low voltage network of 193 km, with total coverage of 4338 users.
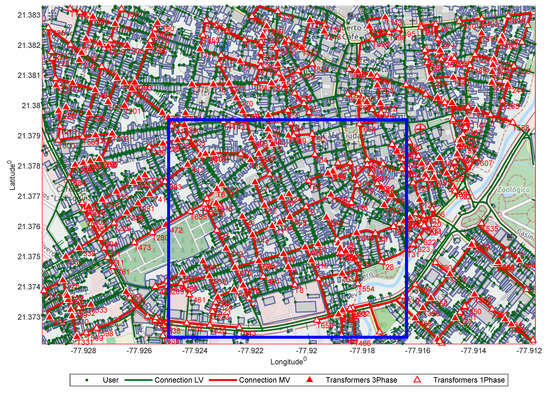
Figure 8.
Stage 4 - Deployment of the electric distribution grid.
In the perimeter drawn by the blue line between one scenario and another, there is a variation in the routing of the network and the location or power of the transformers because new candidate sites are available for a better place for the transformers, with the same logic: the transformers that are single-phase in the margin in the following scenario with more agglomerated users will be three-phase with greater power.
The routing that is not close to the perimeter of the sample will be the same for the following scenarios presenting scalability criteria.
One of the technical restrictions to meet was the voltage drop in the low-voltage line of an electrical distribution system, which goes from the transformer to the user; in Figure 9a, the voltage drop of each intermediate user in Figure 7 (Stage 2) can be seen. None exceeded the limit allowed in an urban area of 3.5% ().
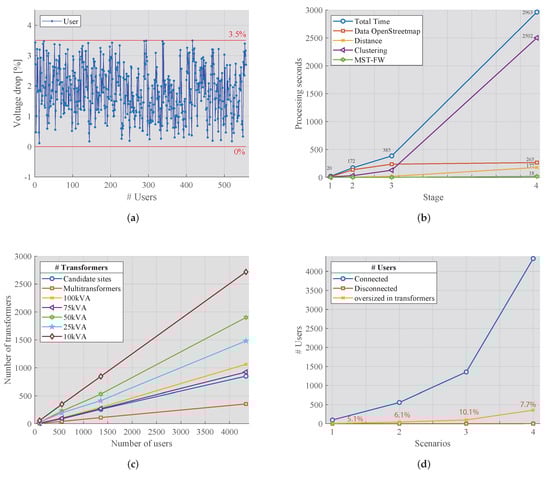
Figure 9.
Variation of # of transformers vs # of supplies including voltage drop.
Figure 9b shows the processing time in seconds versus the number of users in each scenario. In the heuristic, to solve an NP-complete problem, the times are taken to observe how the different processes are developed, obtaining and arranging the OpenStreetMap information, calculating distances, grouping users, and using the minimum spanning tree to connect to the transformation centers.
Depending on the geography of the sample and the grouping of users, it is noted that the MST based on the Floyd–Warshall algorithm has a fast resolution, which is followed closely by the calculation of distances and georeferenced information. However, grouping users takes more processing time due to the census and comparing all candidate sites with the users to obtain the place to locate the transformer.
In the most significant sample of 4338 users, it took 49.3 min; the model presents a high-resolution speed according to what is reviewed in the literature.
The model shows that by diversifying the power of the transformers (multi-transformers), there is a better deployment to cover the supply of agglomerations of users, minimizing the idle capacity of the same; a comparison of the same code is made, limiting it to a general power of the transformers (10, 25, 50, 50, 75, 100) kVA; also, the candidate sites are included, as shown in Figure 9c.
Then, we verify that the curve designated by multi-transformers is below the other simulations and candidate sites.
Figure 9d compares the users connected to the transformers with the unoccupied capacity of the transformer and those not associated due to ability or distance. It is seen that the coverage of the connected users is 100% of the sample in the different scenarios, leaving the disconnected users without a place; the percentage of unused capacity in the transformers is low compared to the number of users in the sample.
The heuristics show us problems such as the division of feeders according to the loads and the current limit that the conductors would have in MV to not overload a line and be able to perform load balancing.
Within the attributes of the OpenStreetMap platform, it is possible to distinguish the hierarchy of the streets as primary, secondary, and tertiary, between others, helping to prioritize the road with the best space for the installation and maintenance of the electrical network to be deployed.
In the code, users have a unitary demand for all, limiting the simulation to a deployment closer to reality, losing the variety of unitary needs in a distribution system.
The model has been implemented to distinguish different medium voltage feeders according to their load and distance traveled.
Therefore, importance is given to the streets or roads that are most useful for the passage of the electrical network as primary, secondary, and tertiary roads, which the OpenStreetMap platform offers us as an attribute.
In future work, it is intended to obtain an actual or similar database of the users with their demands and select the transformers based on this database, which is an essential step for the simulation to be more accurate.
5. Conclusions
An optimal model for routing distribution networks was established considering technical variables, capacity, and coverage, and the power of the transformers was diversified so that the heuristic can select it by its ability, the most adequate for the agglomerates, allowing savings by minimizing the unused capacity of the transformers, which are unpublished parameters for the design.
Complying with the technical restrictions used in the design of distribution networks and the geographical limits of the area when the scenarios are established, it was possible to minimize the cost of routing and coverage of the users by having fewer elements and distances for the deployment of the electrical distribution network.
The heuristic optimization model did not change its routing in the evaluation process; it readjusts by changing any input parameter or increasing its extent and the number of users, which increases loads over time, demonstrating scalability.
It was possible to minimize the idle capacity of the transformers with the best location and optimal power selection. Furthermore, it was necessary to take into account the lagging users that were left out of the first selection and then form a link to another nearby transformer that meets the distance to avoid voltage drop; the model is executed by investing little resolution time for the deployment of the electrical distribution network.
Despite simulating with many users, Floyd Warshall’s algorithm offers an all-against-all comparison with a high-resolution speed, allowing the information processing to find the best routing by comparing the distances obtained from the different paths studied.
Evaluating a hybrid network with an aerial and underground deployment that identifies contingencies becomes a challenge for future work. Depending on what is evaluated in the network, an electrical distribution network expansion scenario that presents a growth but considers corrections to an urban, suburban, or rural network will also be possible.
Author Contributions
H.L.: Conceptualization, Methodology, Validation, Writing—review and editing. E.I.: Conceptualization, Methodology, Software, Writing—original draft. H.L.: Data curation, Formal analysis. E.I.: Supervision. E.I., H.L. Writing—review and editing. All authors have read and agreed to the published version of the manuscript.
Funding
Universidad Politécnica Salesiana and GIREI supported this work as part of the Smart Grid Research Group under the project Electric Vehicle Charging in Buildings and its Impact on the Sizing and Planning of Electrical Distribution Networks.
Data Availability Statement
Not applicable.
Acknowledgments
This work was financially funded by the Smart Grid Research Group (GIREI) of Universidad Politécnica Salesiana and Power Grids and Smart Cities (RECI), Salesian Institutions of Higher Education (IUS).
Conflicts of Interest
The authors declare no conflict of interest.
References
- Bosisio, A.; Moncecchi, M.; Morotti, A.; Merlo, M. Machine learning and GIS approach for electrical load assessment to increase distribution networks resilience. Energies 2021, 14, 4133. [Google Scholar] [CrossRef]
- Jooshaki, M.; Karimi-Arpanahi, S.; Lehtonen, M.; Millar, R.J.; Fotuhi-Firuzabad, M. Reliability-Oriented Electricity Distribution System Switch and Tie Line Optimization. IEEE Access 2020, 8, 130967–130978. [Google Scholar] [CrossRef]
- Valenzuela, A.; Inga, E.; Simani, S. Planning of a resilient underground distribution network using georeferenced data. Energies 2019, 12, 644. [Google Scholar] [CrossRef]
- Inga, E.; Campaña, M.; Hincapié, R.; Moscoso-Zea, O. Optimal deployment of FiWi networks using heuristic method for integration microgrids with smart metering. Sensors 2018, 18, 2724. [Google Scholar] [CrossRef] [PubMed]
- Diaaeldin, I.M.; Aleem, S.H.; El-Rafei, A.; Abdelaziz, A.Y.; Zobaa, A.F. A novel graphically-based network reconfiguration for power loss minimization in large distribution systems. Mathematics 2019, 7, 1182. [Google Scholar] [CrossRef]
- Ustun, T.S.; Ayyubi, S. Automated network topology extraction based on graph theory for distributed microgrid protection in dynamic power systems. Electronics 2019, 8, 655. [Google Scholar] [CrossRef]
- Inga, E.; Campaña, M.; Hincapié, R.; Moscoso-Zea, O. Optimal dimensioning of electrical distribution networks considering stochastic load demand and voltage levels. Commun. Comput. Inf. Sci. 2018, 833, 200–215. [Google Scholar] [CrossRef]
- Pavón, W.; Inga, E.; Simani, S. Optimal routing an ungrounded electrical distribution system based on heuristic method with micro grids integration. Sustainability 2019, 11, 1607. [Google Scholar] [CrossRef]
- Bosisio, A.; Berizzi, A.; Amaldi, E.; Bovo, C.; Sun, X.A. Optimal feeder routing in urban distribution networks planning with layout constraints and losses. J. Mod. Power Syst. Clean Energy 2020, 8, 1005–1014. [Google Scholar] [CrossRef]
- Inga, E.; Inga, J.; Ortega, A. Novel approach sizing and routing of wireless sensor networks for applications in smart cities. Sensors 2021, 21, 4692. [Google Scholar] [CrossRef]
- Gholizadeh-Roshanagh, R.; Zare, K.; Marzband, M. An A-Posteriori Multi-Objective Optimization Method for MILP-Based Distribution Expansion Planning. IEEE Access 2020, 8, 60279–60292. [Google Scholar] [CrossRef]
- Wang, Z.; Lin, D.; Zeng, G.; Yu, T. A Practical Large-Scale Distribution Network Planning Model Based on Elite Ant-Q. IEEE Access 2020, 8, 58912–58922. [Google Scholar] [CrossRef]
- Püvi, V.; Millar, R.J.; Saarijärvi, E.; Hayami, K.; Arbelot, T.; Lehtonen, M. Slime mold inspired distribution network initial solution. Energies 2020, 13, 6278. [Google Scholar] [CrossRef]
- Kisse, J.M.; Braun, M.; Letzgus, S.; Kneiske, T.M. A GIS-Based planning approach for urban power and natural gas distribution grids with different heat pump scenarios. Energies 2020, 13, 4052. [Google Scholar] [CrossRef]
- Miloca, S.A.; Volpi, N.M.; Yuan, J.; Pinto, C.L. Expansion planning problem in distribution systems with reliability evaluation: An application in real network using georeferenced database. Int. J. Electr. Power Energy Syst. 2015, 70, 9–16. [Google Scholar] [CrossRef]
- Dorji, C.; Khawash, S.; Lhamo, C.; Drukchen, N. GIS Approach to Distribution Network of Phuentsholing Town. In Proceedings of the 2015 International Conference on Computational Intelligence and Communication Networks, CICN 2015, Jabalpur, India, 12–14 December 2015; pp. 1515–1519. [Google Scholar] [CrossRef]
- Kamble, S.G.; Vadirajacharya, K.; Patil, U.V. Decision making in power distribution system reconfiguration by blended biased and unbiased weightage method. J. Sens. Actuator Netw. 2019, 8, 20. [Google Scholar] [CrossRef]
- Pisano, G.; Chowdhury, N.; Coppo, M.; Natale, N.; Petretto, G.; Soma, G.G.; Turri, R.; Pilo, F. Synthetic models of distribution networks based on open data and georeferenced information. Energies 2019, 12, 4500. [Google Scholar] [CrossRef]
- Hauk, C.; Ulbig, A.; Moser, A. Integrated planning of grids and energy conversion units in municipal multi-energy carrier systems. Energy Inf. 2021, 4, 19. [Google Scholar] [CrossRef]
- Medeiros, T.S.; Almeida, C.F.; Kagan, N.; Kagan, H.; Rosa, L.H.; Gemignani, M.M.; Vasconcelos, F.M.; Dominice, A.; Santos, F.A.; Silva, E.D.; et al. Distribution Systems Planning Considering Operational Performance and Power Quality Indices. J. Control Autom. Electr. Syst. 2021, 32, 1678–1689. [Google Scholar] [CrossRef]
- Leite, J.B.; Peralta, R.A.V.; Mantovani, J.R.S. Restoration switching analysis in the integrated architecture for distribution network operation. Electr. Power Syst. Res. 2021, 194, 107069. [Google Scholar] [CrossRef]
- Bonetti, C.; Bianchotti, J.; Vega, J.; Puccini, G. Optimal segmentation of electrical distribution networks. IEEE Lat. Am. Trans. 2021, 19, 1375–1382. [Google Scholar] [CrossRef]
- Hamza, M.H.; Chmit, M. GIS-Based Planning and Web/3D Web GIS Applications for the Analysis and Management of MV/LV Electrical Networks (A Case Study in Tunisia). Appl. Sci. 2022, 12, 2554. [Google Scholar] [CrossRef]
- Toorchi, N.; Hu, F.; Bentley, E.S.; Kumar, S. Skeleton-Based Swarm Routing (SSR): Intelligent Smooth Routing for Dynamic UAV Networks. IEEE Access 2021, 9, 1286–1303. [Google Scholar] [CrossRef]
- Abhilash, B. Geo-referenced synthetic low-voltage distribution networks: A data-driven approach. In Proceedings of the 2021 IEEE PES Innovative Smart Grid Technologies Europe (ISGT Europe), Espoo, Finland, 18–21 October 2021; pp. 1–6. [Google Scholar] [CrossRef]
- Teh, E.K.; Zawawi, M.A.M.; Mohamed, M.F.P.; Isa, N.A.M. Practical full chip clock distribution design with a flexible topology and hybrid metaheuristic technique. IEEE Access 2021, 9, 14816–14835. [Google Scholar] [CrossRef]
- Valenzuela, A.; Montalvo, I.; Inga, E. A decision-making tool for electric distribution network planning based on heuristics and georeferenced data. Energies 2019, 12, 4065. [Google Scholar] [CrossRef]
- Youssef, K.H. Optimal routing of ring power distribution systems. Electr. Power Syst. Res. 2021, 199, 107392. [Google Scholar] [CrossRef]
- Huo, J.; Yang, J.; Al-Neshmi, H.M.M. Design of Layered and Heterogeneous Network Routing Algorithm for Field Observation Instruments. IEEE Access 2020, 8, 135866–135882. [Google Scholar] [CrossRef]
- Abeysinghe, S.; Wu, J.; Sooriyabandara, M.; Abeysekera, M.; Xu, T.; Wang, C. Topological properties of medium voltage electricity distribution networks. Appl. Energy 2018, 210, 1101–1112. [Google Scholar] [CrossRef]
- Ma, Z.F.; Jiang, M.; Khoshmanesh, M.; Cheng, X. Time Series Phase Unwrapping Based on Graph Theory and Compressed Sensing. IEEE Trans. Geosci. Remote Sens. 2022, 60, 1–12. [Google Scholar] [CrossRef]

Publisher’s Note: MDPI stays neutral with regard to jurisdictional claims in published maps and institutional affiliations. |
© 2022 by the authors. Licensee MDPI, Basel, Switzerland. This article is an open access article distributed under the terms and conditions of the Creative Commons Attribution (CC BY) license (https://creativecommons.org/licenses/by/4.0/).