Abstract
Music has an increasing impact on people’s daily lives, and a sterling music recommendation algorithm can help users find their habitual music accurately. Recent research on music recommendation directly recommends the same type of music according to the specific music in the user’s historical favorite list. However, users’ behavior towards a certain cannot reflect the preference for this type of music and possibly provides music the listener dislikes. A recommendation model, MCTA, based on “User-Point-Music” structure is proposed. By clustering users’ historical behavior, different interest points are obtained to further recommend high-quality music under interest points. Furthermore, users’ interest points will decay over time. Combined with the number of music corresponding to each interest point and the liking degree of each music, a multi-interest point attenuation model is constructed. Based on the real data after desensitization and encoding, including 100,000 users and 12,028 pieces of music, a series of experimental results show that the effect of the proposed MCTA model has improved by seven percentage points in terms of accuracy compared with existing works. It came to the conclusion that the multi-interest point attenuation model can more accurately simulate the actual music consumption behavior of users and recommend music better.
1. Introduction
With the rapid development of the Internet and the explosive growth of mobile terminals, modern society has entered the era of information overload from lack of information [1,2]. In addition, people spend much more time listening to music than reading and watching movies in their daily life [3]. Music has become an indispensable part of human society.
In the face of massive content, users need to spend a lot of time and energy to select the content they are interested in, which makes it difficult to choose. To alleviate the problems caused by information overload, technologies such as information classification, search engines, and recommendation systems came into being [4,5]. The recommendation system has currently achieved great success in many fields, such as Amazon in e-commerce, YouTube in video, and Last.fm radio in music [6]. With the rapid rise of streaming media services such as iTunes, Spotify, and Pandora, automatic music recommendation services that allow listeners to actively explore new music have entered the vision of researchers [7]. Furthermore, different from most other recommendation domains, predominantly using collaborative filtering techniques, the content-based approaches wok better in music recommendation [8].
Many researchers have proposed their own personalized recommendation algorithms, but these recommendation algorithms do not take into account the users’ actual consumption habits of music and the essential difference between music and other recommended targets. The user’s preference for music depends not only on the music itself, but on the user’s geographical location and the culture behind the music [9]. Therefore, it cannot be considered that the user likes music similar to a certain music he/she liked. It is necessary to comprehensively consider other music that the listener likes, find the user’s point of interest, and recommend other songs under the point of interest.
Through in-depth analysis of 100 million real users of Kugou music APP, we recommend music more in line with their consumption habits for users from the perspective of users’ actual consumption behavior. The research of this project can also play a certain reference role in the field of music recommendation.
Our contributions are summarized as follows:
- -
- We remodel the traditional “User-Music” recommendation framework into “User-Points of Interest-Music”. Compared with single music recommendation, music recommendation using interest points composed of multiple pieces of music can achieve a more stable recommendation effect.
- -
- We develop a music clustering model to extract the interest points for a music recommendation system, ignoring if the length of the music list consumed is short or not, with no need to set the number of clusters in advance. It still works well for the niche music.
- -
- We propose a music interest attenuation algorithm considering the uneven distribution of music recommendation systems. This slows down the decay rate of interest points the user prefers and speeds up the decay rate of interest points that users do not like very much in the same time window, mitigating the Matthew effect of the system.
The rest of this paper is organized as follows. Section 2 introduces several related papers about music recommendation. Our approach is described in Section 3. In Section 4, we present our experimental framework, and the results of our approach are shown to prove the recommended effect of the new proposed music recommendation model. Finally, concluding remarks and an outlook on future research will be given in Section 5.
2. Related Work
Music recommendation has developed rapidly in the field of recommendation in recent years, and many related recommendation algorithms have been proposed. When discussing users’ multi-interest points and time decay behavior, researchers divide users’ historical behavior into long-term, short-term, and medium-term behavior according to time [10,11,12]. However, it should be noted that users still have multiple points of interest at the same stage, and the time attenuation behavior of each point of interest is different: the higher the degree of interest, the less obvious the time attenuation behavior. For example, some users often listened to “pop” style and “rock” type songs a year ago and collected and downloaded a large number of “rock” type songs. For a reasonable time attenuation algorithm, within the same attenuation period, the user’s score of “rock” should be much greater than that of “pop”.
Most studies mainly use users’ recent music consumption behavior to recommend similar music. It is obvious that the user’s recent consumption behavior can best represent the user’s current preference [13]. The work in [14] extracted the rhythm, timbre, beat, and other elements of music recently consumed by users from the perspective of music acoustics, and recommended music with similar acoustic characteristics for users. However, each user pays different attention to each acoustic element, and the acoustic characteristics are not all reasons why users like a piece of music. Recommending music to users that matches their current mood can achieve a better recommendation effect [15]. Compared with the acoustic characteristics of music, the effect of emotional state on whether users like a piece of music is more obvious. In addition to the acoustic characteristics of music and the emotional characteristics of users, the research in [16] respectively used the text information and acoustic information of music for recommendation, and finally fused the two recommendation lists by using the sorting hybrid model.
The short-term music consumption behavior is not enough to reflect users’ all-around interests and hobbies, so users’ music consumption habits need to be taken into account. To achieve this, ref. [17] extracted the acoustic features of each music, and then calculated the average value of the acoustic features of all historical music as the feature vector of the user. However, when listening to music, many users do not focus on factors such as timbre and beat, resulting in no significance in the final average result. As the most widely used recommendation algorithm in the field of recommendation, collaborative filtering algorithm has been favored by researchers in the field of music recommendation. The work in [18] looked for similar users through the “User-Music” scoring list, and then recommended the music of similar users to the target users. However, different users have different scoring preferences. Some users will also score higher for music that they do not really like so much, while conservative users will generally score lower. Therefore, it is not rigorous to use the scoring similarity between the two users alone.
Analyzing all historical behaviors of users can give a more comprehensive description of users, but it will make the recommendation cycle longer and the real-time update effect is not ideal. Therefore, it is necessary to select the user behavior in an appropriate time window [19]. In the research [20], the recent listening behavior of users was analyzed, to match whole similar behaviors in history and make recommendations. However, this long-term and short-term behavior fusion method cannot fully reflect all long-term preferences of users. It was believed that the playlist of the user’s current session can represent the context of the user’s next song listening behavior [21]. They predicted the user’s behavior and recommended it by analyzing the music sequence. The author of [22] mined the potential behavior sequences of users with the help of Prefix-Projected Pattern Growth model and analyzed these sequences through the Markov model.
As a classical topic extraction model, LDA (Late Dirichlet Allocation) is widely used in user multi-interest point modeling [23]. The LDA model was used to mine the potential topic distribution of music and recommended it through a collaborative filtering algorithm [24]. After obtaining the audio features of music through the LDA model, and combining the release date of music, the SVM model was used to classify pop music [25]. The distribution of users’ multiple points of interest can be obtained by LDA, but the expected effect cannot be achieved when using the topic vector for music recommendation. Moreover, with large data sets, the training cycle of the LDA model is long and the update of the recommendation list is slow. The research in [26] used music tags and the LDA model to obtain the potential theme vector of music, and finally trained the LSTM model for timing modeling.
Recently, research on recommender systems emerged that aims at enhancing the traditional data-driven techniques with psychological constructs [27]. The users’ personality traits were considered in [28], where the authors adapt the level of diversity in the recommendation list according to the personality traits of the user by reranking the results of a CF system. The research in [29] exploited the user’s affective state in the music recommendation system. Using natural language processing techniques on a corpus of microblogs, they reached the emotional state and music listening information of the target user and integrate this contextual information into other models such as CF and random rank.
The above research recommends other music of this type based on the user’s single music. However, in many cases, users consume music because of some special needs, and all the music they have consumed should be considered to determine whether the user likes this type of music. We cluster users’ historical music to obtain their favorite types, and further recommend other music under this type for users. In addition, we design a decay model to simulate the changing behavior of users to different types of music. The following section explains the proposed approach in detail.
3. User-Points-Music Model
3.1. Music Recommendation Structure
Compared with the traditional “User-Music” recommendation mode, to more accurately obtain the types of music are users interested in, this paper designs a “User-Points of Interest-Music” recommendation framework to extract users’ potential multiple points of interest and recommend high-quality music under this point of interest. Instead of single music, music recommendation using interest points composed of multiple pieces of music can achieve a more stable recommendation effect.
Input. There are hundreds of millions of users in the experimental platform. We have sampled 100,000 users as experimental objects and extracted the user’s music consumption behavior. The information of this behavior includes consumption time, consumption type, and music labels, and the data are after desensitization and encoding.
First Step: User-Music modeling. As shown in Figure 1, according to the user’s historical behavior of music, a “User-Music” rating function is designed to represent the user’s liking degree for music. It is aggregated by the user as the dimension to get the music scoring list of each user.
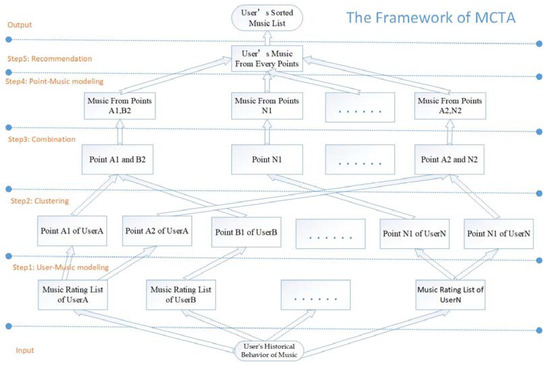
Figure 1.
The implementation process of “User-Points-Music” model.
Second Step: Clustering. To extract potential interest points from the user’s music list, it is necessary to cluster them. Each cluster represents a user’s interest point, and a “User-Points of Interest” rating function is designed to represent the user’s preference in each interest point. When expressing music in vectorization, directly using music tags will make the music matrix sparse. Sending the user’s music list into the W2V model to obtain hidden features can alleviate this problem to a great extent.
Third Step: Combination. To reduce the computational complexity, before recommending music according to the user’s interest points, we cluster the interest points of all users, merge similar interest points, find the interest points of other users similar to each interest point of the target user, and the music list of similar users.
Fourth Step: Point-Music modeling. To find the highest quality music under each point of interest, a rating function of “Points of Interest-Music” is designed.
Fifth Step: Recommendation. In the previous steps, we obtained the results of “User-Point” and “Point-Music” from Step 2 and Step 4, respectively. With this information, we can achieve our final goal “User-Music” to make recommendations.
Output. In the recommendation list, it is sorted in descending order according to the scoring results, and the top N music will be pushed to users. In addition, the user’s score for music will change with the user’s behavior.
3.2. Multi-Interest Modeling
For clustering the historical consumption music of each user to obtain the user’s interest points, the following issues need to be considered: (1) Users’ consumed music lists are of different lengths (2) Short historical music list for inactive users (3) The number of interest points of each user is different (4) The clustering speed should be fast enough to meet the online update requirements of the recommendation system. As far as we know, there is no suitable clustering algorithm to solve the above-mentioned problems, and a music clustering model is proposed here.
3.2.1. “User-Music” Implicit Rating Matrix Construction
In order to obtain the preference of each user for each point of interest, it is necessary to calculate the user’s score for all music under this point of interest, but the user will not take the initiative to score the consumed music, and a scoring function is designed according to the user’s music consumption behavior. The positive feedback behavior of users on music mainly includes: collection, download, and full playback counts, while the negative feedback behavior mainly considers “cancel collection”, and the scoring model is given by
In this equation, WL, WD, and WP represent the weight of collection behavior, download behavior, and play behavior respectively, and WL, WD, WP belong to [0, 1]. Like(Ui, Mj), Download(Ui, Mj), DisLike(Ui,Mj) indicates whether the collection, download and cancel collection behaviors have occurred. The value is 1 when the behavior occurs, otherwise it is 0. Play(Ui, Mj) represents the number of times the user plays the music fully. From this function, it can be seen that the score of the music will drop sharply in case of canceling the collection.
3.2.2. The Structure of Word2Vector
At present, researchers mainly use labels and audio content as the characteristics of music. There are usually only three to five music tags, and directly using these tags to calculate the similarity between pieces of music will lead to a very serious problem of data sparsity. On the other hand, the audio discrimination between most music is not so high, resulting in poor personalized effect of recommendation results. Here, the music list of each user is regarded as a document, and the music is regarded as words in the document. Extracting the embedding feature of music with the help of neural network model word2vec can supremely alleviate the problem of data sparsity, enhance the difference between music, and have stronger expression ability [30].
Word2vec is a three-layer neural network model, which transforms words into word vectors by training the network, and the word vector contains rich user-context behavior information. The specific structure of the model is shown in Figure 2.
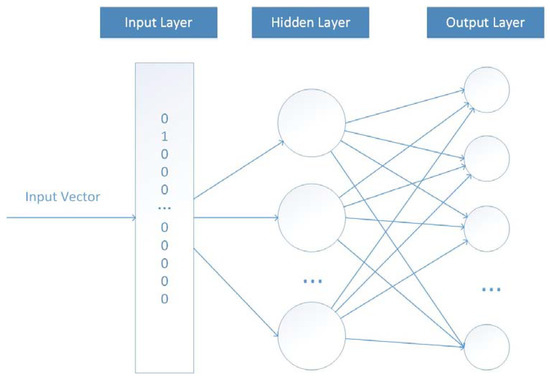
Figure 2.
The structure of word2vec model.
In Figure 2, the number of neurons in the input layer and output layer is the thesaurus length V, the thesaurus here refers to the music library composed of all users’ historical consumption music. For the input vector, only Xi equals 1, and the other values are 0, indicating that the input sample represents the ith music Mi in the music library. The number of hidden layer neurons is n, which means that we want to use n-dimensional vector to represent the embedding characteristics of music. The model adopts the full connection mode and uses the input-output identity function as the activation function. The weight matrix Wv*n is the ultimate goal of our model training. Finally, the model uses the soft-max function to smooth the output results.
CBOW and skip gram mode can be selected when constructing training samples. For users Ui = {Mi1,Mi2,Mi(k−L)…Mik…Mi(k+L)..Mio} with a music list length O, the model considers that the music Mik in the list is related to the previous and subsequent music within the window size L. CBOW algorithm takes {Ui − Mik} as input and Mik as output, while the skip gram algorithm is the opposite. After the training, the weight matrix Wv*n from the input layer to the hidden layer in the model is extracted as the n-dimensional feature matrix of V music. This paper sorts the user’s music list in chronological order to recommend the music that users may like next, and CBOW mode is selected for W2V model training.
3.2.3. Clustering for User Multi-Interest
Different types of music are distributed in the user’s music list. In this paper, the music types are divided by clustering. Each cluster represents a music type, that is, the user’s interest point. Common clustering algorithms include the simple clustering model represented by K-means and complex clustering model represented by DBSCAN. The K-means model needs to set the number of categories in advance, but the number of interest points of each user is different. In addition, the music list of each user is short, the effect of some complex models is not ideal, and when the number of users is large, the time complexity is relatively high, which cannot meet the real-time requirements of users.
The single channel clustering algorithm only needs to set a unified similarity threshold to complete the clustering work, and it can achieve good results when the number of samples is small. It is more suitable for clustering users’ music lists. In the traditional single channel method, the clustering results will change with the sample input order, the clustering results are unstable, and the clustering time is long when there are a large number of users. Based on this, a distributed single-channel clustering algorithm is proposed as follows:
Step 1 Cluster initialization. For user Ui, the music list Mi = {Mi1,Mi2..Mik..Mio}, where Mik = {Mik1,Mik2..Mikm..Mikn}, and n is the length of feature vector in W2V model. Each sample is regarded as a separate cluster, and c clusters Ci = {Ci1,Ci2..Cik..Cic} are obtained, and the cluster center is represented by a music vector. The length of each user’s music list is different, and the number of clusters is also different.
The cluster center Cik for the k-th cluster of user Ui is equal to:
where Ck represents the music set corresponding to cluster K under user Ui, and Mij is the vector corresponding to the j-th music under the cluster.
Step 2 Cluster growth. For each cluster Cik, calculate the similarity Sim(Cik,Mij) between all samples outside the cluster and the cluster center, where Mij belongs to {Mi − Cik}. When Sim(Cik,Mij) > sim_thread, add sample Mij to cluster Cik. Sim_thread is the threshold set in advance, and the reasonable value range of sim_thread is [0.8,0.9]. Here, the cluster is used as the dimension for calculation, and a sample can be added to multiple clusters. After Cik traverses all samples, update the cluster center.
Step 3 Distributed computing. The above steps are faster in clustering a user’s music list. However, when the user scale is large, it still takes a long time to calculate the clusters of each user one by one. Using spark big data platform for calculation can calculate a large number of users at the same time, which greatly improves the calculation efficiency.
Step 4 Denoising. Listeners often try new songs, most of which do not meet the user’s taste, but will still be kept in the user’s historical listening list. In addition, there are very few special pieces of music, and it is difficult to find similar content. To improve the accuracy of the recommendation and reduce the amount of subsequent calculation, the above two types of interest points need to be deleted.
Through the above steps, the historical music list of each user can be quickly divided into different numbers of clusters. Each cluster represents a user’s interest point, and the number of interest points of each user is different. The cluster model need not to set the number of clusters in advance, and it still works well for the inactive user and niche music.
3.2.4. Mixed Similarity Evaluation Index
This paper proposes a clustering model to obtain users’ interest points, and the similarity calculation method between music plays a very important role in clustering effect. In addition, the existing similarity calculation indicators cannot measure the similarity between users’ music consumption behaviors well. When calculating the similarity, the common evaluation indexes are cosine similarity coefficient and Pearson correlation coefficient. In this paper, the W2V model is used to extract the music feature vector, comparing the similarity based on these vectors. Cosine similarity mainly reflects the similarity of users’ behavior, which is more suitable for this paper. W2v cannot handle unpopular music well, resulting in inaccurate extracted music features, and Pearson correlation coefficient mainly reflects the linear relationship between vectors, without considering user behavior. To better measure the similarity between vectors, a mixed similarity evaluation index is proposed. Thereby, we have
where TU represents the length of the list of users who like this music, TMi and TMj are the truncated values of Mi and Mj, respectively. When the corresponding value of the vector is greater than the threshold, it will be converted to 1, otherwise 0. Simcos(Mi,Mj) and Simp(Mi,Mj) are defined as follows:
3.3. Time Decay Modeling
To measure the user’s liking degree for each point of interest, a scoring model of each point of interest is designed, and the user’s score of each point of interest will change over time. In the same period, the higher the user’s liking degree for a point of interest, the slower the attenuation speed. According to the number of music, music score, and recent behavior time corresponding to each point of interest, the attenuation model can be expressed as:
where Pi represents the music list of user U with interest point i, and λi is the interest attenuation parameter, which is equal to:
Through the above definition, the attenuation speed of interest points with higher liking degree is relatively slow. λ in (7) represents the attenuation velocity with (0,1) boundary.
The attenuation algorithm slows down the decay rate of interest points the user prefers and speeds up the decay rate of interest points that users do not like very much in the same time window. In addition, the niche music that is often consumed recently by people is recommended to more users, mitigating the Matthew effect of the system.
3.4. Music Recommendation Based on Muti-Interest Points
After obtaining the rating matrix of “User-Point”, the next step is obtaining the rating matrix of music under each point of interest “Point-Music”, and finally realizing the recommendation of “User-Music”.
3.4.1. Merging of Interest Points
Each user has multiple points of interest. When the user scale is relatively large, recommending music directly based on all similar points of interest requires high computing performance. Considering the possibility of similarity between points of interest, the points of interest referring to the clustering algorithm proposed in Chapter 3 are clustered. This realizes the combination of points of interest and reduces the number of points of interest. When the similarity of the two points of interest is greater than the threshold, the music corresponding to the two points of interest is combined to form a larger point of interest. Different from the music clustering algorithms, a point of interest can only be merged once.
In reality, some music has obvious particularities, and it is difficult to find similar music. Therefore, the number of samples of these music clusters is small. To further reduce the number of interest points, clusters with less than the threshold number of samples in the cluster are removed directly.
3.4.2. Music Recommendation
Obtaining interest points similar to each interest point of the target user. For the interest points Ci = {Ci1,Ci2..Cik..Cio} of user Ui and the interest point set P = {P1,P2..Ph..Pm} composed of other users, the similarity between user interest point Cik and other interest points Ph is defined as follows:
where N represents the vector length, Ciks and Phs are the s-dimensional value of clusters and points of interest, respectively.
After finding similar interest points, it is also necessary to calculate the popularity of each piece of music under the interest points. The specific definition is shown in (9):
where UN indicates the number of users scoring the music. According to the above formula, the score of music depends on the liking degree of other users and the number of users participating in voting. The more users participate and the higher the degree of user liking, the higher the quality of the music under the point of interest.
Recommending music Mj to the target user Ui on the timeline t. Combined with the “user-point” rating function, interest point similarity function and “point-music” rating function proposed in this paper, the user music recommendation model is proposed as follows:
where Pc represents the c-th interest point set of user Ui, Ph represents the h-th interest point composed of all users, and t is the last behavior time of user Ui. For each interest point of Ui, calculate the similarity with all points of interest to find the most similar point of interest to the user. Combined with the quality score of music under each interest point, the user can get the most popular music list under multiple interest points, and finally recommend it in the way of topN.
4. Experimental Framework and Setup
To verify the effectiveness of the music recommendation model, Kugou Music, a large domestic music company with more than 100 million users, is selected as the test platform, and 100,000 active users are sampled for experiments. In addition, the music recommendation model, MCTA, proposed in this paper is compared with MTS [26], CF [18], EUE [29], and popular algorithms in the literature.
For MTS, after extracting the label information of music, the author sends it to the LDA model to obtain the membership of music to potential topics. Then, the user’s last 30, 50, and 100 pieces of music represent the user’s long-term, medium-term and short-term behavior, respectively, use LSTM for training, and finally fuse the behaviors of the three time periods by taking the average value.
Ref. [18] finds the candidate user group most similar to the target user with user-base CF algorithm, and then uses the item-base CF algorithm to get the music most similar to the candidate user’s music for recommendation.
The approach in [29] includes two steps: pre-processing and prediction. In the preprocessing stage, all the music clips that users listen to in a certain time window and the microblog published by users are extracted, and then they analyze the emotional characteristics of the microblog published, and then form a historical association between users, music clips and emotions. In the prediction phase, they obtain the current emotions of users, and then recommend music projects suitable for their emotional background.
To display the performance of each model more intuitively, the popularity recommended model is added to compare, which counts the number of times each piece of music appears among all users and selects the top music for recommendation in descending order.
The user’s behavior towards single pieces of music is not enough to reflect the user’s preference for similar music. The model proposed in this paper clusters the user’s music list, and each cluster contains multiple music of the same type, which can represent the user’s points of interest better.
4.1. Metrics
The model recommendation performance is mainly evaluated by accuracy metrics such as precision and recall. The specific definitions are shown in (11) and (12):
where K is the recommended length. When the user Ui has carried out positive feedback behavior on music Mj, g (Ui, Mj) = 1, and the positive feedback behavior includes: collection, download, and full play. When the precision is high, it means that the music recommended by the model is more in line with the user’s taste. Then, the recall of Ui is expressed as follows:
where N represents the length of the user’s favorite music list. When recommending for users, it is needed to recommend all potential favorite music of users as much as possible, besides the accuracy of the model. The higher the recall value, the better the recommendation performance.
For models A and B, if the precision of model A is higher and the recall of model B is higher, it is hard to tell which model is better. Therefore, it is necessary to introduce the F1 evaluation index, which is determined as
when the precision and recall metrics of model A are higher than those of model B, the corresponding F1 value will be higher, which proves that the recommendation accuracy of model A is better than that of model B.
The long tail-distribution generally exists in the recommendation system of various application scenarios. The more popular music is, the easier it is to be recommended. The unpopular music with the largest size of music in the music library can hardly be exposed. When comparing the models, the recommended coverage should also be considered. The specific definition is as follows:
where M represents all music sets in the data set, U represents the user set, and R (u) represents the music list with length n recommended to user u. The higher the coverage, the more popular music is recommended, to improve the exposure of popular music and better alleviate the Matthew effect in the system.
4.2. Datasets
In cooperation with “Kugou music”, a large domestic music company, the music consumption behavior data of 99,986 users in one recent year are obtained. The user and music information are desensitized and do not involve user privacy and business information. The experimental data consist of two parts: (1) The user’s action type and time, in which the action types include: collection, download, complete play, and cancel collection; (2) The label corresponding to the music. Considering the randomness and low reliability of users’ labeling of music, the music library label customized by the staff of the music company is adopted.
4.3. Settings
W2V model is used to extract music features. The main parameters of the model are word frequency threshold min_count, eigenvector dimension size, neighbor range window. Comprehensively considering the calculation complexity and model performance, set min_count = 5, window = 5, and the value of size is determined according to the F1 value of the test set.
When the feature dimension is high, the music can be better represented, but the complexity of computing will be improved accordingly. In Table 1, when the size is near 110, the improvement of recommendation performance is not obvious, so set size = 110.

Table 1.
F1-value of different vector sizes.
Besides the W2V model, Fasttext and Glove are mostly used to extract the word vectors. To verify the effectiveness of the W2V model in the system, a comparison experiment is carried out to make recommendations for users in the same dataset, using these three models separately. The experiment result is as follows:
Through comparison from Table 2, it is found that the recommendation performance based on the W2V model is obviously better than Fasttext and Glove. Therefore, the system adapts the W2V model to acquire the implicit feature of music.
Table 2.
F1-value of different models to extract the word vectors.
The effect of the clustering model proposed in this paper has a lot to do with the setting of similarity threshold parameter sim_thread. According to experience, the value range is [0.8, 0.9], when sim_thread < 0.8, users or song with low similarity will be summarized into the same cluster; when sim_thread > 0.9, each cluster has fewer users or music samples and more clusters.
As illustrated in Table 3, when sim_thread = 0.86, similar music can be gathered into a cluster, and when the number of clusters is controlled within a reasonable range, the recommendation performance of the model is relatively good, so the similarity threshold is set to 0.86.
Table 3.
F1-value of different similarity threads.
The user’s interest points will change over time, and the interest points with higher liking degree will decay more slowly. To determine the value of attenuation coefficient λ in formula (7), on the basis of formula (6), excluding the factors unrelated to the attenuation coefficient and the number of points of interest, formula (15) is proposed as follows:
The experiment is designed to determine the attenuation coefficient by calculating the half-life. For user Ui, the length of the music list is 100. There are two interest points, A and B, and the corresponding number of pieces of music is 80 and 20, respectively. Where A represents the interest points preferred by the user. The experimental results are shown in Table 4.
Table 4.
Half-lives of different points of interest.
It can be seen from Table 3 that when the attenuation coefficient is 0.003, the half-life of the user’s preferred interest A is 184 days, that is, if the user has no action on the music under the interest point A in an average half year, it will make the user’s score of interest A attenuate to half of the original. Similarly, the half-life of the user’s interest point B is 46 days, about one and a half months, which is more in line with the actual situation, so the attenuation coefficient λ = 0.003.
4.4. Results
This paper uses the word2vec model to extract music features. For music liked by more users, the training effect is better, but for unpopular music, the accuracy of the extracted feature vector is not high. When calculating music similarity, this paper comprehensively considers the popular cosine similarity and correlation coefficient Pearson and proposes a hybrid similarity calculation model, Fusion. The recommended performance of each similarity calculation method is shown in Table 5.
Table 5.
F1-value of different similarity calculation methods.
Through comparison, it is found that the recommendation performance based on cosine similarity calculation method is significantly better than Pearson, and the hybrid similarity calculation method, Fusion, proposed in this paper can better recommend music
According to the model parameters obtained in the former section and the hybrid similarity calculation method, Fusion, a recommendation model, MCTA, is proposed to recommend music for users. To verify the effectiveness of the MCTA model, experimental comparisons are made with accuracy and coverage metrics, respectively. Accuracy metrics include precision, recall, and F1-value.
Figure 3 shows that the MCTA model proposed in this paper is superior to the other three comparison models in terms of precision. Users will audition after receiving the recommendation results. The concert they hear first greatly affects users’ satisfaction with the whole recommendation system and directly determines whether users continue to audition for the subsequent recommendation results. The model, MCTA, proposed in this paper has more obvious advantages when the recommendation length k ≤ 5, which shows that the model can give users a higher consumption experience at the initial stage of audition and give users a higher desire to try for subsequent audition behavior.
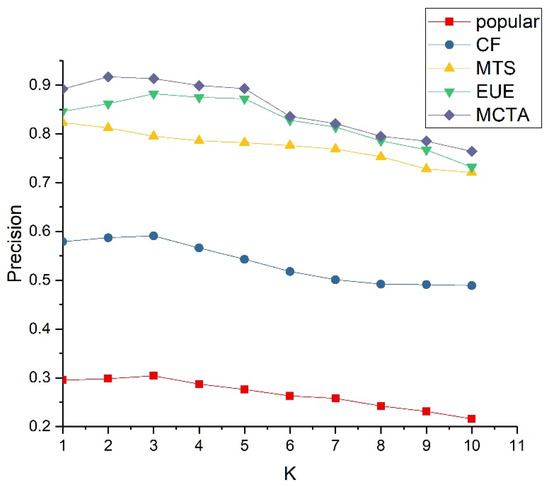
Figure 3.
Model precision result.
According to formula (12), the recall rate of the model is compared, and the experimental result is shown in Figure 4.
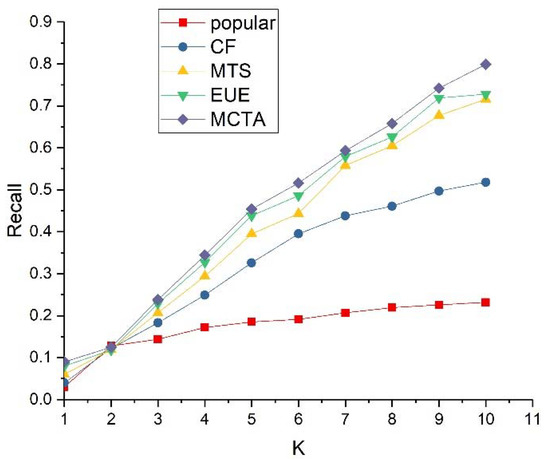
Figure 4.
Model recall result.
As shown in Figure 4, MCTA, the model proposed in this paper, is superior to other comparison models in terms of recall rate. According to the definition of formula (12), with the increase of the recommended length k, the denominator remains unchanged, but more music will be hit, resulting in the increase of molecules. Therefore, the recall rate of all models continues to rise. When k ≤ 2, the recall rate of the popular model is basically the same as that of other models, indicating that the two most popular pieces of music are suitable for most users.
The advantages and disadvantages of the model cannot be determined by using the precision or recall rate alone. The F1-value metric defined in formula (13) is used to compare the model.
We can obtain the conclusion from Figure 5 that the MCTA model in this paper is superior to other comparison models in F1-value. The experimental results corresponding to the comprehensive precision and recall rate are shown in Figure 3 and Figure 4. When the recommendation length continues to increase, the recall rate of the model shows an upward trend, while the accuracy rate is on the contrary, but the growth speed of the recall rate is greater than the decline speed of the precision, resulting in the continuous improvement of the F1 value.
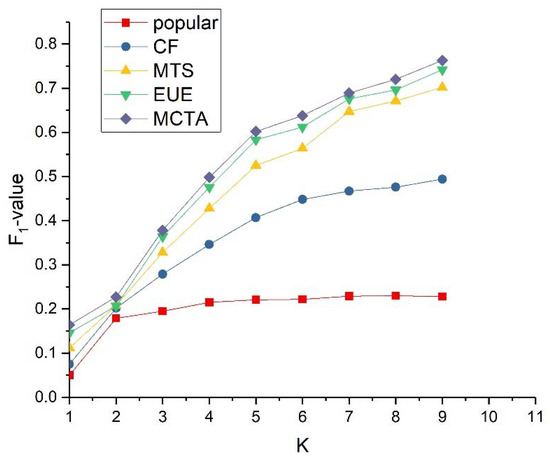
Figure 5.
Model F1 result.
The test results in Figure 3, Figure 4 and Figure 5 show that, compared with the existing music recommendation models, the MCTA model in this paper has significant advantages in recommendation accuracy. For the model EUE, MTS and CF, the traditional “User-Music” recommendation mode is still adopted, and each music of the user is calculated as an independent individual. The “User-Point-Music” recommendation mode proposed in this paper divides the user’s favorite list into multiple clusters by our clustering model. Each cluster represents a user’s point of interest. Finally, determine the high-quality music liked by most people in each point of interest for recommendation. This recommendation mode can find the potential behavior law of users in music consumption and realize more accurate music recommendation.
MCTA remodels the traditional “User-Music” recommendation model into “User-Points of Interest-Music”. Compared with the recommendation of a single piece of music, the recommendation based on the points of interest composed of multiple pieces of music will be more accurate. In addition, users’ interests will change over time. The interest point time decay model proposed in this paper can more accurately predict users’ current preferences.
An excellent recommendation system needs to accurately push music for users, but if the system wants to develop healthily and stably, it must ensure that unpopular music can also be exposed. According to (14), the coverage of the model is compared, and the experimental result is shown in Figure 6.
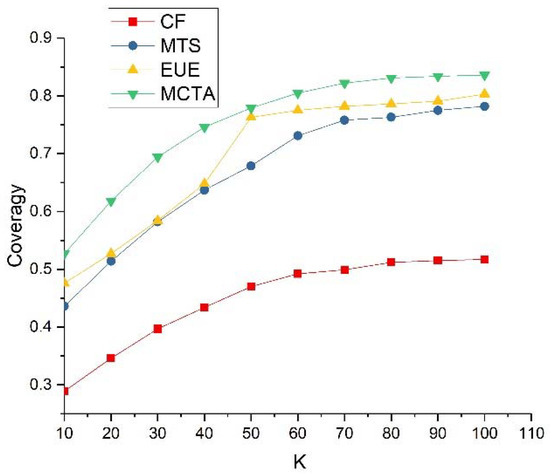
Figure 6.
Model coverage value result.
We can see it from Figure 6 that MCTA, the model proposed in this paper, is superior to other comparison models in terms of coverage. With the increase of the recommended length K, more music will be recommended, the numerator in formula (14) becomes larger, while the denominator remains unchanged, resulting in the continuous increase of coverage.
The popular model recommends the same music for all users with very low coverage and does not participate in model comparison; the CF model calculates the similarity through the cooccurrence times of music A and music B and the popularity of music. For many popular pieces of music, it hardly appears at the same time as other music, making the similarity 0, so it will not be recommended, making the coverage of the CF model low; the MTS model obtains the music theme vector through the LDA model and predicts the user’s preference probability for candidate music through the LSTM neural network model. Compared with the MCTA model proposed in this paper, this method cannot deal with popular music well, resulting in low coverage; by introducing information from other platforms, the EUE model can help alleviate the cold-start problem of the music recommendation system and improve the coverage of the system, so the recommendation effect is better than the MTS model and the CF model.
The clustering model proposed in this paper can obtain users’ interest points composed of niche music, and according to this interest point, combined with the cascade model of “User-Points of Interest-Music”, it can recommend other niche music of this type for users, improving coverage of the recommendation system. The MCTA model, firstly, a kind of unpopular music in the user list is formed into a cluster CA, and then the music of all users is clustered again to obtain the cluster set C. Finally, the cluster most similar to cluster CA is found in set C for music recommendation, so that all kinds of unpopular music in cluster set C can be recommended, so the coverage of the MCTA model is higher.
5. Conclusions and Future Work
Compared with the traditional “User-Music” recommendation mode, this paper proposes a music recommendation model, MCTA, based on “User-Point-Music” mode. Multiple user interest points are obtained through the distributed clustering algorithm PSP based on a single pass method, and the similarity between samples is calculated by mixed similarity. Finally, the “User-Music” rating model, the interest point attenuation model, and the “Point-Music” rating model are used for topN recommendation. The results show that the proposed MCTA music recommendation model is superior to other comparison models in terms of accuracy and coverage metrics. The next work will focus on solving the mixed similarity optimization problem and consider whether many similarity coefficients can be integrated to better measure the similarity between music.
Author Contributions
Conceptualization, T.W. and J.L.; methodology, T.W.; software, J.Z.; validation, Y.G.; formal analysis, M.L. and Y.G.; investigation, J.Z., M.L. and Y.G.; resources, M.L.; data curation, T.W.; writing—original draft preparation, T.W.; writing—review and editing, J.L.; visualization, J.Z.; supervision, J.L.; project administration, Y.G.; funding acquisition, J.Z. All authors have read and agreed to the published version of the manuscript.
Funding
This research was funded by the National Natural Science Foundation of China under Grant Nos. 61862051 and 62262055; the Science and Technology Foundation of Guizhou Province under Grant No. [2019]1447; the Nature Science Foundation of educational department under Grant Nos. [2022]100; the Nature Science Foundation of Qiannan Normal University for Nationalities under Grant Nos. 2020qnsyzd03 and QNSYRC201714.
Data Availability Statement
The data used to support the findings of this study are available from the corresponding author upon request.
Conflicts of Interest
The authors declare no conflict of interest.
References
- Elbouchikhi, E.; Choqueuse, V.; Benbouzid, M. Induction machine bearing faults detection based on a multi-dimensional MUSIC algorithm and maximum likelihood estimation. Isa Trans. 2016, 63, 413–424. [Google Scholar] [CrossRef] [PubMed]
- Eken, S. An exploratory teaching program in big data analysis for undergraduate students. J. Ambient. Intell. Humaniz. Comput. 2020, 11, 4285–4304. [Google Scholar] [CrossRef]
- Yang, Z.; Li, Z.; Zhu, J.; Feng, G.; Wang, Q.; Hu, J.; Wang, C. Deriving time-series three-dimensional displacements of mining areas from a single-geometry InSAR dataset. J. Geod. 2018, 92, 529–544. [Google Scholar] [CrossRef]
- Galety, M.G.; Thiagarajan, R.; Sangeetha, R.; Vignesh, L.K.B.; Arun, S.; Krishnamoorthy, R. Personalized Music Recommendation model based on Machine Learning. In Proceedings of the 2022 8th International Conference on Smart Structures and Systems (ICSSS), Chennai, India, 21–22 April 2022; pp. 1–6. [Google Scholar]
- Afchar, D.; Melchiorre, A.B.; Schedl, M.; Hennequin, R.; Epure, E.V.; Moussallam, M. Explainability in Music Recommender Systems. arXiv 2022, arXiv:2201.10528. [Google Scholar] [CrossRef]
- Sarin, E.; Vashishtha, S.; Megha; Kaur, S. SentiSpotMusic: A music recommendation system based on sentiment analysis. In Proceedings of the 2021 4th International Conference on Recent Trends in Computer Science and Technology (ICRTCST), 2022, Jamshedpur, India, 11–12 February 2022; pp. 373–378. [Google Scholar]
- Kodama, Y.; Gayama, S.; Suzuki, Y.; Odagawa, S.; Shioda, T.; Matsushita, F.; Tabata, T. A music recommendation system. In Proceedings of the 2005 Digest of Technical Papers. International Conference on Consumer Electronics, Las Vegas, NV, USA, 8–12 January 2005; pp. 219–220. [Google Scholar]
- Deldjoo, Y.; Schedl, M.; Knees, P. Content-driven Music Recommendation: Evolution, State of the Art, and Challenges. arXiv 2021, arXiv:2107.11803. [Google Scholar]
- Jun, S.; Kim, D.; Jeon, M.; Rho, S.; Hwang, E. Social mix: Automatic music recommendation and mixing scheme based on social network analysis. J. Supercomput. 2015, 71, 1933–1954. [Google Scholar] [CrossRef]
- Asharaf, S.; Murty, M.N. An adaptive rough fuzzy single pass algorithm for clustering large data sets. Pattern Recognit. 2003, 36, 3015–3018. [Google Scholar] [CrossRef]
- Briot, J.P. Deep Learning Techniques for Music Generation; Springer: Berlin/Heidelberg, Germany, 2019. [Google Scholar]
- Aydin, L.; Karakose, M.; Akin, E. A new method for time series classification using multi-dimensional phase space and a statistical control chart. Neural Comput. Appl. 2020, 32, 7439–7453. [Google Scholar] [CrossRef]
- Kathari, S.; Tangirala, A.K. Scalar correlation functions for model structure selection in high-dimensional time-series modelling—ScienceDirect. Isa Trans. 2020, 100, 275–288. [Google Scholar] [CrossRef] [PubMed]
- Carlos, C.H. A hybrid recommender system for finding relevant users in open source forums. In Proceedings of the 2010 Third International Workshop on Managing Requirements Knowledge, Sydney, NSW, Australia, 27 September 2010; pp. 41–50. [Google Scholar]
- Sun, Y.; Bozdogan, H. Segmentation of High Dimensional Time-Series Data Using Mixture of Sparse Principal Component Regression Model with Information Complexity. Entropy 2020, 22, 1170. [Google Scholar] [CrossRef] [PubMed]
- Andres, F.; Dmitry, B.; Jisang, Y.; KwangSeob, K.; Xavier, S. Automatic playlist continuation using a hybrid recommender system combining features from text and audio. In Proceedings of the ACM Recommender Systems Challenge 2018, Vancouver, BC, Canada, 2 October 2018. [Google Scholar]
- Cheng, M.; Jing, L.; Ng, M.K. Tensor-Based Low-Dimensional Representation Learning for Multi-View Clustering. IEEE Trans. Image Process. 2019, 28, 2399–2414. [Google Scholar] [CrossRef] [PubMed]
- Sunitha, M.; Adilakshmi, T.; Benbouzid, M. Music Recommendation System with User-based and Item-based Collaborative Filtering Technique. In Lecture Notes on Data Engineering and Communications Technologies; Springer: Singapore, 2017; Volume 3. [Google Scholar]
- MacKintosh, S.B.; Serino, L.P.; Iddon, P.D.; Brown, R.; Conlan, R.S. A three-dimensional model of primary bovine endometrium using an electrospun scaffold. Biofabrication 2015, 7, 025010. [Google Scholar] [CrossRef] [PubMed]
- Hsu, Y.L.; Wang, J.S.; Chiang, W.C.; Chien, H. Automatic ECG-Based Emotion Recognition in Music Listening. IEEE Trans. Affect. Comput. 2020, 11, 85–99. [Google Scholar] [CrossRef]
- Shao, B.; Wang, D.; Li, T.; Ogihara, M. Music Recommendation Based on Acoustic Features and User Access Patterns. IEEE Trans. Audio Speech Lang. Process. 2009, 17, 1602–1611. [Google Scholar] [CrossRef]
- Wang, K.; Sadredini, E.; Skadron, K. Hierarchical Pattern Mining with the Automata Processor. Int. J. Parallel Program. 2018, 46, 376–411. [Google Scholar] [CrossRef]
- Zhao, F.; Ren, X.; Yang, S.; Han, Q.; Zhao, P. Latent Dirichlet Allocation Model Training with Differential Privacy. IEEE Trans. Inf. Forensics Secur. 2020, 16, 1290–1305. [Google Scholar] [CrossRef]
- Kinoshita, S.; Ogawa, T.; Haseyama, M. LDA-based music recommendation with CF-based similar user selection. In Proceedings of the 4th Global Conference on Consumer Electronics (GCCE 2015), Osaka, Japan, 27–30 October 2015; pp. 215–216. [Google Scholar]
- Kinoshita, S.; Ogawa, T.; Haseyama, M. Popular music estimation based on topic model using time information and audio features. In Proceedings of the 3rd Global Conference on Consumer Electronics (GCCE 2014), Tokyo, Japan, 7–10 October 2014; pp. 102–103. [Google Scholar]
- Shi, J. Music Recommendation Algorithm Based on Multidimensional Time-Series Model Analysis. Complexity 2021, 2021, 5579086. [Google Scholar] [CrossRef]
- Schedl, M.; Knees, P.; McFee, B.; Bogdanov, D. Music Recommendation Systems: Techniques Use Cases, and Challenges. In Recommender Systems Handbook; Ricci, F., Rokach, L., Shapira, B., Eds.; Springer: New York, NY, USA, 2022. [Google Scholar]
- Feng, L.; Tintarev, N. A Diversity Ajusting Strategy with Personality for Music Recommendation. In Proceedings of the 5th Joint Workshop on Interfaces and Human Decision Making for Recommender System, Vancouver, BC, Canada, 7 October 2018. [Google Scholar]
- Deng, S.; Wang, D.; Li, X.; Xu, G. Exploring user emotion in microblogs for music recommendation. Expert Syst. Appl. 2015, 42, 9284–9293. [Google Scholar] [CrossRef]
- Kse, B.; Eken, S.; Sayar, A. Playlist Generation via Vector Representation of Songs. In Proceedings of the INNS Conference on Big Data, Thessaloniki, Greece, 23–25 October 2016. [Google Scholar]
Publisher’s Note: MDPI stays neutral with regard to jurisdictional claims in published maps and institutional affiliations. |
© 2022 by the authors. Licensee MDPI, Basel, Switzerland. This article is an open access article distributed under the terms and conditions of the Creative Commons Attribution (CC BY) license (https://creativecommons.org/licenses/by/4.0/).